
Feed aggregator
Hubble Spies Faint Irregular Galaxy
Hubble Spies Faint Irregular Galaxy
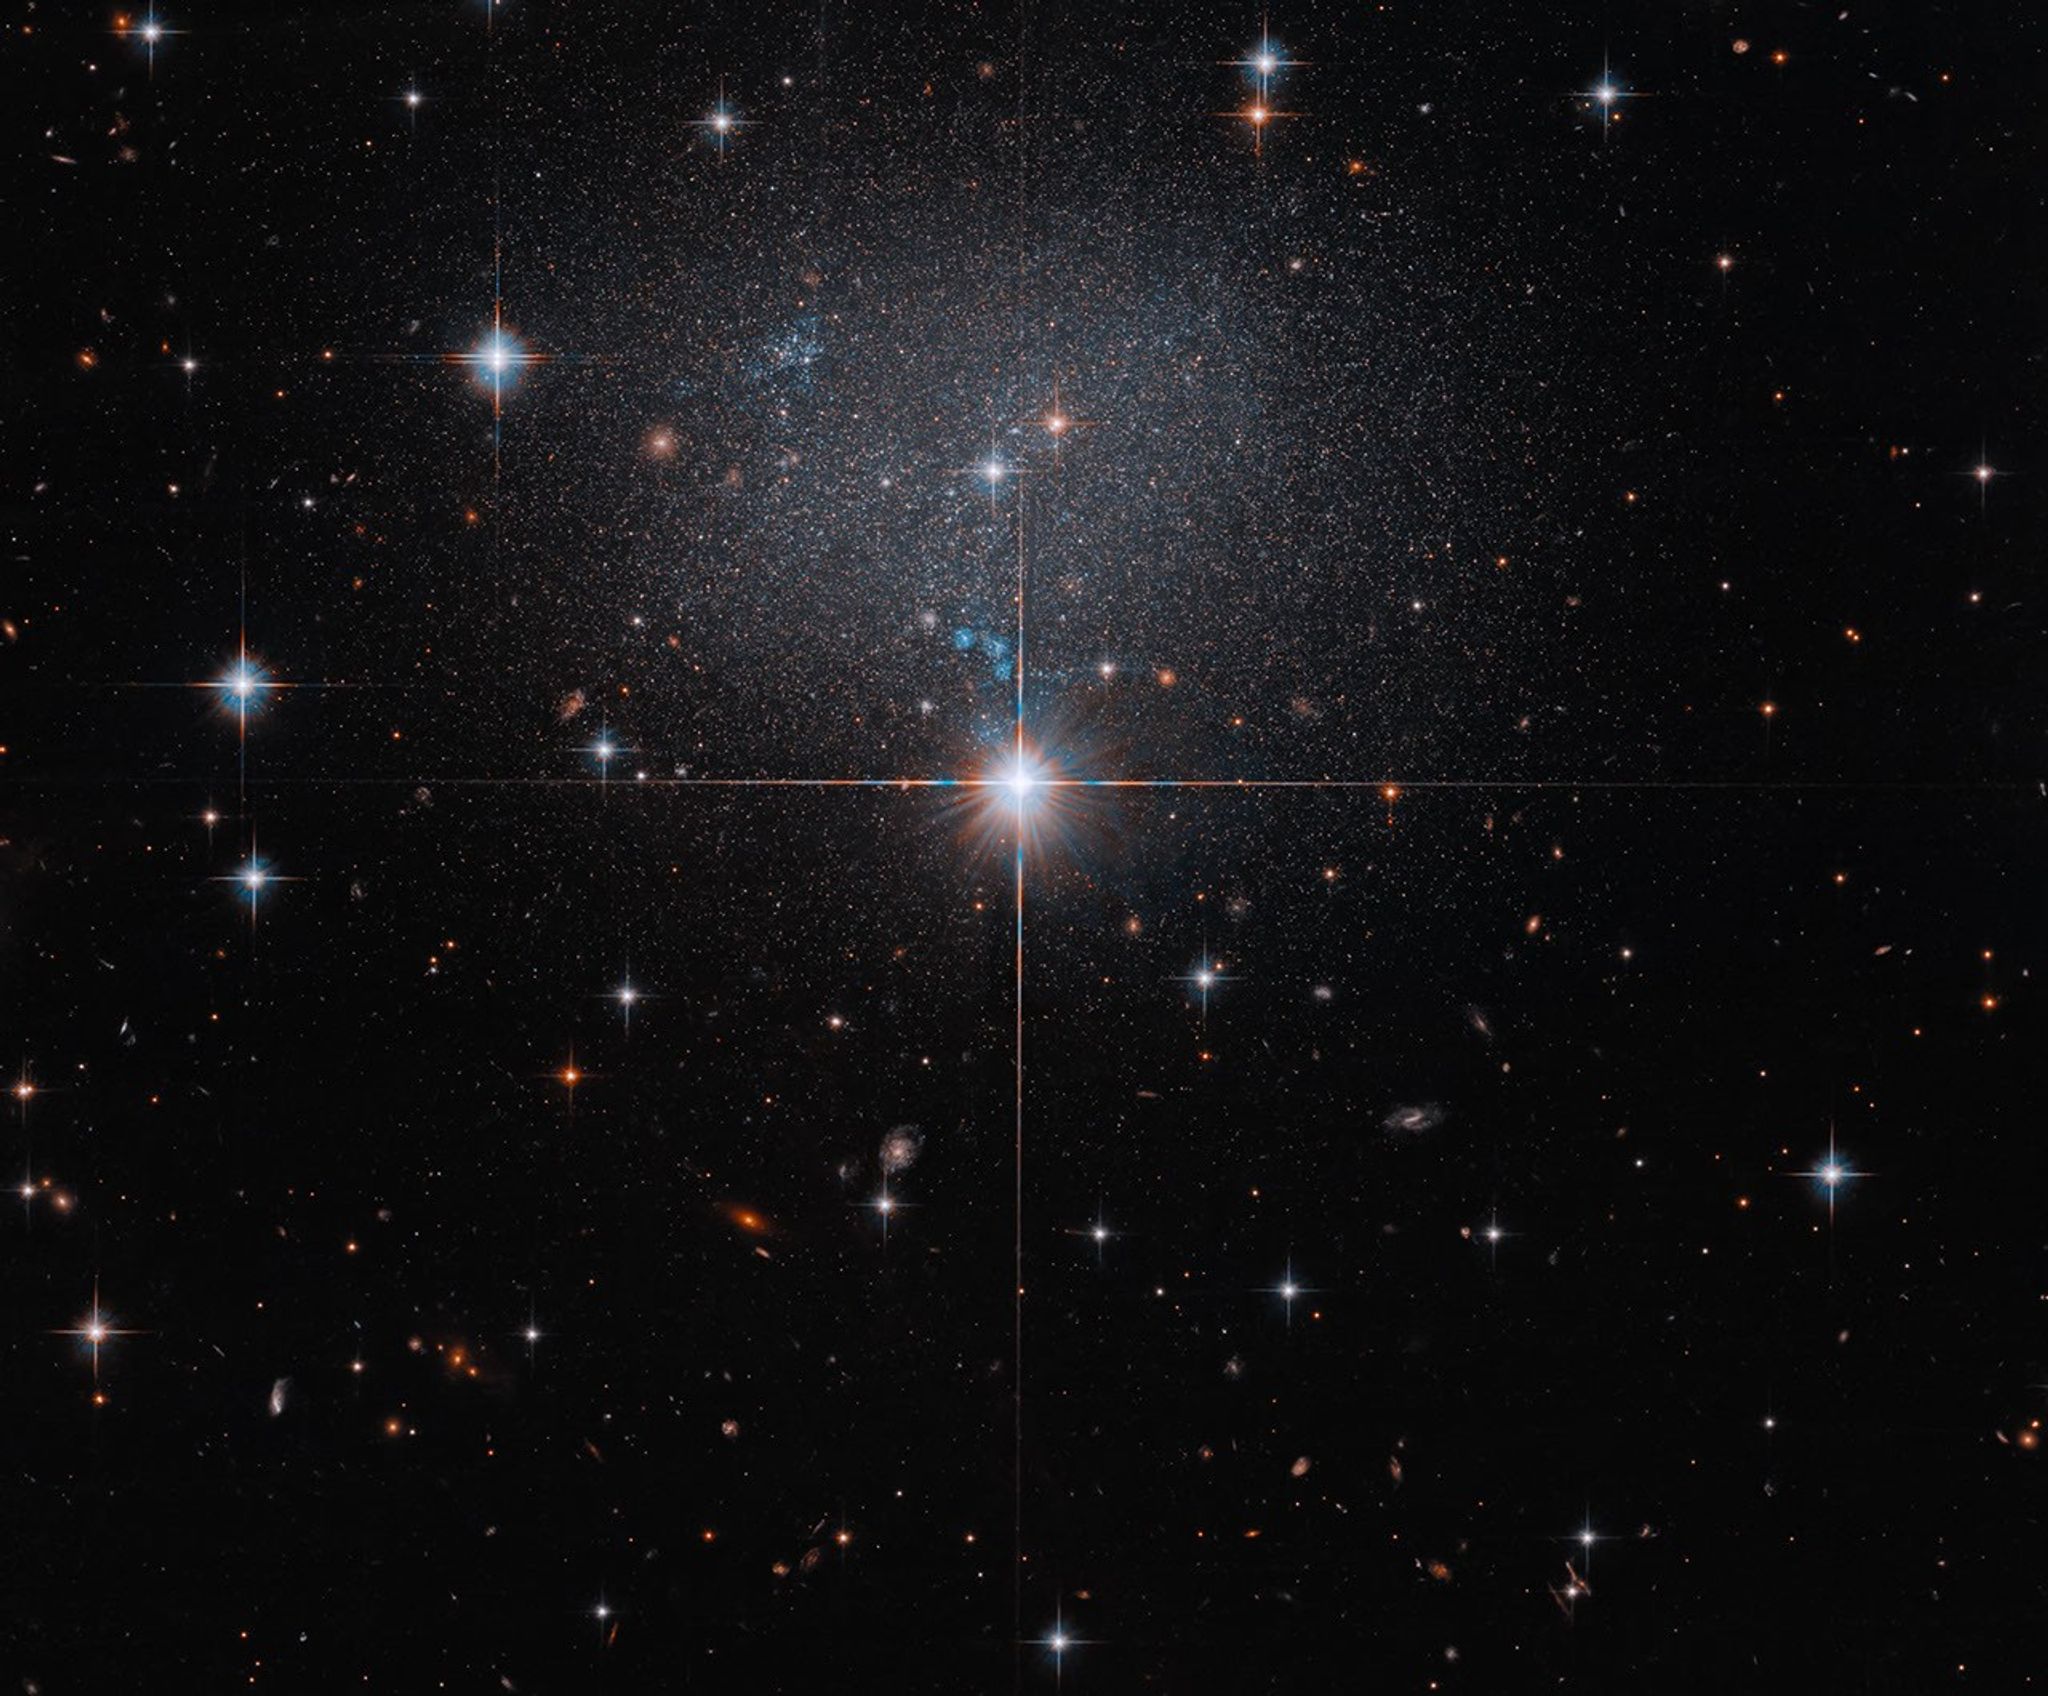
This NASA Hubble Space Telescope image released on May 27, 2026, features the dwarf irregular galaxy ESO 490-017, roughly 12,000 light-years in diameter and some 23 million light-years away in the constellation Canis Major. The galaxy’s low surface brightness makes it appear as a faint, starry swarm behind brighter foreground stars that are easily recognized by their diffraction spikes. Numerous red, orange, and beige dots are distant galaxies peppering the black background, many exhibiting distinct spiral structure.
The data in this image of ESO 490-017 was part of a Hubble observing program that looked at the movement of galaxies and galaxy clusters through space. Matter in the universe is distributed unevenly, and the gravitational influence of that matter drives the “cosmic flow” or movement of large-scale structures in the universe.
Image credit: NASA, ESA, R. Tully (University of Hawaii); Image Processing: G. Kober (NASA/Catholic University of America)
Hubble Spies Faint Irregular Galaxy
This NASA Hubble Space Telescope image released on May 27, 2026, features the dwarf irregular galaxy ESO 490-017, roughly 12,000 light-years in diameter and some 23 million light-years away in the constellation Canis Major. The galaxy’s low surface brightness makes it appear as a faint, starry swarm behind brighter foreground stars that are easily recognized by their diffraction spikes. Numerous red, orange, and beige dots are distant galaxies peppering the black background, many exhibiting distinct spiral structure.
The data in this image of ESO 490-017 was part of a Hubble observing program that looked at the movement of galaxies and galaxy clusters through space. Matter in the universe is distributed unevenly, and the gravitational influence of that matter drives the “cosmic flow” or movement of large-scale structures in the universe.
Image credit: NASA, ESA, R. Tully (University of Hawaii); Image Processing: G. Kober (NASA/Catholic University of America)
Evidence of Water Plumes from Jupiter's Moon Europa Vanishes
Reanalysis shows that the Hubble Space Telescope's detection of water vapor escaping from Jupiter’s moon Europa might have been a glitch.
The post Evidence of Water Plumes from Jupiter's Moon Europa Vanishes appeared first on Sky & Telescope.
Aim high but don't shoot for the moon, mathematicians advise
Aim high but don't shoot for the moon, mathematicians advise
This Month at ESA: May 2026
What did space deliver for Europe this month? From asteroid flybys to Mars landing tests, new discoveries from Webb and Hubble, and ESA astronaut Sophie Adenot capturing shooting stars from orbit, here’s your monthly roundup from the European Space Agency.
This month also saw ESA team up with DON’T NOD for Aphelion, a sci-fi adventure inspired by real space science and exploration.
Retatrutide results spark questions about how rapid weight loss affects the body
New-generation GLP-1 drugs, such as retatrutide, are achieving higher rates of weight loss. How much weight is too much and too fast to lose?
Blue Origin’s New Glenn rocket explodes in massive fireball, imperiling NASA moon missions
The latest flight of the New Glenn rocket was meant to prepare Blue Origin for a series of NASA-funded lunar voyages. Instead it ended before it began
Week in images: 25-29 May 2026
Week in images: 25-29 May 2026
Discover our week through the lens
Horror video game gets its creepiness from a quantum computer
Horror video game gets its creepiness from a quantum computer
Europe’s deadly spring heat wave is obliterating temperature records
Unseasonably hot weather in Europe has already claimed at least 18 lives. And history shows more are likely on the way
ESA Selects Two New Scout-Class Missions
When it comes to understanding Earth and our changing environment, space is the place. Not only does it give us an overall holistic view of the planet below, but satellite-based imagery can transcend national boundaries and give us an understanding of key changes that often go unseen at ground level. Now, the European Space Agency (ESA) has chosen two new missions to address key questions in Earth environmental science: Hibidis and SOVA-S.
We're becoming more individualistic and it's affecting our love lives
We're becoming more individualistic and it's affecting our love lives
Mirror life: Scientists clash over threat of lab-engineered bacteria
Mirror life: Scientists clash over threat of lab-engineered bacteria
Hubble Captures M88 on Journey to Center of Virgo Cluster
- Hubble Home
- Overview
- Impact & Benefits
- Science
- Observatory
- Team
- Multimedia
- News
- More
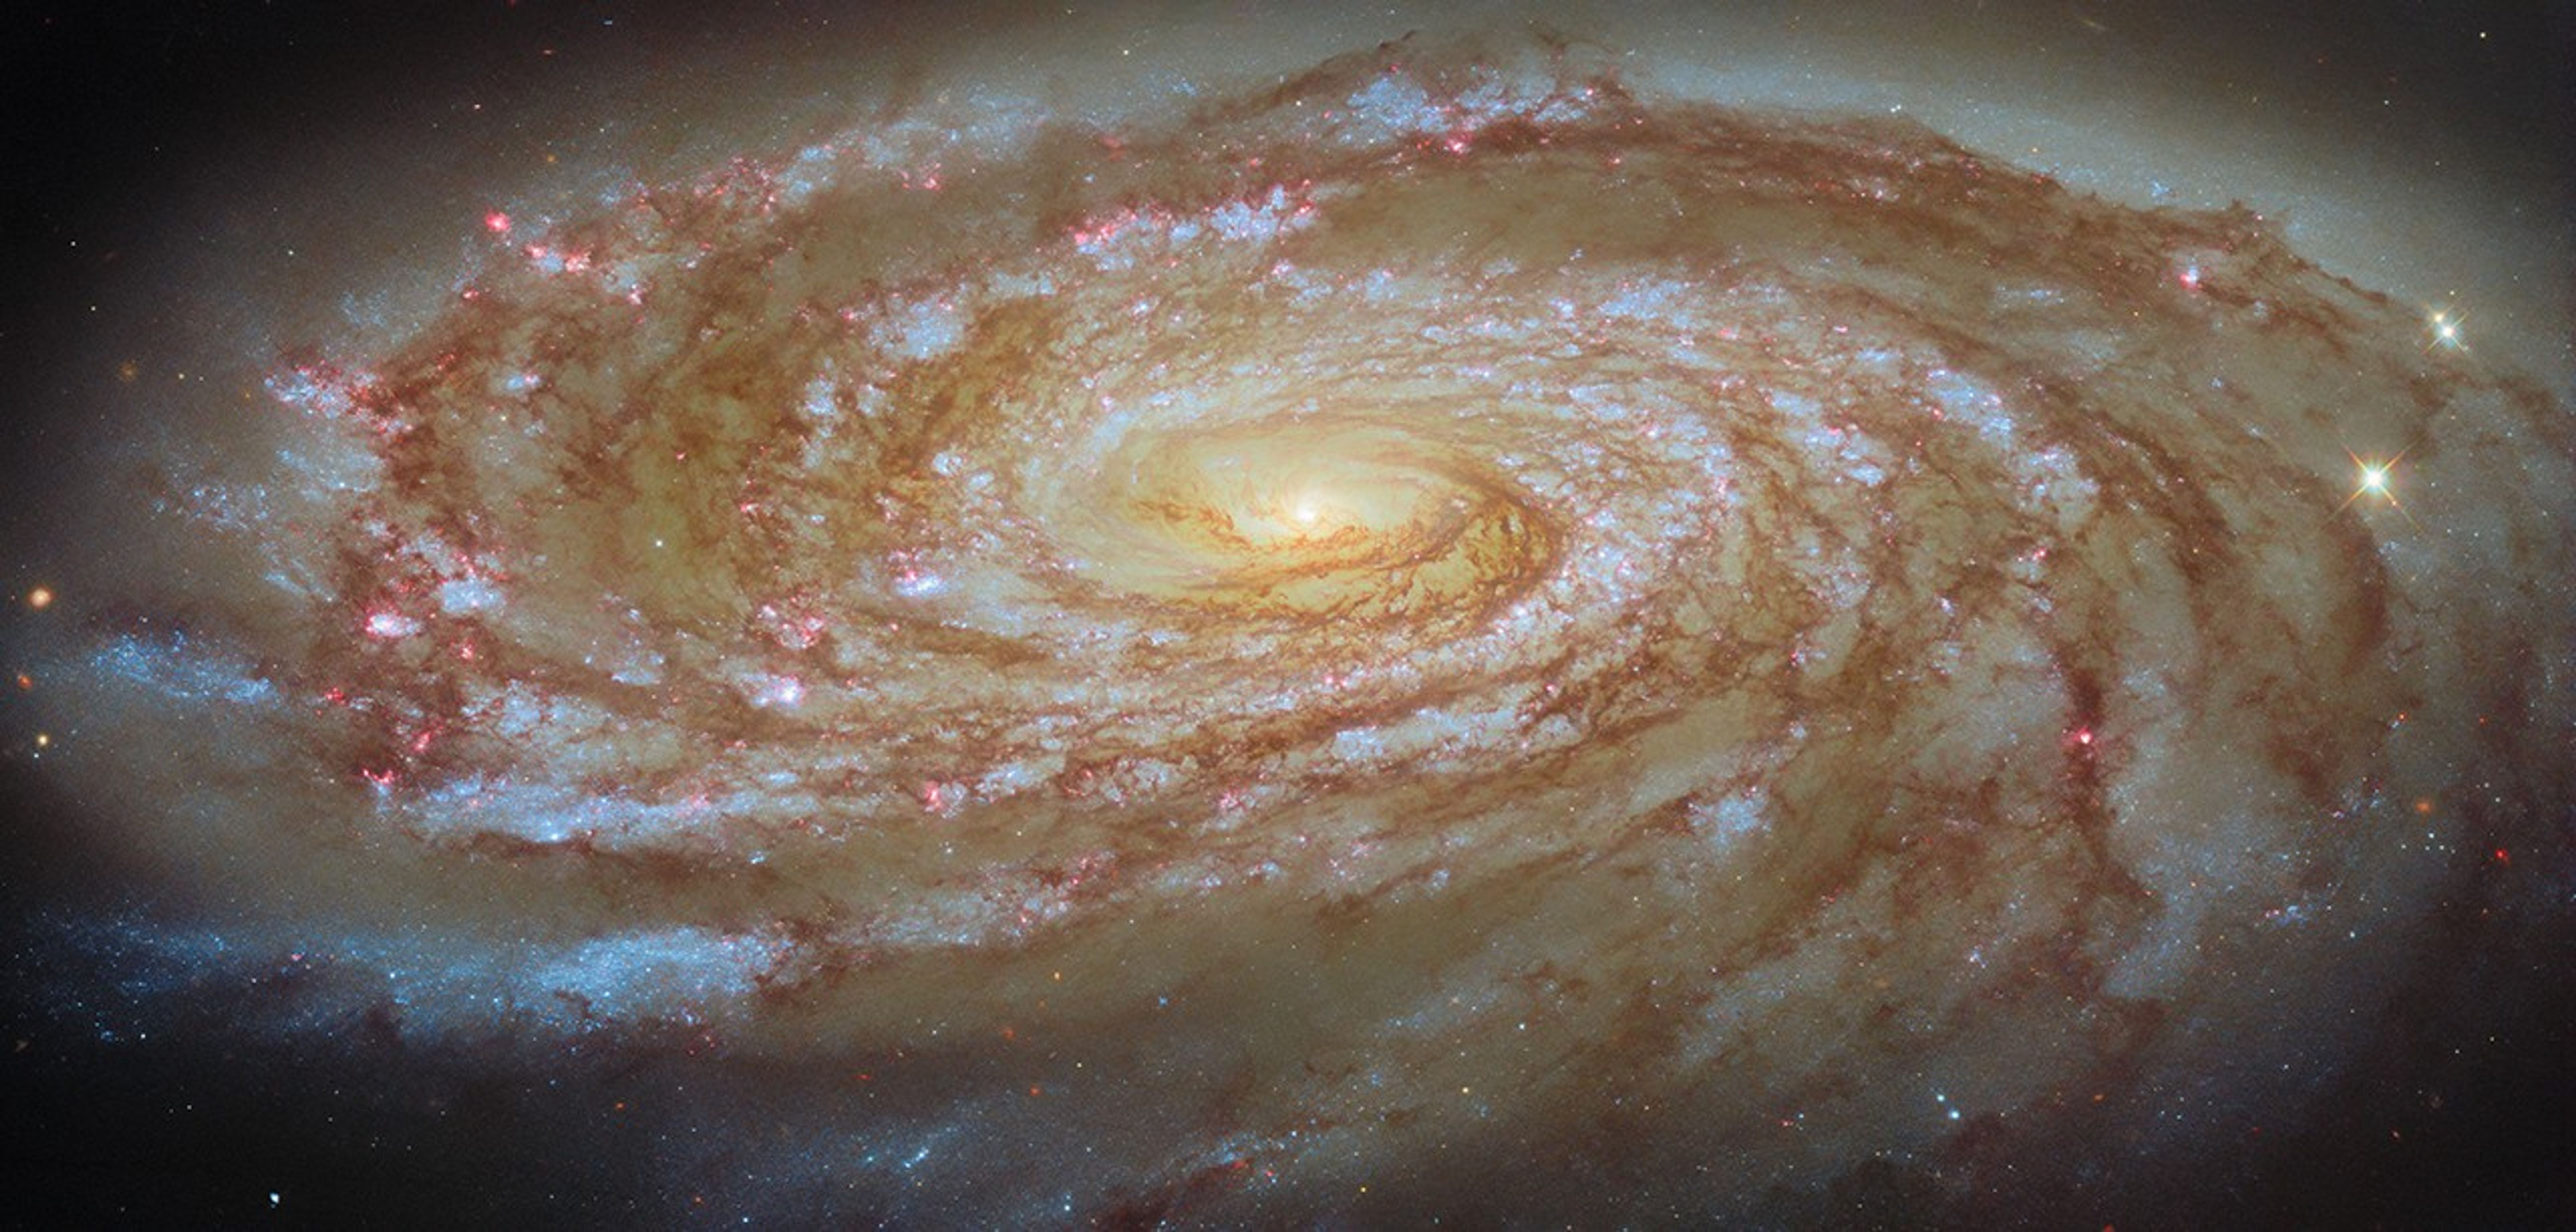
The focus of this NASA/ESA Hubble Space Telescope image is an active spiral galaxy on a journey lasting hundreds of millions of years. The galaxy Messier 88 (M88), also known as NGC 4501, is located about 63 million light-years away in the constellation Coma Berenices (Berenice’s Hair).
M88 is an active galaxy, which means that its center harbors a supermassive black hole that is snacking on gas and dust. Astronomers estimate the black hole is around 100 million times as massive as the Sun, and it appears to be powering outflows of gas from the galaxy’s center.
A population of old, reddish stars around the black hole give M88 its warmly glowing heart. Spreading out from the galaxy’s center are several tightly wound, symmetrical spiral arms, each outlined by sparkling pink and blue star clusters and knotted clouds of dust. We see M88 from an angle that makes it appear elongated, and its spiral arms delicately fan out before it.
M88 is a member of the Virgo Cluster, a collection of more than a thousand galaxies held together by gravity. As this massive galaxy group moves through space, the galaxies themselves are in constant motion as they orbit the cluster’s center of gravity. M88 itself is on a long and somewhat perilous cosmic journey that will bring it to the innermost reaches of the cluster.
As is the case with any epic journey, M88 will be fundamentally changed by its trek to the center of the Virgo Cluster, about two million light-years from where it is today. In 200–300 million years, M88 will make its closest approach to Messier 87, the massive elliptical galaxy that anchors the entire cluster. As it draws close to this gravitational behemoth, M88 will experience intense ram pressure stripping. Ram pressure stripping is a process through which a galaxy’s gas is swept away as it pushes through the ever-present gas between the galaxies in a cluster.
Researchers have already seen this process at work in M88. The galaxy’s swirling disk of gas is truncated and appears compressed on the leading edge of the galaxy, piling up gas and dust like snow before a plough. In fact, M88 appears to have considerably less cold gas — the raw fuel for star formation — than expected for a galaxy of its size, especially in its outer regions. This is a clear sign that M88 will be altered by its journey, which will affect its ability to form stars and alter the course of its evolution.
Astronomers observed M88 with Hubble as part of an observing program (#18103; PI: D. Thilker) dedicated to understanding the lives of spiral galaxies in crowded environments. This program uses Hubble’s Wide Field Camera 3, which can finely resolve individual star clusters and nebulae in galaxies tens of millions of light-years away. By studying galaxies on these scales, astronomers can understand how a journey through a cluster impacts a galaxy’s evolution and ability to form new stars.
Text credit: ESA/Hubble
Facebook logo @NASAHubble @NASAHubble Instagram logo @NASAHubbleMedia Contact:
Claire Andreoli
NASA’s Goddard Space Flight Center, Greenbelt, MD
claire.andreoli@nasa.gov
Since its 1990 launch, the Hubble Space Telescope has changed our fundamental understanding of the universe.
Messier 88
This galaxy’s core holds supermassive black hole roughly 100 million times more massive than our Sun.
Hubble Science Highlights
Hubble e-Books
Hubble Captures M88 on Journey to Center of Virgo Cluster
- Hubble Home
- Overview
- Impact & Benefits
- Science
- Observatory
- Team
- Multimedia
- News
- More
The focus of this NASA/ESA Hubble Space Telescope image is an active spiral galaxy on a journey lasting hundreds of millions of years. The galaxy Messier 88 (M88), also known as NGC 4501, is located about 63 million light-years away in the constellation Coma Berenices (Berenice’s Hair).
M88 is an active galaxy, which means that its center harbors a supermassive black hole that is snacking on gas and dust. Astronomers estimate the black hole is around 100 million times as massive as the Sun, and it appears to be powering outflows of gas from the galaxy’s center.
A population of old, reddish stars around the black hole give M88 its warmly glowing heart. Spreading out from the galaxy’s center are several tightly wound, symmetrical spiral arms, each outlined by sparkling pink and blue star clusters and knotted clouds of dust. We see M88 from an angle that makes it appear elongated, and its spiral arms delicately fan out before it.
M88 is a member of the Virgo Cluster, a collection of more than a thousand galaxies held together by gravity. As this massive galaxy group moves through space, the galaxies themselves are in constant motion as they orbit the cluster’s center of gravity. M88 itself is on a long and somewhat perilous cosmic journey that will bring it to the innermost reaches of the cluster.
As is the case with any epic journey, M88 will be fundamentally changed by its trek to the center of the Virgo Cluster, about two million light-years from where it is today. In 200–300 million years, M88 will make its closest approach to Messier 87, the massive elliptical galaxy that anchors the entire cluster. As it draws close to this gravitational behemoth, M88 will experience intense ram pressure stripping. Ram pressure stripping is a process through which a galaxy’s gas is swept away as it pushes through the ever-present gas between the galaxies in a cluster.
Researchers have already seen this process at work in M88. The galaxy’s swirling disk of gas is truncated and appears compressed on the leading edge of the galaxy, piling up gas and dust like snow before a plough. In fact, M88 appears to have considerably less cold gas — the raw fuel for star formation — than expected for a galaxy of its size, especially in its outer regions. This is a clear sign that M88 will be altered by its journey, which will affect its ability to form stars and alter the course of its evolution.
Astronomers observed M88 with Hubble as part of an observing program (#18103; PI: D. Thilker) dedicated to understanding the lives of spiral galaxies in crowded environments. This program uses Hubble’s Wide Field Camera 3, which can finely resolve individual star clusters and nebulae in galaxies tens of millions of light-years away. By studying galaxies on these scales, astronomers can understand how a journey through a cluster impacts a galaxy’s evolution and ability to form new stars.
Text credit: ESA/Hubble
Facebook logo @NASAHubble @NASAHubble Instagram logo @NASAHubbleMedia Contact:
Claire Andreoli
NASA’s Goddard Space Flight Center, Greenbelt, MD
claire.andreoli@nasa.gov
Since its 1990 launch, the Hubble Space Telescope has changed our fundamental understanding of the universe.
Messier 88
This galaxy’s core holds supermassive black hole roughly 100 million times more massive than our Sun.
Hubble Science Highlights
Hubble e-Books