
Feed aggregator
Linking Local Lithologies to a Larger Landscape
- Perseverance Home
- Science
- News and Features
- Multimedia
- Mars Missions
- Mars Home
2 min read
Linking Local Lithologies to a Larger Landscape This image from NASA’s Mars Perseverance rover, taken by the Mastcam-Z instrument’s right eye, shows a collection of ridge-forming boulders. The rover acquired this image looking south along the ridge while exploring the “Westport” region of the outer crater rim on July 18, 2025 — Sol 1568, or Martian day 1,568 of the Mars 2020 mission — at the local mean solar time of 11:53:04. NASA/JPL-Caltech/ASU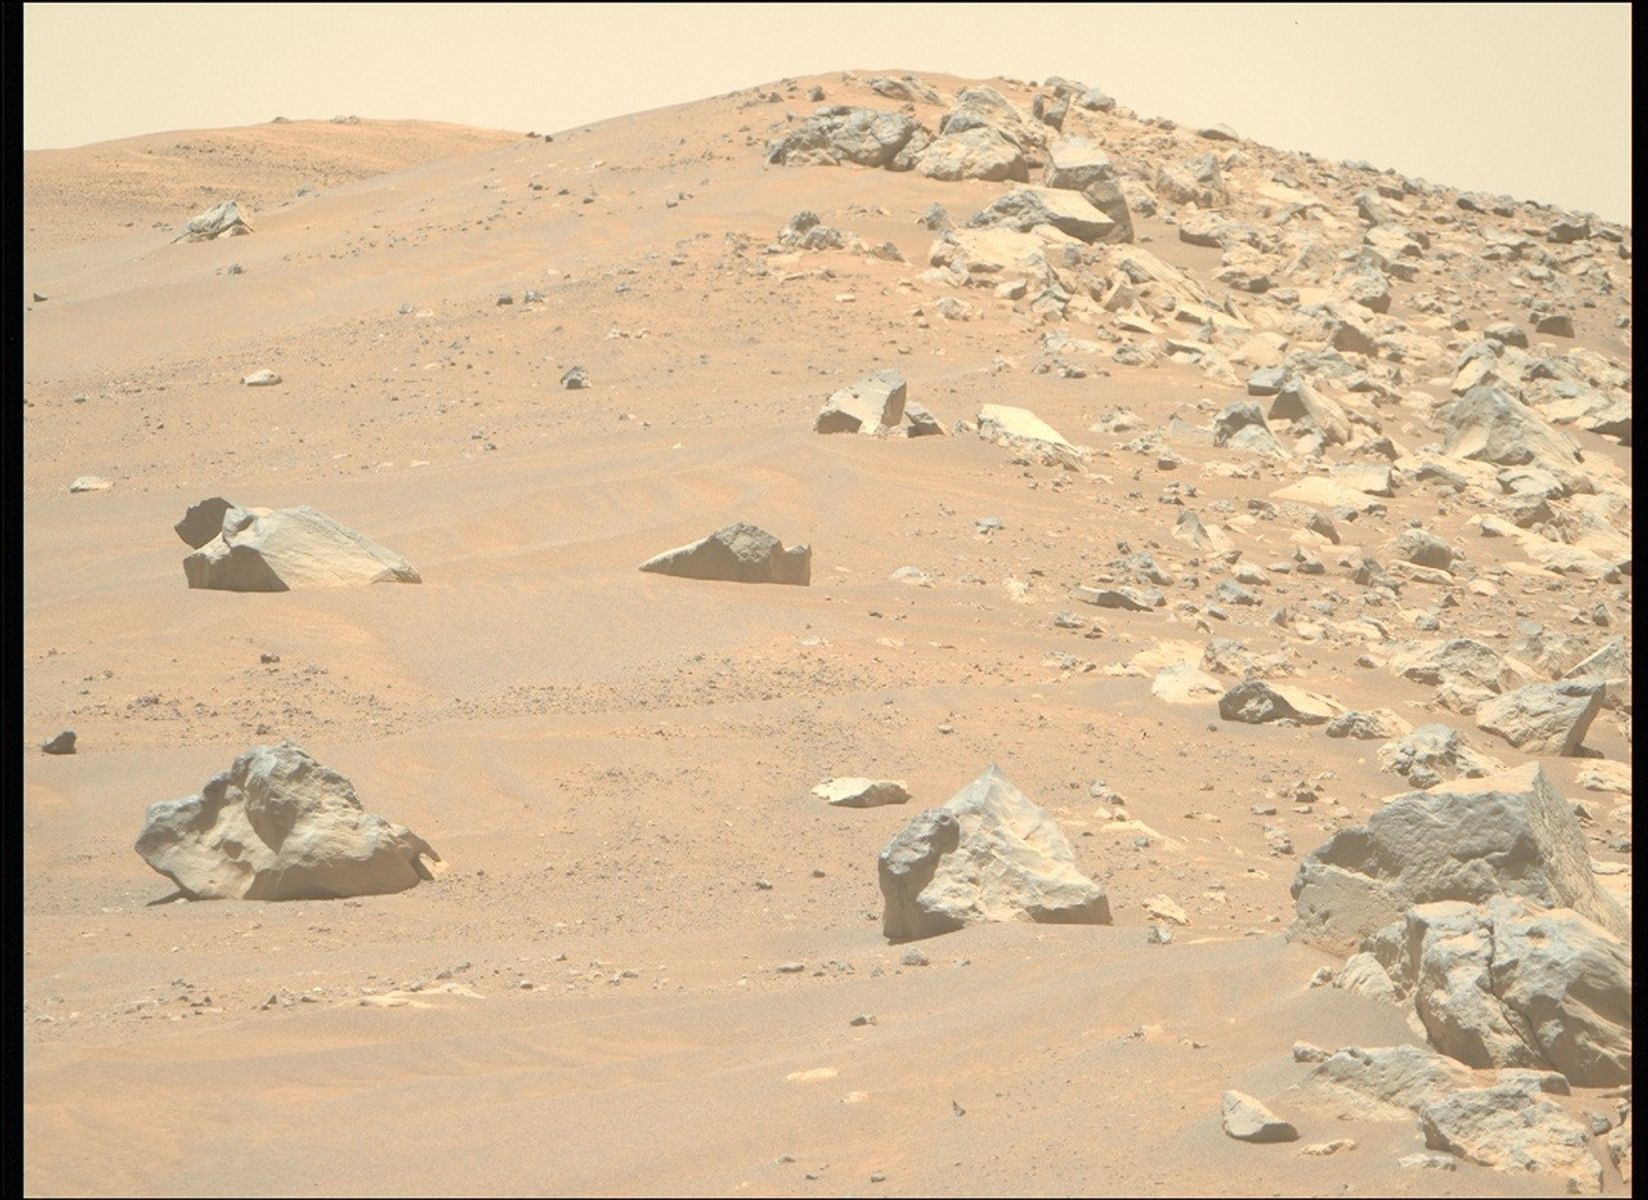
Written by Margaret Deahn, Ph.D. Student at Purdue University
NASA’s Mars 2020 rover is continuing to explore a boundary visible from orbit dividing bright, fractured outcrop from darker, smoother regolith (also known as a contact). The team has called this region “Westport,” (a fitting title, as the rover is exploring the western-most rim of Jezero), which hosts a contact between the smoother, clay-bearing “Krokodillen” unit and an outcrop of olivine-bearing boulders that converge to form a ridge on the outer Jezero crater rim. To learn more about the nature of this contact, see this blog post by Dr. Melissa Rice. Piecing together geologic events like the formation of this olivine-bearing material on Jezero’s crater rim may allow us to better understand Mars’ most ancient history.
The rover has encountered several olivine-bearing rocks while traversing the rim, but it is unclear if, and how these rocks are all connected. Jezero crater is in a region of Mars known as Northeast Syrtis, which hosts the largest contiguous exposure (more than 113,000 square kilometers, or more than 43,600 square miles) of olivine-rich material identified from orbit on Mars (about the same square mileage as the state of Ohio!). The olivine-rich materials are typically found draping over older rocks, often infilling depressions, which may provide clues to their origins. Possible origins for the olivine-rich materials in Northeast Syrtis may include (but are not limited to): (1) intrusive igneous rocks (rocks that cool from magma underground), (2) melt formed and deposited during an impact event, or (3) pyroclastic ash fall or flow from a volcanic eruption.
The Perseverance rover’s investigation of the olivine-bearing materials on the rim of Jezero crater may allow us to better constrain the history of the broader volcanic units present in the Northeast Syrtis region. Olivine-rich material in Northeast Syrtis is consistently sandwiched between older, clay-rich rock and younger, more olivine-poor material (commonly referred to as the “mafic capping” unit), and may act as an important marker for recording early alteration by water, which could help us understand early habitable environments on Mars. We see potential evidence of all of these units on Jezero crater’s rim based on orbital mapping. If the olivine-bearing rocks the Perseverance rover is encountering on the rim are related to these materials, we may be able to better constrain the age of this widespread geologic unit on Mars.
Learn more about Perseverance’s science instruments
For more Perseverance blog posts, visit Mars 2020 Mission Updates
Share Details Last Updated Aug 07, 2025 Related Terms Explore More 3 min read Curiosity Blog, Sols 4622-4623: Kicking Off (Earth) Year 14 With an Investigation of Veins
Article
18 hours ago
3 min read Curiosity Blog, Sols 4618-4619: The Boxwork Structures Continue to Call to Us
Article
2 days ago
3 min read Curiosity Blog, Sols 4620-4621: Among the Hollows and the Ridges
Article
2 days ago
Keep Exploring Discover More Topics From NASA Mars
Mars is the fourth planet from the Sun, and the seventh largest. It’s the only planet we know of inhabited…
All Mars Resources
Explore this collection of Mars images, videos, resources, PDFs, and toolkits. Discover valuable content designed to inform, educate, and inspire,…
Rover Basics
Each robotic explorer sent to the Red Planet has its own unique capabilities driven by science. Many attributes of a…
Mars Exploration: Science Goals
The key to understanding the past, present or future potential for life on Mars can be found in NASA’s four…
US-French SWOT Satellite Measures Tsunami After Massive Quake
4 min read
Preparations for Next Moonwalk Simulations Underway (and Underwater) The SWOT satellite caught the leading edge of the tsunami wave (red) that rolled through the Pacific Ocean on July 30. Sea level data, shown in the highlighted swath, is plotted against a NOAA tsunami forecast model in the background. A red star marks the location of the earthquake that spawned the tsunami.NASA/JPL-Caltech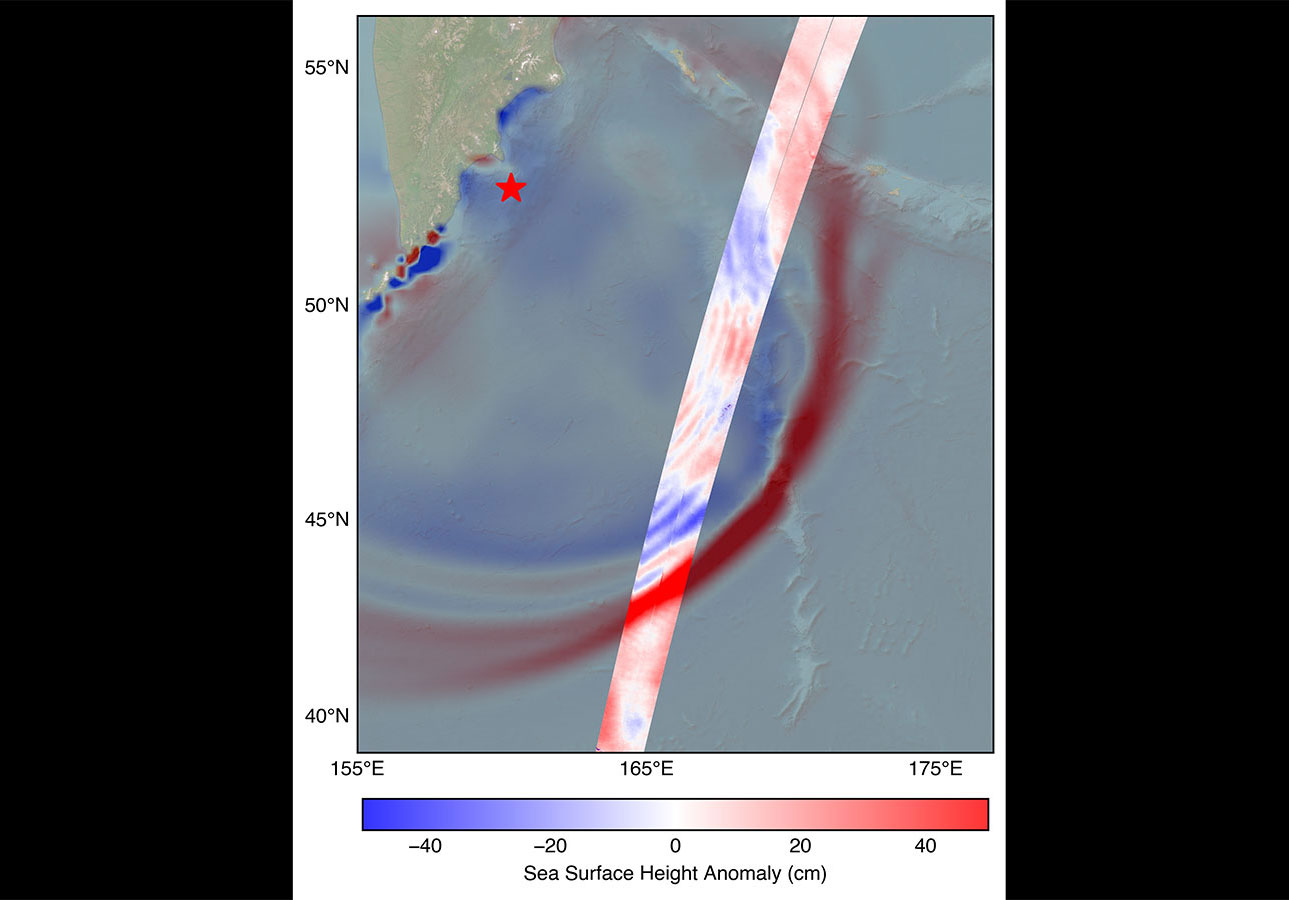
Data provided by the water satellite, a joint effort between NASA and the French space agency, is helping to improve tsunami forecast models, benefitting coastal communities.
The SWOT (Surface Water and Ocean Topography) satellite captured the tsunami spawned by an 8.8 magnitude earthquake off the coast of Russia’s Kamchatka Peninsula on July 30, 11:25 a.m. local time. The satellite, a joint effort between NASA and the French space agency CNES (Centre National d’Études Spatiales), recorded the tsunami about 70 minutes after the earthquake struck.
Disturbances like an earthquake or underwater landslide trigger a tsunami when the event is large enough to displace the entire column of seawater from the ocean floor to the surface. This results in waves that ripple out from the disturbance much like dropping a pebble into a pond generates a series of waves.
“The power of SWOT’s broad, paintbrush-like strokes over the ocean is in providing crucial real-world validation, unlocking new physics, and marking a leap towards more accurate early warnings and safer futures,” said Nadya Vinogradova Shiffer, NASA Earth lead and SWOT program scientist at NASA Headquarters in Washington.
This visualization depicts the leading edge of the tsunami based on sea surface height data from SWOT looking from south to north, when the leading edge was more than 1.5 feet (45 centimeters) high, east of Japan in the Pacific Ocean.NASA/JPL-Caltech
Data from SWOT provided a multidimensional look at the leading edge of the tsunami wave triggered by the Kamchatka earthquake. The measurements included a wave height exceeding 1.5 feet (45 centimeters), shown in red in the highlighted track, as well as a look at the shape and direction of travel of the leading edge of the tsunami. The SWOT data, shown in the highlighted swath running from the southwest to the northeast in the visual, is plotted against a forecast model of the tsunami produced by the U.S. National Oceanic and Atmospheric Administration (NOAA) Center for Tsunami Research. Comparing the observations from SWOT to the model helps forecasters validate their model, ensuring its accuracy.
“A 1.5-foot-tall wave might not seem like much, but tsunamis are waves that extend from the seafloor to the ocean’s surface,” said Ben Hamlington, an oceanographer at NASA’s Jet Propulsion Laboratory in Southern California. “What might only be a foot or two in the open ocean can become a 30-foot wave in shallower water at the coast.”
The tsunami measurements SWOT collected are helping scientists at NOAA’s Center for Tsunami Research improve their tsunami forecast model. Based on outputs from that model, NOAA sends out alerts to coastal communities potentially in the path of a tsunami. The model uses a set of earthquake-tsunami scenarios based on past observations as well as real-time observations from sensors in the ocean.
The SWOT data on the height, shape, and direction of the tsunami wave is key to improving these types of forecast models. “The satellite observations help researchers to better reverse engineer the cause of a tsunami, and in this case, they also showed us that NOAA’s tsunami forecast was right on the money,” said Josh Willis, a JPL oceanographer.
The NOAA Center for Tsunami Research tested their model with SWOT’s tsunami data, and the results were exciting, said Vasily Titov, the center’s chief scientist in Seattle. “It suggests SWOT data could significantly enhance operational tsunami forecasts — a capability sought since the 2004 Sumatra event.” The tsunami generated by that devastating quake killed thousands of people and caused widespread damage in Indonesia.
More About SWOTThe SWOT satellite was jointly developed by NASA and CNES, with contributions from the Canadian Space Agency (CSA) and the UK Space Agency. NASA JPL, managed for the agency by Caltech in Pasadena, California, leads the U.S. component of the project. For the flight system payload, NASA provided the Ka-band radar interferometer (KaRIn) instrument, a GPS science receiver, a laser retroreflector, a two-beam microwave radiometer, and NASA instrument operations. The Doppler Orbitography and Radioposition Integrated by Satellite system, the dual frequency Poseidon altimeter (developed by Thales Alenia Space), the KaRIn radio-frequency subsystem (together with Thales Alenia Space and with support from the UK Space Agency), the satellite platform, and ground operations were provided by CNES. The KaRIn high-power transmitter assembly was provided by CSA.
To learn more about SWOT, visit:
News Media ContactsJane J. Lee / Andrew Wang
Jet Propulsion Laboratory, Pasadena, Calif.
818-354-0307 / 626-379-6874
ane.j.lee@jpl.nasa.gov / andrew.wang@jpl.nasa.gov
2025-103
Share Details Last Updated Aug 07, 2025 Related Terms Explore More 4 min read NASA Supercomputers Take on Life Near Greenland’s Most Active Glacier Article 5 days ago 4 min read NASA’s Perseverance Rover Captures Mars Vista As Clear As Day Article 5 days ago 1 min read NASA’s Black Marble: Stories from the Night SkyStudying the glowing patterns of Earth’s surface helps us understand human activity, respond to disasters,…
Article 7 days ago Keep Exploring Discover Related TopicsMissions
Humans in Space
Climate Change
Solar System
US-French SWOT Satellite Measures Tsunami After Massive Quake
4 min read
Preparations for Next Moonwalk Simulations Underway (and Underwater) The SWOT satellite caught the leading edge of the tsunami wave (red) that rolled through the Pacific Ocean on July 30. Sea level data, shown in the highlighted swath, is plotted against a NOAA tsunami forecast model in the background. A red star marks the location of the earthquake that spawned the tsunami.NASA/JPL-CaltechData provided by the water satellite, a joint effort between NASA and the French space agency, is helping to improve tsunami forecast models, benefitting coastal communities.
The SWOT (Surface Water and Ocean Topography) satellite captured the tsunami spawned by an 8.8 magnitude earthquake off the coast of Russia’s Kamchatka Peninsula on July 30, 11:25 a.m. local time. The satellite, a joint effort between NASA and the French space agency CNES (Centre National d’Études Spatiales), recorded the tsunami about 70 minutes after the earthquake struck.
Disturbances like an earthquake or underwater landslide trigger a tsunami when the event is large enough to displace the entire column of seawater from the ocean floor to the surface. This results in waves that ripple out from the disturbance much like dropping a pebble into a pond generates a series of waves.
“The power of SWOT’s broad, paintbrush-like strokes over the ocean is in providing crucial real-world validation, unlocking new physics, and marking a leap towards more accurate early warnings and safer futures,” said Nadya Vinogradova Shiffer, NASA Earth lead and SWOT program scientist at NASA Headquarters in Washington.
This visualization depicts the leading edge of the tsunami based on sea surface height data from SWOT looking from south to north, when the leading edge was more than 1.5 feet (45 centimeters) high, east of Japan in the Pacific Ocean.NASA/JPL-CaltechData from SWOT provided a multidimensional look at the leading edge of the tsunami wave triggered by the Kamchatka earthquake. The measurements included a wave height exceeding 1.5 feet (45 centimeters), shown in red in the highlighted track, as well as a look at the shape and direction of travel of the leading edge of the tsunami. The SWOT data, shown in the highlighted swath running from the southwest to the northeast in the visual, is plotted against a forecast model of the tsunami produced by the U.S. National Oceanic and Atmospheric Administration (NOAA) Center for Tsunami Research. Comparing the observations from SWOT to the model helps forecasters validate their model, ensuring its accuracy.
“A 1.5-foot-tall wave might not seem like much, but tsunamis are waves that extend from the seafloor to the ocean’s surface,” said Ben Hamlington, an oceanographer at NASA’s Jet Propulsion Laboratory in Southern California. “What might only be a foot or two in the open ocean can become a 30-foot wave in shallower water at the coast.”
The tsunami measurements SWOT collected are helping scientists at NOAA’s Center for Tsunami Research improve their tsunami forecast model. Based on outputs from that model, NOAA sends out alerts to coastal communities potentially in the path of a tsunami. The model uses a set of earthquake-tsunami scenarios based on past observations as well as real-time observations from sensors in the ocean.
The SWOT data on the height, shape, and direction of the tsunami wave is key to improving these types of forecast models. “The satellite observations help researchers to better reverse engineer the cause of a tsunami, and in this case, they also showed us that NOAA’s tsunami forecast was right on the money,” said Josh Willis, a JPL oceanographer.
The NOAA Center for Tsunami Research tested their model with SWOT’s tsunami data, and the results were exciting, said Vasily Titov, the center’s chief scientist in Seattle. “It suggests SWOT data could significantly enhance operational tsunami forecasts — a capability sought since the 2004 Sumatra event.” The tsunami generated by that devastating quake killed thousands of people and caused widespread damage in Indonesia.
More About SWOTThe SWOT satellite was jointly developed by NASA and CNES, with contributions from the Canadian Space Agency (CSA) and the UK Space Agency. NASA JPL, managed for the agency by Caltech in Pasadena, California, leads the U.S. component of the project. For the flight system payload, NASA provided the Ka-band radar interferometer (KaRIn) instrument, a GPS science receiver, a laser retroreflector, a two-beam microwave radiometer, and NASA instrument operations. The Doppler Orbitography and Radioposition Integrated by Satellite system, the dual frequency Poseidon altimeter (developed by Thales Alenia Space), the KaRIn radio-frequency subsystem (together with Thales Alenia Space and with support from the UK Space Agency), the satellite platform, and ground operations were provided by CNES. The KaRIn high-power transmitter assembly was provided by CSA.
To learn more about SWOT, visit:
News Media ContactsJane J. Lee / Andrew Wang
Jet Propulsion Laboratory, Pasadena, Calif.
818-354-0307 / 626-379-6874
ane.j.lee@jpl.nasa.gov / andrew.wang@jpl.nasa.gov
2025-103
Share Details Last Updated Aug 07, 2025 Related Terms Explore More 4 min read NASA Supercomputers Take on Life Near Greenland’s Most Active Glacier Article 5 days ago 4 min read NASA’s Perseverance Rover Captures Mars Vista As Clear As Day Article 5 days ago 1 min read NASA’s Black Marble: Stories from the Night SkyStudying the glowing patterns of Earth’s surface helps us understand human activity, respond to disasters,…
Article 7 days ago Keep Exploring Discover Related TopicsMissions
Humans in Space
Climate Change
Solar System
We’ve discovered the most massive black hole yet
We’ve discovered the most massive black hole yet
Who's a good robot dog? Bert and Spot explore Mars-like surface with help from AI and astronaut in space
SpaceX signs deal to fly Italian experiments to Mars on Starship's 1st commercial Red Planet flights
NASA Uses Wind Tunnel to Test Advanced Air Mobility Aircraft Wing
3 min read
Preparations for Next Moonwalk Simulations Underway (and Underwater) NASA employees Broderic J. Gonzalez, left, and David W. Shank install pieces of a 7-foot wing model in preparation for testing in the 14-by-22-Foot Subsonic Wind Tunnel at NASA’s Langley Research Center in Hampton, Virginia, in May 2025. The lessons learned will be shared with the public to support advanced air mobility aircraft development. NASA/Mark Knopp
The advanced air mobility industry is currently working to produce novel aircraft ranging from air taxis to autonomous cargo drones, and all of those designs will require extensive testing – which is why NASA is working to give them a head-start by studying a special kind of model wing. The wing is a scale model of a design used in a type of aircraft called a “tiltwing,” which can swing its wing and rotors from vertical to horizontal. This allows the aircraft to take off, hover, and land like a helicopter, or fly like a fixed-wing airplane. This design enables versatility in a range of operating environments.
Several companies are working on tiltwings, but NASA’s research into the scale wing will also impact nearly all types of advanced air mobility aircraft designs.
“NASA research supporting advanced air mobility demonstrates the agency’s commitment to supporting this rapidly growing industry,” said Brandon Litherland, principal investigator for the test at NASA’s Langley Research Center in Hampton, Virginia. “Tool improvements in these areas will greatly improve our ability to accurately predict the performance of new advanced air mobility aircraft, which supports the adoption of promising designs. Gaining confidence through testing ensures we can identify safe operating conditions for these new aircraft.”
NASA researcher Norman W. Schaeffler adjusts a propellor, which is part of a 7-foot wing model that was recently tested at NASA’s Langley Research Center in Hampton, Virginia. In May and June, NASA researchers tested the wing in the 14-by-22-Foot Subsonic Wind Tunnel to collect data on critical propeller-wing interactions. The lessons learned will be shared with the public to support advanced air mobility aircraft development.NASA/Mark Knopp
In May and June, NASA tested a 7-foot wing model with multiple propellers in the 14-by-22-Foot Subsonic Wind Tunnel at Langley. The model is a “semispan,” or the right half of a complete wing. Understanding how multiple propellers and the wing interact under various speeds and conditions provides valuable insight for the advanced air mobility industry. This information supports improved aircraft designs and enhances the analysis tools used to assess the safety of future designs.
This work is managed by the Revolutionary Vertical Lift Technology project under NASA’s Advanced Air Vehicles Program in support of NASA’s Advanced Air Mobility mission, which seeks to deliver data to guide the industry’s development of electric air taxis and drones.
“This tiltwing test provides a unique database to validate the next generation of design tools for use by the broader advanced air mobility community,” said Norm Schaeffler, the test director, based at Langley. “Having design tools validated for a broad range of aircraft will accelerate future design cycles and enable informed decisions about aerodynamic and acoustic performance.”
In May and June, NASA researchers tested a 7-foot wing model in the 14-by-22-Foot Subsonic Wind Tunnel at NASA’s Langley Research Center in Hampton, Virginia. The team collected data on critical propeller-wing interactions over the course of several weeks.NASA/Mark Knopp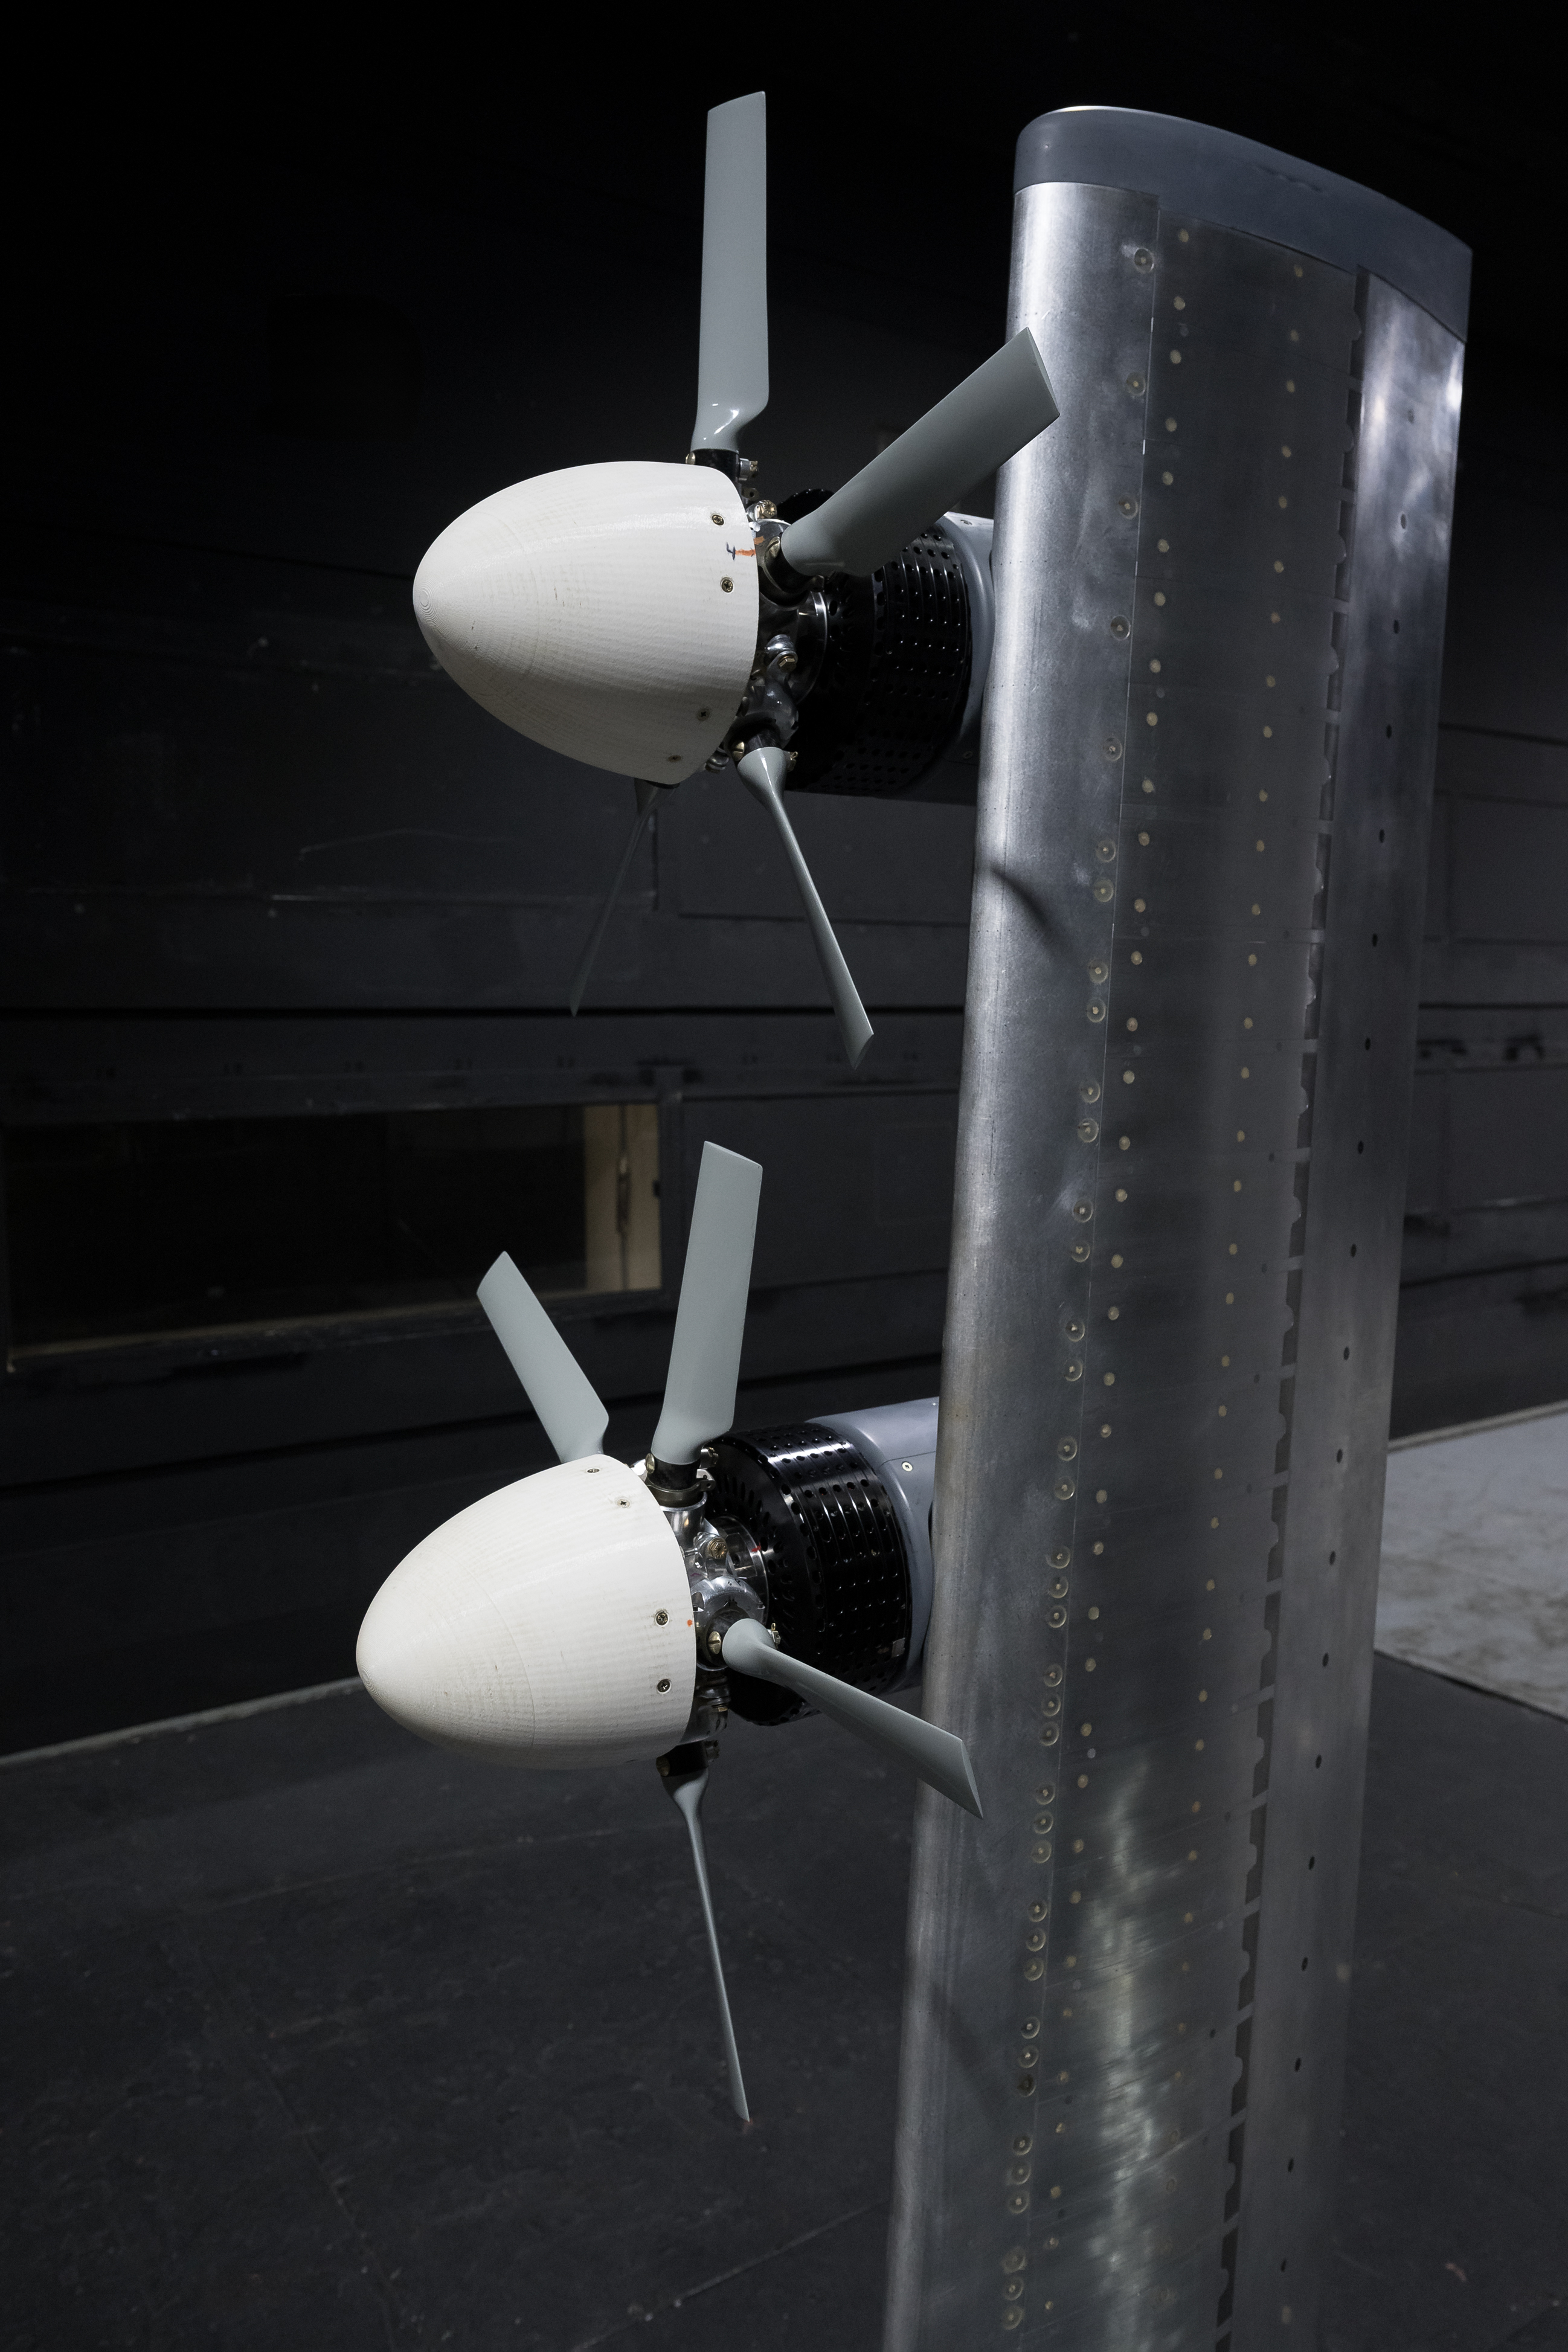
The wing is outfitted with over 700 sensors designed to measure pressure distribution, along with several other types of tools to help researchers collect data from the wing and propeller interactions. The wing is mounted on special sensors to measure the forces applied to the model. Sensors in each motor-propeller hub to measure the forces acting on the components independently.
The model was mounted on a turntable inside the wind tunnel, so the team could collect data at different wing tilt angles, flap positions, and rotation rates. The team also varied the tunnel wind speed and adjusted the relative positions of the propellers.
Researchers collected data relevant to cruise, hover, and transition conditions for advanced air mobility aircraft. Once they analyze this data, the information will be released to industry on NASA’s website.
Share Details Last Updated Aug 07, 2025 EditorDede DiniusContactTeresa Whitingteresa.whiting@nasa.gov Related Terms Explore More 3 min read Three NASA Langley Employees Win Prestigious Silver Snoopy Awards Article 4 days ago 3 min read NASA Drop Test Supports Safer Air Taxi Design and Certification Article 2 weeks ago 3 min read NASA Rehearses How to Measure X-59’s Noise Levels Article 2 weeks ago Keep Exploring Discover More Topics From NASAArmstrong Flight Research Center
Humans in Space
Climate Change
Solar System
NASA Uses Wind Tunnel to Test Advanced Air Mobility Aircraft Wing
3 min read
Preparations for Next Moonwalk Simulations Underway (and Underwater) NASA employees Broderic J. Gonzalez, left, and David W. Shank install pieces of a 7-foot wing model in preparation for testing in the 14-by-22-Foot Subsonic Wind Tunnel at NASA’s Langley Research Center in Hampton, Virginia, in May 2025. The lessons learned will be shared with the public to support advanced air mobility aircraft development. NASA/Mark KnoppThe advanced air mobility industry is currently working to produce novel aircraft ranging from air taxis to autonomous cargo drones, and all of those designs will require extensive testing – which is why NASA is working to give them a head-start by studying a special kind of model wing. The wing is a scale model of a design used in a type of aircraft called a “tiltwing,” which can swing its wing and rotors from vertical to horizontal. This allows the aircraft to take off, hover, and land like a helicopter, or fly like a fixed-wing airplane. This design enables versatility in a range of operating environments.
Several companies are working on tiltwings, but NASA’s research into the scale wing will also impact nearly all types of advanced air mobility aircraft designs.
“NASA research supporting advanced air mobility demonstrates the agency’s commitment to supporting this rapidly growing industry,” said Brandon Litherland, principal investigator for the test at NASA’s Langley Research Center in Hampton, Virginia. “Tool improvements in these areas will greatly improve our ability to accurately predict the performance of new advanced air mobility aircraft, which supports the adoption of promising designs. Gaining confidence through testing ensures we can identify safe operating conditions for these new aircraft.”
NASA researcher Norman W. Schaeffler adjusts a propellor, which is part of a 7-foot wing model that was recently tested at NASA’s Langley Research Center in Hampton, Virginia. In May and June, NASA researchers tested the wing in the 14-by-22-Foot Subsonic Wind Tunnel to collect data on critical propeller-wing interactions. The lessons learned will be shared with the public to support advanced air mobility aircraft development.NASA/Mark KnoppIn May and June, NASA tested a 7-foot wing model with multiple propellers in the 14-by-22-Foot Subsonic Wind Tunnel at Langley. The model is a “semispan,” or the right half of a complete wing. Understanding how multiple propellers and the wing interact under various speeds and conditions provides valuable insight for the advanced air mobility industry. This information supports improved aircraft designs and enhances the analysis tools used to assess the safety of future designs.
This work is managed by the Revolutionary Vertical Lift Technology project under NASA’s Advanced Air Vehicles Program in support of NASA’s Advanced Air Mobility mission, which seeks to deliver data to guide the industry’s development of electric air taxis and drones.
“This tiltwing test provides a unique database to validate the next generation of design tools for use by the broader advanced air mobility community,” said Norm Schaeffler, the test director, based at Langley. “Having design tools validated for a broad range of aircraft will accelerate future design cycles and enable informed decisions about aerodynamic and acoustic performance.”
In May and June, NASA researchers tested a 7-foot wing model in the 14-by-22-Foot Subsonic Wind Tunnel at NASA’s Langley Research Center in Hampton, Virginia. The team collected data on critical propeller-wing interactions over the course of several weeks.NASA/Mark KnoppThe wing is outfitted with over 700 sensors designed to measure pressure distribution, along with several other types of tools to help researchers collect data from the wing and propeller interactions. The wing is mounted on special sensors to measure the forces applied to the model. Sensors in each motor-propeller hub to measure the forces acting on the components independently.
The model was mounted on a turntable inside the wind tunnel, so the team could collect data at different wing tilt angles, flap positions, and rotation rates. The team also varied the tunnel wind speed and adjusted the relative positions of the propellers.
Researchers collected data relevant to cruise, hover, and transition conditions for advanced air mobility aircraft. Once they analyze this data, the information will be released to industry on NASA’s website.
Share Details Last Updated Aug 07, 2025 EditorDede DiniusContactTeresa Whitingteresa.whiting@nasa.gov Related Terms Explore More 3 min read Three NASA Langley Employees Win Prestigious Silver Snoopy Awards Article 4 days ago 3 min read NASA Drop Test Supports Safer Air Taxi Design and Certification Article 2 weeks ago 3 min read NASA Rehearses How to Measure X-59’s Noise Levels Article 2 weeks ago Keep Exploring Discover More Topics From NASAArmstrong Flight Research Center
Humans in Space
Climate Change
Solar System
Jupiter and its 4 largest moons will line up in the sky on Aug. 8. Here's how to see the 'parade'
Unistellar eQuinox 2 is over $700 cheaper — perfect for nebula and galaxy hunting in the summer skies
Alpha Centauri Might Have a Planet, Webb Telescope Finds
Direct images from the James Webb Space Telescope show what could be a Saturn-mass planet around Alpha Centauri.
The post Alpha Centauri Might Have a Planet, Webb Telescope Finds appeared first on Sky & Telescope.
Human bones found in Spanish cave show signs of ancient cannibalism
Human bones found in Spanish cave show signs of ancient cannibalism
How we could explore a black hole with an interstellar nanocraft
How we could explore a black hole with an interstellar nanocraft
Astronomers use starlight to measure greenhouse gases in Earth's atmosphere
NASA’s Artemis II Crew Trains in Orion
NASA’s Artemis II Crew Trains in Orion
The Artemis II crew (from left to right) CSA (Canadian Space Agency) astronaut Jeremy Hansen, and NASA astronauts Christina Koch, Victor Glover, and Reid Wiseman don their Orion Crew Survival System Suits for a multi-day crew module training beginning July 31, 2025, at the agency’s Kennedy Space Center in Florida. Behind the crew, wearing clean room apparel, are members of the Artemis II closeout crew.
Testing included a suited crew test and crew equipment interface test, performing launch day and simulated orbital activities inside the Orion spacecraft. This series of tests marks the first time the crew entered their spacecraft that will take them around the Moon and back to Earth while wearing their spacesuits.
Image credit: NASA/Rad Sinyak