
Feed aggregator
Voyager 1 Is Back! NASA Spacecraft Safely Resumes All Science Observations
NASA’s venerable Voyager 1 spacecraft has resumed normal science operations with all four functioning instruments for the first time in more than six months
NASA to Discuss Outcome of 5th Biennial Asteroid Threat Exercise
NASA will host a virtual media briefing at 3:30 p.m. EDT, Thursday, June 20, to discuss a new summary of a recent tabletop exercise to simulate national and international responses to a hypothetical asteroid impact threat.
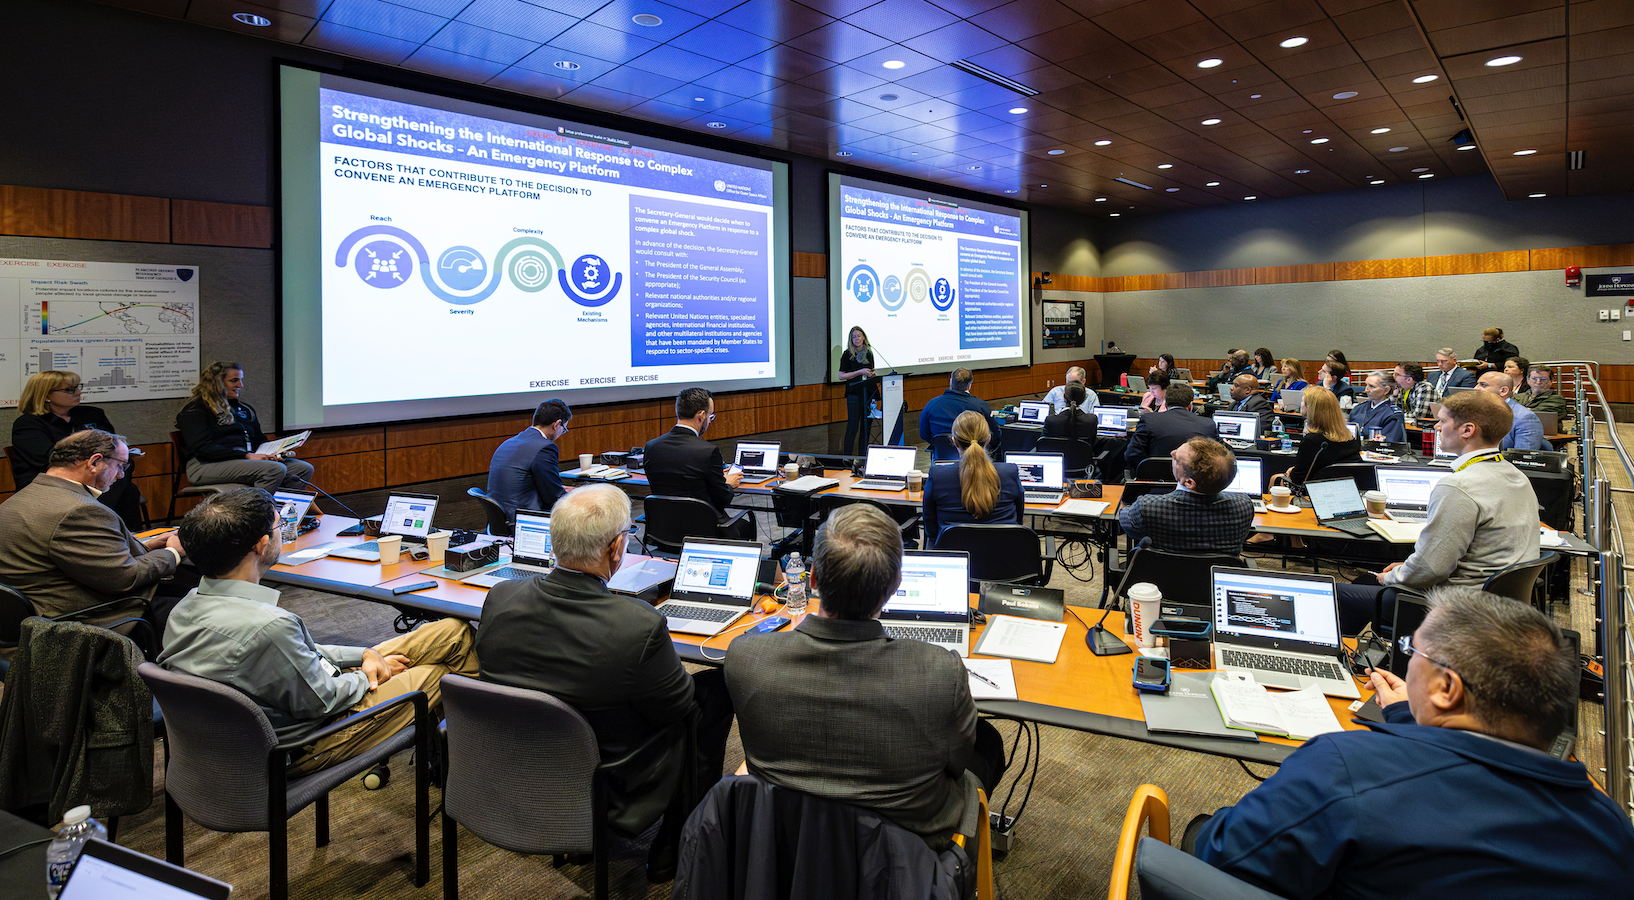
The fifth biennial Planetary Defense Interagency Tabletop Exercise was held April 2 and 3, 2024, at the Johns Hopkins Applied Physics Laboratory (APL) in Laurel, Maryland.
NASA’s Planetary Defense Coordination Office, in partnership with FEMA (Federal Emergency Management Agency) and with the assistance of the U.S. Department of State Office of Space Affairs, convened the tabletop exercise to inform and assess our ability as a nation to respond effectively to the threat of a potentially hazardous asteroid or comet. This exercise supports NASA’s planetary defense strategy to protect our planet and continues the agency’s mission to innovate for the benefit of humanity.
Video of the briefing will stream live on NASA TV and NASA’s YouTube channel.
The following participants will review the history and purpose of the exercise, the scenario encountered during this year’s simulation, and its findings and recommendations:
- Lindley Johnson, NASA’s Planetary Defense Officer Emeritus, NASA Headquarters, Washington
- Leviticus “L.A.” Lewis, FEMA detailee to NASA’s Planetary Defense Coordination Office, NASA Headquarters
- Terik Daly, planetary defense section supervisor, Johns Hopkins Applied Physics Laboratory, Laurel, Maryland
To register for the briefing, media must RSVP no later than two hours before the event to Alise Fisher at alise.m.fisher@nasa.gov. NASA’s media accreditation policy is available online.
While there are no known significant asteroid impact threats for the foreseeable future, hypothetical exercises like this one, which are conducted about every two years, provide valuable insights on how the United States could respond effectively if a potential asteroid impact threat is identified.
This year’s exercise was the first to include participation by NASA’s international collaborators in planetary defense and the first to have the benefit of actual data from NASA’s successful DART (Double Asteroid Redirection Test) mission, the world’s first in-space technology demonstration for defending Earth against potential asteroid impacts.
NASA established the Planetary Defense Coordination Office in 2016 to manage the agency’s ongoing efforts in planetary defense.
To learn more about planetary defense at NASA, visit:
https://science.nasa.gov/planetary-defense/
-end-
Charles Blue / Karen Fox
Headquarters, Washington
202-802-5345 / 202-358-1600
charles.e.blue@nasa.gov / karen.fox@nasa.gov
Astronomers get closer to solving the lingering mystery of fast radio bursts
NASA-Led Mission to Map Air Pollution Over Both U.S. Coasts
2 min read
Preparations for Next Moonwalk Simulations Underway (and Underwater)This summer between June 17 and July 2, NASA will fly aircraft over Baltimore, Philadelphia, parts of Virginia, and California to collect data on air pollutants and greenhouse gas emissions.
The campaign supports the NASA Student Airborne Research Program for undergraduate interns.
Two NASA aircraft, including the P-3 shown here, will be flying over Baltimore, Philadelphia, Virginia and California between June 17 and July 2, to collect data on air pollutants and greenhouse gas emissions. Credit: (NASA/ Zavaleta)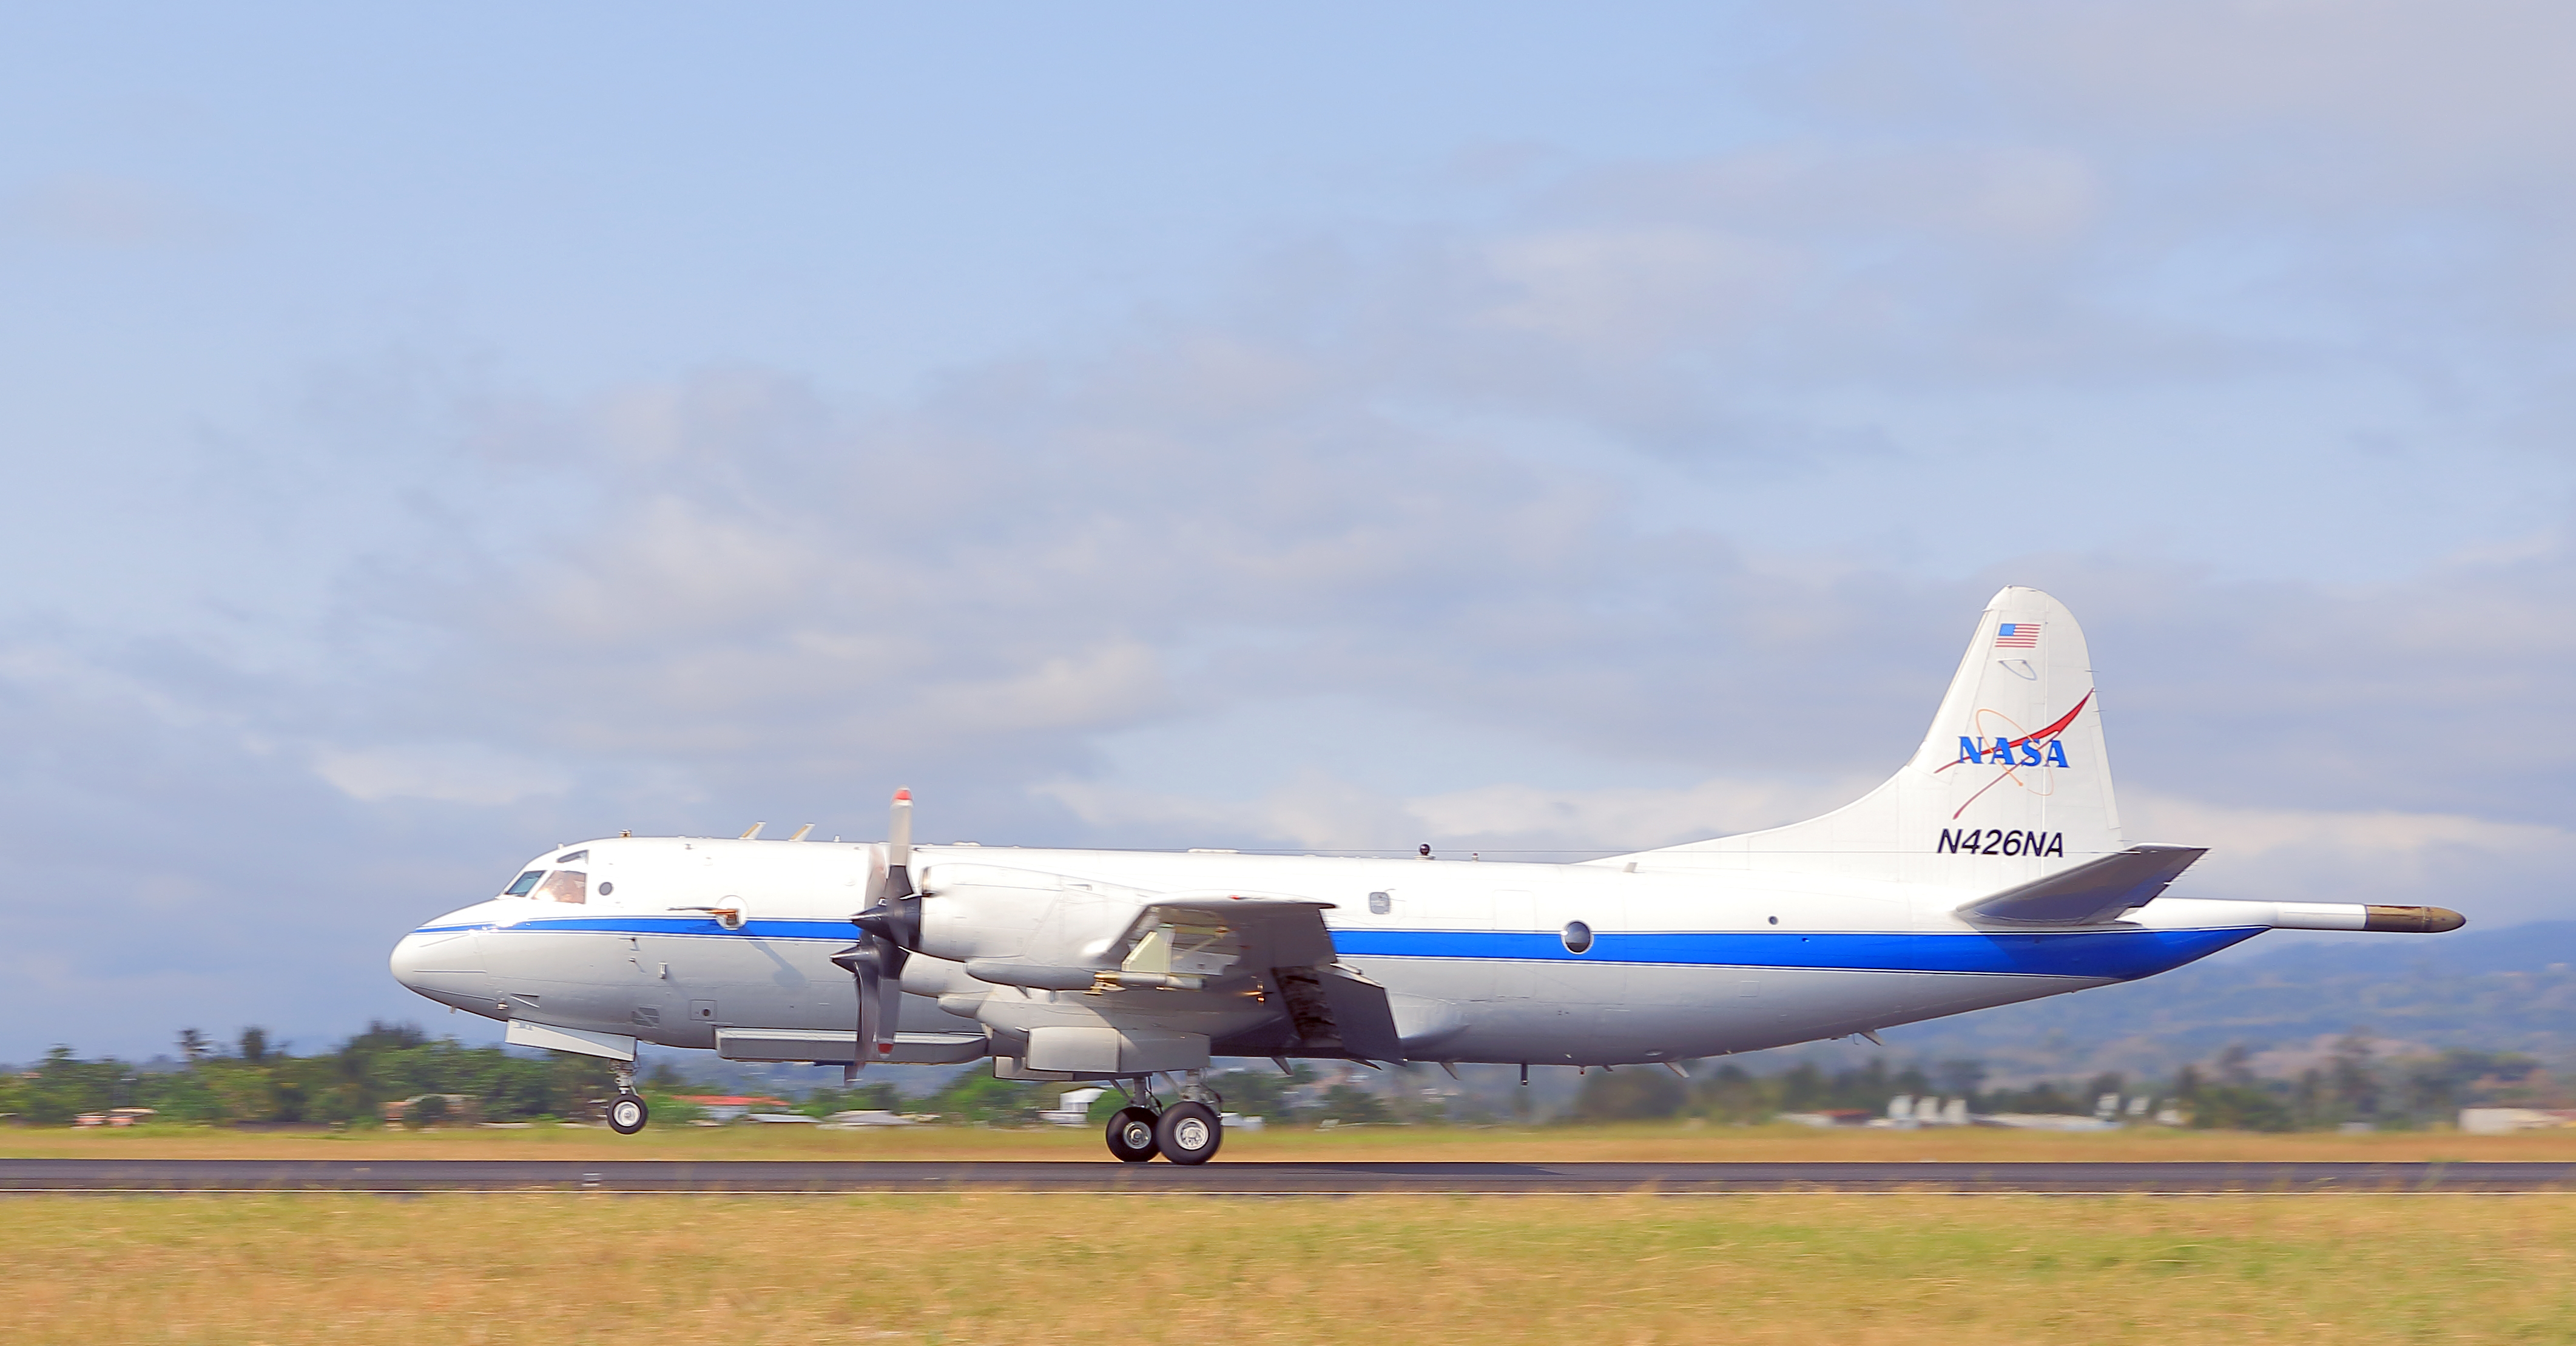
The East Coast flights will take place from June 17-26. Researchers and students will fly multiple times each week in Dynamic Aviation’s King Air B200 aircraft at an altitude of 1,000 feet over Baltimore and Philadelphia as well as Norfolk, Hampton, Hopewell, and Richmond in Virginia. Meanwhile, a NASA P-3 aircraft based out of NASA’s Wallops Flight Facility in Virginia will fly over the same East Coast locations to collect different measurements.
The West Coast flights will occur from June 29 – July 2. During the period, those same aircraft will conduct similar operations over Los Angeles, Imperial Valley, and Tulare Basin in California.
The research aircraft will fly at lower altitudes than most commercial planes and will conduct maneuvers including vertical spirals from 1,000 to 10,000 feet, circling over power plants, landfills, and urban areas. They will also occasionally conduct “missed approaches” at local airports, where the aircraft will perform a low-level flyby over a runway to collect samples close to the surface.
The aircraft carry instruments that will collect data on a range of greenhouse gases including carbon dioxide and methane, as well as air pollutants such as nitrogen dioxide, formaldehyde, and ozone. One purpose of this campaign is to validate space-based measurements observed by the TEMPO (Tropospheric Emissions: Monitoring of Pollution) mission. Launched on a commercial satellite in April 2023, the TEMPO instrument provides hourly daytime measurements of air pollutants across the United States, northern Mexico, and southern Canada.
“The goal is that this data we collect will feed into policy decisions that affect air quality and climate in the region,” said Glenn Wolfe, a research scientist and the principal investigator for the campaign at NASA’s Goddard Space Flight Center in Greenbelt, Maryland.
The B-200 aircraft is owned by Dynamics Aviation, an aircraft company contracted by NASA.
For more information about Student Airborne Research Program, visit:
https://science.nasa.gov/earth-science/early-career-opportunities/student-airborne-research-program/
By Tayler Gilmore
NASA’s Goddard Space Flight Center, Greenbelt, Maryland
Share Details Last Updated Jun 14, 2024 EditorJennifer R. MarderContactJeremy EggersLocationGoddard Space Flight Center Related Terms Explore More 5 min read Surf, Turf, Above Earth: Students Participate in NASA Field ResearchFlying over and tromping through watery landscapes along the East Coast, working alongside NASA scientists,…
Article 10 months ago 10 min read A Tale of Three PollutantsFreight, smoke, and ozone impact the health of both Chicago residents and communities downwind. A…
Article 8 months ago 4 min read NASA Scientists Take to the Seas to Study Air Quality Article 1 week ago12 billion years of black hole history, revealed through X-rays and simulations
NASA’s Wallops Flight Facility to Launch Student Experiments
4 min read
Preparations for Next Moonwalk Simulations Underway (and Underwater) A Terrier-Improved Orion sounding rocket carrying students experiments for the RockOn! mission successfully launched from NASA’s Wallops Flight Facility Aug. 17, 2023 at 6 a.m. EDT.NASA/ Kyle HoppesMore than 50 student and faculty teams are sending experiments into space as part of NASA’s RockOn and RockSat-C student flight programs. The annual student mission, “RockOn,” is scheduled to launch from Wallops Island, Virginia, on a Terrier-Improved Orion sounding rocket Thursday, June 20, with a launch window that opens at 5:30 a.m. EDT.
An introduction to rocketry for college studentsThe RockOn workshop is an introductory flight opportunity for community college and university students. RockOn participants spend a week at NASA’s Wallops Flight Facility, where they are guided through the process of building and launching an experiment aboard a sounding rocket.
“RockOn provides students and faculty with authentic, hands-on experiences tied to an actual launch into space from a NASA facility,” said Chris Koehler, on contract with NASA as RockOn’s principal investigator. “These experiences are instrumental in the creation of our next STEM workforce.”
RockOn student experiments are placed into canisters to be integrated into the payload.NASA/ Madison Olson Unique & advanced experiments
In addition to the RockOn workshop experiments, the rocket will carry student team experiments from six different institutions as part of the RockSat-C program. The RockSat-C experiments are unique to each institution and were created off site.
RockSat-C “has been an incredible introduction into the world of NASA and how flight missions are built from start to finish,” said TJ Tomaszewski, student lead for the University of Delaware. “The project started as just a flicker of an idea in students’ minds. After countless hours of design, redesign, and coffee, the fact that we finished an experiment capable of going to space and capable of conducting valuable scientific research makes me so proud of my team and so excited for what’s possible next. Everybody dreams about space, and the fact that we’re going to launch still doesn’t feel real.”
Students participating in the 2024 RockSat-C program were able to see the RockOn rocket in the testing facility at Wallops Flight Facility.NASA/ Berit Bland
RockSat-C participants include:
- Temple University, Philadelphia
Experiments will utilize X-ray spectrometry, muon detection, and magnetometry to explore the interplay among cosmic phenomena, such as X-rays, cosmic muons, and Earth’s magnetic field, while also quantifying atmospheric methane levels as a function of altitude.
- Southeastern Louisiana University, Hammond
The ION experiment aims to measure the plasma density in the ionosphere. This will be achieved by detecting the upper hybrid resonant frequency using an impedance probe mounted on the outside of the rocket and comparing the results to theoretical models. The secondary experiment, known as the ACC experiment, aims to record the rocket’s re-entry dynamics and measure acceleration in the x, y, and z directions.
- Old Dominion University, Norfolk, Virginia
The Monarch3D team will redesign and improve upon a pre-existing experiment from the previous year’s team that will print in suborbital space. This project uses a custom-built 3D printer made by students at Old Dominion.
- University of Delaware, Newark
Project UDIP-4 will measure the density and temperature of ionospheric electrons as a function of altitude and compare the quality of measurements obtained from different grounding methods. Additionally, the project focuses on developing and testing new CubeSat hardware in preparation for an orbital CubeSat mission named DAPPEr.
- Stevens Institute of Technology, Hoboken, New Jersey
The Atmospheric Inert Gas Retrieval project will develop a payload capable of demonstrating supersonic sample collection at predetermined altitudes and investigating the noble gas fractionation and contamination of the acquired samples. In addition, their payload will test the performance of inexpensive vibration damping materials by recording and isolating launch vibrations using 3D-printed components.
- Cubes in Space, Virginia Beach, Virginia
The Cubes in Space (CiS) project provides students aged 11 to 18 with a unique opportunity to conduct scientific and engineering experiments in space. CiS gives students hands-on experience and a deeper understanding of scientific and engineering principles, preparing them for more complex STEM studies and research in the future. Students develop and design their unique experiments to fit into clear, rigid plastic payload cubes, each about 1.5 inches on a side. Up to 80 of these unique student experiments are integrated into the nose cone of the rocket.
Approximately 80 small cubes will be launched as part of the RockOn sounding rocket mission.Courtesy Cubes in Space/Jorge Salazar; used with permission Watch the launch
The launch window for the mission is 5:30-9:30 a.m. EDT, Thursday June 20, with a backup day of June 21. The Wallops Visitor Center’s launch viewing area will open at 4:30 a.m. A livestream of the mission will begin 15 minutes before launch on the Wallops YouTube channel. Launch updates also are available via the Wallops Facebook page.
These circular areas show where and when people may see the rocket launch in the sky, depending on cloud cover. The different colored sections indicate the time (in seconds) after liftoff that the sounding rocket may be visible.NASA/ Christian Billie
NASA’s Sounding Rocket Program is conducted at the agency’s Wallops Flight Facility, which is managed by NASA’s Goddard Space Flight Center in Greenbelt, Maryland. NASA’s Heliophysics Division manages the sounding rocket program for the agency.
Share Details Last Updated Jun 14, 2024 EditorAmy BarraContactAmy Barraamy.l.barra@nasa.govLocationWallops Flight Facility Related Terms Explore More 4 min read Double Header: NASA Sounding Rockets to Launch Student ExperimentsNASA's Wallops Flight Facility is scheduled to launch two sounding rockets carrying student developed experiments…
Article 10 months ago 3 min read Sounding Rocket Takes a Second Look at the Sun Article 6 years ago 4 min read Big Science Drives Wallops’ Upgrades for NASA Suborbital Missions Article 2 months agoSummary of the Ninth DSCOVR EPIC and NISTAR Science Team Meeting
22 min read
Summary of the Ninth DSCOVR EPIC and NISTAR Science Team MeetingIntroduction
The ninth Deep Space Climate Observatory (DSCOVR) Earth Polychromatic Camera (EPIC) and National Institute of Standards and Technology (NIST) Advanced Radiometer [NISTAR] Science Team Meeting (STM) was held virtually October 16–17, 2023. Over 35 scientists attended, most of whom were from NASA’s Goddard Space Flight Center (GSFC), with several participating from other NASA field centers, U.S. universities, and U.S. Department of Energy laboratories. One international participant joined the meeting from Estonia. A full overview of DSCOVR’s Earth-observing instruments was printed in a previous article in The Earth Observer and will not be repeated here. This article provides the highlights of the 2023 meeting. The meeting agenda and full presentations can be downloaded from GSFC’s Aura Validation Data Center.
Opening Presentations
The opening session consisted of a series of presentations from DSCOVR mission leaders and representatives from GSFC and NASA Headquarters (HQ), who gave updates on the mission and the two Earth-viewing science instruments on board. Alexander Marshak [GSFC—DSCOVR Deputy Project Scientist] opened the meeting. He discussed the agenda for the meeting and mentioned that both Earth science instruments on DSCOVR are functioning normally – see Figure 1. At this time, more than 115 papers related to DSCOVR are listed on the EPIC website. Marshak emphasized the importance of making the Earth Science community more aware of the availability of the various EPIC and NISTAR science data products.
Figure 1. Sun-Earth-Vehicle (SEV) angle (red curve) and the distance between Earth and the DSCOVR satellite (blue curve) versus time starting from the DSCOVR launch on February 15, 2015 to April 1, 2024. These two measurements are used to track the location and orientation, respectively, of DSCOVR. The spacecraft changes its location by about 200,000 km (~124,274 mi) over about a 3-month period, and its SEV gets close to zero (which would correspond to perfect backscattering). The gap around the year 2020 was when DSCOVR was in Safe Mode for an extended period. Figure credit: Adam Szabo (Original figure by Alexander Marshak, with data provided by Joe Park/NOAA)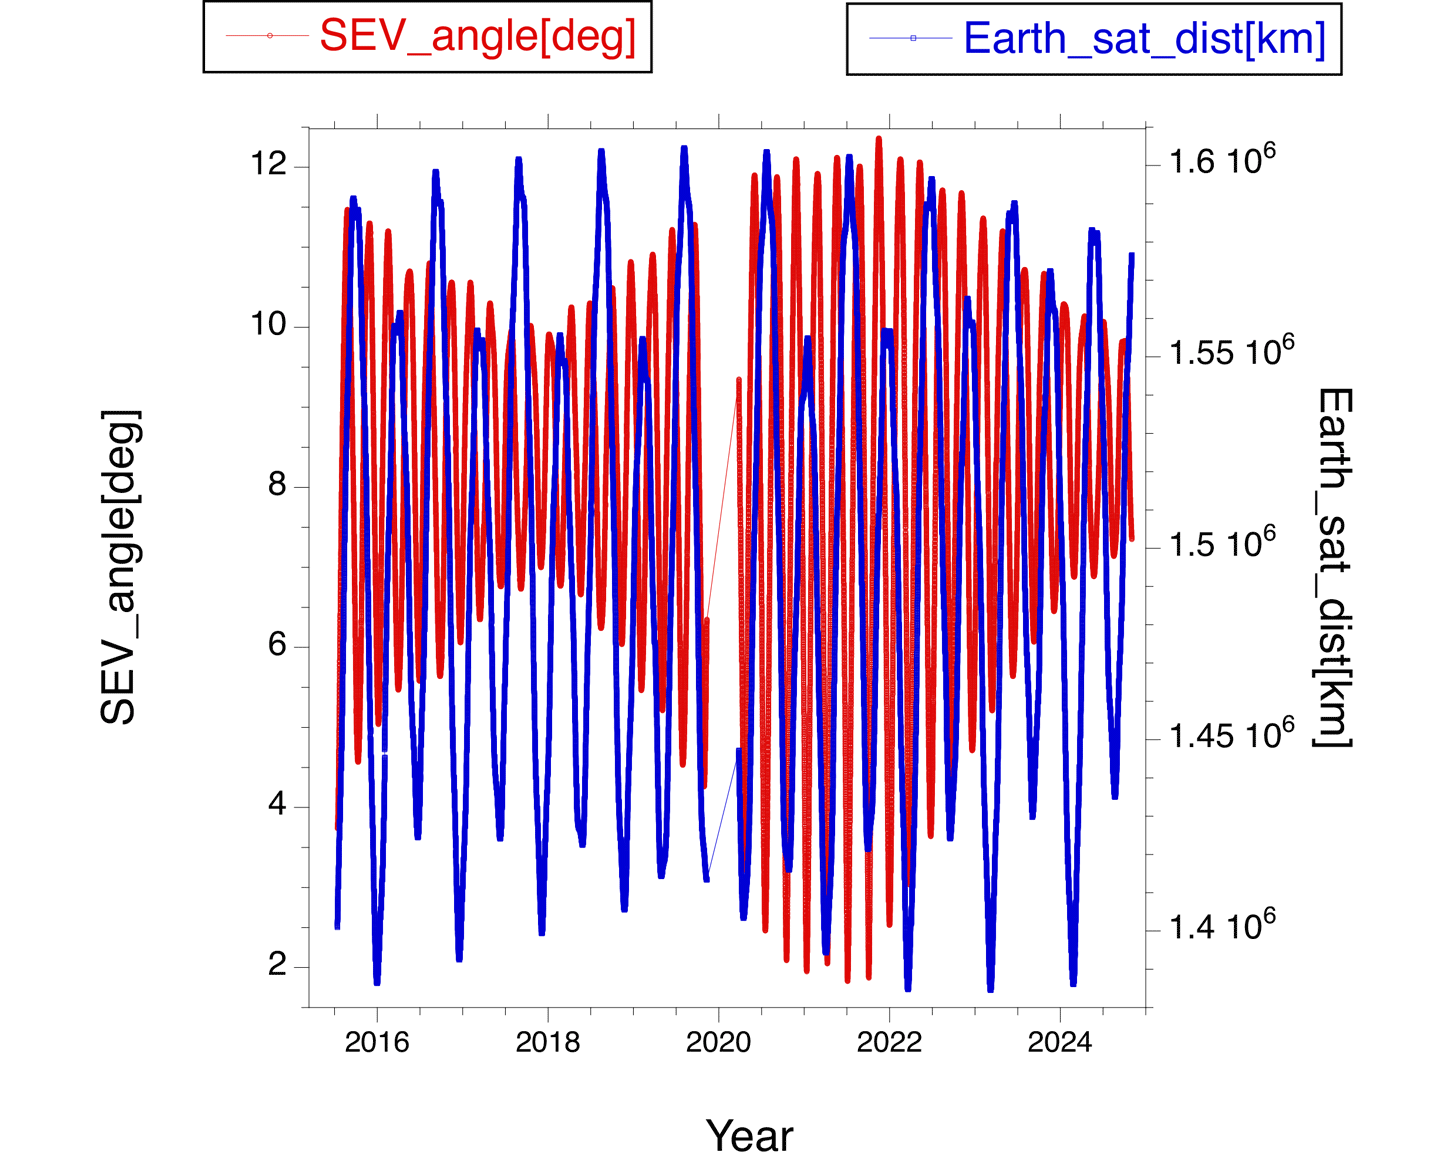
Adam Szabo [GSFC—DSCOVR Project Scientist] welcomed the STM participants and briefly reported that the spacecraft, located at “L1” – the first of five Lagrange points in the Sun-Earth system – was still in “good health.” The EPIC and NISTAR instruments on DSCOVR continue to return their full science observations. Szabo gave an update on the 2023 Earth Science Senior Review, which DSCOVR successfully passed with overall science scores of ‘Excellent/Very Good.’ The Senior Review Panel unanimously supported the continuation of DSCOVR for the 2024–2026 period.
Thomas Neumann [GSFC, Earth Sciences Division (ESD)—Deputy Director] welcomed meeting participants on behalf of the ESD. Neumann noted the impressive engineering that has led to 8.5 years of operations and counting. He also commended the team on the continued production of important science results from these instruments – with nearly 110 papers in the peer-reviewed literature.
Following Neumann’s remarks, Steve Platnick [GSFC, Earth Sciences Division—Deputy Director for Atmospheres] welcomed the members of the DSCOVR ST as well as users of EPIC and NISTAR observations. He thanked NASA HQ for its continued strong interest in the mission. Platnick also expressed his appreciation for the mission team members who have worked hard to maintain operation of the DSCOVR satellite and instruments during this challenging time.
Richard Eckman [NASA HQ, Earth Science Division—DSCOVR EPIC/NISTAR Program Scientist] noted that a new call for proposals will be in ROSES-2025 and looks forward to learning about recent accomplishments by ST members, which will be essential in assessing the mission’s performance.
Jack Kaye [NASA HQ, Earth Science Division—Associate Director for Research] discussed the NASA research program that studies the Earth, using satellites, aircraft, surface-based measurements, and computer models. The two Earth science instruments on DSCOVR (EPIC and NISTAR) play an important role in the program. He highlighted the uniqueness of the DSCOVR observations from the Sun–Earth “L1” point providing context for other missions and the ability to discern diurnal variations.
Updates on DSCOVR Operations
The DSCOVR mission components continue to function nominally, with progress on several fronts, including data acquisition, processing, archiving, and release of new versions of several data products. The number of people using the content continues to increase, with a new Science Outreach Team having been put in place to aid users in several aspects of data discovery, access, and user friendliness.
Hazem Mahmoud [NASA’s Langley Research Center (LaRC)] discussed the new tools in the Atmospheric Science Data Center (ASDC). He reported on DSCOVR metrics since 2015 and mentioned the significant increase in using ozone (O3) products. He also announced that ASDC is moving to the Amazon Web Services (AWS) cloud.
Karin Blank [GSFC] covered the EPIC geolocation algorithm, including the general algorithm framework. She highlighted additional problems that needed to be resolved and detailed the various stages to refine the algorithm, emphasizing the enhancements made to improve geolocation accuracy.
Marshall Sutton [GSFC] reported on the DSCOVR Science Operations Center (DSOC) and Level-2 (L2) processing. DSOC is operating nominally. EPIC L1A, L1B, and NISTAR data files are produced daily. EPIC L1 products are processed into L2 science products using the computing power of the NASA Center for Climate Simulations (NCCS). Products include daily data images, including a cloud fraction map, aerosol map, and the anticipated aerosol height image. In addition, Sutton reported that the DSCOVR spacecraft has enough fuel to remain in operation until 2033.
EPIC Calibration
Alexander Cede [SciGlob] and Ragi Rajagopalan [LiftBlick OG] reported on the latest EPIC calibration version (V23) that includes the new flat field corrections based on the lunar observations from 2023 and an update to the dark count model. The EPIC instrument remains healthy and shows no change in parameters, e.g., read noise, enhanced or saturated pixels, or hot or warm pixels. The current operational dark count model still describes the dark count in a satisfactory way.
Liang-Kang Huang [Science Systems and Applications, Inc. (SSAI)] reported on EPIC’s July 2023 lunar measurements, which filled in the area near diagonal lines of the charged coupled device (CCD) not covered by 2021 and 2022 lunar data. With six short wavelength channels ranging from 317 to 551 nm, the two sets of lunar data are consistent with each other. For the macroscopic flat field corrections, he recommended the six fitted sensitivity change functions of radius and polar angle.
Igor Geogdzhaev [NASA’s Goddard Institute for Space Studies (GISS)/Columbia University] reported how continuous EPIC observations provide stable visible and near infrared (NIR) channels compared to the contemporaneous data from Visible Infrared Imaging Radiometer Suite (VIIRS) on NASA’s Suomi National Polar-orbiting Partnership (Suomi NPP) and the NASA–National Oceanic and Atmospheric Administration (NOAA) Joint Polar Satellite System (JPSS) missions. (To date, two JPSS missions have launched, JPSS-1, which is now known as NOAA-20, and JPSS-2, which is now known as NOAA-21.) Analysis of near simultaneous data from EPIC and from the Advanced Baseline Imager (ABI) on the Geostationary Operational Environmental Satellite–R (GOES R) platforms showed a high correlation coefficient, good agreement between dark and bright pixels, and small regression zero intercepts. EPIC moon views were used to derive oxygen (O2) channel reflectance by interpolation of the calibrated non-absorbing channels.
Conor Haney [LaRC] reported that the EPIC sensor was intercalibrated against measurements from the Moderate Resolution Imaging Spectroradiometer (MODIS) on NASA’s Terra and Aqua platforms as well as from VIIRS on Suomi NPP and NOAA-20, using ray-matched pair radiances, and was found to be radiometrically stable when tested against two invariant calibration targets: over deep convective clouds over the tropical Pacific (dark target) and over the Libya-4 site located in the Libyan desert in Africa (bright target). The ray-matched and Earth target EPIC gain trends were found to be consistent within 1.1%, and the EPIC sensor degradation was found to be less than 1% over the seven-year record. Preliminary results intercalibrating EPIC with the Advanced Himawari Imager (AHI) on the Japan Aerospace Exploration Agency’s (JAXA) “Himawari–8” Geostationary Meteorological Satellite were also promising when both subsatellite positions were close—i.e., during equinox.
NISTAR Status and Science with Its Observations
The NISTAR instrument remains fully functional and continues its uninterrupted data record. The presentations here include more details on specific topics related to NISTAR as well as on efforts to combine information from both EPIC and NISTAR.
Steven Lorentz [L-1 Standards and Technology, Inc.] reported that NISTAR has been measuring the irradiance from the Sun-lit Earth in three bands for more than eight years. The bands measure the outgoing reflected solar and total radiation from Earth at a limited range of solar angles. These measurements assist researchers in answering questions addressing Earth radiation imbalance and predicting future climate change. NISTAR continues to operate nominally, and the team is monitoring any in-orbit degradation. Lorentz explained the evolution of the NISTAR view angle over time. He also provided NISTAR shortwave (SW) and photodiode (PD) intercomparison. NISTAR has proven itself to be an extremely stable instrument – although measurements of the offsets have measurement errors. A relative comparison with the scaled-PD channel implies long-term agreement below a percent with a constant background.
Clark Weaver [University of Maryland, College Park (UMD)] discussed updates to a new reflected- SW energy estimate from EPIC. This new product uses generic Airborne Visible/Infrared Imaging Spectrometer (AVIRIS) aircraft observations over homogeneous scenes to spectrally interpolate between the coarse EPIC channels. This approach assumes the spectra from an EPIC pixel is a weighted combination of a solid cloud scene and the underlying (cloud-free) surface. Weaver and his team used a vector discrete ordinate radiative transfer model with a full linearization facility, called VLIDORT, to account for the different viewing/illumination geometry of the sensors. Each pixel residual between EPIC observations at six different wavelengths (between 340 and 780 nm) and the composite high-resolution spectrum from AVIRIS has been reduced by about 50%, since the last report. While the total reflected energy for a single EPIC image can be about 15 W/m2 different than the NISTAR measurement, by 2017 the offset bias was, on average, about 1 W/m2.
Andrew Lacis [GISS] said that DSCOVR measurements of Earth’s reflected solar radiation from the “L1” position offer a unique perspective for the continuous monitoring of Earth’s sunlit hemisphere. Six years of EPIC data show the seasonal and diurnal variability of Earth’s planetary albedo – but with no discernible trend. Planetary scale variability, driven by changing patterns in cloud distribution, is seen to occur at all longitudes over a broad range of time scales. The planetary albedo variability is strongly correlated at neighboring longitudes but shows strongly anticorrelated behavior at diametrically distant longitudes.
Update on EPIC Products and Science Results
EPIC has a suite of data products available. The following subsections summarize content during the DSCOVR STM related to these products. They provide updates on several of the data products and on related algorithm improvements.
Total Column Ozone
Natalya Kramarova [GSFC] reported on the status of the EPIC total O3 using the V3 algorithm. The absolute calibrations are updated every year using collocated observations from the Ozone Mapping and Profiling Suite (OMPS) on Suomi NPP. EPIC total O3 measurements are routinely compared with independent satellite and ground-based measurements. Retrieved EPIC O3 columns agree within ±5–7 Dobson Units (DU, or 1.5–2.5%) with independent observations, including those from satellites [e.g., Suomi NPP/OMPS, NASA’s Aura/Ozone Monitoring Instrument (OMI), European Union’s (EU) Copernicus Sentinel-5 Precursor/TROPOspheric Monitoring Instrument (TROPOMI)], sondes, and ground-based Brewer and Dobson spectrophotometers. The EPIC O3 record is stable and shows no substantial drifts with respect to OMPS. In the future, the EPIC O3 team plans to compare EPIC time resolved O3 measurements with observations from NASA’s Tropospheric Emissions Monitoring of Pollution (TEMPO) and the South Korean Geostationary Environment Monitoring Spectrometer (GEMS) – both in geostationary orbit. (Along with the EU’s Copernicus Sentinel-4 mission, expected to launch in 2024, these three missions form a global geostationary constellation for monitoring air quality on spatial and temporal scales that will help scientists better understand the causes, movement, and effects of air pollution across some of the world’s most populated areas.)
Jerrald Ziemke [Morgan State University] explained that tropospheric column O3 is measured over the disk of Earth every 1–2 hours. These measurements are derived by combining EPIC observations with Modern-Era Retrospective Analysis for Research and Applications (MERRA2) assimilated O3 and tropopause fields. These hourly maps are available to the public from the Langley ASDC and extend over eight years from June 2015 to present. The EPIC tropospheric O3 is now indicating post-COVID anomalous decreases of ~3 DU in the Northern Hemisphere for three consecutive years (2020–2022). Similar decreases are present in other satellite tropospheric O3 products as well as OMI tropospheric nitrogen dioxide (NO2), a tropospheric O3 precursor.
Algorithm Improvement for Ozone and Sulfur Dioxide Products
Kai Yang [UMD] presented the algorithm for retrieving tropospheric O3 from EPIC by estimating the stratosphere–troposphere separation of retrieved O3 profiles. This approach contrasts with the traditional residual method, which relies on the stratospheric O3 fields from independent sources. Validated against the near-coincident O3 sonde measurements, EPIC data biased low by a few DU (up to 5 DU), consistent with EPIC’s reduced sensitivity to O3 in the troposphere. Comparisons with seasonal means of TROPOMI tropospheric O3 show consistent spatial and temporal distributions, with lows and highs from atmospheric motion, pollution, lightning, and biomass burning. Yang also showed EPIC measurements of sulfur dioxide (SO2) from recent volcanic eruptions, including Mauna Loa and Kilauea (Hawaii, U.S., 2022–2023), Sheveluch (Kamchatka, Russia, 2023), Etna (Italy, 2023), Fuego (Guatemala, 2023), Popocatépetl (Mexico, 2023), and Pavlof and Shishaldin (Aleutian Islands, U.S., 2023). Yang reported the maximum SO2 mass loadings detected by EPIC are 430 kt from the 2022 Mauna Loa and Kilauea eruptions and 351 kt from the 2023 Sheveluch eruption.
Simon Carn [University of Michigan] showed EPIC observations of major volcanic eruptions in 2022–2023 using the EPIC L2 volcanic SO2 and UV Aerosol Index (UVAI) products to track SO2 and ash emissions. EPIC SO2 and UVAI measurements during the 2023 Sheveluch eruption show the coincident transport of volcanic SO2, ash, and Asian dust across the North Pacific. The high-cadence EPIC UVAI can be used to track the fallout of volcanic ash from eruption clouds, with implications for volcanic hazards. EPIC SO2 measurements during the November 2022 eruption of Mauna Loa volcano are being analyzed in collaboration with the U.S. Geological Survey, who monitored SO2 emissions using ground-based instruments during the eruption. Carn finished by mentioning that EPIC volcanic SO2 algorithm developments are underway including the simultaneous retrieval of volcanic SO2 and ash.
Aerosols
Myungje Choi [UMD, Baltimore County (UMBC)] presented an update on the EPIC V3 Multi-Angle Implementation of Atmospheric Correction (MAIAC) algorithm to optimize smoke aerosol models and the inversion process. The retrieved smoke/dust properties showed an improved agreement with long-term, ground-based Aerosol Robotic Network (AERONET) measurements of solar spectral absorption (SSA) and with aerosol layer height (ALH) measurements from the Cloud–Aerosol Lidar with Orthogonal Projection (CALIOP) on the Cloud–Aerosol Lidar and Infrared Pathfinder Satellite Observation (CALIPSO) mission. (Update: As of the publication of this summary, both CALIPSO and CloudSat have ended operations.) Choi reported that between 60–90% of EPIC SSA retrievals are within ±0.03 of AERONET SSA measurements, and between 56–88% of EPIC ALH retrievals are within ±1km of CALIOP ALH retrievals. He explained that the improved algorithm effectively captures distinct smoke characteristics, e.g., the higher brown carbon (BrC) fraction from Canadian wildfires in 2023 and the higher black carbon (BC) fraction from agricultural fires over Mexico in June 2023.
Sujung Go [UMBC] presented a global climatology analysis of major absorbing aerosol species, represented by BC and BrC in biomass burning smoke as well as hematite and goethite in mineral dust. The analysis is based on the V3 MAIAC EPIC dataset. Observed regional differences in BC vs. BrC concentrations have strong associations with known distributions of fuels and types of biomass burning (e.g., forest wildfire vs. agricultural burning) and with ALH retrievals linking injection heights with fire radiative power. Regional distributions of the mineral dust components have strong seasonality and agree well with known dust properties from published ground soil samples.
Omar Torres [GSFC] reported on the upgrades of the EPIC near-UV aerosol (EPICAERUV) algorithm. The EPICAERUV algorithm’s diurnal cycle of aerosol optical depth compared to the time and space collocated AERONET observations at multiple sites around the world. The analysis shows remarkably close agreement between the two datasets. In addition, Torres presented the first results of an improved UV-VIS inversion algorithm that simultaneously retrieves aerosol layer height, optical depth, and single scattering albedo.
Hiren Jethva [Morgan State University] discussed the unique product of absorbing aerosols above clouds (AAC) retrieved from EPIC near-UV observations between 340 and 388 nm. The validation analysis of the retrieved aerosol optical depth over clouds against airborne direct measurements from the NASA ObseRvations of Aerosols above CLouds and their intEractionS (ORACLES) campaign revealed a robust agreement. EPIC’s unique capability of providing near-hourly observations offered an insight into the diurnal variations of regional cloud fraction and AAC over “hotspot” regions. A new and simple method of estimating direct radiative effects of absorbing aerosols above clouds provided a multiyear timeseries dataset, which is consistent with similar estimations from Aura–OMI.
Jun Wang [University of Iowa] reported on the development and status of V1 of the L2 EPIC aerosol optical centroid height (AOCH) product – which is now publicly available through ASDC – and on improvements to the AOCH algorithm – which focus on the treatment of surface reflectance and aerosols models. He presented applications of this data product for both climate studies of Sahara dust layer height and air quality studies of surface particulate matter with diameter of 2.5 µm or less (PM2.5). In addition, Wang showed the comparisons of EPIC AOCH data product with those retrieved from TROPOMI and GEMS and discussed ongoing progress to reduce the AOCH data uncertainty that is estimated to be 0.5 km (0.3 mi) over the ocean and 0.8 km (0.5 mi) over land.
Clouds
Yuekui Yang [GSFC] explained the physical meaning of EPIC cloud effective pressure (CEP) in an “apples-to-apples” comparison with CEP measurements from the Global Ozone Monitoring Experiment 2 (GOME-2) on the European Operational Meteorology (MetOp) satellites. The results showed that the two products agreed well.
Yaping Zhou [UMBC] showed how current EPIC O2 A-band and B-band use Moon calibrations due to lack of in-flight calibration and other comparable in-space instruments for absolute calibration. This approach is ineffective at detecting small changes in instrument response function (IRF). This study examined the O2 band’s calibration and stability using a unique South Pole location and Radiative Transfer Model (RTM) simulations with in situ soundings and surface spectral albedo and bidirectional reflectance distribution function (BRDF) measurements as input. The results indicate EPIC simulations are within 1% of observations for non-absorption bands, but large discrepancies exist for the O2 A-band (15.63%) and O2 B-band (5.76%). Sensitivity studies show the large discrepancies are unlikely caused by uncertainties in various input, but a small shift (-0.2–0.3 nm) of IRF could account for the model observation discrepancy. On the other hand, observed multiyear trends in O2 band ratios in the South Pole can be explained with orbital shift – which means the instrument is stable.
Alfonso Delgado Bonal [UMBC] used the EPIC L2 cloud data to characterize the diurnal cycles of cloud optical thickness. To fully exploit the uniqueness of DSCOVR data, all clouds were separated in three groups depending on their optical thickness: thin (0–3), medium (3–10), and thick (3–25). Bonal explained that there is a predictable pattern for different latitudinal zones that reaches a maximum around noon local time – see Figure 2. It was also shown that that the median is a better measure of central tendency when describing cloud optical thickness.
Figure 2. Daytime variability of the median liquid cloud optical thickness over the ocean for different seasons of the year derived using EPIC L2 data. The various colored curves represent data collected in different seasons of the year. The black curve represents the annual average – which is most useful for calculations of cloud optical thickness. Figure credit: Alfonso Delgado Bonal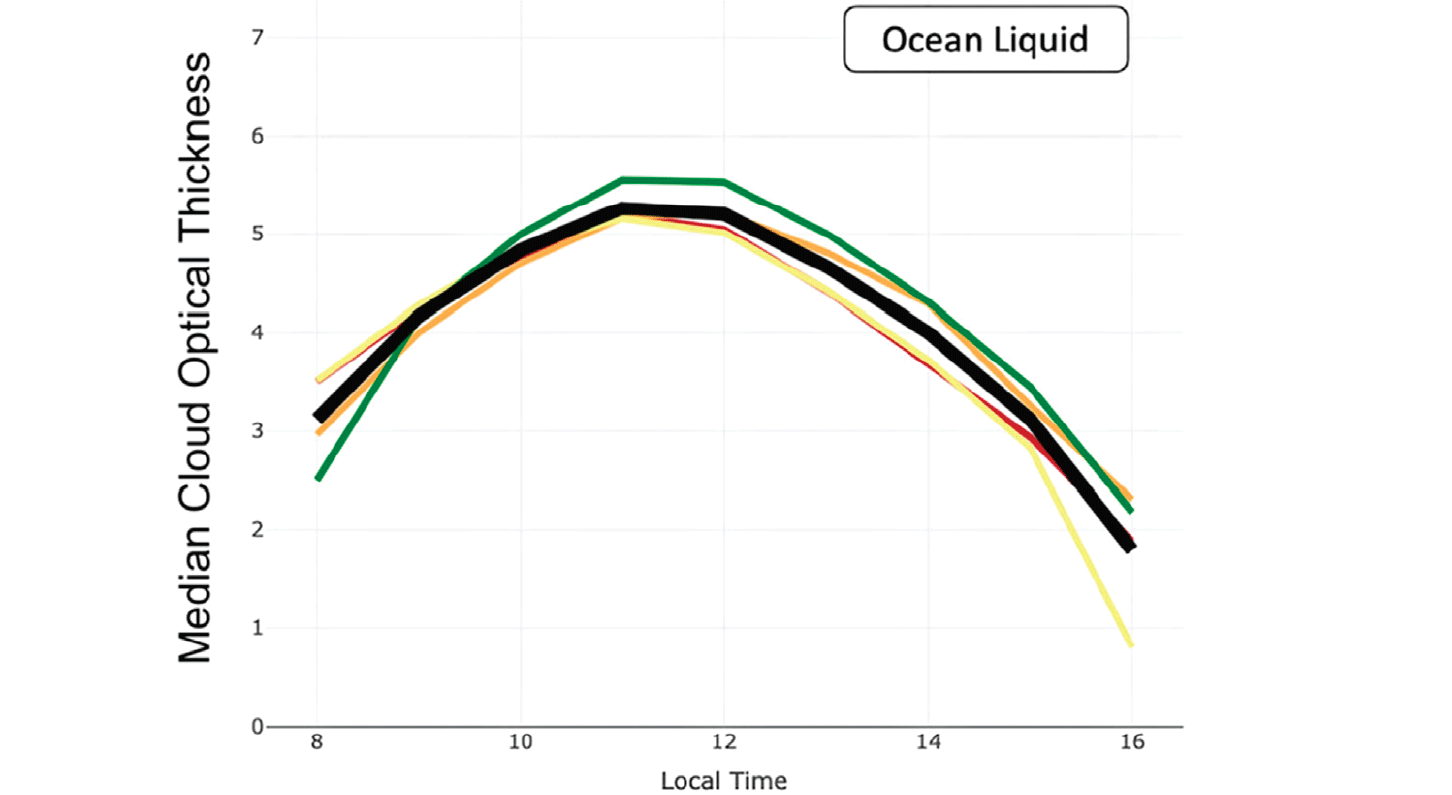
Elizabeth Berry [Atmospheric and Environmental Research (AER)] reported on how coincident observations from EPIC and the Cloud Profiling Radar (CPR) on CloudSat have been used to train a machine learning model to predict cloud vertical structure. A XGBoost decision tree model used input (e.g., EPIC L1B reflectance, L2 Cloud products, and background meteorology) to predict a binary cloud mask on 25 vertical levels. Berry discussed model performance, feature importance, and future improvements.
Ocean
Robert Frouin [Scripps Institution of Oceanography, University of California] discussed ocean surface radiation products from EPIC data. He reported that surface radiation products were developed to address science questions pertaining to biogeochemical cycling of carbon, nutrients, and oxygen as well as mixed-layer dynamics and circulation. These products include daily averaged downward planar and scalar irradiance and average cosine for total light just below the surface in the EPIC spectral bands centered on 317.5, 325, 340, 388, 443, 551, and 680 nm and integrated values over the photosynthetically active radiation (PAR) and UV-A spectral ranges. The PAR-integrated quantities were evaluated against in situ data collected at sites in the North Atlantic Ocean and Mediterranean Sea. Frouin and his colleagues have also developed, tested, and evaluated an autonomous system for collecting and transmitting continuously spectral UV and visible downward fluxes.
Vegetation
Yuri Knyazikhin [Boston University] reported on the status of the Vegetation Earth System Data Record (VESDR) and discussed science with vegetation parameters. A new version of the VESDR software was delivered to NCCS and implemented for operational generation of the VESDR product. The new version passed tests of physics (e.g., various relationships between vegetation indices and vegetation parameters derived from the VESDR) and follow regularities reported in literature. Analysis of hotspot signatures derived from EPIC and from the Multiangle Imaging Spectroradiometer (MISR) on Terra over forests in southeastern Democratic Republic of the Congo reaffirms that long-term precipitation decline has had minimal impact on leaf area and leaf optical properties.
Jan Pisek [University of Tartu/Tartu Observatory, Estonia] reported on the verification of the previously modeled link between the directional area scattering factor (DASF) from the EPIC VESDR product and foliage clumping with empirical data. The results suggest that DASF can be accurately derived from satellite observations and provide new evidence that the photon recollision probability theory concepts can be successfully applied even at a fairly coarse spatial resolution.
Sun Glint
Tamás Várnai [UMBC] discussed the EPIC Glint Product as well as impacts of sun glint off ice clouds on other EPIC data products – see Figure 3. The cloud glints come mostly from horizontally oriented ice crystals and have strong impact in EPIC cloud retrievals. Glints increase retrieved cloud fraction, the retrieved cloud optical depth, and cloud height. Várnai also reported that the EPIC glint product is now available at the ASDC. It is expected that glints yield additional new insights about the microphysical and radiative properties of ice clouds.
Figure 3. EPIC image taken over Mexico on July 4, 2018. The red, white and blue spot over central Mexico is the result of Sun glint reflecting off high clouds containing ice crystals. EPIC is particularly well suited for studies of ice clouds that cause Sun glint, because unlike most other instruments, it uses a filter wheel to take images at multiple wavelengths, which means the image for each wavelength is obtained at a slightly different time. For example, it takes four minutes to cycle from red to blue. During that time, Earth moves by ~100 km (~62 mi) meaning each image will capture a slightly different scene. Brightness contrasts between images can be used to identify glint signals. Image credit: Tamas Vanai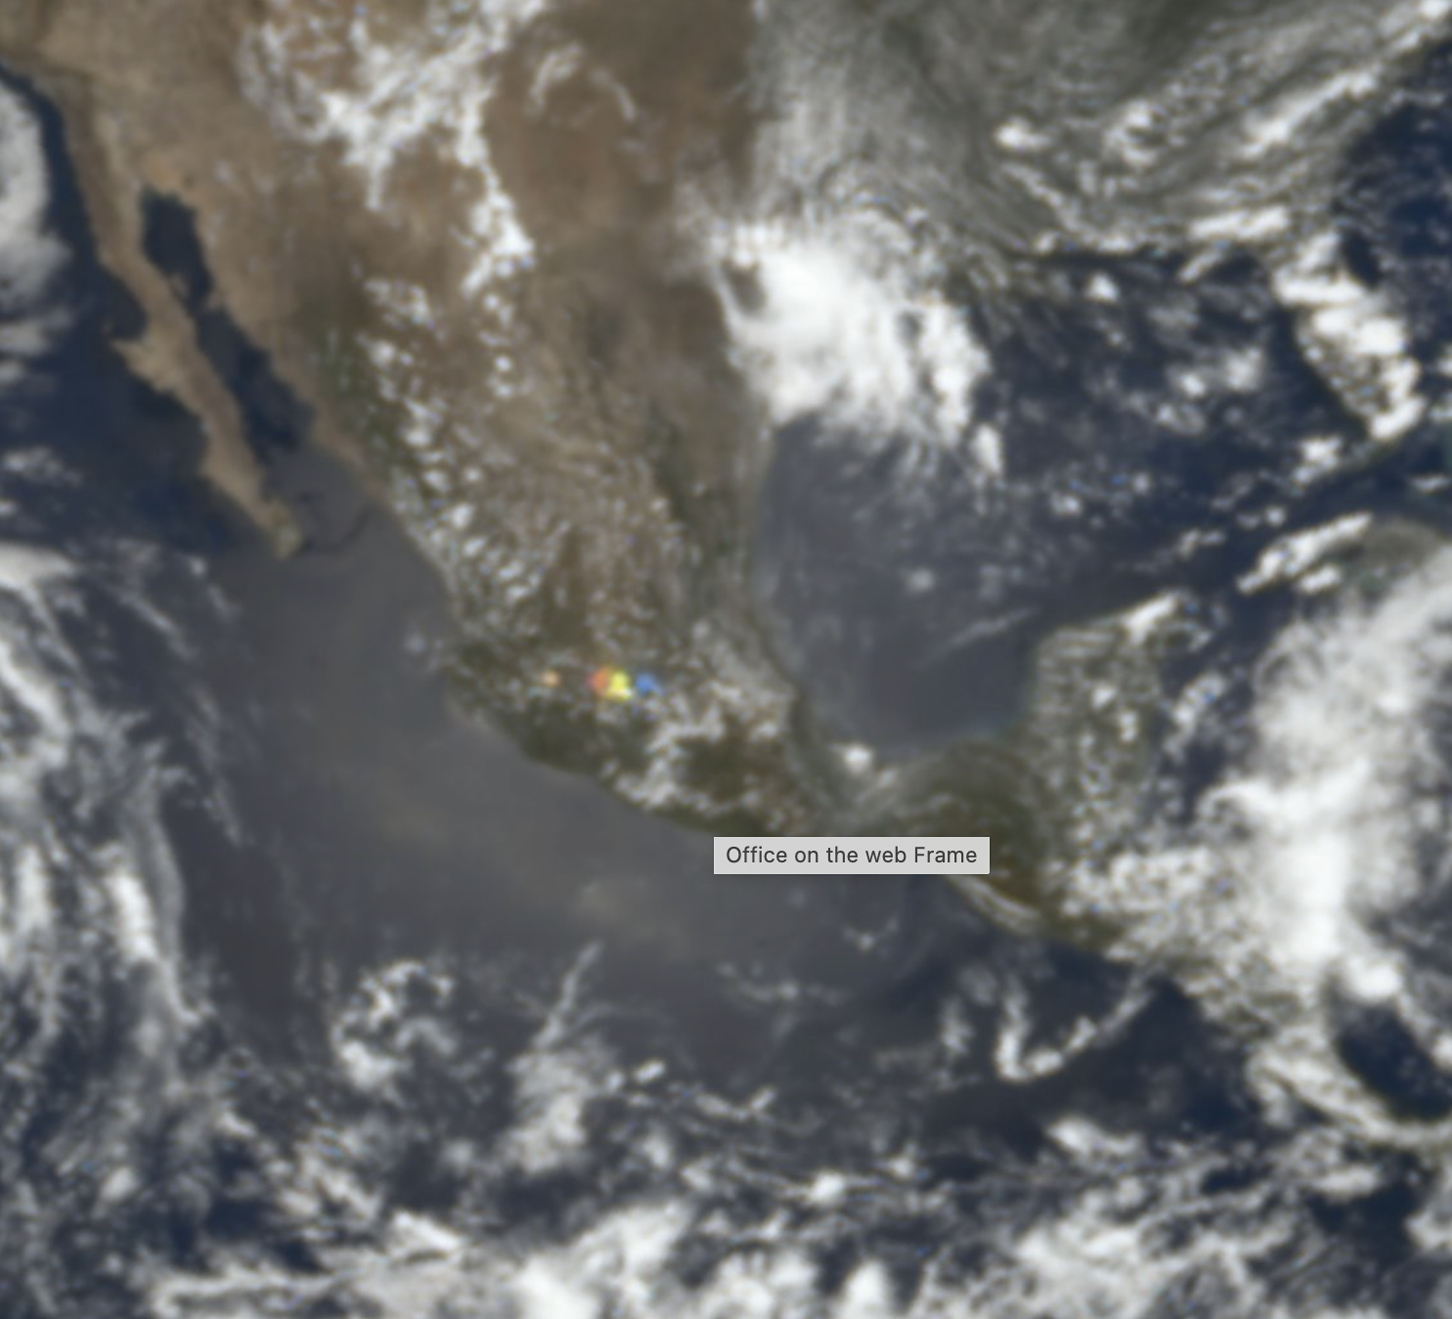
Alexander Kostinski [Michigan Technology University] reported on long-term changes and semi-permanent features, e.g., ocean glitter. They introduced pixel-pinned temporally and conditionally averaged reflectance images, uniquely suited to the EPIC observational circumstances. The preliminary resulting images (maps), averaged over months and conditioned on cover type (land, ocean, or clouds), show seasonal dependence at a glance (e.g., by an apparent extent of polar caps).
More EPIC Science Results
Guoyong Wen [Morgan State University] discussed spectral properties of the EPIC observations near backscattering, including four cases when the scattering angle reaches about 178° (only 2° from perfect backscattering). The enhancement addresses changes in scattering angle observed in 2020. (Scattering angle is a function of wavelength, because according to Mie scattering theory, the cloud scattering phase function in the glory region is wavelength dependent.) Radiative transfer calculations showed that the change in scattering angles has the largest impact on reflectance in the red and NIR channels at 680 nm and 780 nm and the smallest influence on reflectance in the UV channel at 388 nm – consistent with EPIC observations. The change of global average cloud amount also plays an important role in the reflectance enhancement.
Nick Gorkavyi [SSAI] talked about future plans to deploy a wide-angle camera and a multislit spectrometer on the Moon’s surface for whole-Earth observations to complement EPIC observations. Gorkavyi explained that the apparent vibrational movement of Earth in the Moon’s sky complicates observations of Earth. This causes the center of Earth to move in the Moon’s sky in a rectangle, measuring 13.4° × 15.8° with a period of 6 years.
Jay Herman [UMBC] reported on EPIC O3 and trends from combining Nimbus 7/Solar Backscatter Ultraviolet (SBUV), the SBUV-2 series, and OMPS–Nadir Mapper (NM) data. (OMPS is made up of three instruments: a Nadir Mapper (NM), Nadir Profiler, and Limb Profiler. OMPS NM is a total ozone sensor). Herman compared EPIC O3 data to OMPS NM data, which showed good agreement (especially summer values) for moderate solar zenith angle (SZA). Comparison with long-term O3 time series (1978–2021) revealed that there were trends and latitude dependent O3 turn-around dates (1994–1998). Herman emphasized that global O3 models do not show this effect but rather have only a single turn-around date around 2000.
Alexander Radkevich [LaRC] presented a poster that showed a comparative analysis of air quality monitoring by orbital and suborbital NASA missions using the DSCOVR EPIC O3 product as well as Pandora total O3 column retrievals. Comparison of the June 2023 total column O3 from EPIC data to the same periods in previous years revealed a significant – around 50 DU – increase of total O3 column in the areas impacted by the plume from 2023 Canadian wildfires.
Conclusion
At the end of the meeting Alexander Marshak, Jay Herman, and Adam Szabo discussed how to make the EPIC and NISTAR instruments more visible in the community. The EPIC website now allows visitors to observe daily fluctuations of aerosol index, cloud fraction, and the ocean surface – as observed from the “L1” point, nearly one million miles away from Earth! More daily products, (e.g., cloud and aerosol height, total leaf area index, and sunlit leaf area index) will be added soon.
The 2023 DSCOVR EPIC and NISTAR Science Team Meeting provided an opportunity to learn the status of DSCOVR’s Earth-observing instruments, EPIC and NISTAR, the status of recently released L2 data products, and the science results being achieved from the “L1” point. As more people use DSCOVR data worldwide, the ST hopes to hear from users and team members at its next meeting. The latest updates from the mission are found on the EPIC website. (UPDATE: The next DSCOVR EPIC and NISTAR STM will be held on October 16–18, 2024. Check the website for more details as the date approaches.)
Alexander Marshak
NASA’s Goddard Space Flight Center
alexander.marshak@nasa.gov
Adam Szabo
NASA’s Goddard Space Flight Center
adam.szabo@nasa.gov
NASA’s Hubble Restarts Science in New Pointing Mode
3 min read
NASA’s Hubble Restarts Science in New Pointing Mode This image of NASA’s Hubble Space Telescope was taken on May 19, 2009 after deployment during Servicing Mission 4. NASA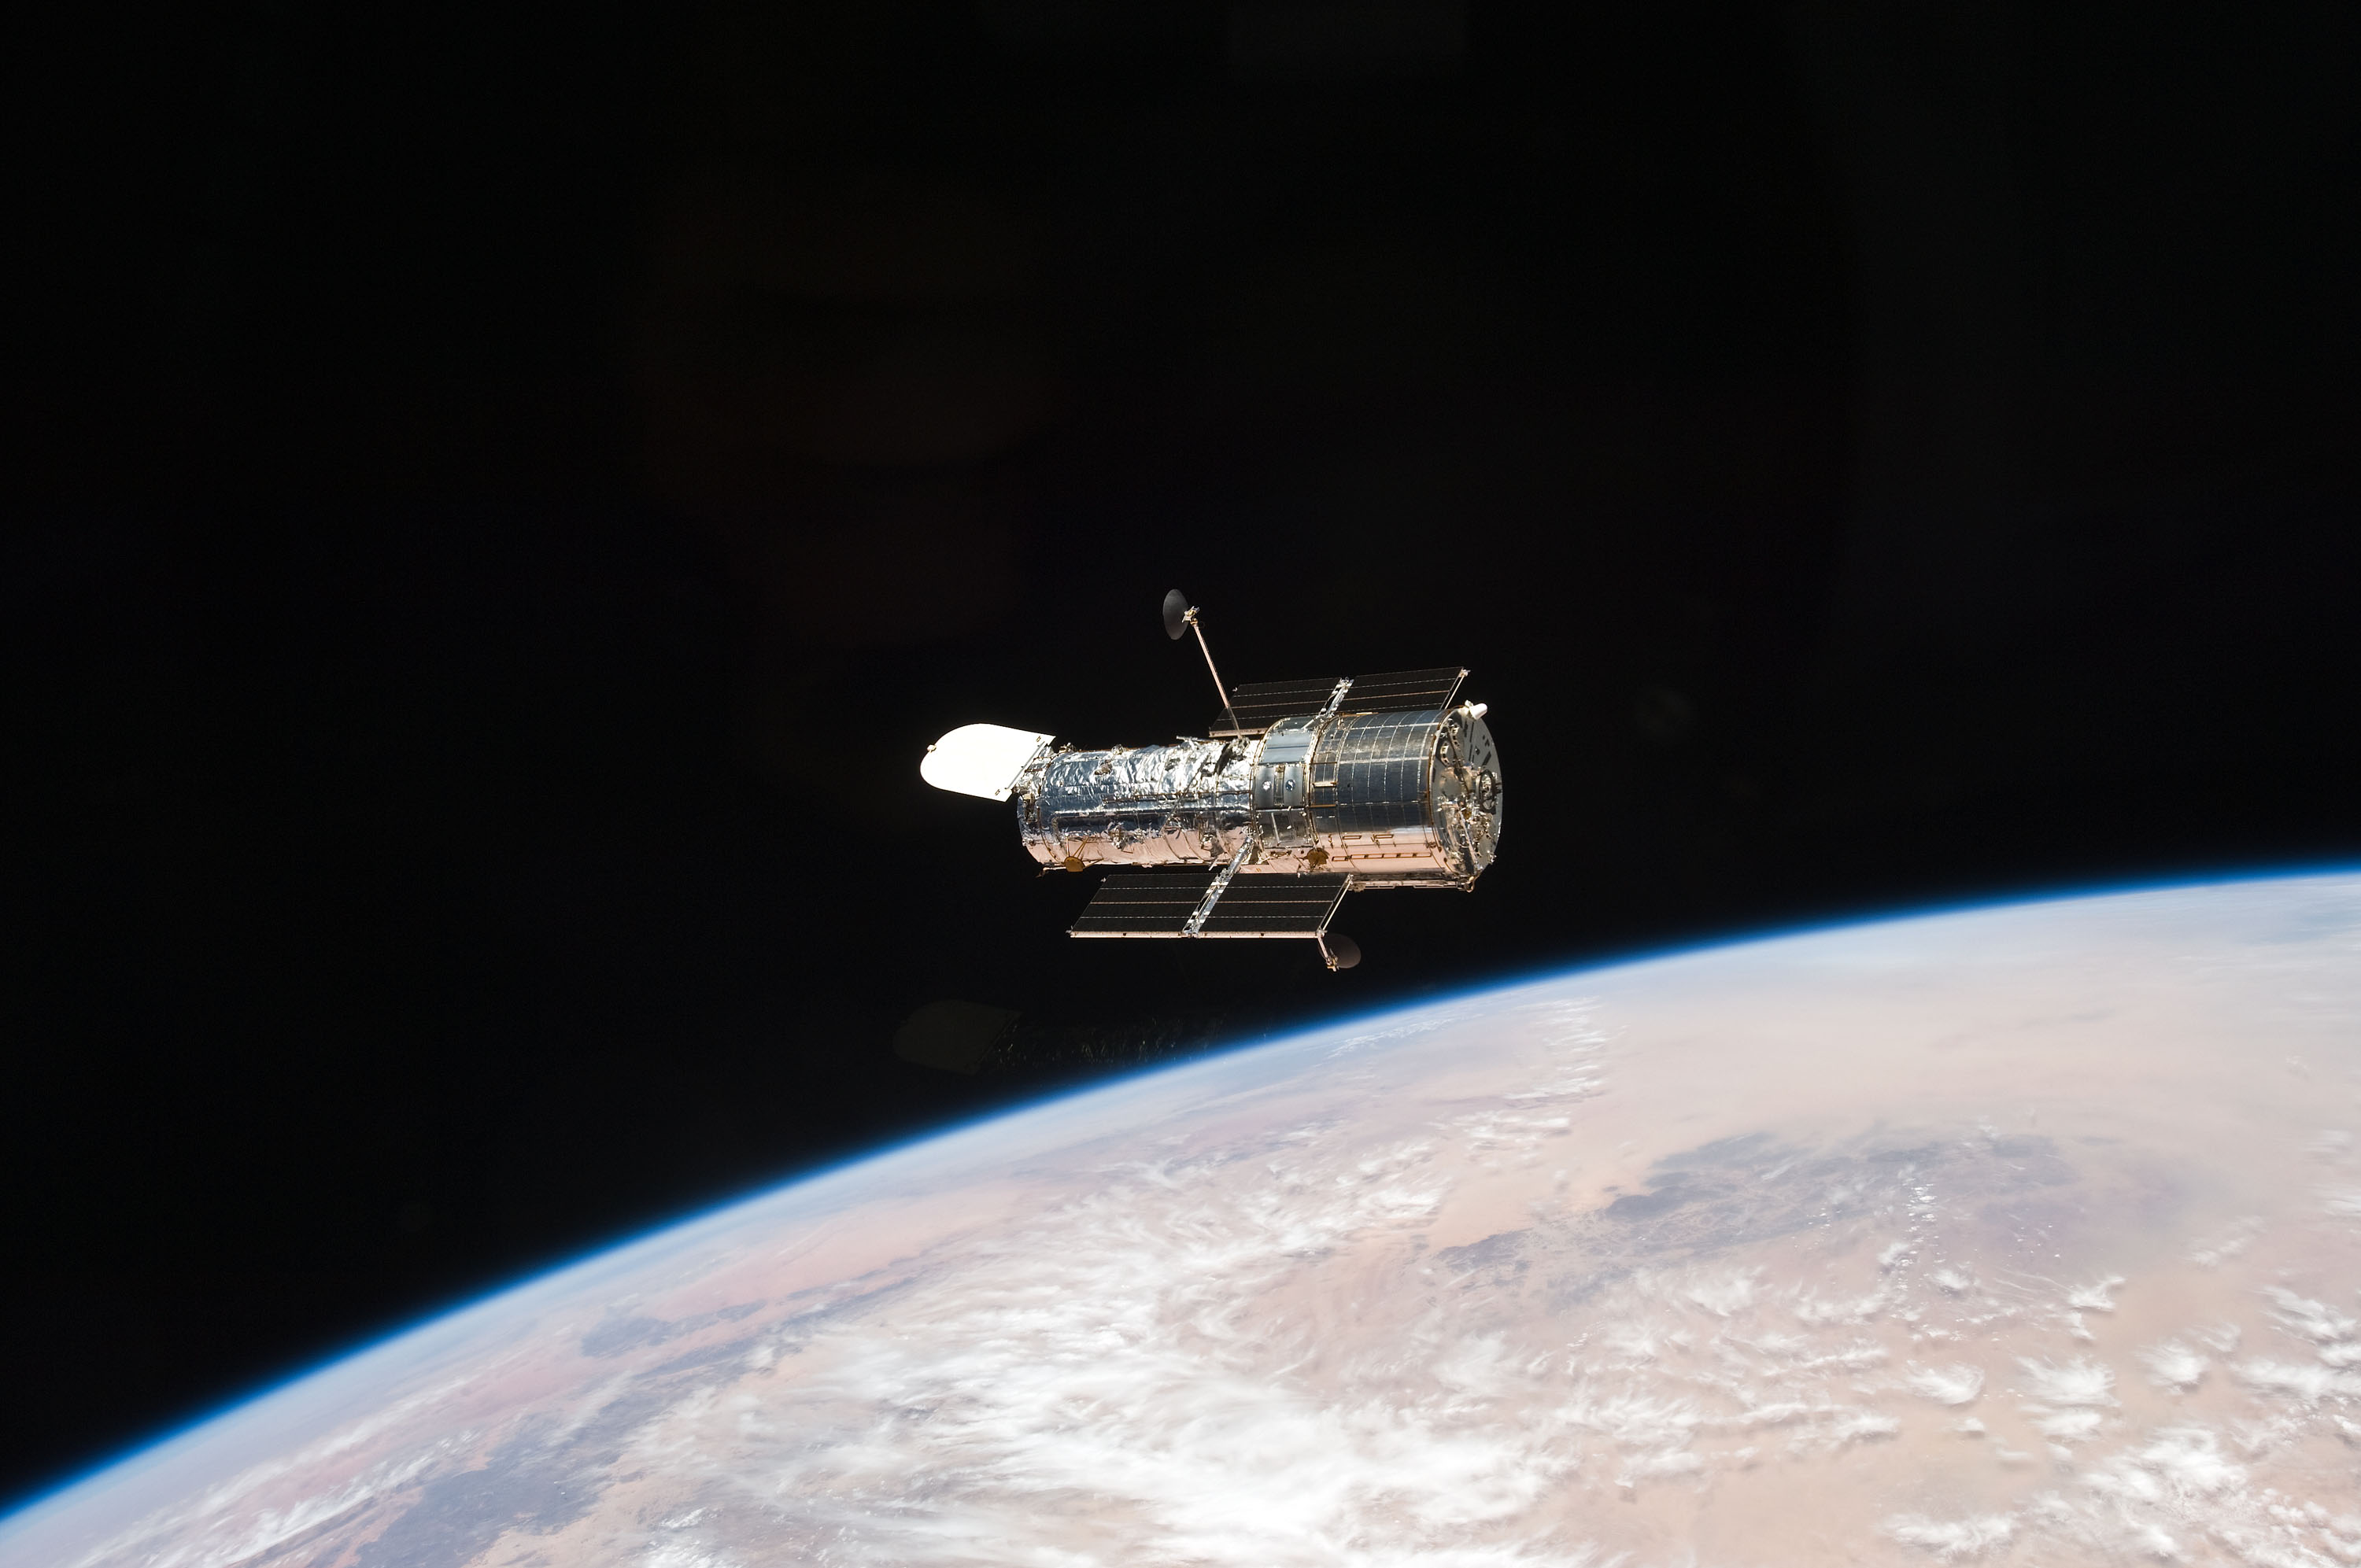
NASA successfully transitioned operations for the agency’s Hubble Space Telescope to an alternate operating mode that uses one gyro, returning the spacecraft to daily science operations Friday. The telescope and its instruments are stable and functioning normally.
Hubble went into safe mode May 24 due to an ongoing issue with one of its gyroscopes (gyros), which measure the telescope’s slew rates and are part of the system that determines and controls the direction the telescope is pointed. The gyro had been increasingly returning faulty readings over the past six months, suspending science operations multiple times. This led the Hubble team to transition from a three-gyro operating mode to observing with only one gyro, enabling more consistent science observations and keeping another operational gyro available for future use. The agency discussed this transition in detail during a media teleconference June 4.
The team will continue monitoring the problematic gyro to see if it stabilizes and can be used again in the future. Although there are some minor limitations to observing in one-gyro mode, Hubble can continue doing most of its science observations. Further refinements to optimize operations are anticipated as the team gains more experience with the one-gyro mode.
Launched in 1990, Hubble has more than doubled its expected design lifetime, and has been observing the universe for more than three decades, recently celebrating its 34th anniversary. Read more about some of Hubble’s greatest scientific discoveries.
NASA’s Hubble Temporarily Pauses ScienceOriginally Published May 31, 2024
NASA’s Hubble Space Telescope entered safe mode May 24 due to an ongoing gyroscope (gyro) issue, suspending science operations. Hubble’s instruments are stable, and the telescope is in good health.
The telescope automatically entered safe mode when one of its three gyroscopes gave faulty telemetry readings. Hubble’s gyros measure the telescope’s slew rates and are part of the system that determines and controls precisely the direction the telescope is pointed. NASA will provide more information early the first week of June.
NASA anticipates Hubble will continue making discoveries throughout this decade and possibly into the next, working with other observatories, such as the agency’s James Webb Space Telescope for the benefit of humanity.
Launched in 1990, Hubble has been observing the universe for more than three decades and recently celebrated its 34th anniversary. Read more about some of Hubble’s greatest scientific discoveries.
ResourcesDownload the image above
Hubble Pointing and Control
Operating Hubble with Only One Gyroscope
Hubble Science Highlights
Hubble Images
Facebook logo @NASAHubble @NASAHubble Instagram logo @NASAHubble
Media Contact:
Claire Andreoli
NASA’s Goddard Space Flight Center, Greenbelt, MD
claire.andreoli@nasa.gov
Since its 1990 launch, the Hubble Space Telescope has changed our fundamental understanding of the universe.
Galaxies Stories
Stars Stories
James Webb Space Telescope
Webb is the premier observatory of the next decade, serving thousands of astronomers worldwide. It studies every phase in the…
NASA’s LRO Spots China’s Chang’e 6 Spacecraft on Lunar Far Side
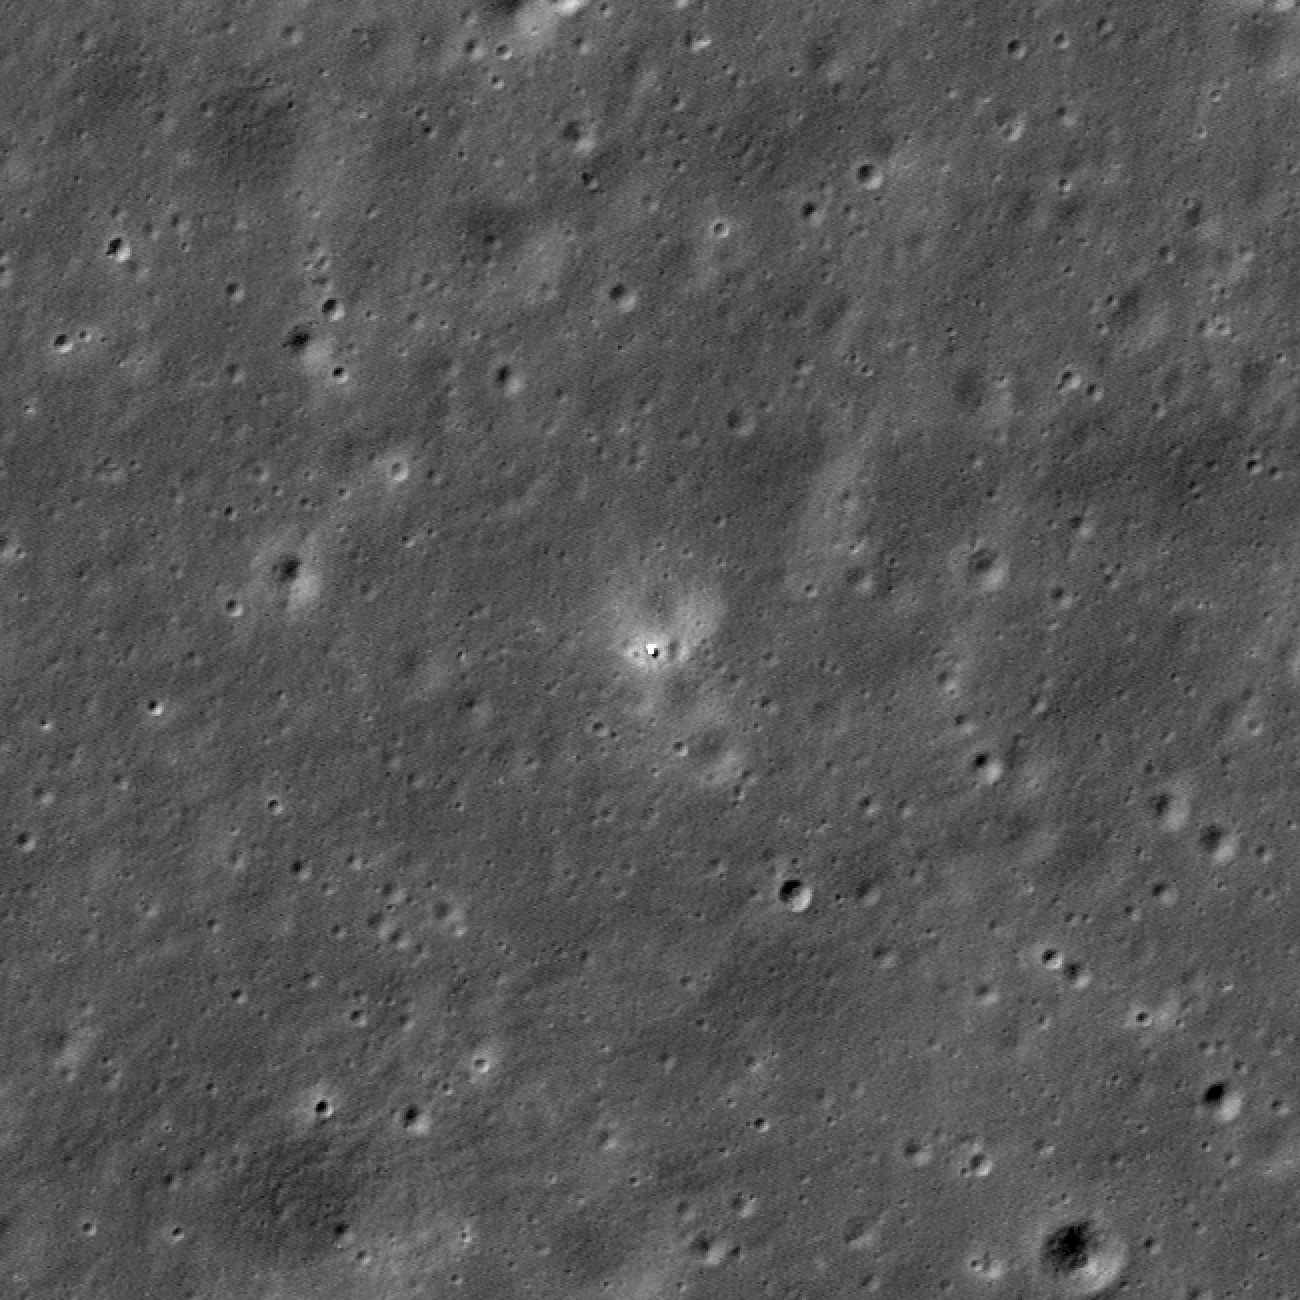
NASA’s LRO (Lunar Reconnaissance Orbiter) imaged China’s Chang’e 6 sample return spacecraft on the far side of the Moon on June 7. Chang’e 6 landed on June 1, and when LRO passed over the landing site almost a week later, it acquired an image showing the lander on the rim of an eroded, 55-yard-diameter (about 50 meters) crater.
The LRO Camera team computed the landing site coordinates as about 42 degrees south latitude, 206 degrees east longitude, at an elevation of about minus 3.27 miles (minus 5,256 meters).
This before and after animation of LRO images shows the appearance of the Chang’e 6 lander. The increased brightness of the terrain surrounding the lander is due to disturbance from the lander’s engines and is similar to the blast zone seen around other lunar landers. The before image is from March 3, 2022, and the after image is from June 7, 2024.Credit: NASA/Goddard/Arizona State University
The Chang’e 6 landing site is situated toward the southern edge of the Apollo basin (about 306 miles or 492 km in diameter, centered at 36.1 degrees south latitude, 208.3 degrees east longitude). Basaltic lava erupted south of Chaffee S crater about 3.1 billion years ago and flowed downhill to the west until it encountered a local topographic high, likely related to a fault. Several wrinkle ridges in this region have deformed and raised the mare surface. The landing site sits about halfway between two of these prominent ridges. This basaltic flow also overlaps a slightly older flow (about 3.3 billion years old), visible further west, but the younger flow is distinct because it has higher iron oxide and titanium dioxide abundances.
A regional context map of the Chang’e 6 landing site. Color differences have been enhanced for clarity. The dark area is a basaltic mare deposit; bluer areas of the mare are higher-titanium flows. Contour lines marking 100-meter (about 328 feet) elevation intervals are overlaid to provide a sense of the topography. Image is about 118 miles (190 km) across. Credit: NASA/Goddard/Arizona State University
LRO is managed by NASA’s Goddard Space Flight Center in Greenbelt, Maryland, for the Science Mission Directorate at NASA Headquarters in Washington. Launched on June 18, 2009, LRO has collected a treasure trove of data with its seven powerful instruments, making an invaluable contribution to our knowledge about the Moon. NASA is returning to the Moon with commercial and international partners to expand human presence in space and bring back new knowledge and opportunities.
More on this story from Arizona State University's LRO Camera websiteMedia Contact:
Nancy N. Jones
NASA’s Goddard Space Flight Center, Greenbelt, Md.
Astronauts could mix moon dust with old satellites to make fuel
Echoes of Flares from the Milky Way’s Supermassive Black Hole
The supermassive black hole at the heart of our Milky Way Galaxy is a quiet monster. However, Sagittarius A* (or Sgr A* for short) is not totally dormant. Occasionally it gobbles down a blob of molecular gas or even a star and then suffers a bit of indigestion. That emits x-ray flares to surrounding space.
Sgr A* is the closest supermassive black hole to Earth, at a distance of 26,000 light-years. Studying the nearby environment is tough due to the black hole’s intense gravitational pull. It distorts the view of nearby objects, making them difficult to observe. However, there are ways to do it by looking at the effect of its flares on nearby molecular clouds. Astronomers recently found the centuries-old echoes of previously unknown flares that occurred long before there were telescopes to observe them. Those echoes indicate that Sgr A* eats fairly often.
Two researchers from Michigan State University—Grace Sanger-Johnson and Jack Uteg—studied the flares and their light-echoes in detail. What they found shows activity at Sgr A* in the very distant past when Sgr A* ingested material. X-ray emissions from that activity traveled for hundreds of years from Sgr A* to bounce off of and brighten a nearby molecular cloud. That created a light echo that traveled another roughly 26,000 years before reaching Earth. So, when Uteg and Sanger studied these flares and light echoes, they were literally looking into the past.
Astronomers do know about outbursts from Sgr A* from other observations. Here’s a view from NASA’s Imaging X-ray Polarimetry Explorer and Chandra X-ray Observatory. The combination of IXPE and Chandra data helped researchers determine that the X-ray light identified in the molecular clouds originated from Sagittarius A* during an outburst approximately 200 years ago. Credits: IXPE: NASA/MSFC/F. Marin et al; Chandra: NASA/CXC/SAO; Image Processing: L.Frattare, J.Major & K.Arcand Searching for Sgr A* X-ray Flares with NuSTARSanger-Johnson analyzed ten years’ worth of data looking for X-ray flares generated by Sgr A*’s eating habits. During the search, she found evidence for nine more such outbursts.
The flares are typically quite dramatic. Because they’re so bright, they provide astronomers a chance to study the immediate environment around the black hole. The data Sanger-Johnson studied came from the NuSTAR mission. It zeroes in on high-energy X-ray and gamma-ray emissions. These typically come from active regions in the hearts of galaxies, supernova explosions, and other active events.
The data Sanger-Johnson collected and analyzed is now a database of flares from Sgr A. “We hope that by building up this bank of data on Sgr A flares, we and other astronomers can analyze the properties of these X-ray flares and infer the physical conditions inside the extreme environment of the supermassive black hole,” Sanger-Johnson said.
Tracking the Echoes of FlaresWhile Sanger-Johnson was working with the NuSTAR data, undergraduate researcher Jack Uteg studied the activity around the black hole. He analyzed 20 years of data about a giant molecular cloud called “the Bridge”. The data came from observations made by NuSTAR and the European Space Agency’s XMM-Newton observatory. The Bridge lies close to Sgr A* and normally wouldn’t give off its own light.
So, astronomers took notice when it brightened up in X-rays, according to Uteg, who is constructing a timeline of Sgr A‘s past outbursts. “The brightness we see is most likely the delayed reflection of past X-ray outbursts from Sgr A,” he said. “We first observed an increase in luminosity around 2008. Then, for the next 12 years, X-ray signals from the Bridge continued to increase until it hit peak brightness in 2020.”
Uteg’s work helped astronomers determine that Sgr A* was about five orders of magnitude brighter in X-rays than it is now. That brightening indicates our central supermassive black hole had probably cannibalized a nearby gas cloud. And, the brightness revealed other properties, according to Uteg. “One of the main reasons we care about this cloud getting brighter is that it lets us constrain how bright the Sgr A* outburst was in the past,” he said.
What Those Light-echoes from Sgr A* RevealThanks to Sanger-Brown and Uteg’s work, astronomers have another way around the difficulties of observing around black holes. “Both flares and fireworks light up the darkness and help us observe things we wouldn’t normally be able to,” she said. “That’s why astronomers need to know when and where these flares occur, so they can study the black hole’s environment using that light.”
Astronomers know that the black hole does gobble up nearby material on a variable basis, but these findings help them constrain how often it happens and how the resulting flares affect the nearby neighborhood. Many questions remain about how often these flares occur and have happened in the past, according to MSU assistant professor Shuo Zhang, who acted as team lead for these two studies.
“This is the first time that we have constructed a 24-year-long variability for a molecular cloud surrounding our supermassive black hole that has reached its peak X-ray luminosity,” Zhang said. “It allows us to tell the past activity of Sgr A* from about 200 years ago. Our research team at MSU will continue this ‘astroarchaeology game’ to further unravel the mysteries of the Milky Way’s center.”
These results of the MSU team’s work were presented at the summer 2024 meeting of the American Astronomical Society.
For More Information‘Flares’ and ‘Echoes’ from the Milky Way’s Monster Black Hole
The post Echoes of Flares from the Milky Way’s Supermassive Black Hole appeared first on Universe Today.
Johnson Celebrates LGBTQI+ Pride Month: Meet Michael Chandler
Michael Chandler has provided configuration and data management support at Houston’s Johnson Space Center for the last 13 years. After roughly seven years supporting the Exploration Systems Development Division, Chandler transitioned to the Moon to Mars Program Office in 2019. He and his team work to ensure that the baseline for Moon to Mars products, like agreements and documents, is appropriately controlled and that configuration and data management processes are integrated across the office’s six programs – Orion, Gateway, EHP, Space Launch System, Human Landing system, and Exploration Ground Systems.
“The most rewarding part of my job is not only the magnitude of what I have the privilege of working on every day, returning humans to the surface of the Moon, but also the experience I get in working with such a diverse group of members of the aerospace community,” said Chandler, a contractor with The Aerospace Corporation. “It’s also so rewarding to work as a team on a common goal and to look forward to the work I do every day!”
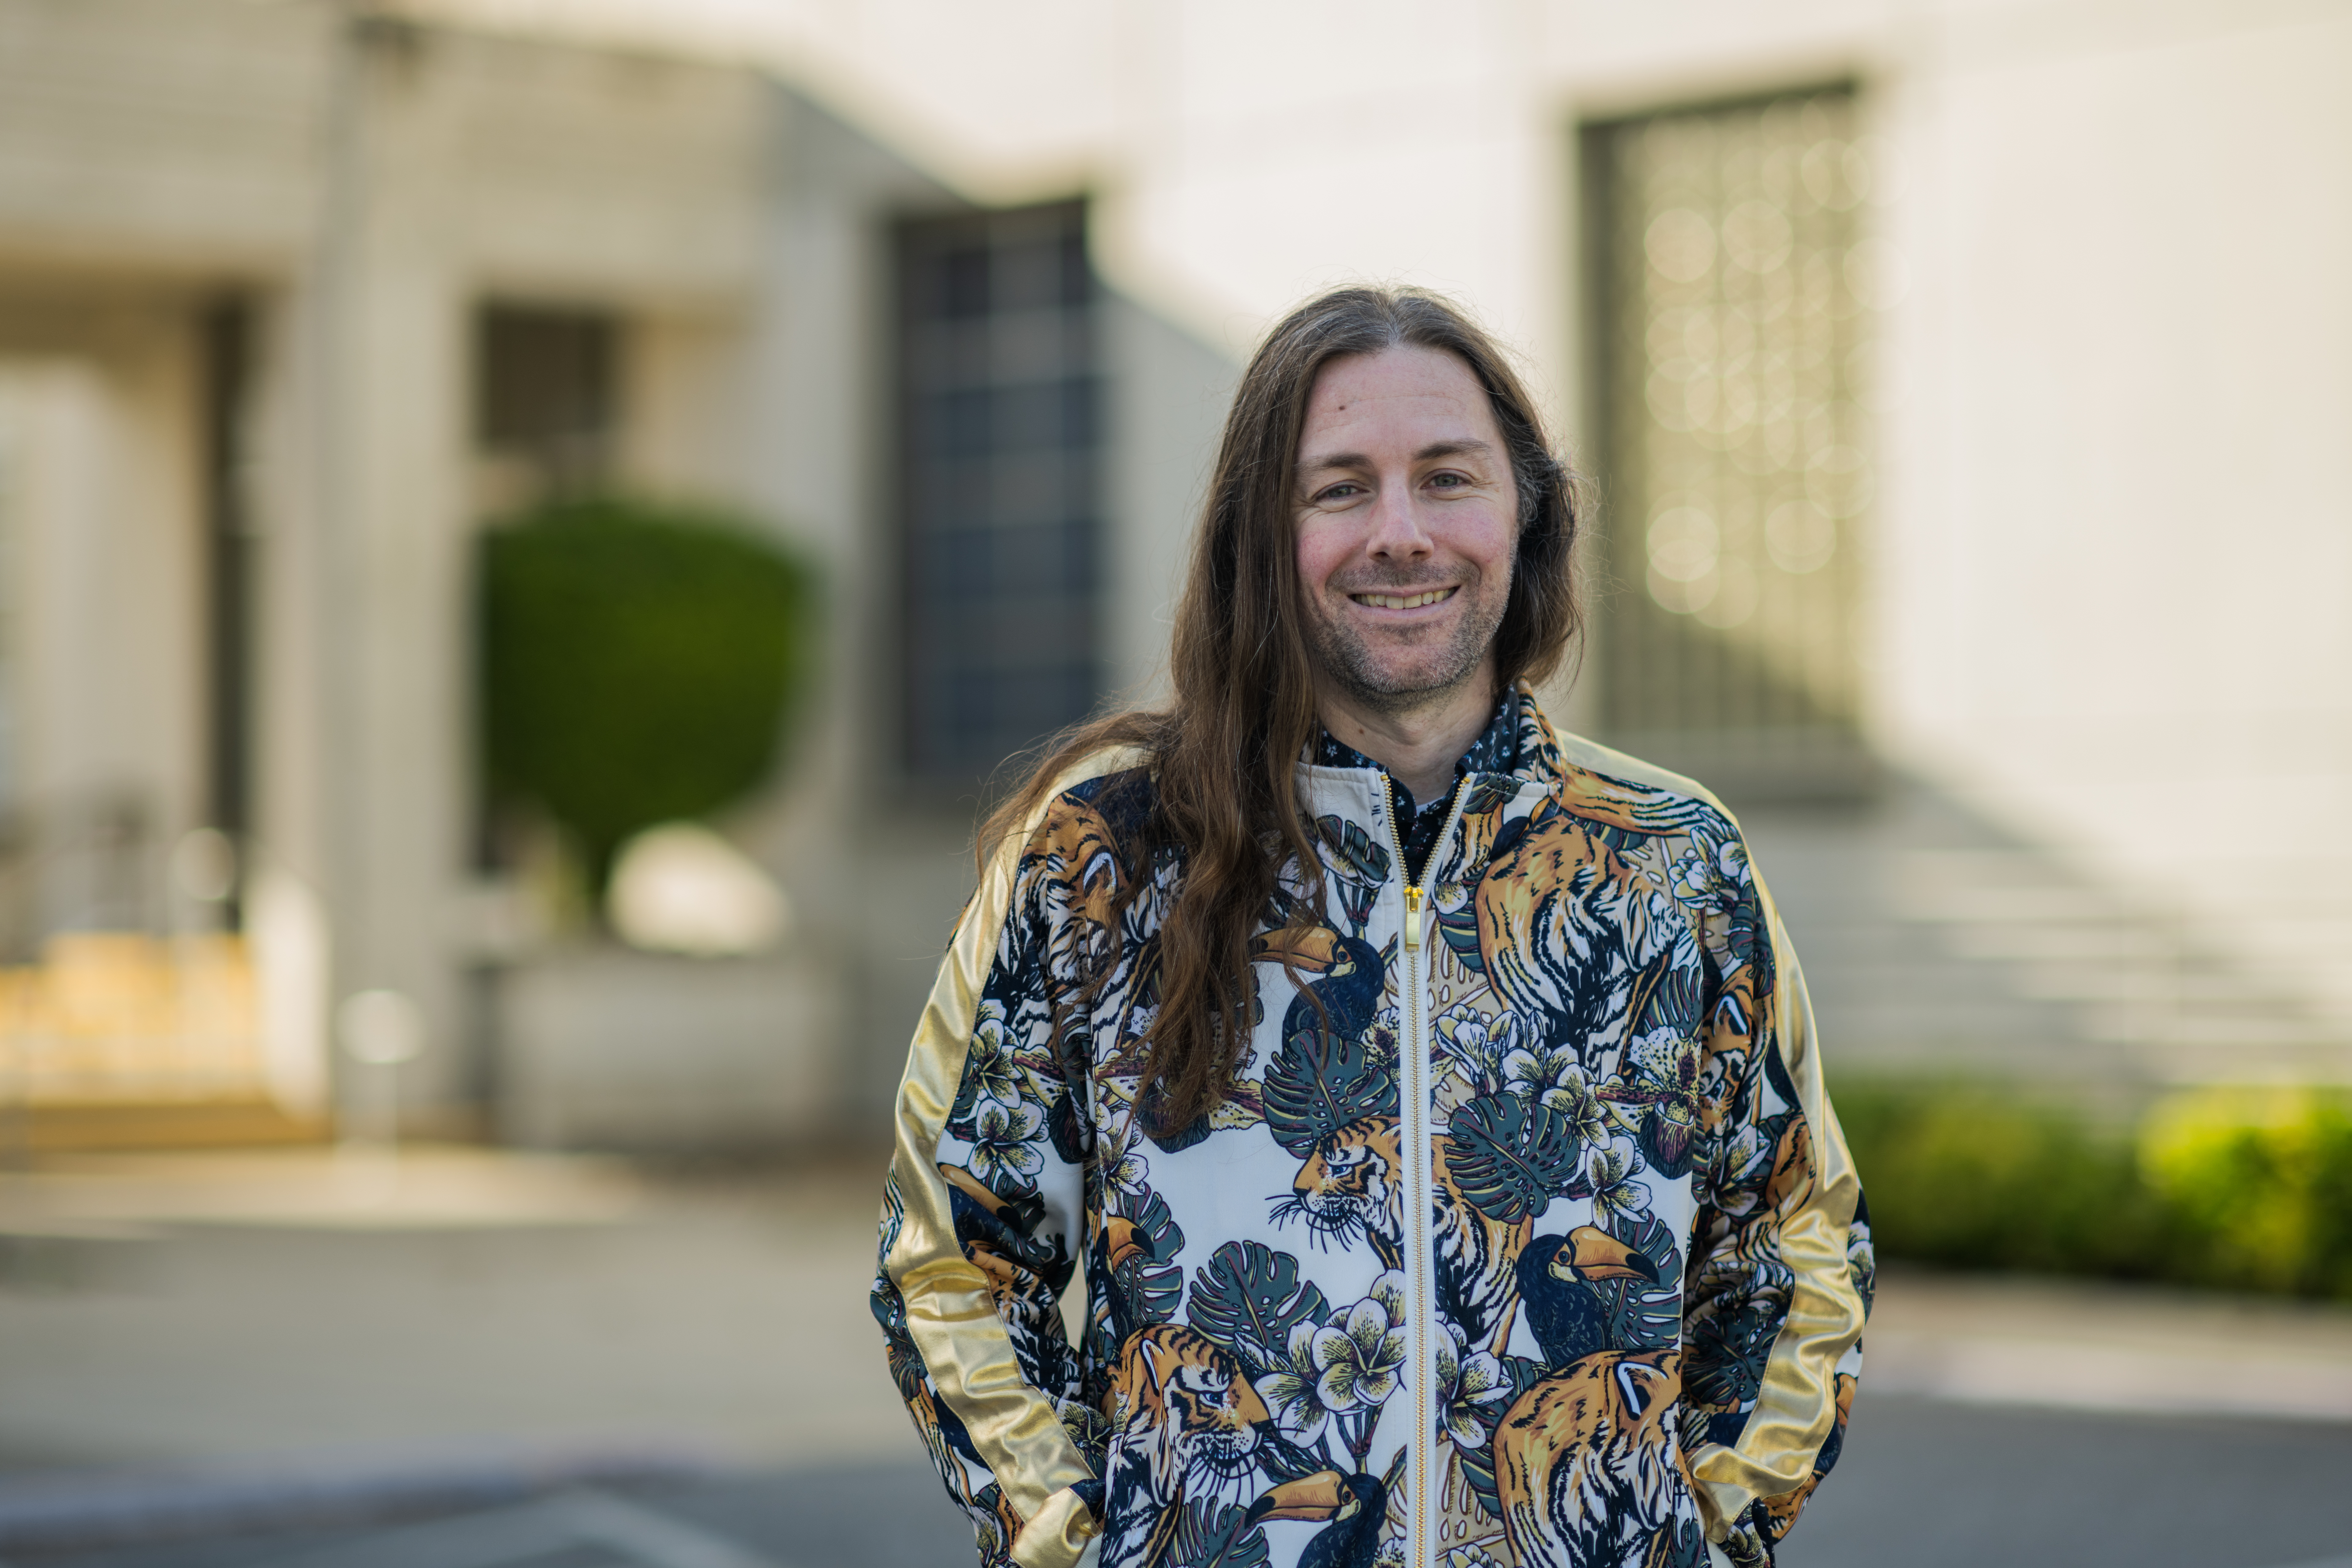
Portrait of Michael Chandler onsite at Johnson Space Center. NASA/Noah Moran
Chandler has been an active member of the Out & Allied Employee Resource Group (OAERG) since 2018 and says his involvement with the group led to some groundbreaking life events. “I was very shy and reticent about revealing who I was until I got involved with Out & Allied,” he said. “I now believe that being ‘out’ is a way to support and encourage others to be themselves.”
Chandler learned about OAERG while attending a training about how to be an ally for the LGBTQ+ community. In his first year with the group, he helped organize a panel discussion on allyship and creating safe workplaces. He then became co-chair of OAERG’s Pride Committee, working with ERG colleagues and others to plan the group’s LGBTQ+ Pride Month events and participation in Houston’s annual Pride Parade. “I had a wonderful experience managing events and bringing everyone together for Pride,” he said – efforts that earned him a Trailblazer Award.
Chandler said he has grown personally and professionally through his involvement with OAERG. “I was very shy and kind of uptight at the first meeting that I went to, but everyone was so kind and accepting, and I slowly started taking on responsibilities and planning events,” he said. “These activities helped me grow as a communicator and a leader in my regular work and personal life.”
Michael Chandler (left) stands with fellow Out & Allied Employee Resource Group members, waiting for the Houston Pride Parade to begin. Image courtesy of Michael Chandler
Chandler belongs to other employee resource groups (ERGs) at Johnson to support different communities and find opportunities to collaboratively promote diversity, equity, and inclusion (DEI) at the center, and he encourages others to do the same. “Even if you only participate when you have time, it can lead to knowledge and ways to support other communities that have the same challenges in this world,” he said.
Chandler has been impressed with agency and center leadership’s involvement in DEI efforts and support for ERGs to date. He suggested that increased communication around DEI initiatives may help to quell anxieties about the political landscape and developments outside of NASA by reassuring team members that their employer supports them for who they are. He believes that every person at Johnson can help create an inclusive environment by being respectful, listening with an open heart, and joining the fight to ensure that everyone can be themselves.
“The most important thing is that everyone needs to be their true self,” he said. “It’s so rewarding and makes life so much more fun!”
Hybrid design could make nuclear fusion reactors more efficient
Hybrid design could make nuclear fusion reactors more efficient
Human Factors Researcher Garrett Sadler
“I graduated in 2008, so that job market was not super great, and I ended up with this very unusual job working for this guy who thought that he had some new theory of physics that he wanted to work on. And so I was responsible for creating little computer simulations, trying to resemble some version of his ideas. His whole thing was like a quasi-spiritual tool, looking toward science as a rationalization of different spiritual beliefs that he had about a collective consciousness and the interconnectedness of things.
“As I worked for him longer and met a bunch of other people who were trying to put various spiritual beliefs on scientific footing, I got interested [and thought] maybe this could be studied as a cultural thing. What’s going on here with the desire to scientifically explain spiritual beliefs that they have? What’s the dynamic going on there? That’s what led me into eventually going to grad school for anthropology. I studied the way that science gets conceptualized and interpreted to rationalize spiritual and religious beliefs.
“I had this sort of unconventional trajectory [to NASA]. I didn’t really set a target on something to pursue it. The other thing that might be surprising is that I’ve been insecure about it at every single stage. You know, there’s the whole impostor syndrome thing, and I didn’t feel like I was qualified to be here because I didn’t have some sort of traditional path or because my educational background looks different than that of most of my colleagues. But I’m now at a place where I’ve come to understand that’s true for everyone.”
– Garrett Sadler, Human Factors Researcher, NASA’s Ames Research Center
Image Credit: NASA/Bradon Torres
Interviewer: NASA/Tahira Allen
Hubble Captures a Cosmic Fossil
Hubble Captures a Cosmic Fossil
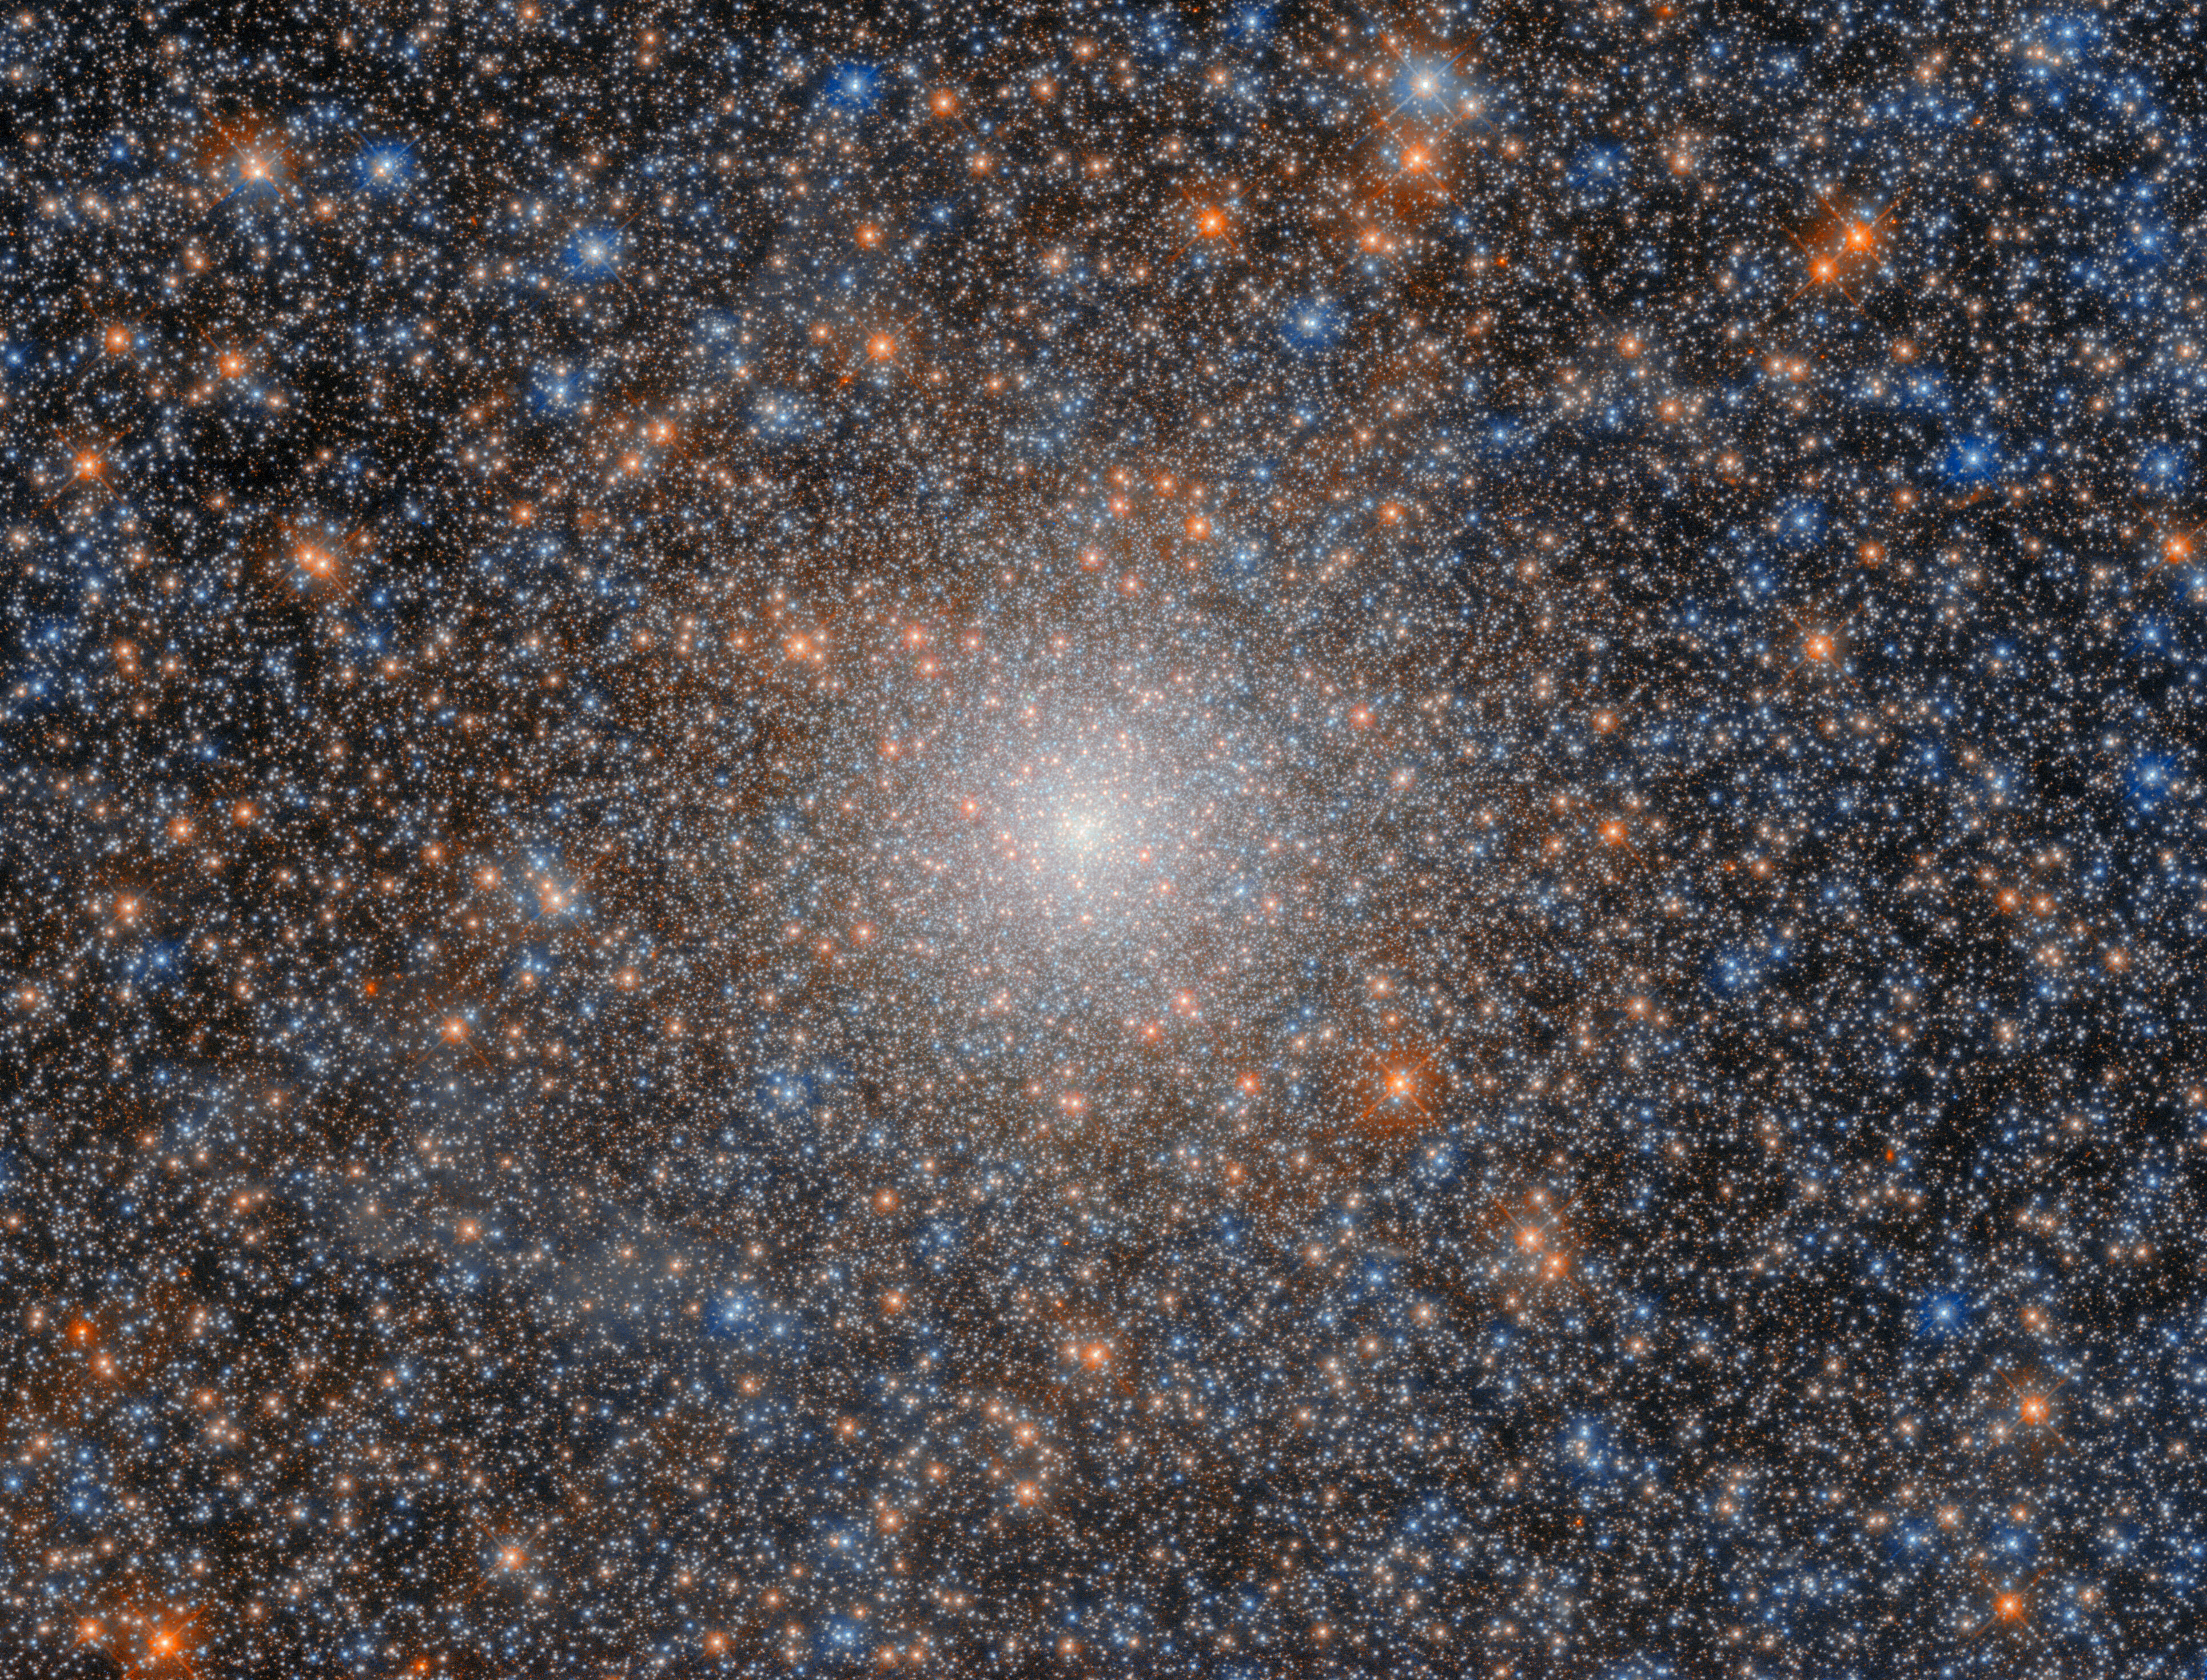
This NASA/ESA Hubble Space Telescope image features the globular cluster NGC 2005. It’s not an unusual globular cluster in and of itself, but it is a peculiarity when compared to its surroundings. NGC 2005 is located about 750 light-years from the heart of the Large Magellanic Cloud (LMC), which is the Milky Way’s largest satellite galaxy some 162,000 light-years from Earth. Globular clusters are densely-packed groups of stars that can hold tens of thousands or millions of stars. Their density means they are tightly bound by gravity and therefore very stable. This stability contributes to their longevity: globular clusters can be billions of years old, and are often comprised of very old stars. Studying globular clusters in space can be a little like studying fossils on Earth: where fossils give insights into the characteristics of ancient plants and animals, globular clusters illuminate the characteristics of ancient stars.
Current theories of galaxy evolution predict that galaxies merge with one another. Astronomers think the relatively large galaxies we observe in the modern universe formed when smaller galaxies merged. If this is correct, then we would expect to see evidence that the most ancient stars in nearby galaxies originated in different galactic environments. Because globular clusters hold ancient stars, and because of their stability, they are an excellent laboratory to test this hypothesis.
NGC 2005 is such a globular cluster, and its very existence provides evidence that supports the theory of galaxy evolution via mergers. Indeed, what makes NGC 2005 a bit peculiar from its surroundings, is the fact that its stars have a chemical composition that is distinct from the stars around it in the LMC. This suggests that the LMC underwent a merger with another galaxy somewhere in its history. That other galaxy has long-since merged and otherwise dispersed, but NGC 2005 remains behind as an ancient witness to the long-past merger.
Text Credit: European Space Agency (ESA)