
NASA
Close-Up Views of NASA’s DART Impact to Inform Planetary Defense
5 min read
Close-Up Views of NASA’s DART Impact to Inform Planetary Defense Photos taken by the Italian LICIACube, short for the LICIA CubeSat for Imaging of Asteroids. These offer the closest, most detailed observations of NASA’s DART (Double Asteroid Redirection Test) impact aftermath to date. The photo on the left was taken roughly 2 minutes and 40 seconds after impact, as the satellite flew past the Didymos system. The photo on the right was taken 20 seconds later, as LICIACube was leaving the scene. The larger body, near the top of each image is Didymos. The smaller body in the lower half of each image is Dimorphos, enveloped by the cloud of rocky debris created by DART’s impact. NASA/ASI/University of MarylandOn Sept. 11, 2022, engineers at a flight control center in Turin, Italy, sent a radio signal into deep space. Its destination was NASA’s DART (Double Asteroid Redirection Test) spacecraft flying toward an asteroid more than 5 million miles away.
The message prompted the spacecraft to execute a series of pre-programmed commands that caused a small, shoebox-sized satellite contributed by the Italian Space Agency (ASI), called LICIACube, to detach from DART.
Fifteen days later, when DART’s journey ended in an intentional head-on collision with near-Earth asteroid Dimorphos, LICIACube flew past the asteroid to snap a series of photos, providing researchers with the only on-site observations of the world’s first demonstration of an asteroid deflection.
After analyzing LICIACube’s images, NASA and ASI scientists report on Aug. 21 in the Planetary Science Journal that an estimated 35.3 million pounds (16 million kilograms) of dust and rocks spewed from the asteroid as a result of the crash, refining previous estimates that were based on data from ground and space-based observations.
While the debris shed from the asteroid amounted to less than 0.5% of its total mass, it was still 30,000 times greater than the mass of the spacecraft. The impact of the debris on Dimorphos’ trajectory was dramatic: shortly after the collision, the DART team determined that the flying rubble gave Dimorphos a shove several times stronger than the hit from the spacecraft itself.
“The plume of material released from the asteroid was like a short burst from a rocket engine,” said Ramin Lolachi, a research scientist who led the study from NASA’s Goddard Space Flight Center in Greenbelt, Maryland.
The important takeaway from the DART mission is that a small, lightweight spacecraft can dramatically alter the path of an asteroid of similar size and composition to Dimorphos, which is a “rubble-pile” asteroid — or a loose, porous collection of rocky material bound together weakly by gravity.
“We expect that a lot of near-Earth asteroids have a similar structure to Dimorphos,” said Dave Glenar, a planetary scientist at the University of Maryland, Baltimore County, who participated in the study. “So, this extra push from the debris plume is critical to consider when building future spacecraft to deflect asteroids from Earth.”
NASA chose Dimorphos, which poses no threat to Earth, as the mission target due to its relationship with another, larger asteroid named Didymos. Dimorphos orbits Didymos in a binary asteroid system, much like the Moon orbits Earth. Critically, the pair’s position relative to Earth allowed astronomers to measure the duration of the moonlet’s orbit before and after the collision.
Ground and space-based observations revealed that DART shortened Dimorphos’ orbit by 33 minutes. But these long-range observations, made from 6.8 million miles (10.9 million kilometers) away, were too distant to support a detailed study of the impact debris. That was LICIACube’s job.
After DART’s impact, LICIACube had just 60 seconds to make its most critical observations. Barreling past the asteroid at 15,000 miles (21,140 kilometers) per hour, the spacecraft took a snapshot of the debris roughly once every three seconds. Its closest image was taken just 53 miles (85.3 km) from Dimorphos’ surface.
The short distance between LICIACube and Dimorphos provided a unique advantage, allowing the cubesat to capture detailed images of the dusty debris from multiple angles.
The research team studied a series of 18 LICIAcube images. The first images in the sequence showed LICIACube’s head-on approach. From this angle, the plume was brightly illuminated by direct sunlight. As the spacecraft glided past the asteroid, its camera pivoted to keep the plume in view.
As LICIACube looked back at the asteroid, sunlight filtered through the dense cloud of debris, and the plume’s brightness faded. This suggested the plume was made of mostly large particles — about a millimeter or more across — which reflect less light than tiny dust grains.
Since the innermost parts of the plume were so thick with debris that they were completely opaque, the scientists used models to estimate the number of particles that were hidden from view. Data from other rubble-pile asteroids, including pieces of Bennu delivered to Earth in 2023 by NASA’s OSIRIS-REx spacecraft, and laboratory experiments helped refine the estimate.
“We estimated that this hidden material accounted for almost 45% of the plume’s total mass,” said Timothy Stubbs, a planetary scientist at NASA Goddard who was involved with the study.
While DART showed that a high-speed collision with a spacecraft can change an asteroid’s trajectory, Stubbs and his colleagues note that different asteroid types, such as those made of stronger, more tightly packed material, might respond differently to a DART-like impact. “Every time we interact with an asteroid, we find something that surprises us, so there’s a lot more work to do,” said Stubbs. “But DART is a big step forward for planetary defense.”
The Johns Hopkins Applied Physics Laboratory in Laurel, Maryland, managed the DART mission and operated the spacecraft for NASA’s Planetary Defense Coordination Office as a project of the agency’s Planetary Missions Program Office.
By Nathan Marder, nathan.marder@nasa.gov
NASA’s Goddard Space Flight Center, Greenbelt, Md.
While the Artemis II crew will be the first humans to test NASA’s Orion spacecraft…
Article
3 hours ago
6 min read NASA, IBM’s ‘Hot’ New AI Model Unlocks Secrets of Sun
Article
1 day ago
3 min read Summer Triangle Corner: Altair
Article
6 days ago
Keep Exploring Discover Related Topics
Double Asteroid Redirection Test (DART)
Asteroids, Comets & Meteors
Our Solar System
For Planetary Science Researchers
Resources specifically curated to help planetary science researchers, whether new to the field or seasoned professionals.
NASA Invites Media to Joint Launch of Sun, Space Weather Missions
Lee esta nota de prensa en español aquí.
Media accreditation is open for the launch of three observatories that will study the Sun and enhance the ability to make accurate space weather forecasts, helping protect technology systems that affect life on Earth.
NASA is targeting no earlier than Tuesday, Sept. 23, for the launch of the agency’s IMAP (Interstellar Mapping and Acceleration Probe), the Carruthers Geocorona Observatory, and National Oceanic and Atmospheric Administration’s (NOAA) Space Weather Follow On–Lagrange 1 (SWFO-L1) observatory. The observatories will launch aboard a SpaceX Falcon 9 rocket from Launch Complex 39A at NASA’s Kennedy Space Center in Florida.
Accredited media will have the opportunity to participate in prelaunch briefings and interviews with key mission personnel prior to launch, as well as cover the launch. NASA will communicate additional details regarding the media event schedule as the launch date approaches.
Media accreditation deadlines for the launch are as follows:
- International media without U.S. citizenship must apply by 11:59 p.m. EDT on Sunday, Aug. 31.
- U.S. media and U.S. citizens representing international media organizations must apply by 11:59 p.m. on Thursday, Sept. 4.
All accreditation requests must be submitted online at:
NASA’s media accreditation policy is available online. For questions about accreditation, please email: ksc-media-accreditat@mail.nasa.gov. For other mission questions, please contact the NASA Kennedy newsroom at 321-867-2468.
Para obtener información en español en sobre el Centro Espacial Kennedy, comuníquese con Antonia Jaramillo: 321-501-8425. Si desea solicitar entrevistas en español sobre IMAP, póngase en contacto con María-José Viñas: maria-jose.vinasgarcia@nasa.gov.
NASA’s IMAP will use 10 science instruments to study and map the heliosphere, a vast magnetic bubble surrounding the Sun protecting our solar system from radiation incoming from interstellar space. This mission and its two rideshares will orbit the Sun near Lagrange point 1, about one million miles from Earth, where it will scan the heliosphere, analyze the composition of charged particles, and investigate how those particles move through the solar system. This will provide information on how the Sun accelerates charged particles, filling in essential puzzle pieces to understand the space weather environment across the solar system. The IMAP spacecraft also will continuously monitor solar wind and cosmic radiation. Scientists can use this information to evaluate new and improved capabilities for space weather prediction tools and models, which are vital for the health of human space explorers and the longevity of technological systems, like satellites and power grids, that can affect life on Earth.
The agency’s Carruthers Geocorona Observatory is a small satellite set to study the exosphere, the outermost part of Earth’s atmosphere. Using ultraviolet cameras, it will monitor how space weather from the Sun impacts the exosphere, which plays a crucial role in protecting Earth from space weather events that can affect satellites, communications, and power lines. The exosphere, a cloud of neutral hydrogen extending to the Moon and possibly beyond, is created by the breakdown of water and methane by ultraviolet light from the Sun, and its glow, known as the geocorona, has been observed globally only four times before this mission.
The SWFO-L1 mission, managed by NOAA and developed with NASA’s Goddard Space Flight Center in Greenbelt, Maryland, and commercial partners, will use a suite of instruments to provide real-time measurements of solar wind, along with a compact coronagraph to detect coronal mass ejections from the Sun. The observatory, serving as an early warning beacon for potentially destructive space weather events, will enable faster and more accurate forecasts. Its 24/7 data will support NOAA’s Space Weather Prediction Center in protecting vital infrastructure, economic interests, and national security, both on Earth and in space.
David McComas, professor, Princeton University, leads the IMAP mission with an international team of 25 partner institutions. The Johns Hopkins Applied Physics Laboratory in Laurel, Maryland, built the spacecraft and operates the mission. NASA’s IMAP is the fifth mission in NASA’s Solar Terrestrial Probes program portfolio. The Explorers and Heliophysics Project Division at NASA Goddard manages the program for the agency’s Heliophysics Division of NASA’s Science Mission Directorate.
NASA’s Launch Services Program, based at NASA Kennedy, manages the launch service for the mission.
For more details about the IMAP mission and updates on launch preparations, visit:
https://science.nasa.gov/mission/imap/
-end-
Abbey Interrante
Headquarters, Washington
301-201-0124
abbey.a.interrante@nasa.gov
Sarah Frazier
Goddard Space Flight Center, Greenbelt, Md.
202-853-7191
sarah.frazier@nasa.gov
Leejay Lockhart
Kennedy Space Center, Fla.
321-747-8310
leejay.lockhart@nasa.gov
John Jones-Bateman
NOAA’s Satellite and Information Service, Silver Spring, Md.
202-242-0929
john.jones-bateman@noaa.gov
Curiosity Blog, Sols 4636-4637: Up Against a Wall
- Curiosity Home
- Science
- News and Features
- Multimedia
- Mars Missions
- Mars Home
2 min read
Curiosity Blog, Sols 4636-4637: Up Against a Wall NASA’s Mars rover Curiosity acquired this image, showing itself parked at the wall of a fracture named “Río Frío.” Curiosity used its Left Navigation Camera on Aug. 19, 2025 — Sol 4634, or Martian day 4,634 of the Mars Science Laboratory mission — at 14:51:33 UTC. NASA/JPL-CaltechWritten by Michelle Minitti, MAHLI Deputy Principal Investigator, Framework
Earth planning date: Wednesday, Aug. 20, 2025
What does a good rover do when her back is up against a wall? Fight for science!
Curiosity indeed fought the good fight at “Río Frío,” the wall of one of the many ridges cutting through the boxwork terrain we have been systematically exploring. The observations along the wall today provide insight into the internal structure and chemistry of the ridges, hopefully giving us clues as to why they are standing proud relative to the surrounding terrain.
The structural story will be told by the large Mastcam mosaics we planned, covering the ridge from base to top, and from a MAHLI mosaic covering a horizon of the wall filled with resistant nodules and smooth, swooping surfaces cutting in all directions that are likely veins. The mosaic target, “Jardín de las Delicias,” will surely yield a surfeit of Martian delights. The chemical story will be told by APXS analysis of the nodule-filled target “Minimini” and SuperCam analysis of a vein at “El Tapado.” In contrast to the ridge itself, we planned a Mastcam mosaic of part of the hollow at the base of the ridge at target “Playa Zapatilla.”
Beyond the ridge, we planned Mastcam and ChemCam imaging of the “Paniri” and “Mishe Mokwa” buttes, respectively, and sky observations with Navcam and Mastcam. DAN, RAD, and REMS run periodically through the plan keeping their eye on the Martian environment. Our drive will take us to a smaller ridge perpendicular to Río Frío, where we will once again fight to learn the secrets these ridges have to tell about Mars’ past.
-
Want to read more posts from the Curiosity team?
-
Want to learn more about Curiosity’s science instruments?
Article
1 day ago
2 min read Curiosity Blog, Sols 4631-4633: Radiant Ridge Revolution
Article
1 day ago
2 min read Curiosity Blog, Sols 4629-4630: Feeling Hollow
Article
3 days ago
Keep Exploring Discover More Topics From NASA Mars
Mars is the fourth planet from the Sun, and the seventh largest. It’s the only planet we know of inhabited…
All Mars Resources
Explore this collection of Mars images, videos, resources, PDFs, and toolkits. Discover valuable content designed to inform, educate, and inspire,…
Rover Basics
Each robotic explorer sent to the Red Planet has its own unique capabilities driven by science. Many attributes of a…
Mars Exploration: Science Goals
The key to understanding the past, present or future potential for life on Mars can be found in NASA’s four…
X-ray and Radio go ‘Hand in Hand’ in New Image
In 2009, NASA’s Chandra X-ray Observatory released a captivating image: a pulsar and its surrounding nebula that is shaped like a hand.
Since then, astronomers have used Chandra and other telescopes to continue to observe this object. Now, new radio data from the Australia Telescope Compact Array (ATCA), has been combined with Chandra’s X-ray data to provide a fresh view of this exploded star and its environment, to help understand its peculiar properties and shape.
At the center of this new image lies the pulsar B1509-58, a rapidly spinning neutron star that is only about 12 miles in diameter. This tiny object is responsible for producing an intricate nebula (called MSH 15-52) that spans over 150 light-years, or about 900 trillion miles. The nebula, which is produced by energetic particles, resembles a human hand with a palm and extended fingers pointing to the upper right in X-rays.
Labeled Version of the ImageX-ray: NASA/CXC/Univ. of Hong Kong/S. Zhang et al.; Radio: ATNF/CSIRO/ATCA; H-alpha: UK STFC/Royal Observatory Edinburgh; Image Processing: NASA/CXC/SAO/N. WolkThe collapse of a massive star created the pulsar when much of the star crashed inward once it burned through its sustainable nuclear fuel. An ensuing explosion sent the star’s outer layers outward into space as a supernova.
The pulsar spins around almost seven times every second and has a strong magnetic field, about 15 trillion times stronger than the Earth’s. The rapid rotation and strong magnetic field make B1509-58 one of the most powerful electromagnetic generators in the Galaxy, enabling it to drive an energetic wind of electrons and other particles away from the pulsar, creating the nebula.
In this new composite image, the ATCA radio data (represented in red) has been combined with X-rays from Chandra (shown in blue, orange and yellow), along with an optical image of hydrogen gas (gold). The areas of overlap between the X-ray and radio data in MSH 15-52 show as purple. The optical image shows stars in the field of view along with parts of the supernova’s debris, the supernova remnant RCW 89. A labeled version of the figure shows the main features of the image.
Radio data from ATCA now reveals complex filaments that are aligned with the directions of the nebula’s magnetic field, shown by the short, straight, white lines in a supplementary image. These filaments could result from the collision of the pulsar’s particle wind with the supernova’s debris.
Complex Filaments Aligned with the Directions of the Nebula’s Magnetic FieldX-ray: NASA/CXC/Univ. of Hong Kong/S. Zhang et al.; Radio: ATNF/CSIRO/ATCA; H-alpha: UK STFC/Royal Observatory Edinburgh; Image Processing: NASA/CXC/SAO/N. WolkBy comparing the radio and X-ray data, researchers identified key differences between the sources of the two types of light. In particular, some prominent X-ray features, including the jet towards the bottom of the image and the inner parts of the three “fingers” towards the top, are not detected in radio waves. This suggests that highly energetic particles are leaking out from a shock wave — similar to a supersonic plane’s sonic boom — near the pulsar and moving along magnetic field lines to create the fingers.
The radio data also shows that RCW 89’s structure is different from typical young supernova remnants. Much of the radio emission is patchy and closely matches clumps of X-ray and optical emission. It also extends well beyond the X-ray emission. All of these characteristics support the idea that RCW 89 is colliding with a dense cloud of nearby hydrogen gas.
However, the researchers do not fully understand all that the data is showing them. One area that is perplexing is the sharp boundary of X-ray emission in the upper right of the image that seems to be the blast wave from the supernova — see the labeled feature. Supernova blast waves are usually bright in radio waves for young supernova remnants like RCW 89, so it is surprising to researchers that there is no radio signal at the X-ray boundary.
MSH 15–52 and RCW 89 show many unique features not found in other young sources. There are, however, still many open questions regarding the formation and evolution of these structures. Further work is needed to provide better understanding of the complex interplay between the pulsar wind and the supernova debris.
A paper describing this work, led by Shumeng Zhang of the University of Hong Kong, with co-authors Stephen C.Y. Ng of the University of Hong Kong and Niccolo’ Bucciantini of the Italian National Institute for Astrophysics, has been published in The Astrophysical Journal and is available at https://iopscience.iop.org/article/10.3847/1538-4357/adf333.
NASA’s Marshall Space Flight Center in Huntsville, Alabama, manages the Chandra program. The Smithsonian Astrophysical Observatory’s Chandra X-ray Center controls science operations from Cambridge, Massachusetts, and flight operations from Burlington, Massachusetts.
Read more from NASA’s Chandra X-ray ObservatoryLearn more about the Chandra X-ray Observatory and its mission here:
Visual DescriptionThis release features a composite image of a nebula and pulsar that strongly resembles a cosmic hand reaching for a neon red cloud.
The neon red cloud sits near the top of the image, just to our right of center. Breaks in the cloud reveal interwoven strands of gold resembling spiderwebs, or a latticework substructure. This cloud is the remains of the supernova that formed the pulsar at the heart of the image. The pulsar, a rapidly spinning neutron star only 12 miles in diameter, is far too small to be seen in this image, which represents a region of space over 150 light-years across.
The bottom half of the image is dominated by a massive blue hand reaching up toward the pulsar and supernova cloud. This is an intricate nebula called MSH 15-52, an energetic wind of electrons and other particles driven away from the pulsar. The resemblance to a hand is undeniable. Inside the nebula, streaks and swirls of blue range from pale to navy, evoking a medical X-ray, or the yearning hand of a giant, cosmic ghost.
The hand and nebula are set against the blackness of space, surrounded by scores of gleaming golden specks. At our lower left, a golden hydrogen gas cloud extends beyond the edges of the image. In this composite, gold represents optical data; red represents ATCA radio data; and blue, orange, and yellow represent X-ray data from Chandra. Where the blue hand of the nebula overlaps with the radio data in red, the fingers appear hazy and purple.
News Media ContactMegan Watzke
Chandra X-ray Center
Cambridge, Mass.
617-496-7998
mwatzke@cfa.harvard.edu
Corinne Beckinger
Marshall Space Flight Center, Huntsville, Alabama
256-544-0034
corinne.m.beckinger@nasa.gov
While the Artemis II crew will be the first humans to test NASA’s Orion spacecraft…
Article 10 hours ago 5 min read NASA, Army National Guard Partner on Flight Training for Moon Landing Article 3 days ago 4 min read NASA Challenge Winners Cook Up New Industry Developments Article 4 days agoX-ray and Radio go ‘Hand in Hand’ in New Image
In 2009, NASA’s Chandra X-ray Observatory released a captivating image: a pulsar and its surrounding nebula that is shaped like a hand.
Since then, astronomers have used Chandra and other telescopes to continue to observe this object. Now, new radio data from the Australia Telescope Compact Array (ATCA), has been combined with Chandra’s X-ray data to provide a fresh view of this exploded star and its environment, to help understand its peculiar properties and shape.
At the center of this new image lies the pulsar B1509-58, a rapidly spinning neutron star that is only about 12 miles in diameter. This tiny object is responsible for producing an intricate nebula (called MSH 15-52) that spans over 150 light-years, or about 900 trillion miles. The nebula, which is produced by energetic particles, resembles a human hand with a palm and extended fingers pointing to the upper right in X-rays.
Labeled Version of the ImageX-ray: NASA/CXC/Univ. of Hong Kong/S. Zhang et al.; Radio: ATNF/CSIRO/ATCA; H-alpha: UK STFC/Royal Observatory Edinburgh; Image Processing: NASA/CXC/SAO/N. WolkThe collapse of a massive star created the pulsar when much of the star crashed inward once it burned through its sustainable nuclear fuel. An ensuing explosion sent the star’s outer layers outward into space as a supernova.
The pulsar spins around almost seven times every second and has a strong magnetic field, about 15 trillion times stronger than the Earth’s. The rapid rotation and strong magnetic field make B1509-58 one of the most powerful electromagnetic generators in the Galaxy, enabling it to drive an energetic wind of electrons and other particles away from the pulsar, creating the nebula.
In this new composite image, the ATCA radio data (represented in red) has been combined with X-rays from Chandra (shown in blue, orange and yellow), along with an optical image of hydrogen gas (gold). The areas of overlap between the X-ray and radio data in MSH 15-52 show as purple. The optical image shows stars in the field of view along with parts of the supernova’s debris, the supernova remnant RCW 89. A labeled version of the figure shows the main features of the image.
Radio data from ATCA now reveals complex filaments that are aligned with the directions of the nebula’s magnetic field, shown by the short, straight, white lines in a supplementary image. These filaments could result from the collision of the pulsar’s particle wind with the supernova’s debris.
Complex Filaments Aligned with the Directions of the Nebula’s Magnetic FieldX-ray: NASA/CXC/Univ. of Hong Kong/S. Zhang et al.; Radio: ATNF/CSIRO/ATCA; H-alpha: UK STFC/Royal Observatory Edinburgh; Image Processing: NASA/CXC/SAO/N. WolkBy comparing the radio and X-ray data, researchers identified key differences between the sources of the two types of light. In particular, some prominent X-ray features, including the jet towards the bottom of the image and the inner parts of the three “fingers” towards the top, are not detected in radio waves. This suggests that highly energetic particles are leaking out from a shock wave — similar to a supersonic plane’s sonic boom — near the pulsar and moving along magnetic field lines to create the fingers.
The radio data also shows that RCW 89’s structure is different from typical young supernova remnants. Much of the radio emission is patchy and closely matches clumps of X-ray and optical emission. It also extends well beyond the X-ray emission. All of these characteristics support the idea that RCW 89 is colliding with a dense cloud of nearby hydrogen gas.
However, the researchers do not fully understand all that the data is showing them. One area that is perplexing is the sharp boundary of X-ray emission in the upper right of the image that seems to be the blast wave from the supernova — see the labeled feature. Supernova blast waves are usually bright in radio waves for young supernova remnants like RCW 89, so it is surprising to researchers that there is no radio signal at the X-ray boundary.
MSH 15–52 and RCW 89 show many unique features not found in other young sources. There are, however, still many open questions regarding the formation and evolution of these structures. Further work is needed to provide better understanding of the complex interplay between the pulsar wind and the supernova debris.
A paper describing this work, led by Shumeng Zhang of the University of Hong Kong, with co-authors Stephen C.Y. Ng of the University of Hong Kong and Niccolo’ Bucciantini of the Italian National Institute for Astrophysics, has been published in The Astrophysical Journal and is available at https://iopscience.iop.org/article/10.3847/1538-4357/adf333.
NASA’s Marshall Space Flight Center in Huntsville, Alabama, manages the Chandra program. The Smithsonian Astrophysical Observatory’s Chandra X-ray Center controls science operations from Cambridge, Massachusetts, and flight operations from Burlington, Massachusetts.
Read more from NASA’s Chandra X-ray ObservatoryLearn more about the Chandra X-ray Observatory and its mission here:
Visual DescriptionThis release features a composite image of a nebula and pulsar that strongly resembles a cosmic hand reaching for a neon red cloud.
The neon red cloud sits near the top of the image, just to our right of center. Breaks in the cloud reveal interwoven strands of gold resembling spiderwebs, or a latticework substructure. This cloud is the remains of the supernova that formed the pulsar at the heart of the image. The pulsar, a rapidly spinning neutron star only 12 miles in diameter, is far too small to be seen in this image, which represents a region of space over 150 light-years across.
The bottom half of the image is dominated by a massive blue hand reaching up toward the pulsar and supernova cloud. This is an intricate nebula called MSH 15-52, an energetic wind of electrons and other particles driven away from the pulsar. The resemblance to a hand is undeniable. Inside the nebula, streaks and swirls of blue range from pale to navy, evoking a medical X-ray, or the yearning hand of a giant, cosmic ghost.
The hand and nebula are set against the blackness of space, surrounded by scores of gleaming golden specks. At our lower left, a golden hydrogen gas cloud extends beyond the edges of the image. In this composite, gold represents optical data; red represents ATCA radio data; and blue, orange, and yellow represent X-ray data from Chandra. Where the blue hand of the nebula overlaps with the radio data in red, the fingers appear hazy and purple.
News Media ContactMegan Watzke
Chandra X-ray Center
Cambridge, Mass.
617-496-7998
mwatzke@cfa.harvard.edu
Corinne Beckinger
Marshall Space Flight Center, Huntsville, Alabama
256-544-0034
corinne.m.beckinger@nasa.gov
While the Artemis II crew will be the first humans to test NASA’s Orion spacecraft…
Article 7 hours ago 5 min read NASA, Army National Guard Partner on Flight Training for Moon Landing Article 3 days ago 4 min read NASA Challenge Winners Cook Up New Industry Developments Article 3 days agoLa NASA anunciará una nueva promoción de astronautas y adelantará detalles de la misión lunar Artemis II
Nota del editor: Esta nota de medios fue actualizada el 20 de agosto para reflejar un cambio en los participantes de la sesión informativa sobre ciencia y tecnología de Artemis II.
Read this release in English here.
La NASA ha abierto el plazo para la acreditación de los medios a un programa de eventos de varios días de duración para presentar a la nueva promoción de astronautas de Estados Unidos y proporcionar información sobre el vuelo de prueba tripulado de la misión Artemis II alrededor de la Luna. Las actividades tendrán lugar en septiembre en el Centro Espacial Johnson de la agencia en Houston.
Después de evaluar más de 8.000 solicitudes, la NASA presentará a su nueva generación de candidatos a astronauta de 2025 durante una ceremonia que se llevará a cabo el lunes 22 de septiembre a las 12:30 p.m. hora del este. Después de la ceremonia, los candidatos estarán disponibles para entrevistas con los medios.
El evento de selección de astronautas se transmitirá en vivo en NASA+, Netflix, Amazon Prime, el canal de YouTube de la agencia y en la cuenta de X de la NASA, en idioma inglés.
Los candidatos seleccionados se someterán a casi dos años de entrenamiento antes de graduarse como astronautas elegibles para el vuelo en las misiones de la agencia a la órbita baja de la Tierra, la Luna y, más adelante, el planeta Marte.
A continuación de este evento, la NASA ofrecerá una serie de sesiones informativas para los medios de comunicación el martes 23 de septiembre y el miércoles 24 de septiembre, donde se dará un anticipo de la misión Artemis II, programada para despegar no más tarde de abril de 2026. Este vuelo de prueba —que será lanzado a bordo del cohete Sistema de Lanzamiento Espacial (SLS, por sus siglas en inglés) y la nave espacial Orion— enviará a los astronautas de la NASA Reid Wiseman, Victor Glover y Christina Koch, junto con el astronauta de la CSA (Agencia Espacial Canadiense) Jeremy Hansen, en una misión alrededor de la Luna que durará cerca de 10 días.
Artemis II ayudará a comprobar el funcionamiento de los sistemas y el hardware necesarios para la exploración humana del espacio profundo. Esta misión es el primer vuelo tripulado de la campaña Artemis de la NASA, y es otro paso adelante hacia nuevas misiones tripuladas de Estados Unidos en la superficie de la Luna que ayudarán a la agencia a prepararse para enviar a astronautas estadounidenses a Marte.
Los eventos de las sesiones informativas de Artemis II serán transmitidos en vivo por el canal de YouTube y la cuenta de X de la agencia, en idioma inglés. Este enlace ofrece más información (en inglés) sobre cómo ver contenido a través de las diferentes plataformas de la NASA.
Después de las sesiones informativas, el 24 de septiembre la NASA ofrecerá una jornada para los medios de comunicación dedicada a Artemis II en el centro Johnson de la agencia, y mostrará las instalaciones de apoyo a la misión, los entrenadores y el hardware para las misiones Artemis. Asimismo, ofrecerá oportunidades de entrevistas con líderes, directores de vuelo, astronautas, científicos e ingenieros de esta campaña.
Los representantes de los medios que deseen participar en persona deben comunicarse con la sala de prensa del centro Johnson de la NASA llamando al teléfono 281-483-5111 o escribiendo al correo electrónico jsccommu@mail.nasa.gov, indicando a qué eventos desean asistir. Los medios confirmados recibirán detalles adicionales sobre su participación en estos eventos. Una copia de la política de acreditación de medios de la NASA está disponible (en inglés) en el sitio web de la agencia. Los plazos de la acreditación de medios para la selección de candidatos a astronauta y los eventos de Artemis II son los siguientes:
- Los miembros de medios de comunicación con ciudadanía estadounidense que estén interesados en asistir en persona deben confirmar su asistencia a más tardar a las 5 p. m. hora del este del miércoles 17 de septiembre.
- Los miembros de medios de comunicación sin ciudadanía estadounidense deben confirmar su asistencia a más tardar a las 5 p. m. del miércoles 10 de septiembre.
Los medios que soliciten entrevistas en persona o virtuales con los candidatos a astronautas, los expertos de Artemis o la tripulación de Artemis II deben enviar sus solicitudes a la sala de prensa del centro Johnson de la NASA antes del miércoles 17 de septiembre. Las solicitudes de entrevistas en persona están sujetas a los plazos de acreditación indicados anteriormente.
La información sobre la selección de candidatos a astronauta y los eventos de Artemis II, incluida la lista de participantes de las sesiones informativas, es la siguiente (todos los horarios son en hora del este de Estados Unidos):
Lunes, 22 de septiembre
12:30 p.m.: 2025: Ceremonia de selección de candidatos a astronauta de 2025
Martes, 23 de septiembre
11 a.m.: Informe general sobre la misión Artemis II
- Lakiesha Hawkins, administradora adjunta interina, Dirección de Misiones de Desarrollo de Sistemas de Exploración, sede central de la NASA
- Charlie Blackwell-Thompson, directora de lanzamiento de Artemis II, Centro Espacial Kennedy de la NASA en Florida
- Jeff Radigan, director de vuelo principal de Artemis II, centro Johnson de la NASA
- Judd Frieling, director principal de vuelo de ascenso de Artemis II, centro Johnson de la NASA
- Rick Henfling, director principal de vuelo de ingreso de Artemis II, centro Johnson de la NASA
- Daniel Florez, director de pruebas, Sistemas Terrestres de Exploración, centro Kennedy de la NASA [Florez es hispanohablante]
1 p.m.: Sesión informativa sobre ciencia y tecnología de Artemis II
- Matt Ramsey, gerente de la misión Artemis II, sede central de la NASA
- Debbie Korth, gerente adjunta del programa Orion, centro Johnson de la NASA
- Jake Bleacher, gerente de Ciencia, Uso de Tecnología e Integración, Dirección de Misiones de Desarrollo de Sistemas de Exploración, sede central de la NASA
- Mark Clampin, administrador adjunto interino, Dirección de Misiones Científicas, sede central de la NASA
Los medios que deseen participar por teléfono deben solicitar información de acceso telefónico antes de las 5 p. m. del 22 de septiembre, enviando un correo electrónico a la sala de prensa del centro Johnson de la NASA.
Miércoles, 24 de septiembre
10 a.m.: Conferencia de prensa de la tripulación de Artemis II
- Reid Wiseman, comandante
- Victor Glover, piloto
- Christina Koch, especialista de misión
- Jeremy Hansen, especialista de misión
Los medios que deseen participar por teléfono deben solicitar información de acceso telefónico antes de las 5 p. m. del 23 de septiembre, enviando un correo electrónico a la sala de prensa del centro Johnson de la NASA.
Encuentre más información sobre cómo la NASA lidera las iniciativas de vuelos espaciales tripulados en el sitio web (en inglés):
https://www.nasa.gov/humans-in-space
-fin-
Jimi Russell / Rachel Kraft / María José Viñas
Sede central de la NASA, Washington
202-358-1100
james.j.russell@nasa.gov / rachel.h.kraft@nasa.gov / maria-jose.vinasgarcia@nasa.gov
Courtney Beasley / Chelsey Ballarte
Centro Espacial Johnson, Houston
281-910-4989
courtney.m.beasley@nasa.gov / chelsey.n.ballarte@nasa.gov
La NASA anunciará una nueva promoción de astronautas y adelantará detalles de la misión lunar Artemis II
Read this release in English here.
La NASA ha abierto el plazo para la acreditación de los medios a un programa de eventos de varios días de duración para presentar a la nueva promoción de astronautas de Estados Unidos y proporcionar información sobre el vuelo de prueba tripulado de la misión Artemis II alrededor de la Luna. Las actividades tendrán lugar en septiembre en el Centro Espacial Johnson de la agencia en Houston.
Después de evaluar más de 8.000 solicitudes, la NASA presentará a su nueva generación de candidatos a astronauta de 2025 durante una ceremonia que se llevará a cabo el lunes 22 de septiembre a las 12:30 p.m. hora del este. Después de la ceremonia, los candidatos estarán disponibles para entrevistas con los medios.
El evento de selección de astronautas se transmitirá en vivo en NASA+, Netflix, Amazon Prime, el canal de YouTube de la agencia y en la cuenta de X de la NASA, en idioma inglés.
Los candidatos seleccionados se someterán a casi dos años de entrenamiento antes de graduarse como astronautas elegibles para el vuelo en las misiones de la agencia a la órbita baja de la Tierra, la Luna y, más adelante, el planeta Marte.
A continuación de este evento, la NASA ofrecerá una serie de sesiones informativas para los medios de comunicación el martes 23 de septiembre y el miércoles 24 de septiembre, donde se dará un anticipo de la misión Artemis II, programada para despegar no más tarde de abril de 2026. Este vuelo de prueba —que será lanzado a bordo del cohete Sistema de Lanzamiento Espacial (SLS, por sus siglas en inglés) y la nave espacial Orion— enviará a los astronautas de la NASA Reid Wiseman, Victor Glover y Christina Koch, junto con el astronauta de la CSA (Agencia Espacial Canadiense) Jeremy Hansen, en una misión alrededor de la Luna que durará cerca de 10 días.
Artemis II ayudará a comprobar el funcionamiento de los sistemas y el hardware necesarios para la exploración humana del espacio profundo. Esta misión es el primer vuelo tripulado de la campaña Artemis de la NASA, y es otro paso adelante hacia nuevas misiones tripuladas de Estados Unidos en la superficie de la Luna que ayudarán a la agencia a prepararse para enviar a astronautas estadounidenses a Marte.
Los eventos de las sesiones informativas de Artemis II serán transmitidos en vivo por el canal de YouTube y la cuenta de X de la agencia, en idioma inglés. Este enlace ofrece más información (en inglés) sobre cómo ver contenido a través de las diferentes plataformas de la NASA.
Después de las sesiones informativas, el 24 de septiembre la NASA ofrecerá una jornada para los medios de comunicación dedicada a Artemis II en el centro Johnson de la agencia, y mostrará las instalaciones de apoyo a la misión, los entrenadores y el hardware para las misiones Artemis. Asimismo, ofrecerá oportunidades de entrevistas con líderes, directores de vuelo, astronautas, científicos e ingenieros de esta campaña.
Los representantes de los medios que deseen participar en persona deben comunicarse con la sala de prensa del centro Johnson de la NASA llamando al teléfono 281-483-5111 o escribiendo al correo electrónico jsccommu@mail.nasa.gov, indicando a qué eventos desean asistir. Los medios confirmados recibirán detalles adicionales sobre su participación en estos eventos. Una copia de la política de acreditación de medios de la NASA está disponible (en inglés) en el sitio web de la agencia. Los plazos de la acreditación de medios para la selección de candidatos a astronauta y los eventos de Artemis II son los siguientes:
- Los miembros de medios de comunicación con ciudadanía estadounidense que estén interesados en asistir en persona deben confirmar su asistencia a más tardar a las 5 p. m. hora del este del miércoles 17 de septiembre.
- Los miembros de medios de comunicación sin ciudadanía estadounidense deben confirmar su asistencia a más tardar a las 5 p. m. del miércoles 10 de septiembre.
Los medios que soliciten entrevistas en persona o virtuales con los candidatos a astronautas, los expertos de Artemis o la tripulación de Artemis II deben enviar sus solicitudes a la sala de prensa del centro Johnson de la NASA antes del miércoles 17 de septiembre. Las solicitudes de entrevistas en persona están sujetas a los plazos de acreditación indicados anteriormente.
La información sobre la selección de candidatos a astronauta y los eventos de Artemis II, incluida la lista de participantes de las sesiones informativas, es la siguiente (todos los horarios son en hora del este de Estados Unidos):
Lunes, 22 de septiembre
12:30 p.m.: 2025: Ceremonia de selección de candidatos a astronauta de 2025
Martes, 23 de septiembre
11 a.m.: Informe general sobre la misión Artemis II
- Lakiesha Hawkins, administradora adjunta interina, Dirección de Misiones de Desarrollo de Sistemas de Exploración, sede central de la NASA
- Charlie Blackwell-Thompson, directora de lanzamiento de Artemis II, Centro Espacial Kennedy de la NASA en Florida
- Jeff Radigan, director de vuelo principal de Artemis II, centro Johnson de la NASA
- Judd Frieling, director principal de vuelo de ascenso de Artemis II, centro Johnson de la NASA
- Rick Henfling, director principal de vuelo de ingreso de Artemis II, centro Johnson de la NASA
- Daniel Florez, director de pruebas, Sistemas Terrestres de Exploración, centro Kennedy de la NASA [Florez es hispanohablante]
1 p.m.: Sesión informativa sobre ciencia y tecnología de Artemis II
- Matt Ramsey, gerente de la misión Artemis II, sede central de la NASA
- Howard Hu, gerente del programa Orion, centro Johnson de la NASA
- Jake Bleacher, gerente de Ciencia, Uso de Tecnología e Integración, Dirección de Misiones de Desarrollo de Sistemas de Exploración, sede central de la NASA
- Mark Clampin, administrador adjunto interino, Dirección de Misiones Científicas, sede central de la NASA
Los medios que deseen participar por teléfono deben solicitar información de acceso telefónico antes de las 5 p. m. del 22 de septiembre, enviando un correo electrónico a la sala de prensa del centro Johnson de la NASA.
Miércoles, 24 de septiembre
10 a.m.: Conferencia de prensa de la tripulación de Artemis II
- Reid Wiseman, comandante
- Victor Glover, piloto
- Christina Koch, especialista de misión
- Jeremy Hansen, especialista de misión
Los medios que deseen participar por teléfono deben solicitar información de acceso telefónico antes de las 5 p. m. del 23 de septiembre, enviando un correo electrónico a la sala de prensa del centro Johnson de la NASA.
Encuentre más información sobre cómo la NASA lidera las iniciativas de vuelos espaciales tripulados en el sitio web (en inglés):
https://www.nasa.gov/humans-in-space
-fin-
Jimi Russell / Rachel Kraft / María José Viñas
Sede central de la NASA, Washington
202-358-1100
james.j.russell@nasa.gov / rachel.h.kraft@nasa.gov / maria-jose.vinasgarcia@nasa.gov
Courtney Beasley / Chelsey Ballarte
Centro Espacial Johnson, Houston
281-910-4989
courtney.m.beasley@nasa.gov / chelsey.n.ballarte@nasa.gov
NASA to Announce New Astronaut Class, Preview Artemis II Moon Mission
Editor’s note: This advisory was updated on Aug. 20 to reflect a change in the Artemis II Science and Technology Briefing participants.
Lee esta nota de prensa en español aquí.
NASA is opening media accreditation for multi-day events to introduce America’s newest astronaut class and provide briefings for the Artemis II crewed test flight around the Moon. The activities will take place in September at the agency’s Johnson Space Center in Houston.
After evaluating more than 8,000 applications, NASA will debut its 2025 class of astronaut candidates during a ceremony at 12:30 p.m. EDT on Monday, Sept. 22. Following the ceremony, the candidates will be available for media interviews.
The astronaut selection event will stream live on NASA+, Netflix, Amazon Prime, NASA’s YouTube channel, and the agency’s X account.
The selected candidates will undergo nearly two years of training before they graduate as flight-eligible astronauts for agency missions to low Earth orbit, the Moon, and ultimately, Mars.
Next, NASA will host a series of media briefings on Tuesday, Sept. 23, and Wednesday, Sept. 24, to preview the upcoming Artemis II mission, slated for no later than April 2026. The test flight, a launch of the SLS (Space Launch System) rocket and Orion spacecraft, will send NASA astronauts Reid Wiseman, Victor Glover, and Christina Koch, along with CSA (Canadian Space Agency) astronaut Jeremy Hansen, on an approximately 10-day mission around the Moon.
Artemis II will help confirm the systems and hardware needed for human deep space exploration. This mission is the first crewed flight under NASA’s Artemis campaign and is another step toward new U.S.-crewed missions on the Moon’s surface that will help the agency prepare to send American astronauts to Mars.
The Artemis II events briefings will stream live on the agency’s YouTube channel and X account. Learn how to watch NASA content through a variety of platforms.
Following the briefings, NASA will host an Artemis II media day at NASA Johnson on Sept. 24, to showcase mission support facilities, trainers, and hardware for Artemis missions, as well as offer interview opportunities with leaders, flight directors, astronauts, scientists, and engineers.
Media who wish to participate in person must contact the NASA Johnson newsroom at 281-483-5111 or jsccommu@mail.nasa.gov and indicate which events they plan to attend. Confirmed media will receive additional details about participating in these events. A copy of NASA’s media accreditation policy is available on the agency’s website. Media accreditation deadlines for the astronaut candidate selection and Artemis II events are as follows:
- U.S. media interested in attending in person must RSVP no later than 5 p.m., Wednesday, Sept. 17.
- International media without U.S. citizenship must RSVP no later than 5 p.m., Wednesday, Sept. 10.
Media requesting in-person or virtual interviews with the astronaut candidates, Artemis experts, or the Artemis II crew must submit requests to the NASA Johnson newsroom by Wednesday, Sept. 17. In-person interview requests are subject to the credentialing deadlines noted above.
Information for the astronaut candidate selection and Artemis II events, including briefing participants, is as follows (all times Eastern):
Monday, Sept. 22
12:30 p.m.: 2025 Astronaut Candidate Selection Ceremony
Tuesday, Sept. 23
11 a.m.: Artemis II Mission Overview Briefing
- Lakiesha Hawkins, acting deputy associate administrator, Exploration Systems Development Mission Directorate, NASA Headquarters
- Charlie Blackwell-Thompson, Artemis launch director, NASA’s Kennedy Space Center in Florida
- Judd Frieling, lead Artemis II ascent flight director, NASA Johnson
- Jeff Radigan, lead Artemis II flight director, NASA Johnson
- Rick Henfling, lead Artemis II entry flight director, NASA Johnson
- Daniel Florez, test director, Exploration Ground Systems, NASA Kennedy
1 p.m.: Artemis II Science and Technology Briefing
- Matt Ramsey, Artemis II mission manager, NASA Headquarters
- Debbie Korth, deputy Orion Program manager, NASA Johnson
- Jacob Bleacher, manager, Science, Technology Utilization, and Integration, Exploration Systems Development Mission Directorate, NASA Headquarters
- Mark Clampin, acting deputy associate administrator, Science Mission Directorate, NASA Headquarters
Media who wish to participate by phone must request dial-in information by 5 p.m., Sept. 22, by emailing NASA Johnson’s newsroom.
Wednesday, Sept. 24
10 a.m.: Artemis II Crew News Conference
- Reid Wiseman, commander
- Victor Glover, pilot
- Christina Koch, mission specialist
- Jeremy Hansen, mission specialist
Media who wish to participate by phone must request dial-in information by 5 p.m., Sept. 23, by emailing NASA Johnson’s newsroom.
Learn more about how NASA leads human spaceflight efforts at:
https://www.nasa.gov/humans-in-space
-end-
Jimi Russell / Rachel Kraft
Headquarters, Washington
202-358-1100
james.j.russell@nasa.gov / rachel.h.kraft@nasa.gov
Courtney Beasley / Chelsey Ballarte
Johnson Space Center, Houston
281-910-4989
courtney.m.beasley@nasa.gov / chelsey.n.ballarte@nasa.gov
NASA to Announce New Astronaut Class, Preview Artemis II Moon Mission
Lee esta nota de prensa en español aquí.
NASA is opening media accreditation for multi-day events to introduce America’s newest astronaut class and provide briefings for the Artemis II crewed test flight around the Moon. The activities will take place in September at the agency’s Johnson Space Center in Houston.
After evaluating more than 8,000 applications, NASA will debut its 2025 class of astronaut candidates during a ceremony at 12:30 p.m. EDT on Monday, Sept. 22. Following the ceremony, the candidates will be available for media interviews.
The astronaut selection event will stream live on NASA+, Netflix, Amazon Prime, NASA’s YouTube channel, and the agency’s X account.
The selected candidates will undergo nearly two years of training before they graduate as flight-eligible astronauts for agency missions to low Earth orbit, the Moon, and ultimately, Mars.
Next, NASA will host a series of media briefings on Tuesday, Sept. 23, and Wednesday, Sept. 24, to preview the upcoming Artemis II mission, slated for no later than April 2026. The test flight, a launch of the SLS (Space Launch System) rocket and Orion spacecraft, will send NASA astronauts Reid Wiseman, Victor Glover, and Christina Koch, along with CSA (Canadian Space Agency) astronaut Jeremy Hansen, on an approximately 10-day mission around the Moon.
Artemis II will help confirm the systems and hardware needed for human deep space exploration. This mission is the first crewed flight under NASA’s Artemis campaign and is another step toward new U.S.-crewed missions on the Moon’s surface that will help the agency prepare to send American astronauts to Mars.
The Artemis II events briefings will stream live on the agency’s YouTube channel and X account. Learn how to watch NASA content through a variety of platforms.
Following the briefings, NASA will host an Artemis II media day at NASA Johnson on Sept. 24, to showcase mission support facilities, trainers, and hardware for Artemis missions, as well as offer interview opportunities with leaders, flight directors, astronauts, scientists, and engineers.
Media who wish to participate in person must contact the NASA Johnson newsroom at 281-483-5111 or jsccommu@mail.nasa.gov and indicate which events they plan to attend. Confirmed media will receive additional details about participating in these events. A copy of NASA’s media accreditation policy is available on the agency’s website. Media accreditation deadlines for the astronaut candidate selection and Artemis II events are as follows:
- U.S. media interested in attending in person must RSVP no later than 5 p.m., Wednesday, Sept. 17.
- International media without U.S. citizenship must RSVP no later than 5 p.m., Wednesday, Sept. 10.
Media requesting in-person or virtual interviews with the astronaut candidates, Artemis experts, or the Artemis II crew must submit requests to the NASA Johnson newsroom by Wednesday, Sept. 17. In-person interview requests are subject to the credentialing deadlines noted above.
Information for the astronaut candidate selection and Artemis II events, including briefing participants, is as follows (all times Eastern):
Monday, Sept. 22
12:30 p.m.: 2025 Astronaut Candidate Selection Ceremony
Tuesday, Sept. 23
11 a.m.: Artemis II Mission Overview Briefing
- Lakiesha Hawkins, acting deputy associate administrator, Exploration Systems Development Mission Directorate, NASA Headquarters
- Charlie Blackwell-Thompson, Artemis launch director, NASA’s Kennedy Space Center in Florida
- Judd Frieling, lead Artemis II ascent flight director, NASA Johnson
- Jeff Radigan, lead Artemis II flight director, NASA Johnson
- Rick Henfling, lead Artemis II entry flight director, NASA Johnson
- Daniel Florez, test director, Exploration Ground Systems, NASA Kennedy
1 p.m.: Artemis II Science and Technology Briefing
- Matt Ramsey, Artemis II mission manager, NASA Headquarters
- Howard Hu, Orion Program manager, NASA Johnson
- Jacob Bleacher, manager, Science, Technology Utilization, and Integration, Exploration Systems Development Mission Directorate, NASA Headquarters
- Mark Clampin, acting deputy associate administrator, Science Mission Directorate, NASA Headquarters
Media who wish to participate by phone must request dial-in information by 5 p.m., Sept. 22, by emailing NASA Johnson’s newsroom.
Wednesday, Sept. 24
10 a.m.: Artemis II Crew News Conference
- Reid Wiseman, commander
- Victor Glover, pilot
- Christina Koch, mission specialist
- Jeremy Hansen, mission specialist
Media who wish to participate by phone must request dial-in information by 5 p.m., Sept. 23, by emailing NASA Johnson’s newsroom.
Learn more about how NASA leads human spaceflight efforts at:
https://www.nasa.gov/humans-in-space
-end-
Jimi Russell / Rachel Kraft
Headquarters, Washington
202-358-1100
james.j.russell@nasa.gov / rachel.h.kraft@nasa.gov
Courtney Beasley / Chelsey Ballarte
Johnson Space Center, Houston
281-910-4989
courtney.m.beasley@nasa.gov / chelsey.n.ballarte@nasa.gov
NASA: Ceres May Have Had Long-Standing Energy to Fuel Habitability
4 min read
Preparations for Next Moonwalk Simulations Underway (and Underwater) Dwarf planet Ceres is shown in these enhanced-color renderings that use images from NASA’s Dawn mission. New thermal and chemicals models that rely on the mission’s data indicate Ceres may have long ago had conditions suitable for life.NASA/JPL-Caltech/UCLA/MPS/DLR/IDAThe dwarf planet is cold now, but new research paints a picture of Ceres hosting a deep, long-lived energy source that may have maintained habitable conditions in the past.
New NASA research has found that Ceres may have had a lasting source of chemical energy: the right types of molecules needed to fuel some microbial metabolisms. Although there is no evidence that microorganisms ever existed on Ceres, the finding supports theories that this intriguing dwarf planet, which is the largest body in the main asteroid belt between Mars and Jupiter, may have once had conditions suitable to support single-celled lifeforms.
Science data from NASA’s Dawn mission, which ended in 2018, previously showed that the bright, reflective regions on Ceres’ surface are mostly made of salts left over from liquid that percolated up from underground. Later analysis in 2020 found that the source of this liquid was an enormous reservoir of brine, or salty water, below the surface. In other research, the Dawn mission also revealed evidence that Ceres has organic material in the form of carbon molecules — essential, though not sufficient on its own, to support microbial cells.
The presence of water and carbon molecules are two critical pieces of the habitability puzzle on Ceres. The new findings offer the third: a long-lasting source of chemical energy in Ceres’ ancient past that could have made it possible for microorganisms to survive. This result does not mean that Ceres had life, but rather, that there likely was “food” available should life have ever arisen on Ceres.
This illustration depicts the interior of dwarf planet Ceres, including the transfer of water and gases from the rocky core to a reservoir of salty water. Carbon dioxide and methane are among the molecules carrying chemical energy beneath Ceres’ surface.NASA/JPL-CaltechIn the study, published in Science Advances on Aug. 20, the authors built thermal and chemical models mimicking the temperature and composition of Ceres’ interior over time. They found that 2.5 billion years or so ago, Ceres’ subsurface ocean may have had a steady supply of hot water containing dissolved gases traveling up from metamorphosed rocks in the rocky core. The heat came from the decay of radioactive elements within the dwarf planet’s rocky interior that occurred when Ceres was young — an internal process thought to be common in our solar system.
“On Earth, when hot water from deep underground mixes with the ocean, the result is often a buffet for microbes — a feast of chemical energy. So it could have big implications if we could determine whether Ceres’ ocean had an influx of hydrothermal fluid in the past,” said Sam Courville, lead author of the study. Now based at Arizona State University in Tempe, he led the research while working as an intern at NASA’s Jet Propulsion Laboratory in Southern California, which also managed the Dawn mission.
Catching ChillThe Ceres we know today is unlikely to be habitable. It is cooler, with more ice and less water than in the past. There is currently insufficient heat from radioactive decay within Ceres to keep the water from freezing, and what liquid remains has become a concentrated brine.
The period when Ceres would most likely have been habitable was between a half-billion and 2 billion years after it formed (or about 2.5 billion to 4 billion years ago), when its rocky core reached its peak temperature. That’s when warm fluids would have been introduced into Ceres’ underground water.
The dwarf planet also doesn’t have the benefit of present-day internal heating generated by the push and pull of orbiting a large planet, like Saturn’s moon Enceladus and Jupiter’s moon Europa do. So Ceres’ greatest potential for habitability-fueling energy was in the past.
This result has implications for water-rich objects throughout the outer solar system, too. Many of the other icy moons and dwarf planets that are of similar size to Ceres (about 585 miles, or 940 kilometers, in diameter) and don’t have significant internal heating from the gravitational pull of planets could have also had a period of habitability in their past.
More About DawnA division of Caltech in Pasadena, JPL managed Dawn’s mission for NASA’s Science Mission Directorate in Washington. Dawn was a project of the directorate’s Discovery Program, managed by NASA’s Marshall Space Flight Center in Huntsville, Alabama. JPL was responsible for overall Dawn mission science. Northrop Grumman in Dulles, Virginia, designed and built the spacecraft. The German Aerospace Center, Max Planck Institute for Solar System Research, Italian Space Agency and Italian National Astrophysical Institute were international partners on the mission team.
For a complete list of mission participants, visit:
https://solarsystem.nasa.gov/missions/dawn/overview/
News Media ContactsGretchen McCartney
Jet Propulsion Laboratory, Pasadena, Calif.
818-287-4115
gretchen.p.mccartney@jpl.nasa.gov
Karen Fox / Molly Wasser
NASA Headquarters, Washington
2025-108
Share Details Last Updated Aug 20, 2025 Related Terms Explore More 6 min read NASA, IBM’s ‘Hot’ New AI Model Unlocks Secrets of SunEditor’s Note: This article was updated Aug. 20, 2025, to correct the number of years of…
Article 14 hours ago 4 min read NASA’s Psyche Captures Images of Earth, Moon Article 2 days ago 3 min read Summer Triangle Corner: AltairAltair is the last stop on our trip around the Summer Triangle! The last star…
Article 6 days ago Keep Exploring Discover Related TopicsMissions
Humans in Space
Climate Change
Solar System
NASA: Ceres May Have Had Long-Standing Energy to Fuel Habitability
4 min read
Preparations for Next Moonwalk Simulations Underway (and Underwater) Dwarf planet Ceres is shown in these enhanced-color renderings that use images from NASA’s Dawn mission. New thermal and chemicals models that rely on the mission’s data indicate Ceres may have long ago had conditions suitable for life.NASA/JPL-Caltech/UCLA/MPS/DLR/IDAThe dwarf planet is cold now, but new research paints a picture of Ceres hosting a deep, long-lived energy source that may have maintained habitable conditions in the past.
New NASA research has found that Ceres may have had a lasting source of chemical energy: the right types of molecules needed to fuel some microbial metabolisms. Although there is no evidence that microorganisms ever existed on Ceres, the finding supports theories that this intriguing dwarf planet, which is the largest body in the main asteroid belt between Mars and Jupiter, may have once had conditions suitable to support single-celled lifeforms.
Science data from NASA’s Dawn mission, which ended in 2018, previously showed that the bright, reflective regions on Ceres’ surface are mostly made of salts left over from liquid that percolated up from underground. Later analysis in 2020 found that the source of this liquid was an enormous reservoir of brine, or salty water, below the surface. In other research, the Dawn mission also revealed evidence that Ceres has organic material in the form of carbon molecules — essential, though not sufficient on its own, to support microbial cells.
The presence of water and carbon molecules are two critical pieces of the habitability puzzle on Ceres. The new findings offer the third: a long-lasting source of chemical energy in Ceres’ ancient past that could have made it possible for microorganisms to survive. This result does not mean that Ceres had life, but rather, that there likely was “food” available should life have ever arisen on Ceres.
This illustration depicts the interior of dwarf planet Ceres, including the transfer of water and gases from the rocky core to a reservoir of salty water. Carbon dioxide and methane are among the molecules carrying chemical energy beneath Ceres’ surface.NASA/JPL-CaltechIn the study, published in Science Advances on Aug. 20, the authors built thermal and chemical models mimicking the temperature and composition of Ceres’ interior over time. They found that 2.5 billion years or so ago, Ceres’ subsurface ocean may have had a steady supply of hot water containing dissolved gases traveling up from metamorphosed rocks in the rocky core. The heat came from the decay of radioactive elements within the dwarf planet’s rocky interior that occurred when Ceres was young — an internal process thought to be common in our solar system.
“On Earth, when hot water from deep underground mixes with the ocean, the result is often a buffet for microbes — a feast of chemical energy. So it could have big implications if we could determine whether Ceres’ ocean had an influx of hydrothermal fluid in the past,” said Sam Courville, lead author of the study. Now based at Arizona State University in Tempe, he led the research while working as an intern at NASA’s Jet Propulsion Laboratory in Southern California, which also managed the Dawn mission.
Catching ChillThe Ceres we know today is unlikely to be habitable. It is cooler, with more ice and less water than in the past. There is currently insufficient heat from radioactive decay within Ceres to keep the water from freezing, and what liquid remains has become a concentrated brine.
The period when Ceres would most likely have been habitable was between a half-billion and 2 billion years after it formed (or about 2.5 billion to 4 billion years ago), when its rocky core reached its peak temperature. That’s when warm fluids would have been introduced into Ceres’ underground water.
The dwarf planet also doesn’t have the benefit of present-day internal heating generated by the push and pull of orbiting a large planet, like Saturn’s moon Enceladus and Jupiter’s moon Europa do. So Ceres’ greatest potential for habitability-fueling energy was in the past.
This result has implications for water-rich objects throughout the outer solar system, too. Many of the other icy moons and dwarf planets that are of similar size to Ceres (about 585 miles, or 940 kilometers, in diameter) and don’t have significant internal heating from the gravitational pull of planets could have also had a period of habitability in their past.
More About DawnA division of Caltech in Pasadena, JPL managed Dawn’s mission for NASA’s Science Mission Directorate in Washington. Dawn was a project of the directorate’s Discovery Program, managed by NASA’s Marshall Space Flight Center in Huntsville, Alabama. JPL was responsible for overall Dawn mission science. Northrop Grumman in Dulles, Virginia, designed and built the spacecraft. The German Aerospace Center, Max Planck Institute for Solar System Research, Italian Space Agency and Italian National Astrophysical Institute were international partners on the mission team.
For a complete list of mission participants, visit:
https://solarsystem.nasa.gov/missions/dawn/overview/
News Media ContactsGretchen McCartney
Jet Propulsion Laboratory, Pasadena, Calif.
818-287-4115
gretchen.p.mccartney@jpl.nasa.gov
Karen Fox / Molly Wasser
NASA Headquarters, Washington
2025-108
Share Details Last Updated Aug 20, 2025 Related Terms Explore More 6 min read NASA, IBM’s ‘Hot’ New AI Model Unlocks Secrets of SunEditor’s Note: This article was updated Aug. 20, 2025, to correct the number of years of…
Article 7 hours ago 4 min read NASA’s Psyche Captures Images of Earth, Moon Article 1 day ago 3 min read Summer Triangle Corner: AltairAltair is the last stop on our trip around the Summer Triangle! The last star…
Article 5 days ago Keep Exploring Discover Related TopicsMissions
Humans in Space
Climate Change
Solar System
Viking 1 Begins Journey to Mars
Viking 1 Begins Journey to Mars
A Titan-Centaur rocket carrying the Viking 1 spacecraft launches from Complex 41 at Cape Canaveral Air Force Station on Aug. 20, 1975. Viking 1 touched down on the red planet on July 20, 1976, becoming the first truly successful landing on Mars. Viking 1 was the first of a pair of complex deep space probes that were designed to reach Mars and to collect evidence on the possibility on life on Mars.
NASA’s exploration of Mars continues, with rovers exploring the planet’s surface and spacecraft studying from orbit. The agency’s Artemis missions will also lay the groundwork for the first crewed missions to Mars.
Learn more about Viking 1 and see the first photo it took upon landing.
Image credit: NASA
Bring NASA Science into Your Library!
2 min read
Bring NASA Science into Your Library!Calling all librarians! NASA sponsors dozens of research projects that need help from you and the people in your community. These projects invite everyone who’s interested to collaborate with scientists, investigating mysteries from how star systems form to how our planet sustains life. You can help by making observations with your cell phone or by studying fresh data on your laptop from spacecraft like the James Webb Space Telescope. You might discover a near-Earth asteroid or a new food option for astronauts. Participants learn new skills and meet scientists and other people around the world with similar interests.
Interested in sharing these opportunities with your patrons? Join us on August 26, 2025 at 1 p.m. EST for a 1-hour online information session. A librarian and a participatory science professional will provide you with a NASA Citizen Science Librarian Starter Kit and answer all your questions. The kit includes everything you need to host a NASA Science Program for patrons of all ages.
- Editable poster to advertise event
- Event prep guide (for the host and for the space)
- Community connection ideas
- Editable event agenda
- Handout for participants
Scan the QR code above or go to https://shorturl.at/tKfTt to register for the session.
Kara Reiman, Librarian and Educator (Left) and Sarah Kirn, Participatory Science Strategist, NASA (Right) Share Details Last Updated Aug 20, 2025 Related Terms Explore More 2 min read A Gigantic Jet Caught on Camera: A Spritacular Moment for NASA Astronaut Nicole Ayers!Astronaut Captures Rare Gigantic Jet from Space On July 3, 2025, NASA astronaut Nichole Ayers…
Article
1 week ago
1 min read Snapshot Wisconsin Celebrates 10 Years and 100 Million Photos Collected!
The Snapshot Wisconsin project recently collected their 100 millionth trail camera photo! What’s more, this…
Article
2 weeks ago
4 min read STEM Educators Are Bringing Hands-On NASA Science into Virginia Classrooms
Article
2 weeks ago
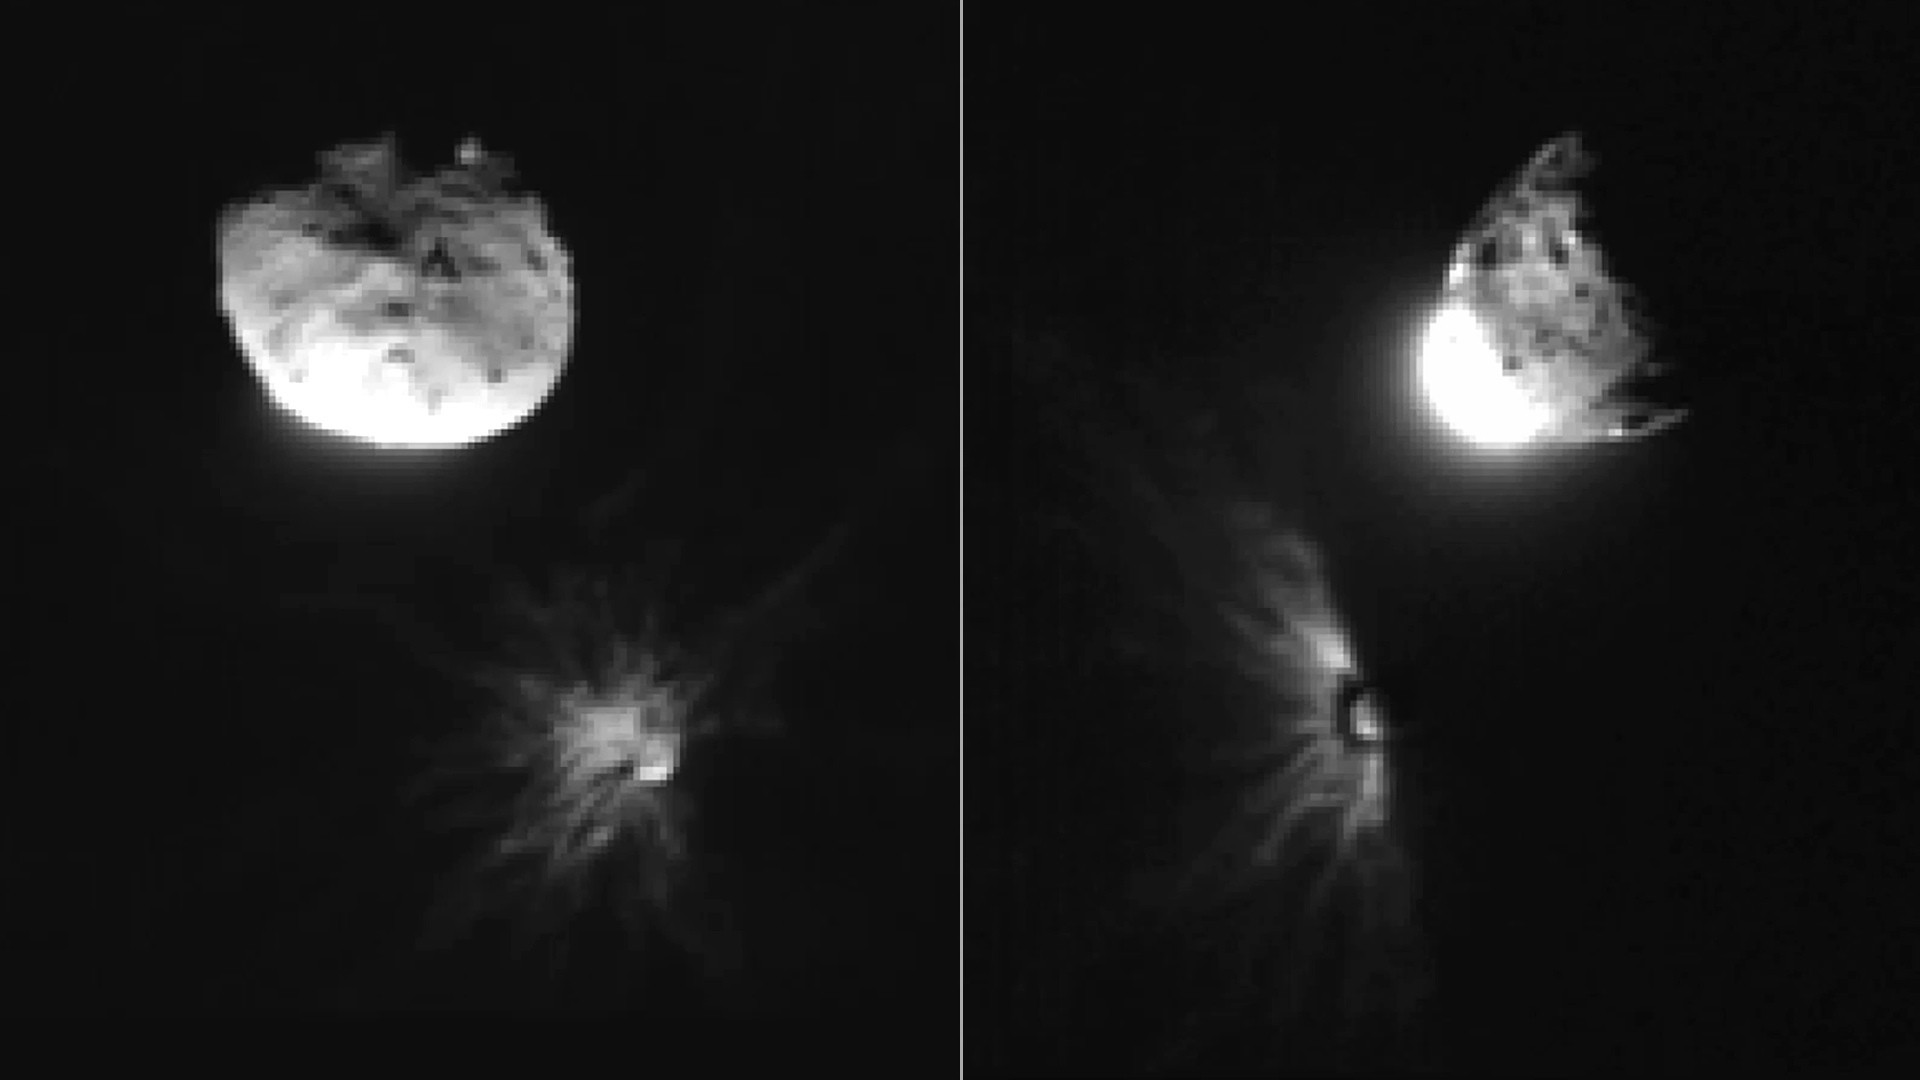
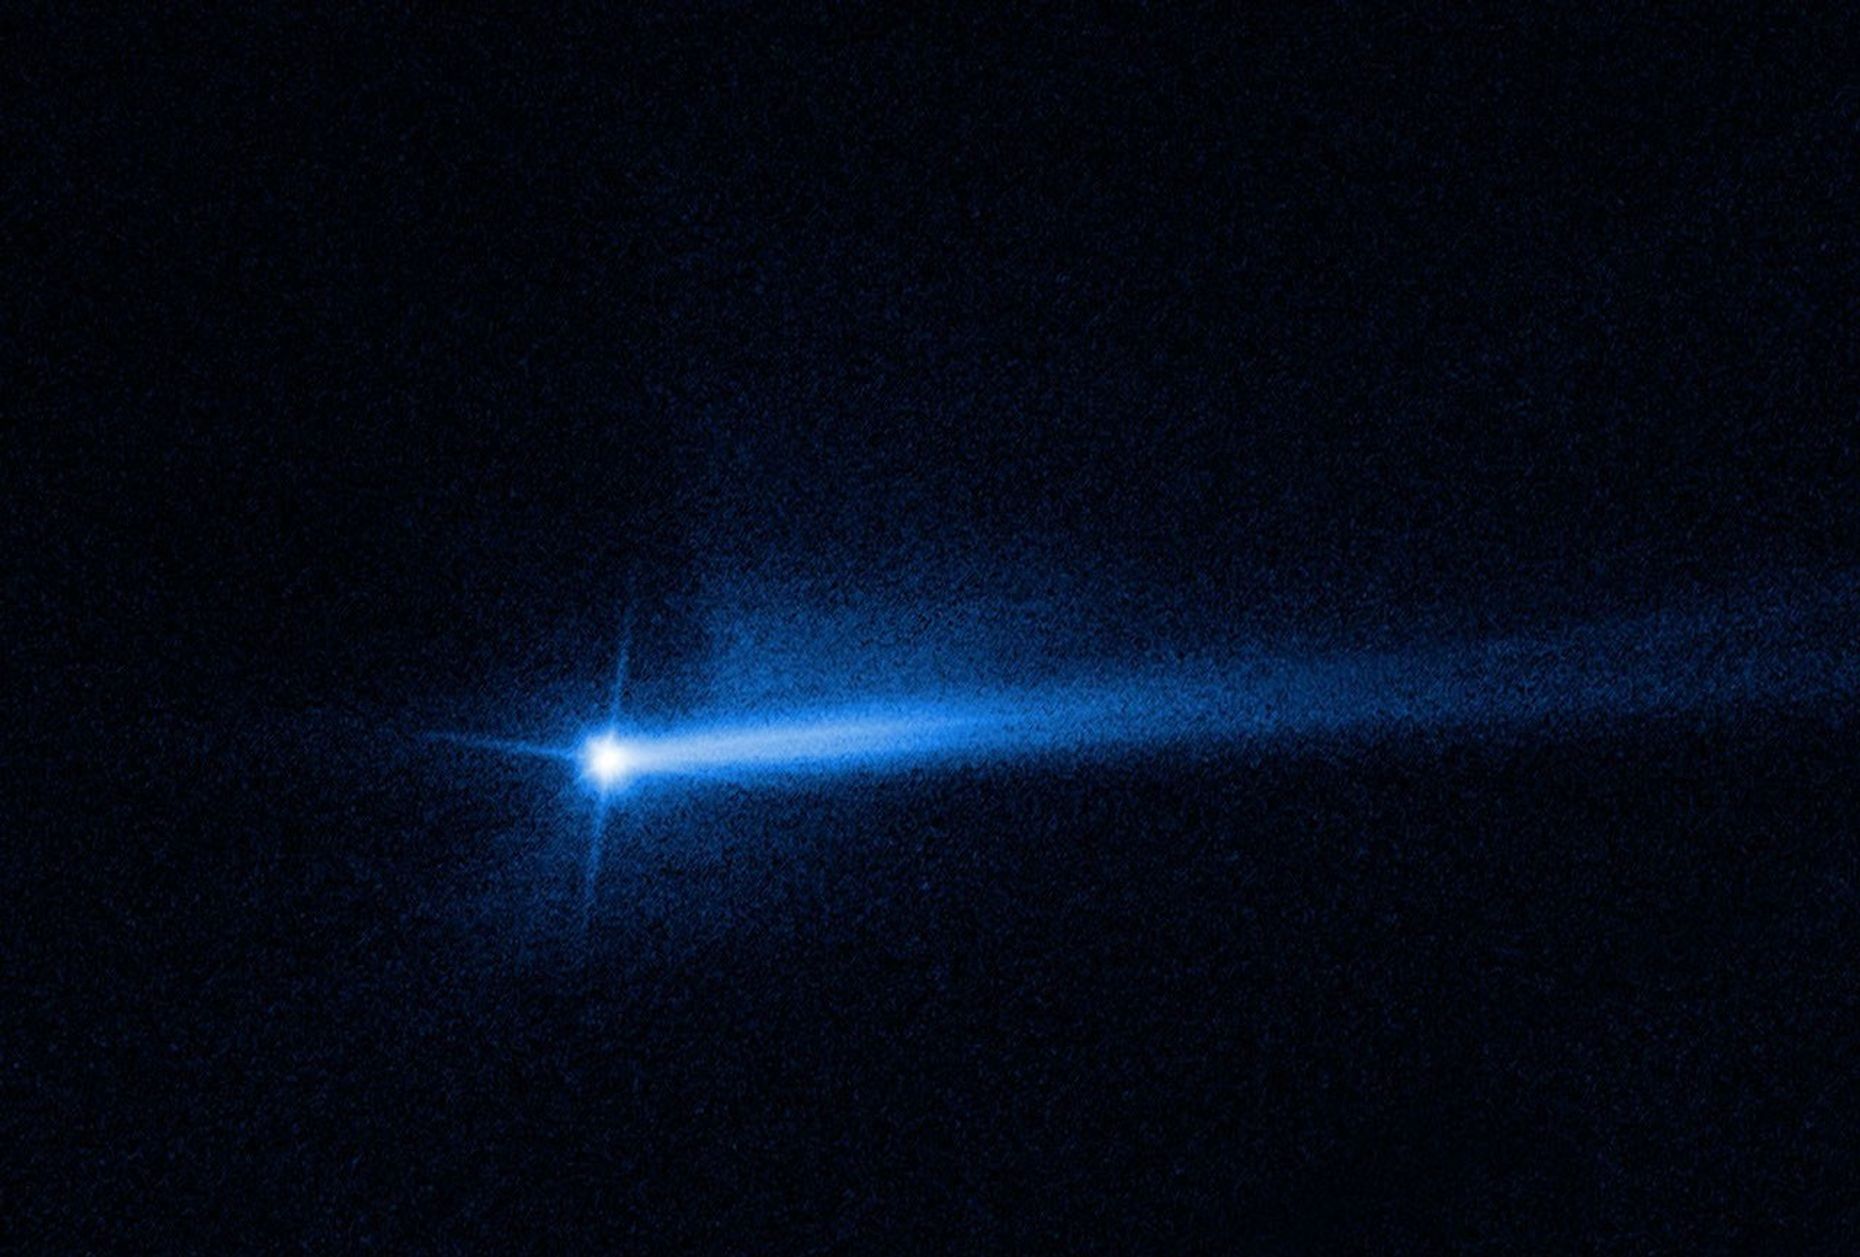
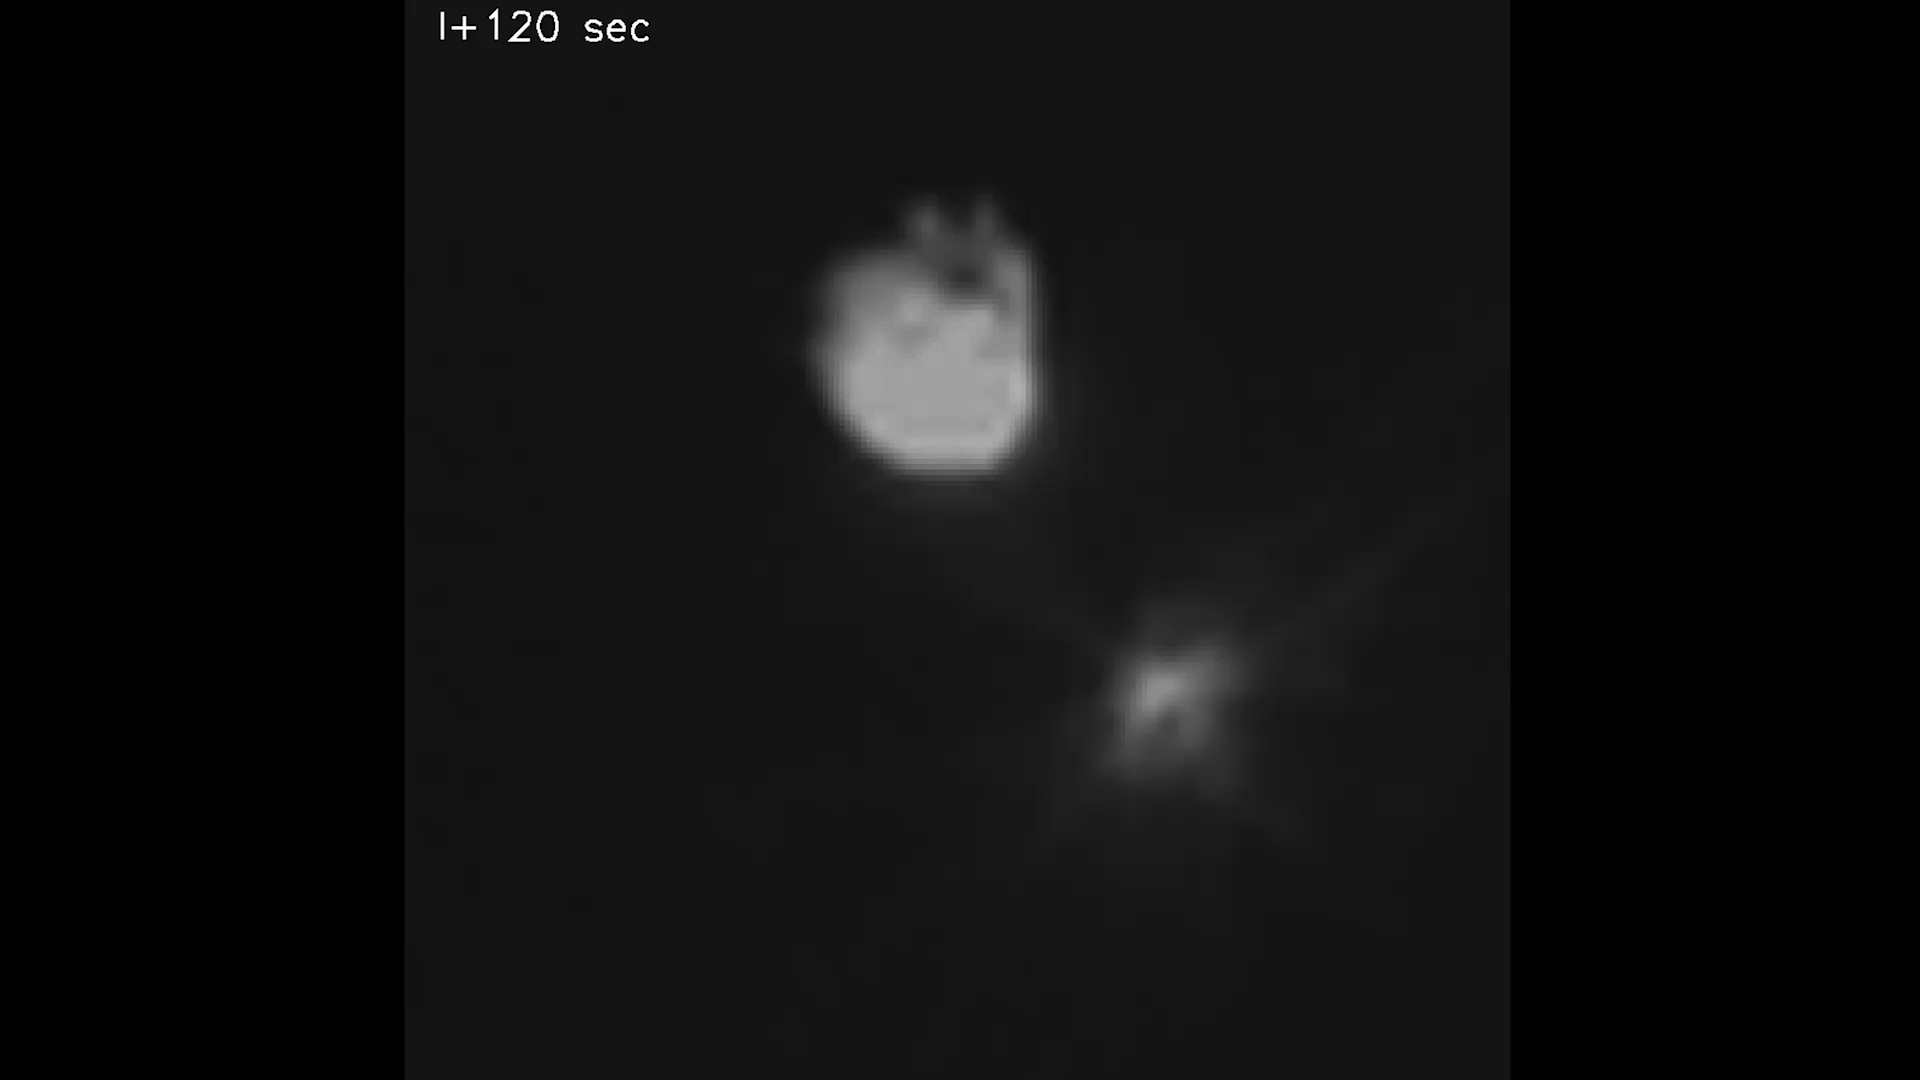
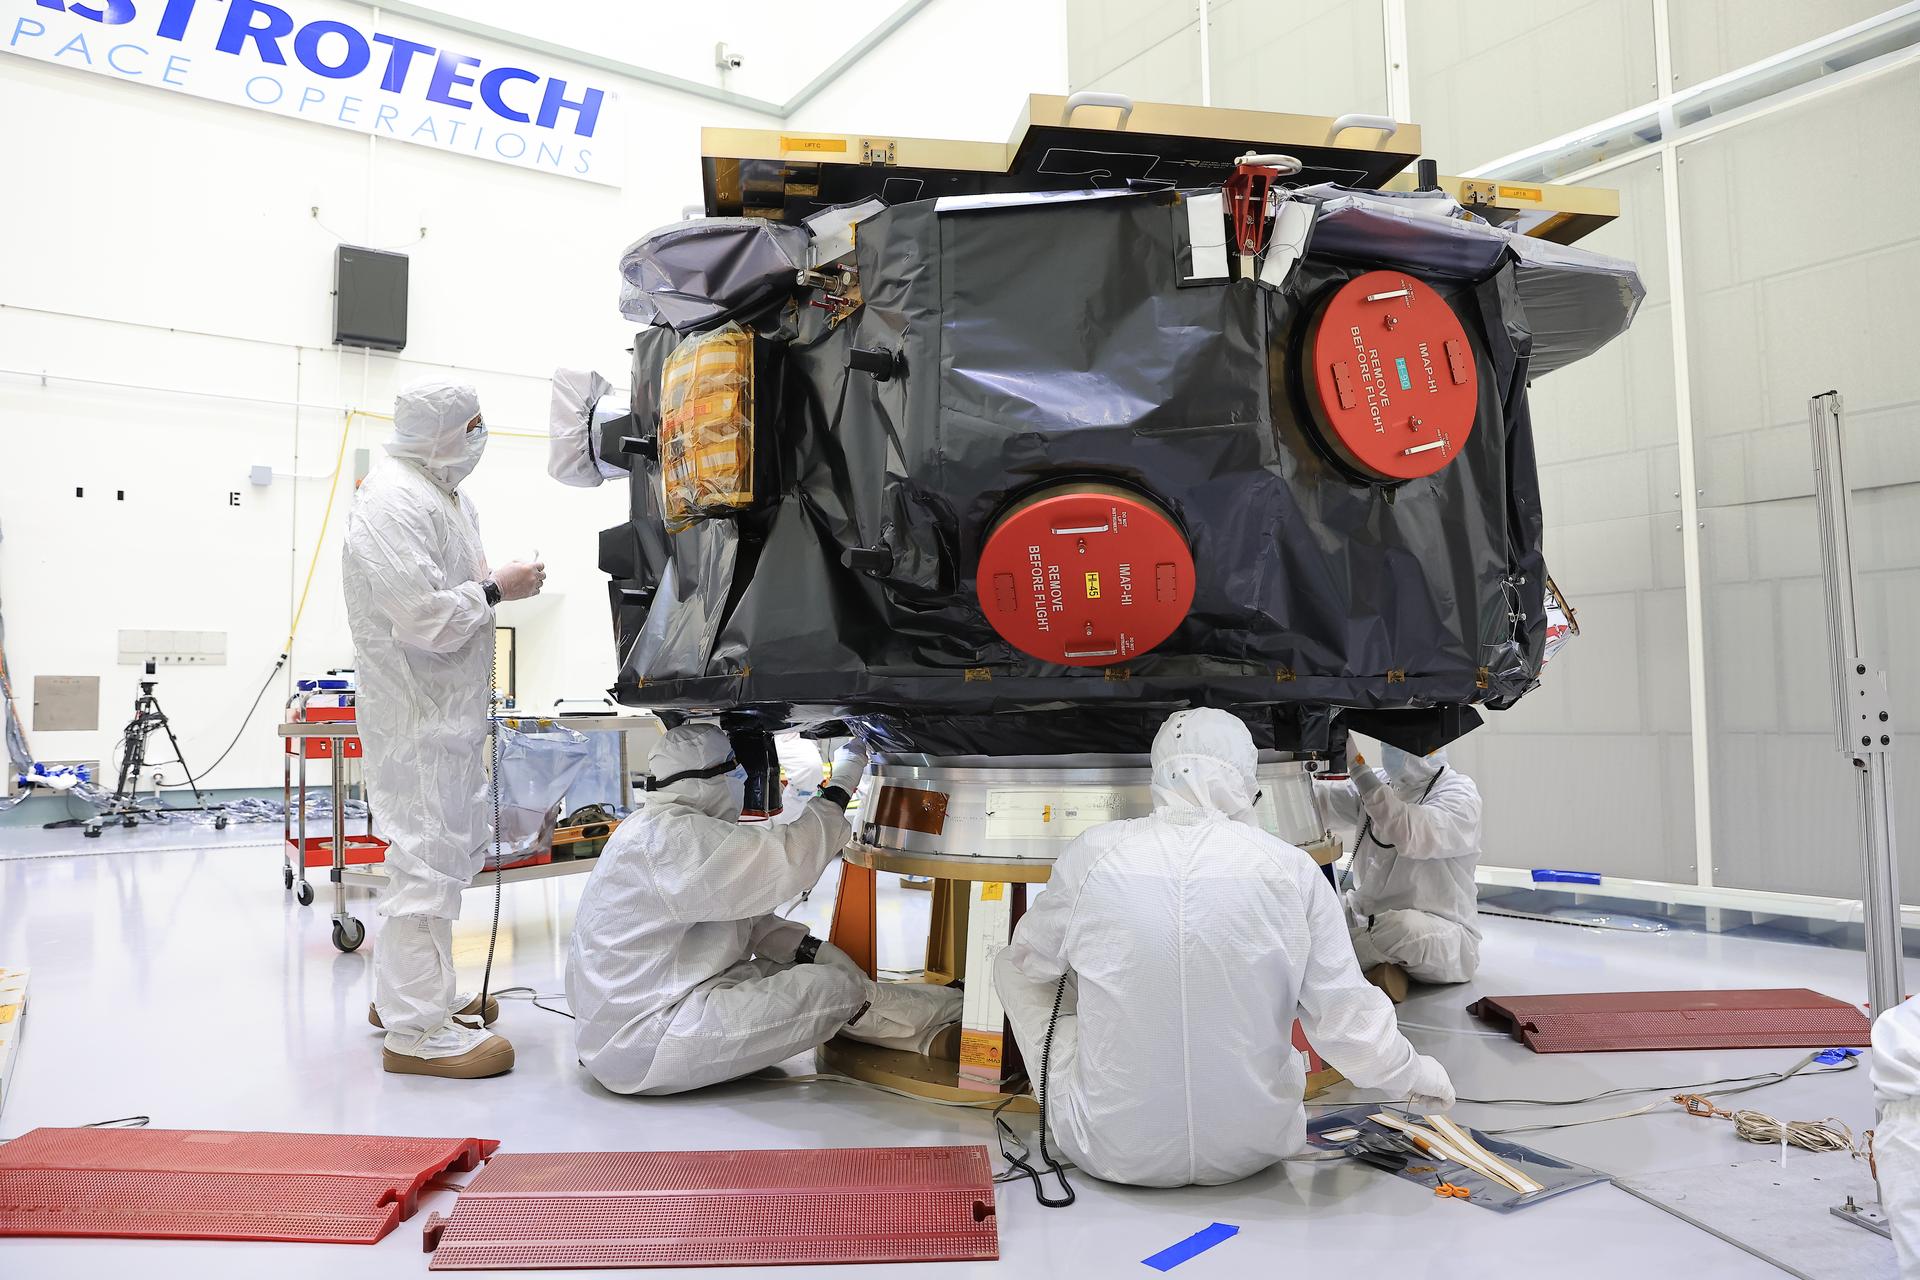
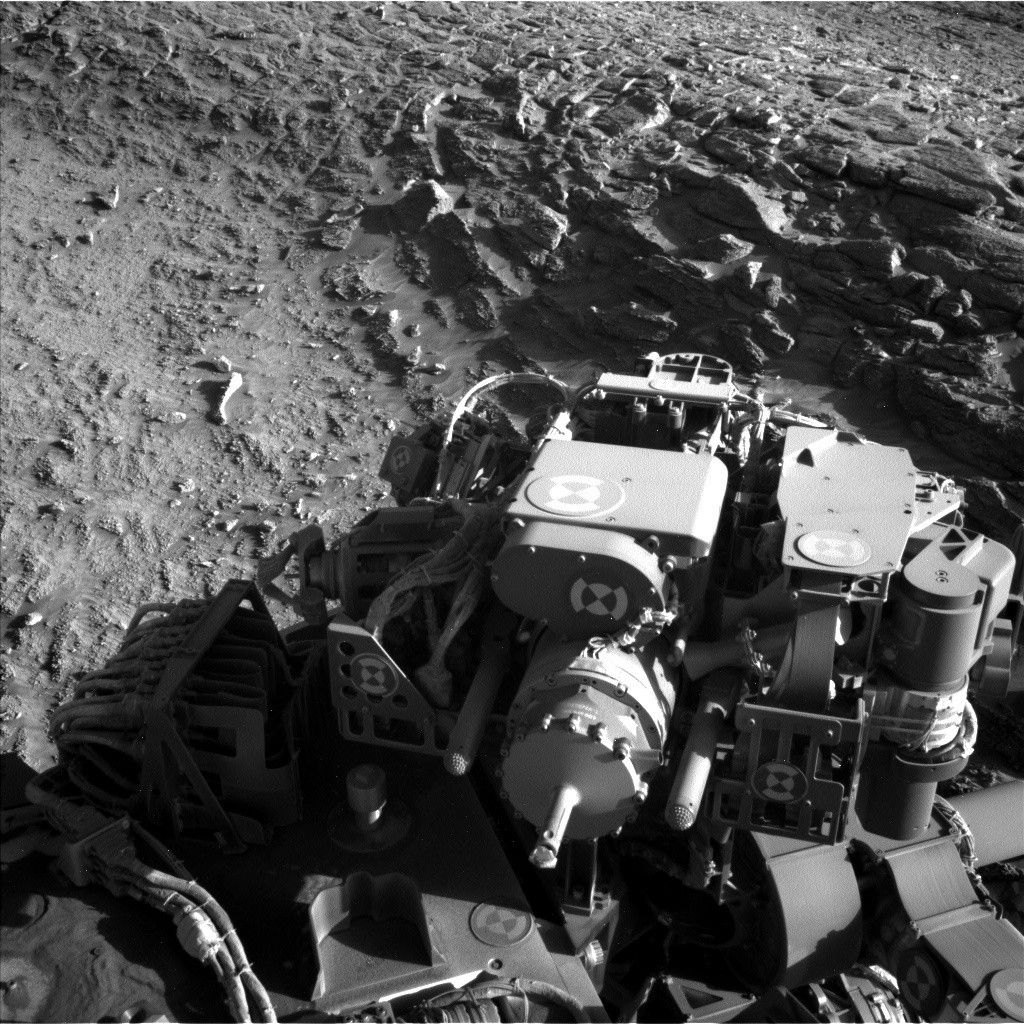
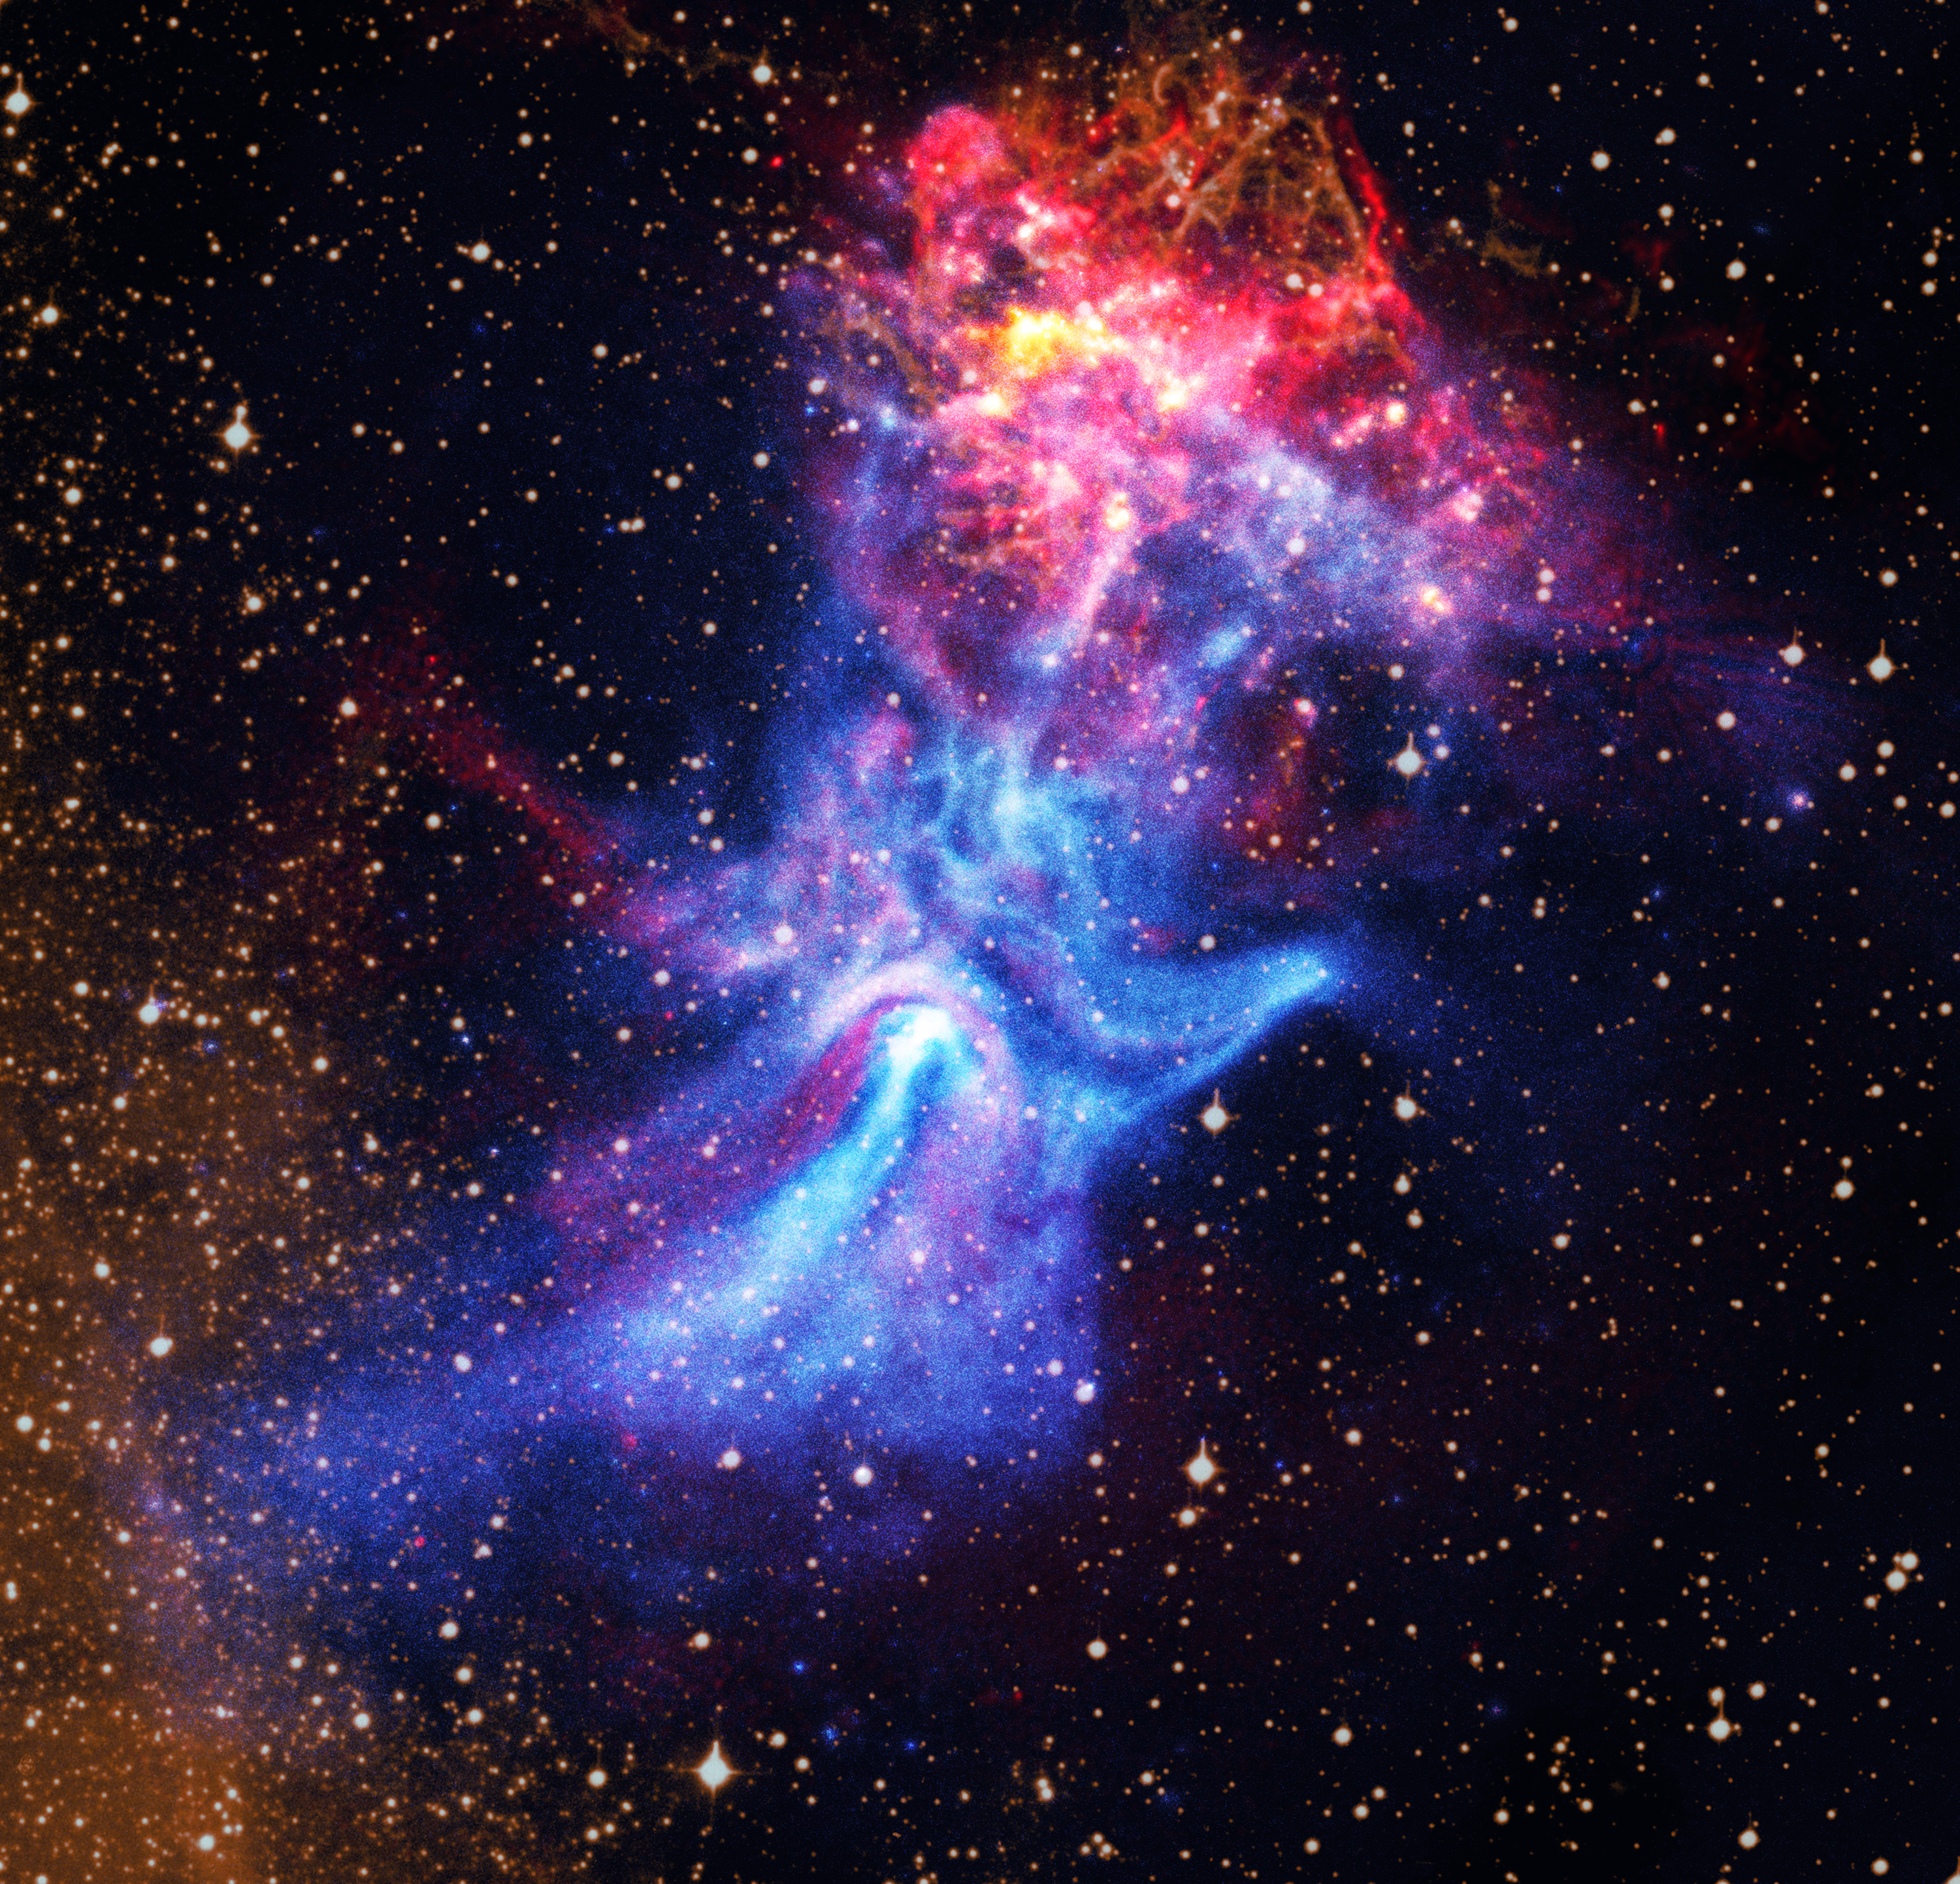
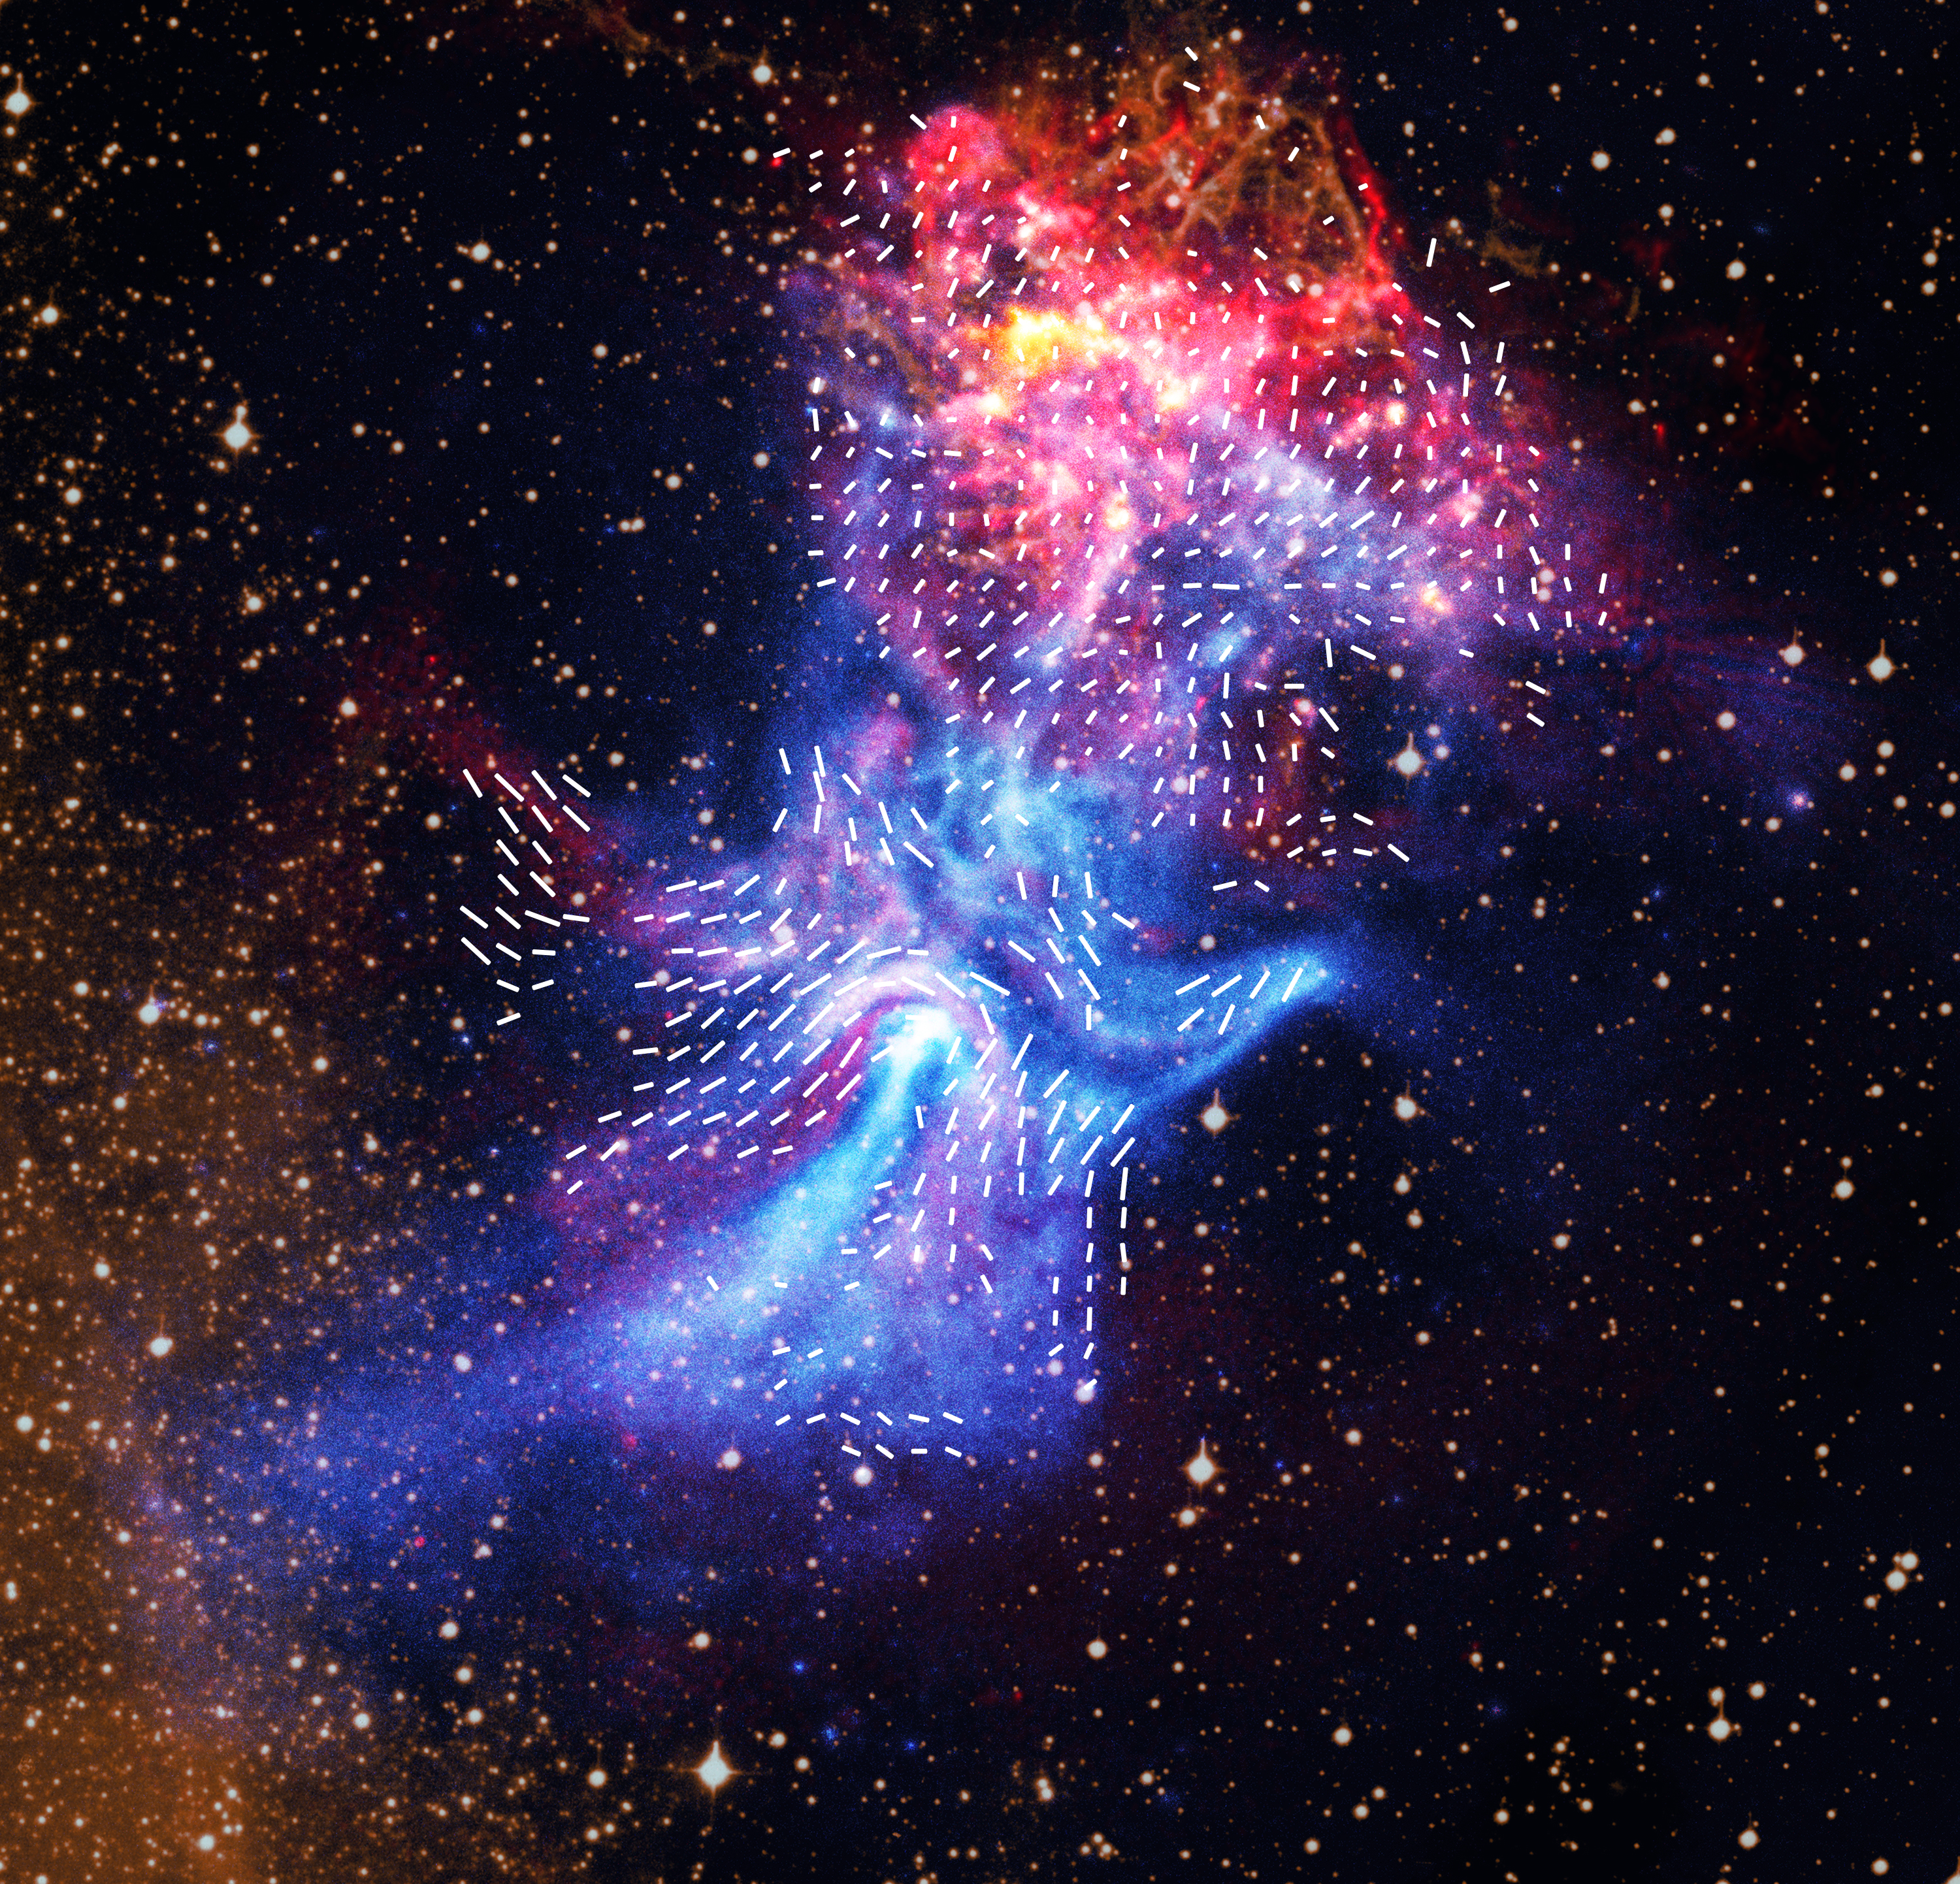
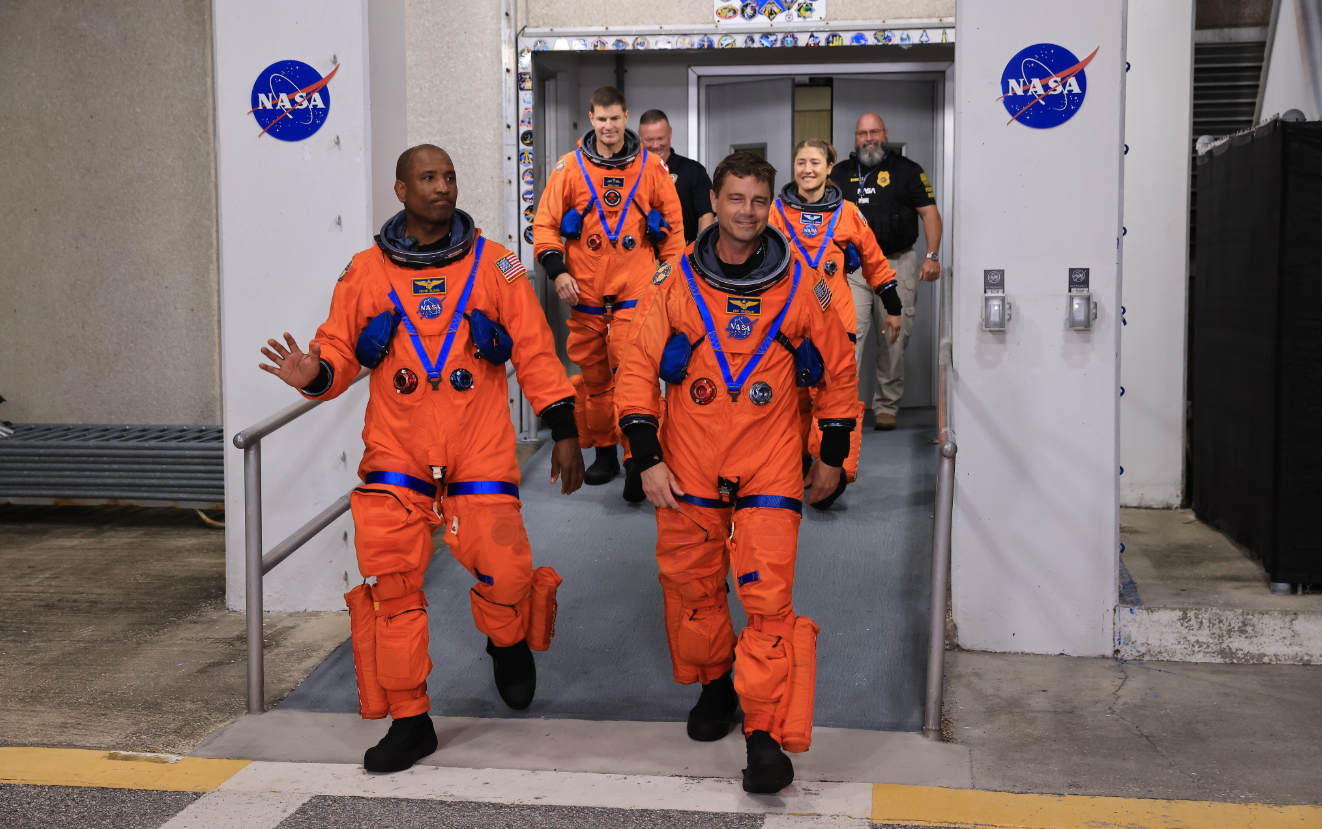
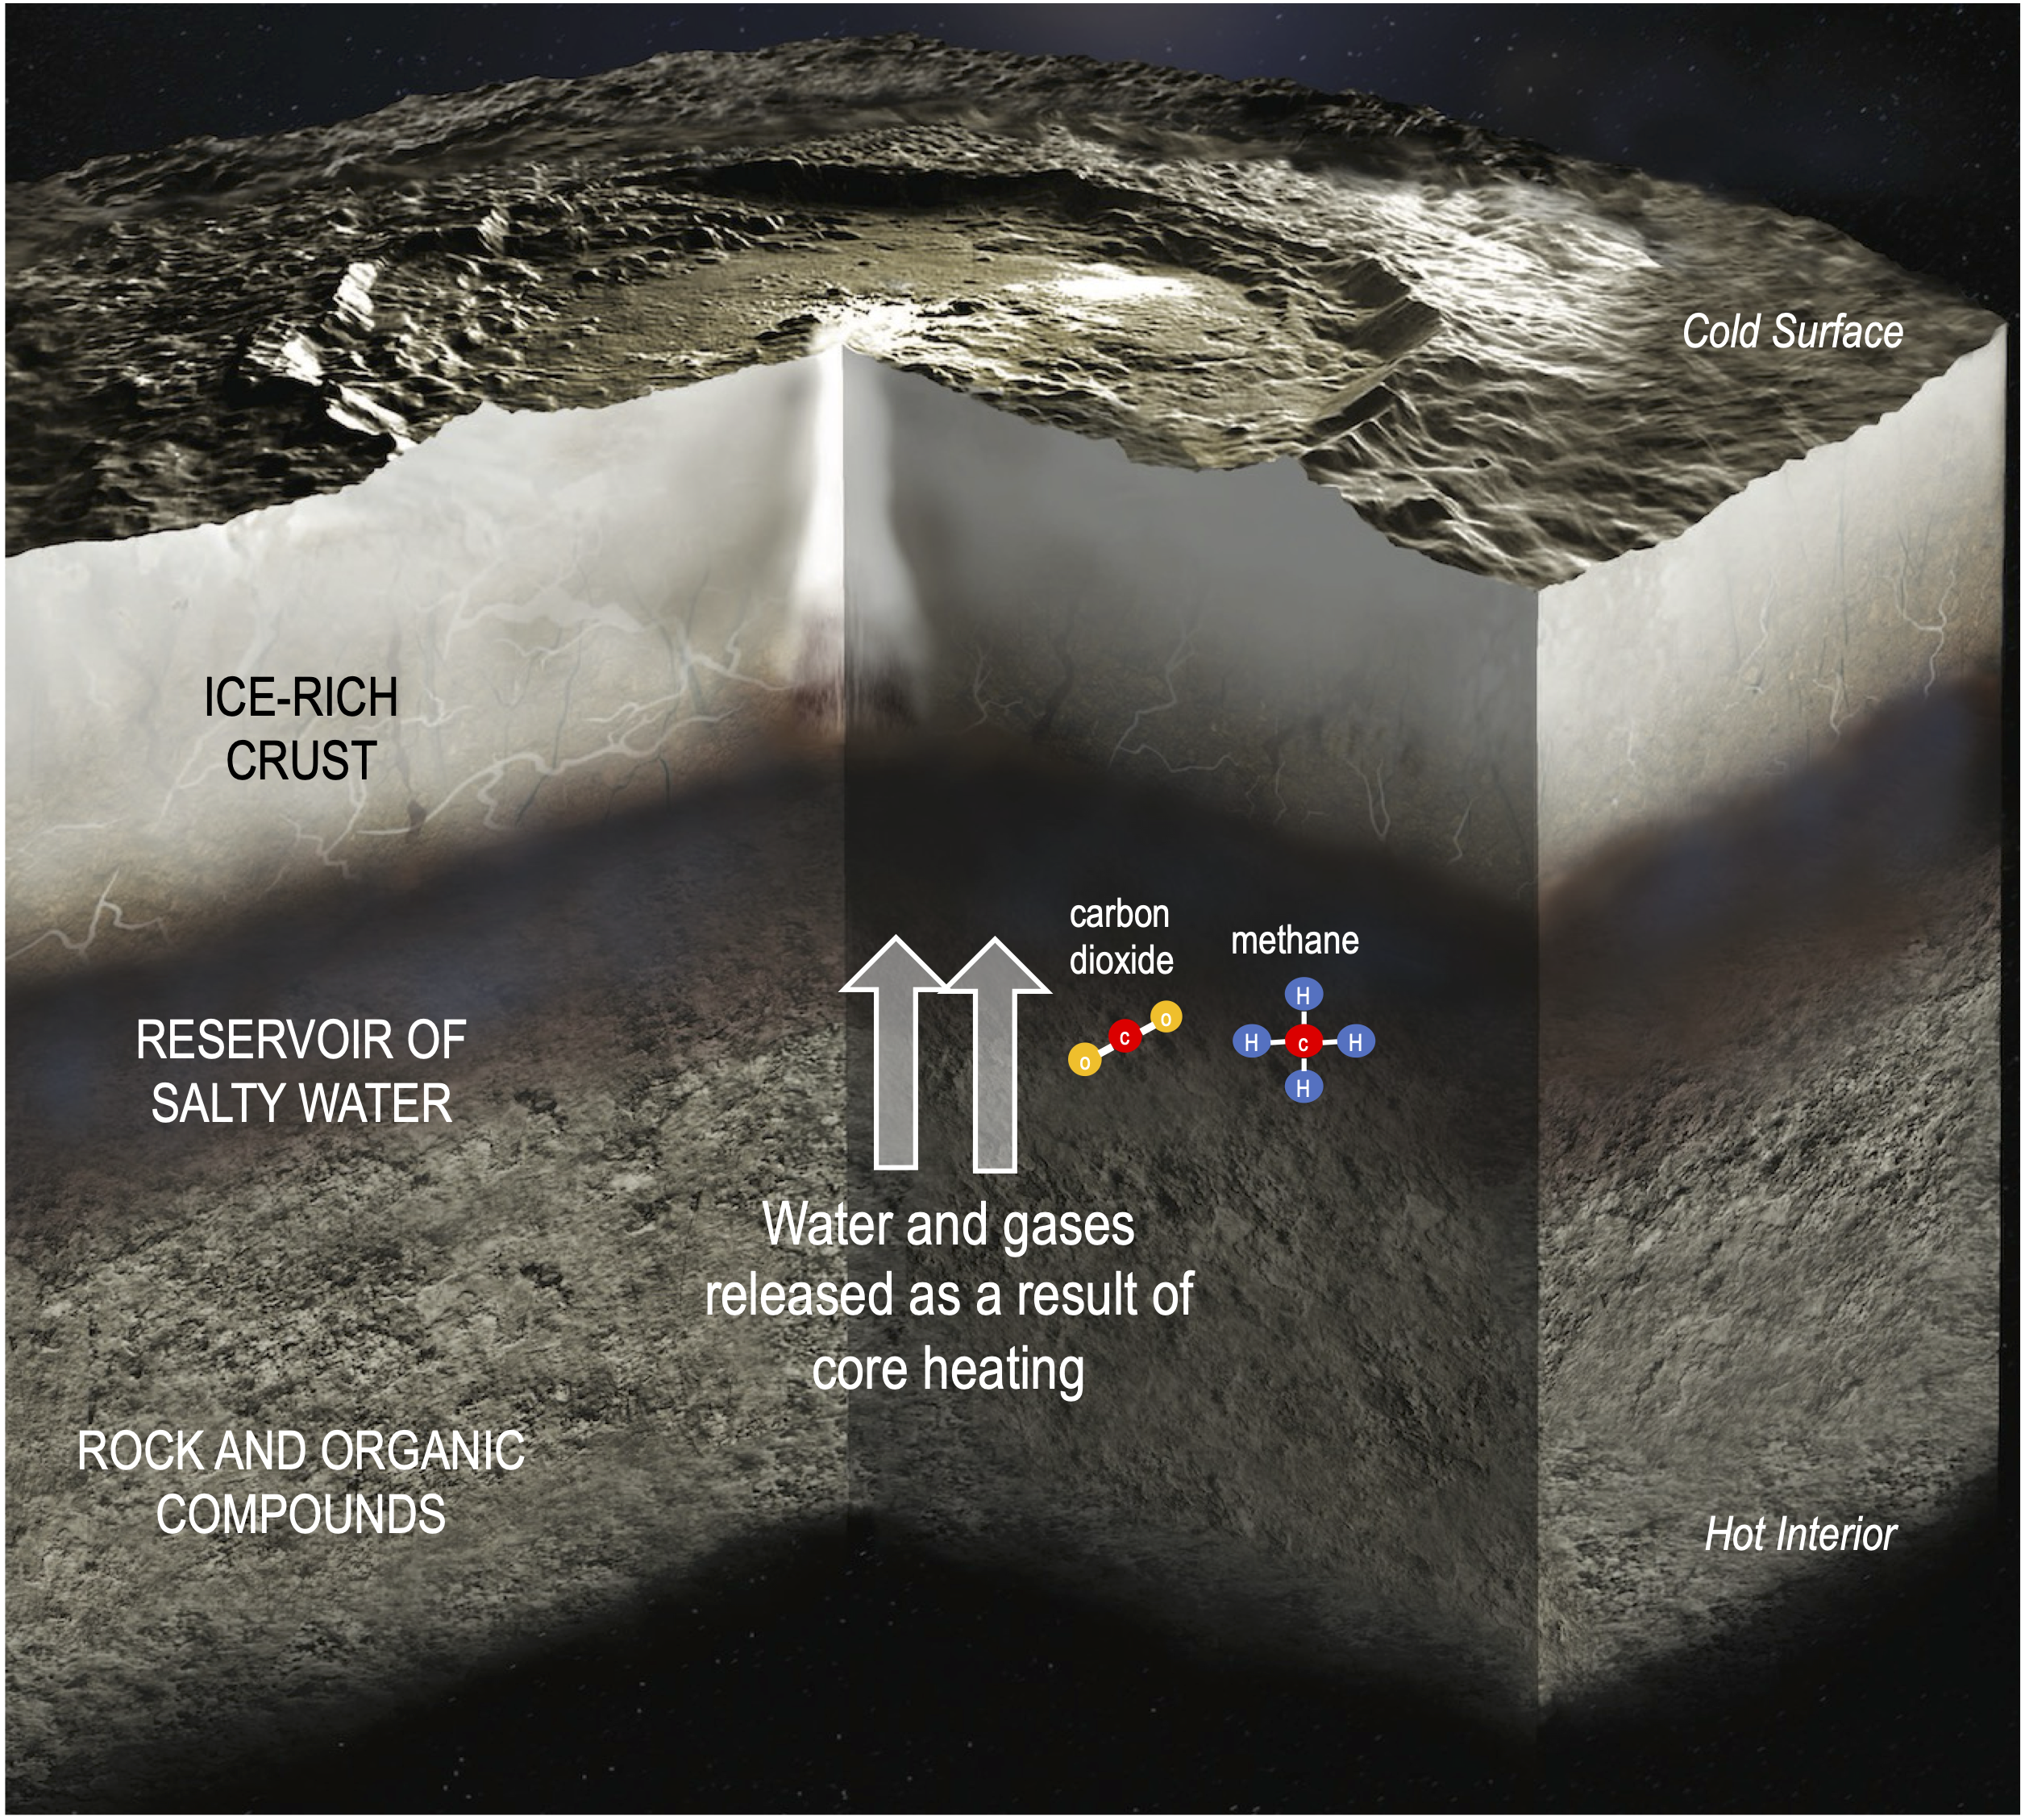