
Feed aggregator
Marathon: Release date, trailers & everything we know about Bungie's extraction shooter
SpaceX launches Starlink satellites to orbit on 70th Falcon 9 flight of the year (photos)
How the Mathematics of Honesty Underlies These Auctions
Here's the surprising math at the heart of auction theory
Central Brazil Cerrado
Central Brazil Cerrado
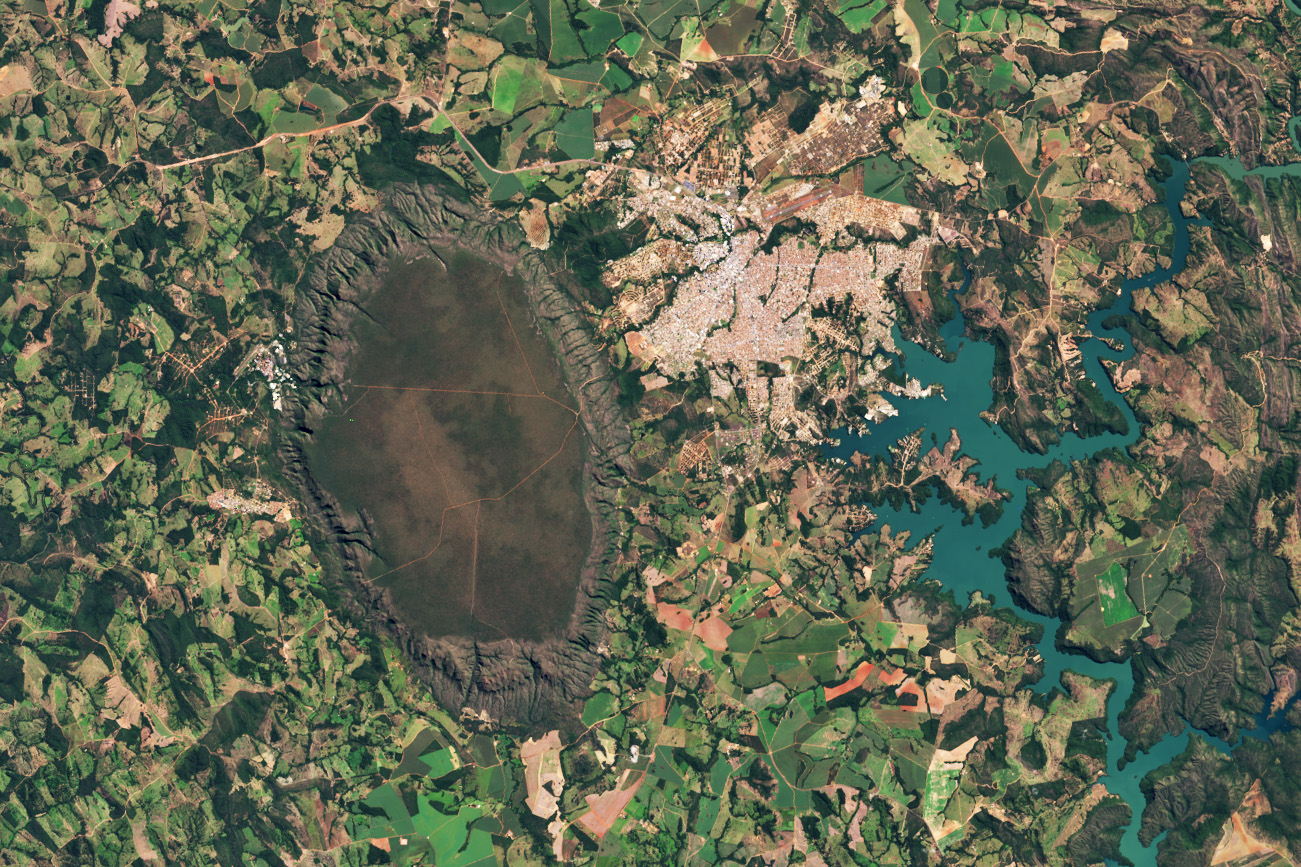
On May 19, 2025, Landsat 9 captured this image of the Serra de Caldas in the state of Goiás, Brazil. The oval plateau is covered by a biologically rich savanna and grassland ecosystem called Cerrado. The Cerrado covers about one-fifth of Brazil’s land area and represents the second-largest biome in South America behind the Amazon. These lands are home to thousands of plant, bird, reptile, and mammal species, many of which are found nowhere else on the planet.
Learn more about this area sometimes referred to as the “cradle of waters.”
Text credit: Lindsey Doermann
Image credit: NASA/Wanmei Liang; Landsat data: USGS
Central Brazil Cerrado
On May 19, 2025, Landsat 9 captured this image of the Serra de Caldas in the state of Goiás, Brazil. The oval plateau is covered by a biologically rich savanna and grassland ecosystem called Cerrado. The Cerrado covers about one-fifth of Brazil’s land area and represents the second-largest biome in South America behind the Amazon. These lands are home to thousands of plant, bird, reptile, and mammal species, many of which are found nowhere else on the planet.
Learn more about this area sometimes referred to as the “cradle of waters.”
Text credit: Lindsey Doermann
Image credit: NASA/Wanmei Liang; Landsat data: USGS
Starlink satellites are leaking radio signals that may ruin astronomy
Starlink satellites are leaking radio signals that may ruin astronomy
How to Protect Yourself from Recent Salmonella Outbreak in Recalled Eggs
To prevent Salmonella food poisoning, refrigerate your eggs, cook them well, never eat them raw and clean, clean, clean
Missions to Mars with the Starship Could Only Take Three Months
In a recent paper, UCSB physicist Jack Kingdon identified a trajectory for a rapid transit (90 days) to Mars using SpaceX's Starship. This proposal offers an alternative to mission architectures that rely on nuclear propulsion to reduce transit times.
Future Telescopes Could Detect Life Managing their Planet Atmospheres
The challenge in the search for habitable worlds is clear. We need to be able to identify habitable worlds and distinguish between biotic and abiotic processes. Ideally, scientists would do this on entire populations of exoplanets rather than on a case-by-case basis. Exoplanets' natural thermostats might provide a way of doing this.
The chilling discovery that nerve cells help cancers grow and spread
The chilling discovery that nerve cells help cancers grow and spread
Sauropod dinosaur's last meal reveals that it didn't bother to chew
Sauropod dinosaur's last meal reveals that it didn't bother to chew
A Mysterious Kidney Disease Epidemic Is Killing Thousands of Young Men. What’s behind It?
As cases of chronic kidney disease emerge in outdoor laborers around the world, scientists are finding that repeated damage from prolonged extreme heat seems to be a leading factor to kidney failure
Astronomers discover 15 new giant radio galaxies — the largest single objects in the universe
NASA’s TROPICS Mission: Offering Detailed Images and Analysis of Tropical Cyclones
9 min read
NASA’s TROPICS Mission: Offering Detailed Images and Analysis of Tropical CyclonesIntroduction
Tropical cyclones represent a danger to life, property, and the economies of communities. Researchers who study tropical cyclones have focused on remote observations using space-based platforms to image these storms, inform forecasts, better predict landfall, and improve understanding of storm dynamics and precipitation evolution – see Figure 1.
Figure 1. TROPICS imagery of Typhoon Kong-rey observed on October 29, 2024, near 205 GHz revealing a large and well-defined eye. Figure credit: U.S. Naval Research Laboratory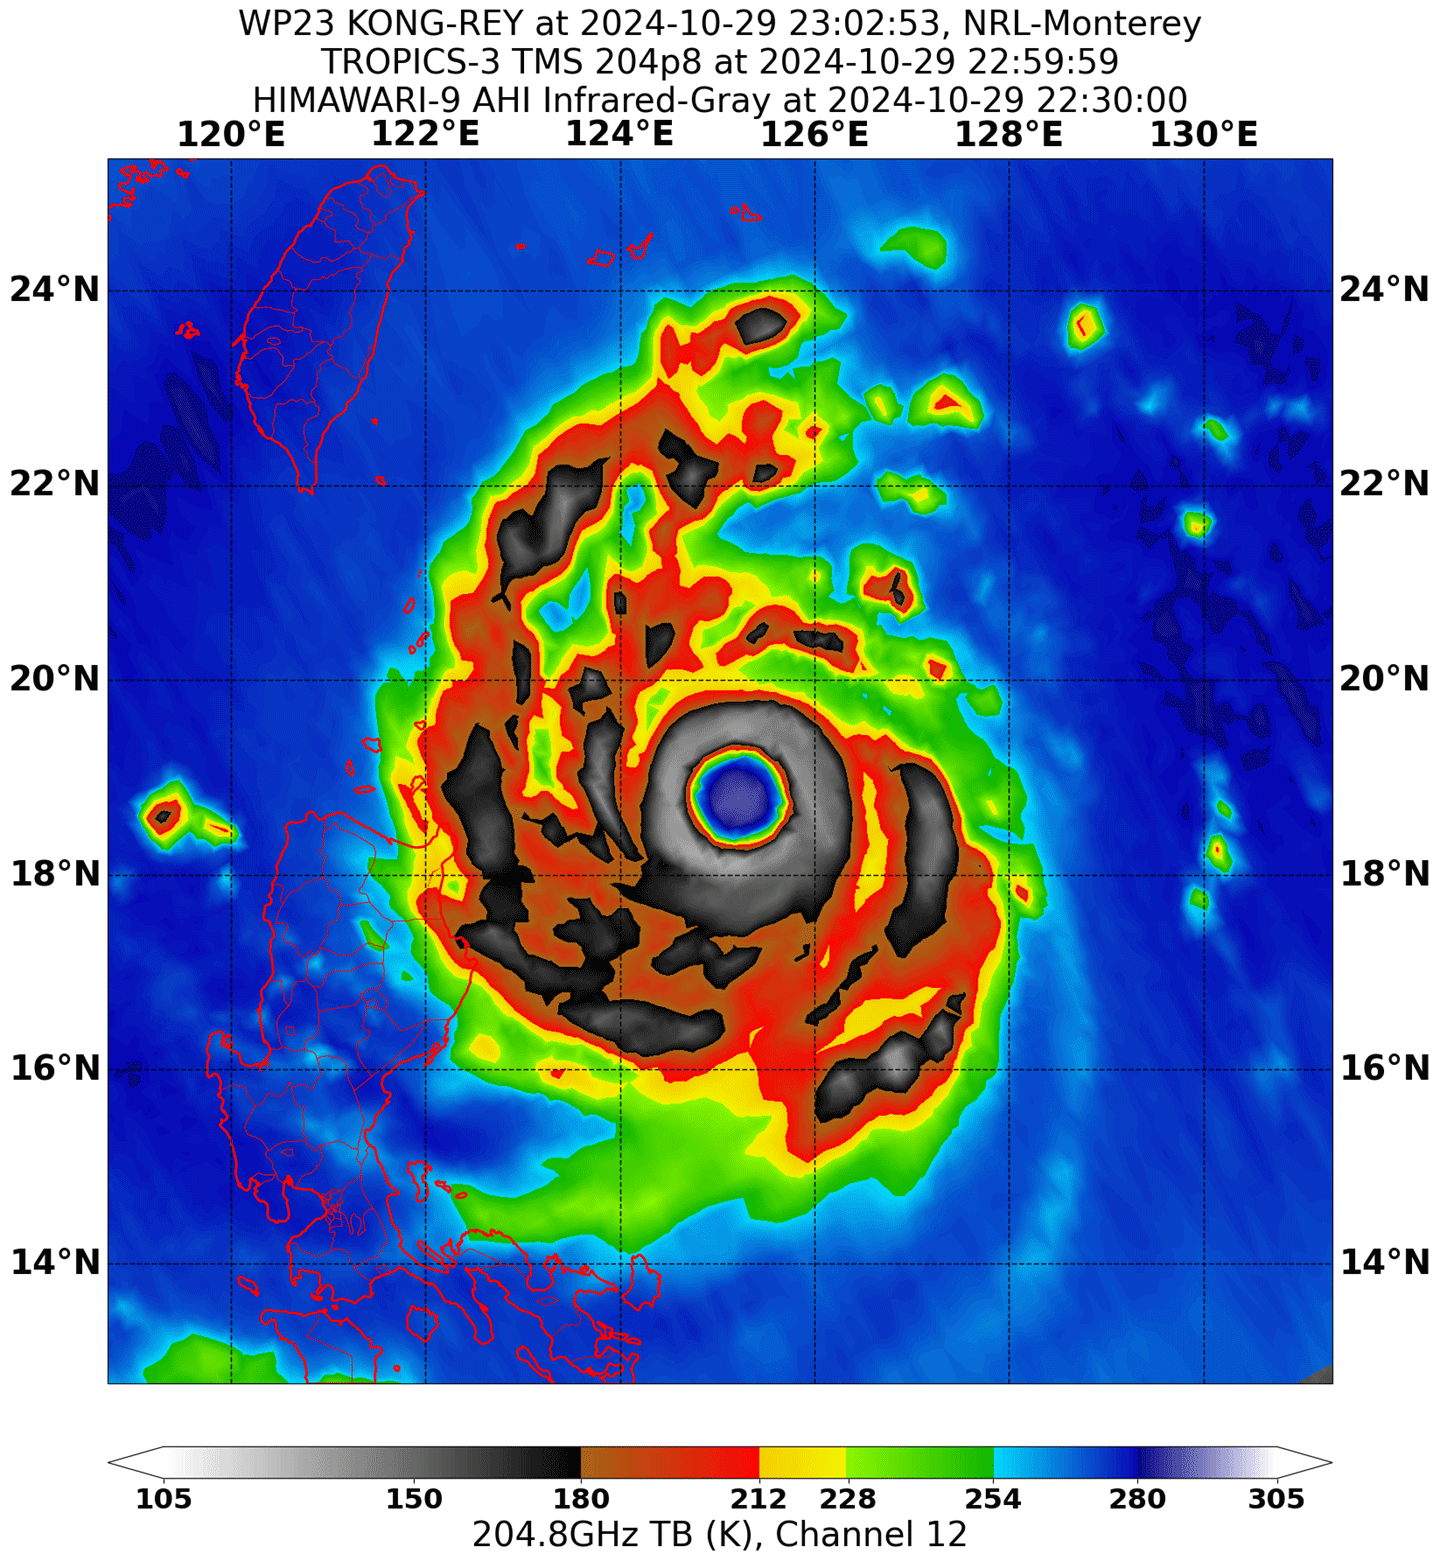
The tropical cyclone community has leveraged data from Earth observing platforms for more than 30 years. These data have been retrieved from numerous instruments including: the Advanced Baseline Imager (ABI) on the National Oceanic and Atmospheric Administration’s (NOAA) Geostationary Operational Environmental Satellite (GOES)–Series R satellites; the Tropical Rainfall Measuring Mission (TRMM) Microwave Imager (TMI); the Global Precipitation Measurement (GPM) Microwave Imager (GMI); the Special Sensor Microwave Imager/Sounder (SSMIS) on the Defense Meteorological Satellite (DMSP) satellites; the Advanced Microwave Scanning Radiometer (AMSR-E) on Aqua; AMSR2 on the Japan Aerospace Exploration Agency’s (JAXA) Global Change Observation Mission–Water (GCOM-W) mission; the Advanced Microwave Sounding Unit (AMSU) on Aqua and the Advanced Technology Microwave Sounder (ATMS) on the NASA–NOAA Suomi National Polar-Orbiting Partnership (Suomi NPP), NOAA-20, and NOAA-21; the Moderate Resolution Imaging Spectroradiometer (MODIS) on NASA’s Terra and Aqua platforms; and the Visible Infrared Imaging Radiometer Suite (VIIRS) on Suomi NPP, as well as on the first two Joint Polar Satellite System (JPSS) missions (i.e., NOAA-20 and NOAA-21).
Despite having decades of data at their disposal, scientists lack data from instruments placed in low-inclination orbits that provide more frequent views within tropical regions. This limitation is especially pronounced in the tropical and subtropical latitudes, which is where tropical storms develop and intensify.
The NASA Time-Resolved Observations of Precipitation structure and storm Intensity with a Constellation of Smallsats (TROPICS) grew from the Precipitation and All-weather Temperature and Humidity (PATH) to address a need for obtaining three-dimensional (3D) temperature and humidity measurements as well as precipitation with a temporal revisit rate of one hour or better – see Figure 2. TROPICS uses multiple small satellites flying in a carefully engineered formation to obtain rapid revisits of measurements of precipitation structure within the storms, as well as temperature and humidity profiles, both within and outside of the storms, including the intensity of the upper-level warm core. In addition, the instruments provide a median revisit time of about one hour. The data gathered also informs changes in storm track and intensity and provides data to improve weather prediction models.
The imagery is focused on inner storm structure (near 91 and 205 GHz), temperature soundings (near 118 GHz), and moisture soundings (near 183 GHz). Spatial resolution at nadir is approximately 24 km (16.8 mi) for temperature and 17 km (10.6 mi) for moisture and precipitation, covering a swath of approximately 2000 km (1243 mi) in width. Researchers can use TROPICS data to create hundreds of high-resolution images of tropical cyclones throughout their lifecycle.
Figure 2. TROPICS space vehicle showing the CubeSat bus, radiometer payload, and deployed articulated solar array. Figure credit: Blue Canyon Technologies and MIT Lincoln Laboratory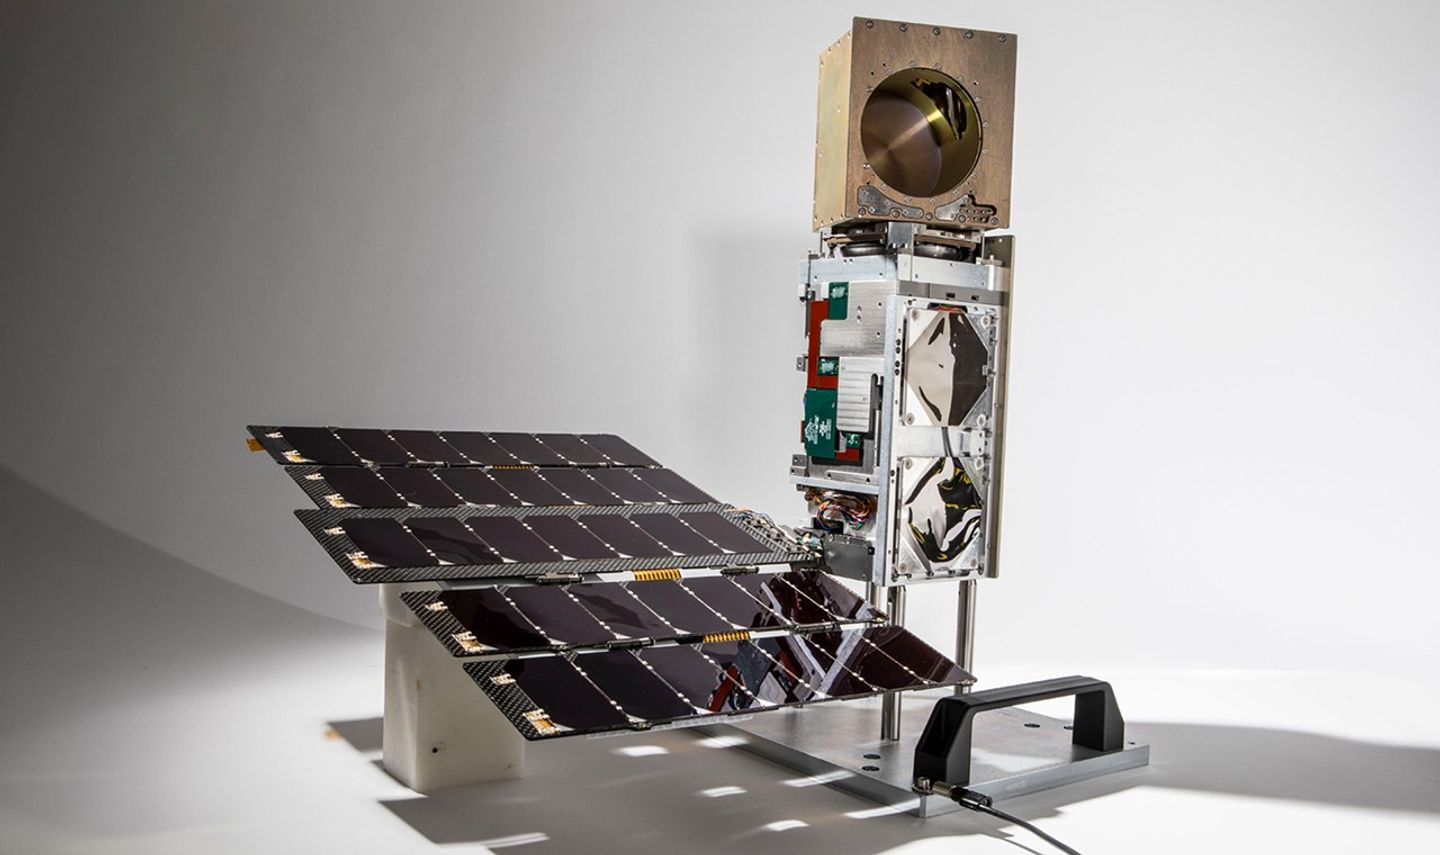
This article provides an overview of the two years of successful science operations of TROPICS, with a focus on the suite of geophysical Level-2 (L2) products (e.g., atmospheric vertical temperature and moisture profiles, instantaneous surface rain rate, and tropical cyclone intensity) and the science investigations resulting from these measurements. The complete article, available in the Proceedings of the IEEE: Special Issue on Satellite Remote Sensing of the Earth, provides more comprehensive details of the results.
From Pathfinder to Constellation
A single TROPICS satellite was launched as a Pathfinder vehicle on June 30, 2021, aboard a SpaceX Falcon 9 rideshare into a Sun-synchronous polar orbit. TROPICS was originally conceived as a six-satellite constellation, with two satellites launched into each of three low-inclination orbits. Regrettably, the first launch, on June 22, 2022, aboard an Astra Rocket 3.3, failed to reach orbit. While unfortunate, the mission could still proceed with four satellites and meet its baseline revisit rate requirement (with no margin), with the silver lining of an extra year of data gathered from TROPICS Pathfinder that allowed the tropical cyclone research community to prepare and test communications systems and data processing algorithms before the launch of the four remaining constellation satellites. These satellites were deployed on two separate launches – May 8, 2023 and May 26, 2023 – aboard a Rocket Lab launch vehicle. The early testing accelerated calibration and validation for the constellation.
Collecting Data Critical to Understanding Tropical Cyclones
Tropical cyclone investigations require rapid quantitative observations to create 2D storm structure information. The four radiance data products in the TROPICS constellation [i.e., antenna temperature (L1a), brightness temperature (L1b), unified brightness temperature, and regularized scan pattern and limb-adjusted brightness temperature (L1c)] penetrate below the cloud top to gather data at greater frequency for a lower cost than current operational systems. The constellation data has been used to evaluate the development of the warm core and evolution of the ice water path within storms – two indicators of storm formation and subsequent changes in intensity.
The upper-level warm core is key to tropical cyclone development and intensification. Precipitation may instigate rapid intensification through convective bursts that are characterized by expanding cold cloud tops, increasing ice scattering, lightning, and towers of intense rain and ice water that are indicative of strong updrafts. TROPICS frequencies provide a wealth of information on scattering by precipitation-sized ice particles in the eyewall and rainbands that will allow for researchers to track the macrostructure of convective bursts in tropical cyclones across the globe. In addition, TROPICS data helps clarify how variations in environmental humidity around tropical cyclones affect storm structure and intensification.
Upper-level Warm Core
Analysis of the upper-level warm core of a tropical cyclone reveals valuable information about the storm’s development. The tropical cyclone community is using data from TROPICS to understand the processes that lead to precipitating ice structure and the role it plays in intensification – see Figure 3. While the warm core has been studied for decades, TROPICS provides a new opportunity to get high-revisit rate estimates of the atmospheric vertical temperature profile. By pairing the temperature profile with the atmospheric vertical moisture profile, researchers can define the relative humidity in the lower-to-middle troposphere, which is critical to understanding the impact of dry environmental air on storm evolution and structure.
Figure 3. TROPICS-3 imagery of Typhoon Kong-rey observed on October 29, 2024, a Category-5 storm that formed in the Pacific Ocean basin. Data gathered near 118 GHz was used to characterize temperature while data gathered near 205 GHz [right] revealed more about the inner structure of the storm. These data are used to define the warm core of the well-defined eye, located at 18.5° N. Figure Credit: U.S. Naval Research Laboratory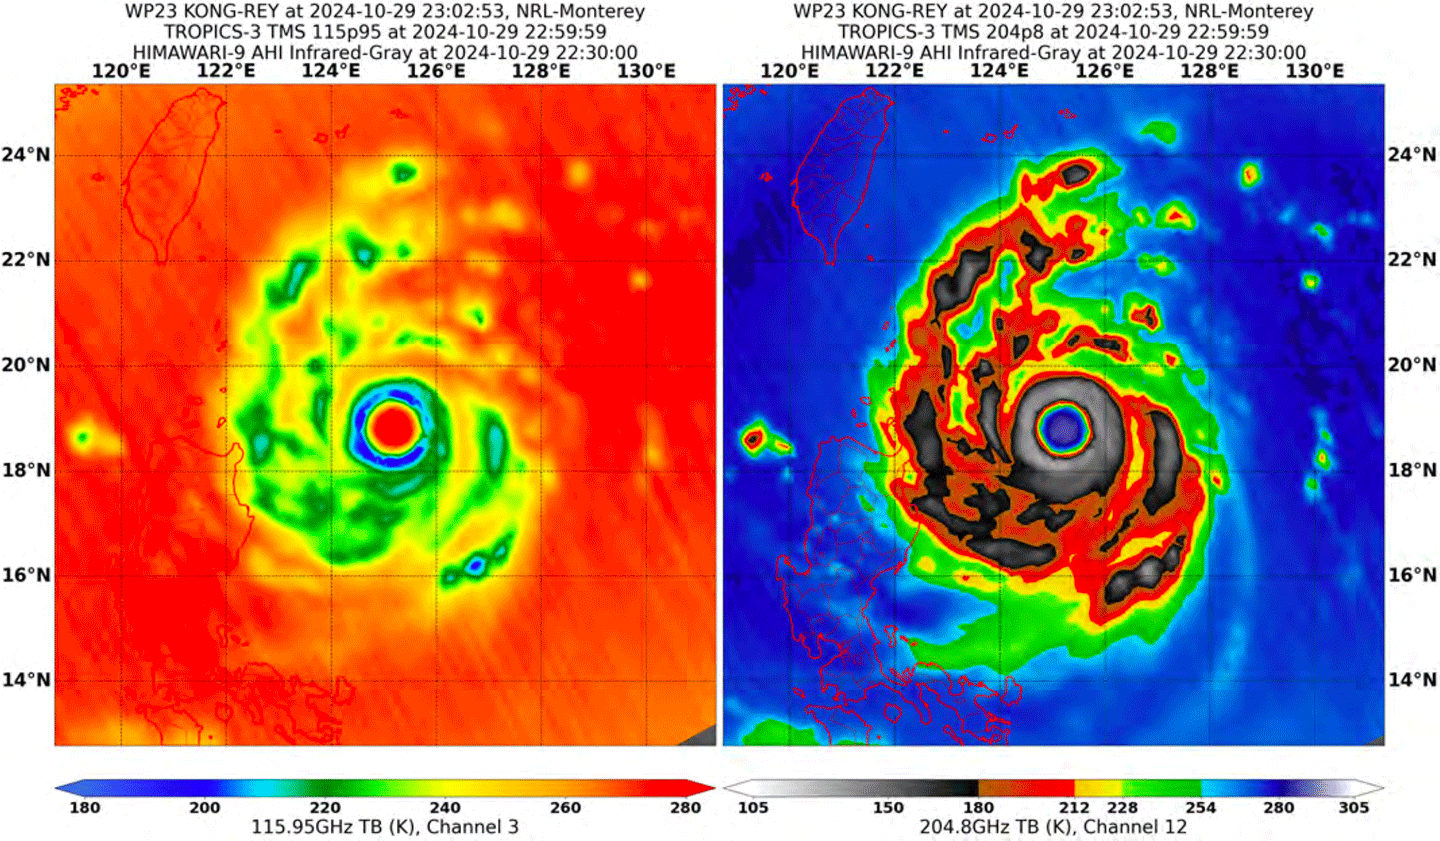
Ice Water Path and Precipitation
Another variable that helps to provide insight into the development of tropical cyclones is the ice water path, which details the total mass of ice present in a vertical column of the atmosphere and is therefore useful for characterizing the structure and intensity of these storms. Increasing ice water path can reflect strengthening convection within a storm and thereby can be an indicator of likely intensification – see Figure 4. TROPICS is the first spaceborne sensor equipped with a 205 GHz channel that, along with the traditional 89, 118, and 183 GHz channels, is more sensitive to detecting precipitation-sized ice particles. In addition, the TROPICS Precipitation Retrieval and Profiling Scheme (PRPS) provides an estimate of precipitation. This scheme is based solely on the satellite radiances linked to precipitation rates, which can be used to generate products across time scales, from near-real-time to climatological scales.
Figure 4. Global precipitation ice water path (PIWP) retrievals derived from TROPICS [top] compared to those derived using data from the GPM Dual-frequency Precipitation Radar (GPM DPR) [bottom] The strong agreement between the two datasets is further validated through case studies over hurricanes, where TROPICS observations correspond well with known storm characteristics. Figure Credit: Blackwell, W. J. et al. (2025)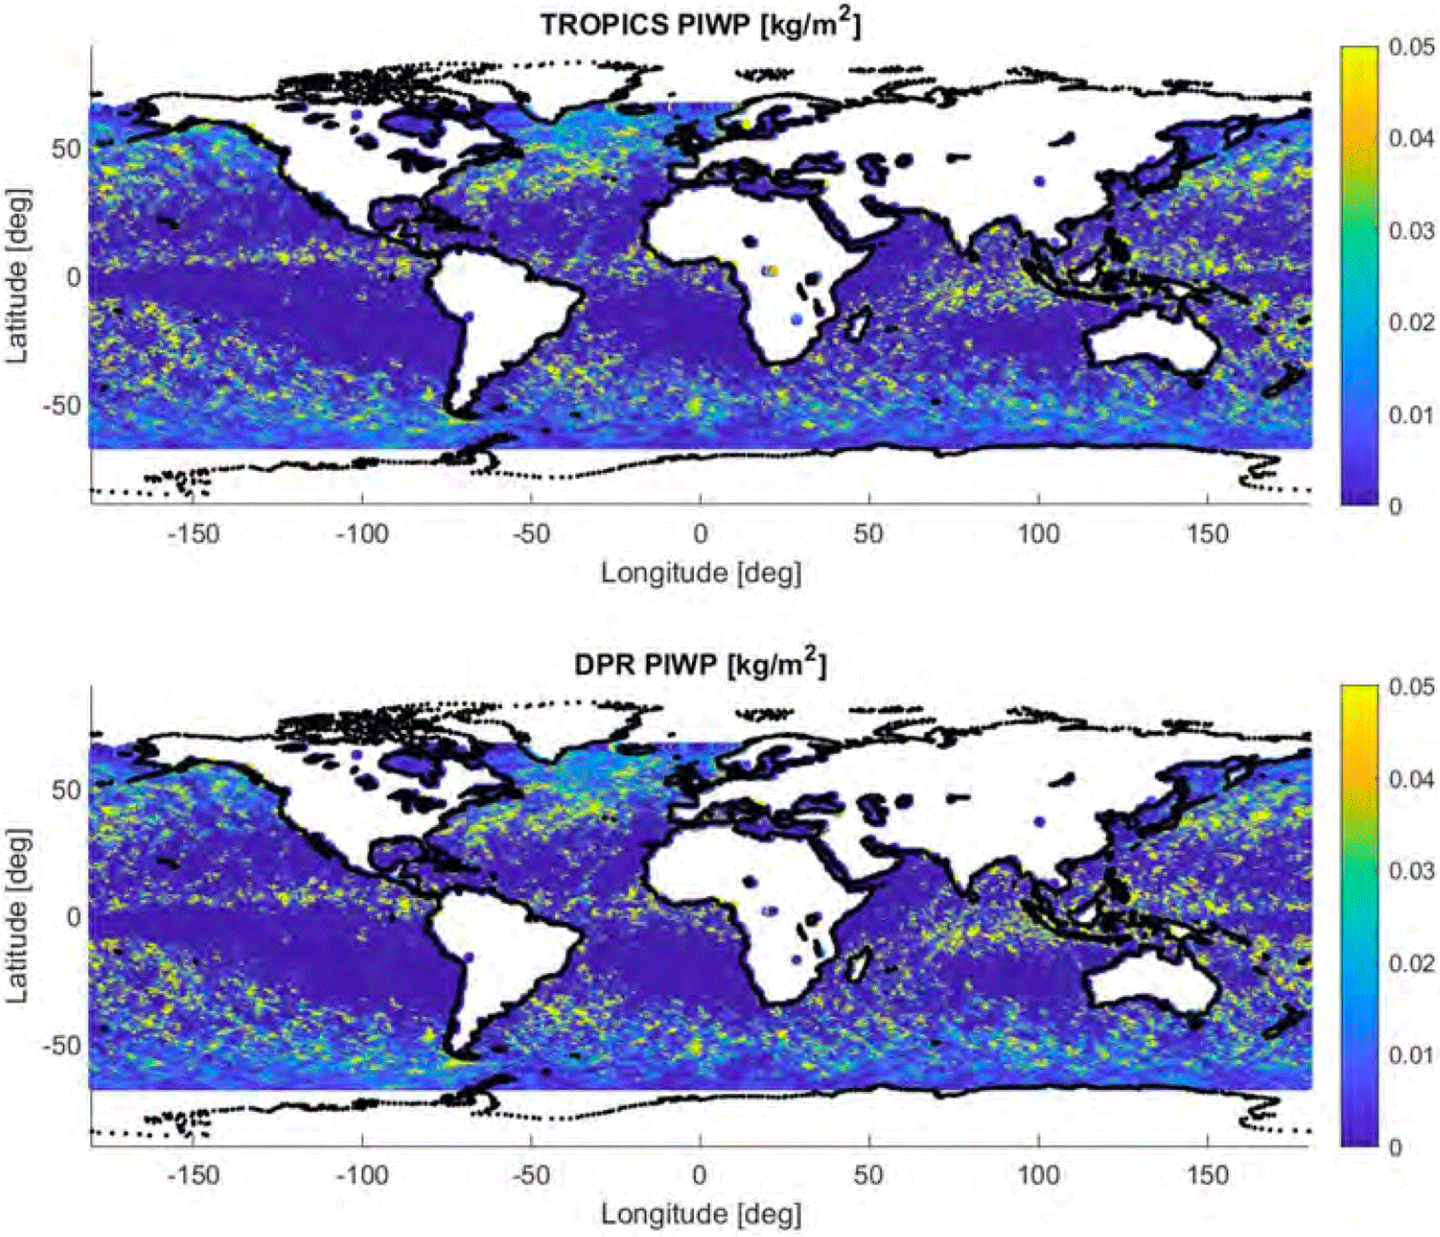
Collaborations and TROPICS Data in Action
To evaluate and enhance the data gathered by TROPICS, the TROPICS application team enlisted the assistance of operational weather forecasters that formed the TROPICS Early Adopters program. In 2018, the program connected the application team to stakeholders interested in using TROPICS data for research, forecasting, and decision making. This collaboration improved approaches to diagnose and predict tropical cyclones. For example, the National Hurricane Center (NHC) found that the new TROPICS channel at 204.8 GHz offered the best approach to capture convective storm structure, followed by the more traditionally used 91-GHz channel. In addition, the U.S. Joint Typhoon Warning Center (JTWC) has been using TROPICS data to center-fix tropical cyclones and identify cloud formations. In particular, the JTWC team found that the 91 GHz channel was most useful for identifying cloud structure. Both NHC and JTWC found the TROPICS high revisit rate to be beneficial.
In 2024, the TROPICS applications team developed the TROPICS Satellite Validation Module as part of the NOAA Hurricane Research Division’s annual Advancing the Prediction of Hurricanes Experiment (APHEX). The module coordinated data collection from NOAA’s Hurricane Hunter aircraft beneath TROPICS satellite overpasses to provide data to calibrate and validate TROPICS temperature, moisture, and precipitation measurements. Using this approach, the Hurricane Hunter team tracked Hurricane Ernesto over the central North Atlantic on August 15 and 16, 2024, and used the data to characterize the environment of Ernesto’s rain bands – see Figure 5.
Figure 5. Brightness temperature (K) measured at 205 GHz from TROPICS-5 [right] and TROPICS-6 [left and center] from Hurricane Ernesto on August 15 and 16, 2024. The shaded circles denote 850–700 hPa relative humidity (%). Wind barbs are 850–700 hPa layer averaged winds (kt). Dropsonde data within 30 minutes of the TROPICS overpass times are plotted. Figure Credit: Blackwell, W. J. et al. (2025)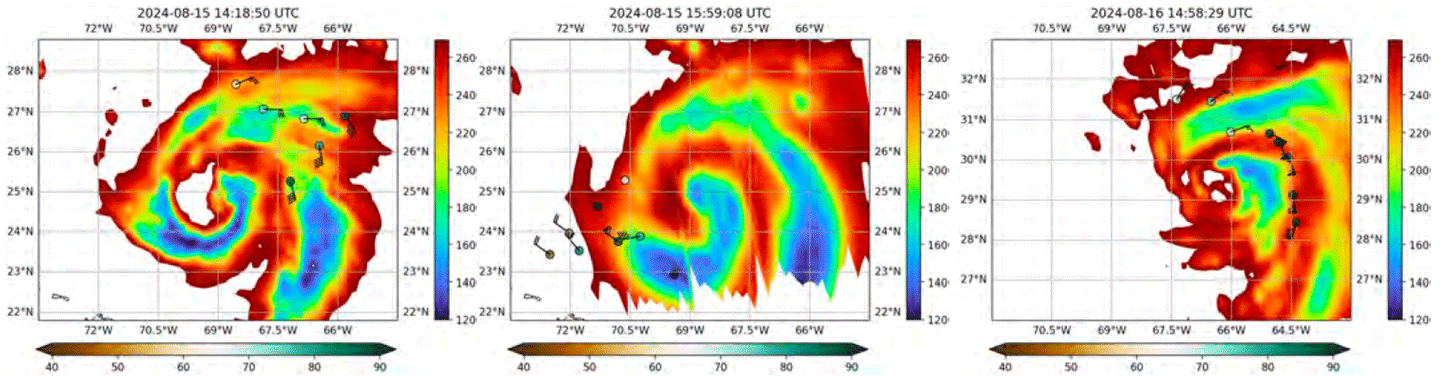
In addition, the team used TROPICS observations in combination with GPM constellation precipitation estimates to characterize the lifecycle of Hurricane Franklin, which formed on August 19, 2023, and underwent a period of rapid intensification about eight days later. Intensification of the storm, in particular the period of rapid intensification (45 knot increase in maximum winds in 24 hours), occurred in association with a decrease in environmental vertical wind shear, a contraction of the radius of maximum precipitation, and an increase in the precipitation rate. Intensification ended with the formation of secondary rainbands and an outward shift in the radius of maximum precipitation.
Conclusion
TROPICS data offer the potential for improving forecasts from numerical weather prediction models and operational forecasts using its high spatial resolution and high revisit rates that enable enhanced characterization of tropical cyclones globally. To date, the TROPICS mission has produced a high-quality aggregate data record spanning 10 billion observations and 10 satellite years, using relatively low-cost microwave sounder constellations. All L1 (i.e., radiances) and L2 (i.e., geophysical products) data products and Algorithm Theoretical Basis Documents are available to the general public through the Goddard Earth Sciences Data and Information Services Center (GES DISC). The GES DISC data discussed in this article include L1 and L2 products for TROPICS-1, TROPICS-3, TROPICS-5, and TROPICS-6.
TROPICS data has aided hurricane track forecasting for multiple storms as forecasters have used the data at multiple operational tropical cyclone forecast centers. Data gathered by TROPICS will soon be complemented by multiple commercial constellations that are coming online to improve the revisit rate and performance.
William Blackwell
MIT Lincoln Laboratory
wjb@ll.mit.edu
Scott Braun
NASA GSFC, TROPICS Project Scientist
scott.a.braun@nasa.gov
Stacy Kish
Earth Observer Staff
Earthspin.science@gmail.com
NASA’s TROPICS Mission: Offering Detailed Images and Analysis of Tropical Cyclones
9 min read
NASA’s TROPICS Mission: Offering Detailed Images and Analysis of Tropical CyclonesIntroduction
Tropical cyclones represent a danger to life, property, and the economies of communities. Researchers who study tropical cyclones have focused on remote observations using space-based platforms to image these storms, inform forecasts, better predict landfall, and improve understanding of storm dynamics and precipitation evolution – see Figure 1.
Figure 1. TROPICS imagery of Hurricane Beryl observed on June 30, 2024, near 205 GHz revealing rain bands and a well-defined eye. Figure credit: U.S. Naval Research LaboratoryThe tropical cyclone community has leveraged data from Earth observing platforms for more than 30 years. These data have been retrieved from numerous instruments including: the Advanced Baseline Imager (ABI) on the National Oceanic and Atmospheric Administration’s (NOAA) Geostationary Operational Environmental Satellite (GOES)–Series R satellites; the Tropical Rainfall Measuring Mission (TRMM) Microwave Imager (TMI); the Global Precipitation Measurement (GPM) Microwave Imager (GMI); the Special Sensor Microwave Imager/Sounder (SSMIS) on the Defense Meteorological Satellite (DMSP) satellites; the Advanced Microwave Scanning Radiometer (AMSR-E) on Aqua; AMSR2 on the Japan Aerospace Exploration Agency’s (JAXA) Global Change Observation Mission–Water (GCOM-W) mission; the Advanced Microwave Sounding Unit (AMSU) on Aqua and the Advanced Technology Microwave Sounder (ATMS) on the NASA–NOAA Suomi National Polar-Orbiting Partnership (Suomi NPP), NOAA-20, and NOAA-21; the Moderate Resolution Imaging Spectroradiometer (MODIS) on NASA’s Terra and Aqua platforms; and the Visible Infrared Imaging Radiometer Suite (VIIRS) on Suomi NPP, as well as on the first two Joint Polar Satellite System (JPSS) missions (i.e., NOAA-20 and NOAA-21).
Despite having decades of data at their disposal, scientists lack data from instruments placed in low-inclination orbits that provide more frequent views within tropical regions. This limitation is especially pronounced in the tropical and subtropical latitudes, which is where tropical storms develop and intensify.
The NASA Time-Resolved Observations of Precipitation structure and storm Intensity with a Constellation of Smallsats (TROPICS) mission addresses a critical need articulated in the 2007 Earth Science Decadal Survey for obtaining three-dimensional (3D) temperature and humidity measurements as well as precipitation with a temporal revisit rate of one hour or better – see Figure 2. TROPICS uses multiple small satellites flying in a carefully engineered formation to obtain rapid revisits of measurements of precipitation structure within the storms, as well as temperature and humidity profiles, both within and outside of the storms, including the intensity of the upper-level warm core. In addition, the instruments provide a median revisit time of about one hour. The data gathered also informs changes in storm track and intensity and provides data to improve weather prediction models.
The imagery is focused on inner storm structure (near 91 and 205 GHz), temperature soundings (near 118 GHz), and moisture soundings (near 183 GHz). Spatial resolution at nadir is approximately 24 km (16.8 mi) for temperature and 17 km (10.6 mi) for moisture and precipitation, covering a swath of approximately 2000 km (1243 mi) in width. Researchers can use TROPICS data to create hundreds of high-resolution images of tropical cyclones throughout their lifecycle.
Figure 2. TROPICS space vehicle showing the CubeSat bus, radiometer payload, and deployed articulated solar array. Figure credit: Blue Canyon Technologies and MIT Lincoln LaboratoryThis article provides an overview of the two years of successful science operations of TROPICS, with a focus on the suite of geophysical Level-2 (L2) products (e.g., atmospheric vertical temperature and moisture profiles, instantaneous surface rain rate, and tropical cyclone intensity) and the science investigations resulting from these measurements. The complete article, available in the Proceedings of the IEEE: Special Issue on Satellite Remote Sensing of the Earth, provides more comprehensive details of the results.
From Pathfinder to Constellation
A single TROPICS satellite was launched as a Pathfinder vehicle on June 30, 2021, aboard a SpaceX Falcon 9 rideshare into a Sun-synchronous polar orbit. TROPICS was originally conceived as a six-satellite constellation, with two satellites launched into each of three low-inclination orbits. Regrettably, the first launch, on June 22, 2022, aboard an Astra Rocket 3.3, failed to reach orbit. While unfortunate, the mission could still proceed with four satellites and meet its baseline revisit rate requirement (with no margin), with the silver lining of an extra year of data gathered from TROPICS Pathfinder that allowed the tropical cyclone research community to prepare and test communications systems and data processing algorithms before the launch of the four remaining constellation satellites. These satellites were deployed on two separate launches – May 8, 2023 and May 26, 2023 – aboard a Rocket Lab launch vehicle. The early testing accelerated calibration and validation for the constellation.
Collecting Data Critical to Understanding Tropical Cyclones
Tropical cyclone investigations require rapid quantitative observations to create 2D storm structure information. The four radiance data products in the TROPICS constellation [i.e., antenna temperature (L1a), brightness temperature (L1b), unified brightness temperature, and regularized scan pattern and limb-adjusted brightness temperature (L1c)] penetrate below the cloud top to gather data at greater frequency for a lower cost than current operational systems. The constellation data has been used to evaluate the development of the warm core and evolution of the ice water path within storms – two indicators of storm formation and subsequent changes in intensity.
The upper-level warm core is key to tropical cyclone development and intensification. Precipitation may instigate rapid intensification through convective bursts that are characterized by expanding cold cloud tops, increasing ice scattering, lightning, and towers of intense rain and ice water that are indicative of strong updrafts. TROPICS frequencies provide a wealth of information on scattering by precipitation-sized ice particles in the eyewall and rainbands that will allow for researchers to track the macrostructure of convective bursts in tropical cyclones across the globe. In addition, TROPICS data helps clarify how variations in environmental humidity around tropical cyclones affect storm structure and intensification.
Upper-level Warm Core
Analysis of the upper-level warm core of a tropical cyclone reveals valuable information about the storm’s development. The tropical cyclone community is using data from TROPICS to understand the processes that lead to precipitating ice structure and the role it plays in intensification – see Figure 3. While the warm core has been studied for decades, TROPICS provides a new opportunity to get high-revisit rate estimates of the atmospheric vertical temperature profile. By pairing the temperature profile with the atmospheric vertical moisture profile, researchers can define the relative humidity in the lower-to-middle troposphere, which is critical to understanding the impact of dry environmental air on storm evolution and structure.
Figure 3. TROPICS-3 imagery of Typhoon Kong-rey observed on October 29, 2024, a Category-5 storm that formed in the Pacific Ocean basin. Data gathered near 118 GHz was used to characterize temperature while data gathered near 205 GHz [right] revealed more about the inner structure of the storm. These data are used to define the warm core of the well-defined eye, located at 18.5° N. Figure Credit: U.S. Naval Research LaboratoryIce Water Path and Precipitation
Another variable that helps to provide insight into the development of tropical cyclones is the ice water path, which details the total mass of ice present in a vertical column of the atmosphere and is therefore useful for characterizing the structure and intensity of these storms. Increasing ice water path can reflect strengthening convection within a storm and thereby can be an indicator of likely intensification – see Figure 4. TROPICS is the first spaceborne sensor equipped with a 205 GHz channel that, along with the traditional 89, 118, and 183 GHz channels, is more sensitive to detecting precipitation-sized ice particles. In addition, the TROPICS Precipitation Retrieval and Profiling Scheme (PRPS) provides an estimate of precipitation. This scheme is based solely on the satellite radiances linked to precipitation rates, which can be used to generate products across time scales, from near-real-time to climatological scales.
Figure 4. Global precipitation ice water path (PIWP) retrievals derived from TROPICS [top] compared to those derived using data from the GPM Dual-frequency Precipitation Radar (GPM DPR) [bottom] The strong agreement between the two datasets is further validated through case studies over hurricanes, where TROPICS observations correspond well with known storm characteristics. Figure Credit: Blackwell, W. J. et al. (2025)Collaborations and TROPICS Data in Action
To evaluate and enhance the data gathered by TROPICS, the TROPICS application team enlisted the assistance of operational weather forecasters that formed the TROPICS Early Adopters program. In 2018, the program connected the application team to stakeholders interested in using TROPICS data for research, forecasting, and decision making. This collaboration improved approaches to diagnose and predict tropical cyclones. For example, the National Hurricane Center (NHC) found that the new TROPICS channel at 204.8 GHz offered the best approach to capture convective storm structure, followed by the more traditionally used 91-GHz channel. In addition, the U.S. Joint Typhoon Warning Center (JTWC) has been using TROPICS data to center-fix tropical cyclones and identify cloud formations. In particular, the JTWC team found that the 91 GHz channel was most useful for identifying cloud structure. Both NHC and JTWC found the TROPICS high revisit rate to be beneficial.
In 2024, the TROPICS applications team developed the TROPICS Satellite Validation Module as part of the NOAA Hurricane Research Division’s annual Advancing the Prediction of Hurricanes Experiment (APHEX). The module coordinated data collection from NOAA’s Hurricane Hunter aircraft beneath TROPICS satellite overpasses to provide data to calibrate and validate TROPICS temperature, moisture, and precipitation measurements. Using this approach, the Hurricane Hunter team tracked Hurricane Ernesto over the central North Atlantic on August 15 and 16, 2024, and used the data to characterize the environment of Ernesto’s rain bands – see Figure 5.
Figure 5. Brightness temperature (K) measured at 205 GHz from TROPICS-5 [right] and TROPICS-6 [left and center] from Hurricane Ernesto on August 15 and 16, 2024. The shaded circles denote 850–700 hPa relative humidity (%). Wind barbs are 850–700 hPa layer averaged winds (kt). Dropsonde data within 30 minutes of the TROPICS overpass times are plotted. Figure Credit: Blackwell, W. J. et al. (2025)In addition, the team used TROPICS observations in combination with GPM constellation precipitation estimates to characterize the lifecycle of Hurricane Franklin, which formed on August 19, 2023, and underwent a period of rapid intensification about eight days later. Intensification of the storm, in particular the period of rapid intensification (45 knot increase in maximum winds in 24 hours), occurred in association with a decrease in environmental vertical wind shear, a contraction of the radius of maximum precipitation, and an increase in the precipitation rate. Intensification ended with the formation of secondary rainbands and an outward shift in the radius of maximum precipitation.
Conclusion
TROPICS data offer the potential for improving forecasts from numerical weather prediction models and operational forecasts using its high spatial resolution and high revisit rates that enable enhanced characterization of tropical cyclones globally. To date, the TROPICS mission has produced a high-quality aggregate data record spanning 10 billion observations and 10 satellite years, using relatively low-cost microwave sounder constellations. All L1 (i.e., radiances) and L2 (i.e., geophysical products) data products and Algorithm Theoretical Basis Documents are available to the general public through the Goddard Earth Sciences Data and Information Services Center (GES DISC). The GES DISC data discussed in this article include L1 and L2 products for TROPICS-1, TROPICS-3, TROPICS-5, and TROPICS-6.
TROPICS data has aided hurricane track forecasting for multiple storms as forecasters have used the data at multiple operational tropical cyclone forecast centers. Data gathered by TROPICS will soon be complemented by multiple commercial constellations that are coming online to improve the revisit rate and performance.
William Blackwell
MIT Lincoln Laboratory
wjb@ll.mit.edu
Scott Braun
NASA GSFC, TROPICS Project Scientist
scott.a.braun@nasa.gov
Stacy Kish
Earth Observer Staff
Earthspin.science@gmail.com