
Feed aggregator
Trump EPA Announces Climate Regulation Rollback but Faces Legal Hurdles
The EPA has contradicted itself—and legal precedent—in its bid to undo Biden-era limits on power-plant climate pollution
Item Emporium Dinosaur Egg Galaxy Star Projector review
NASA astronaut aboard ISS captures colorful aurora in time-lapse footage of Earth from space (video)
Far Out
Far Out
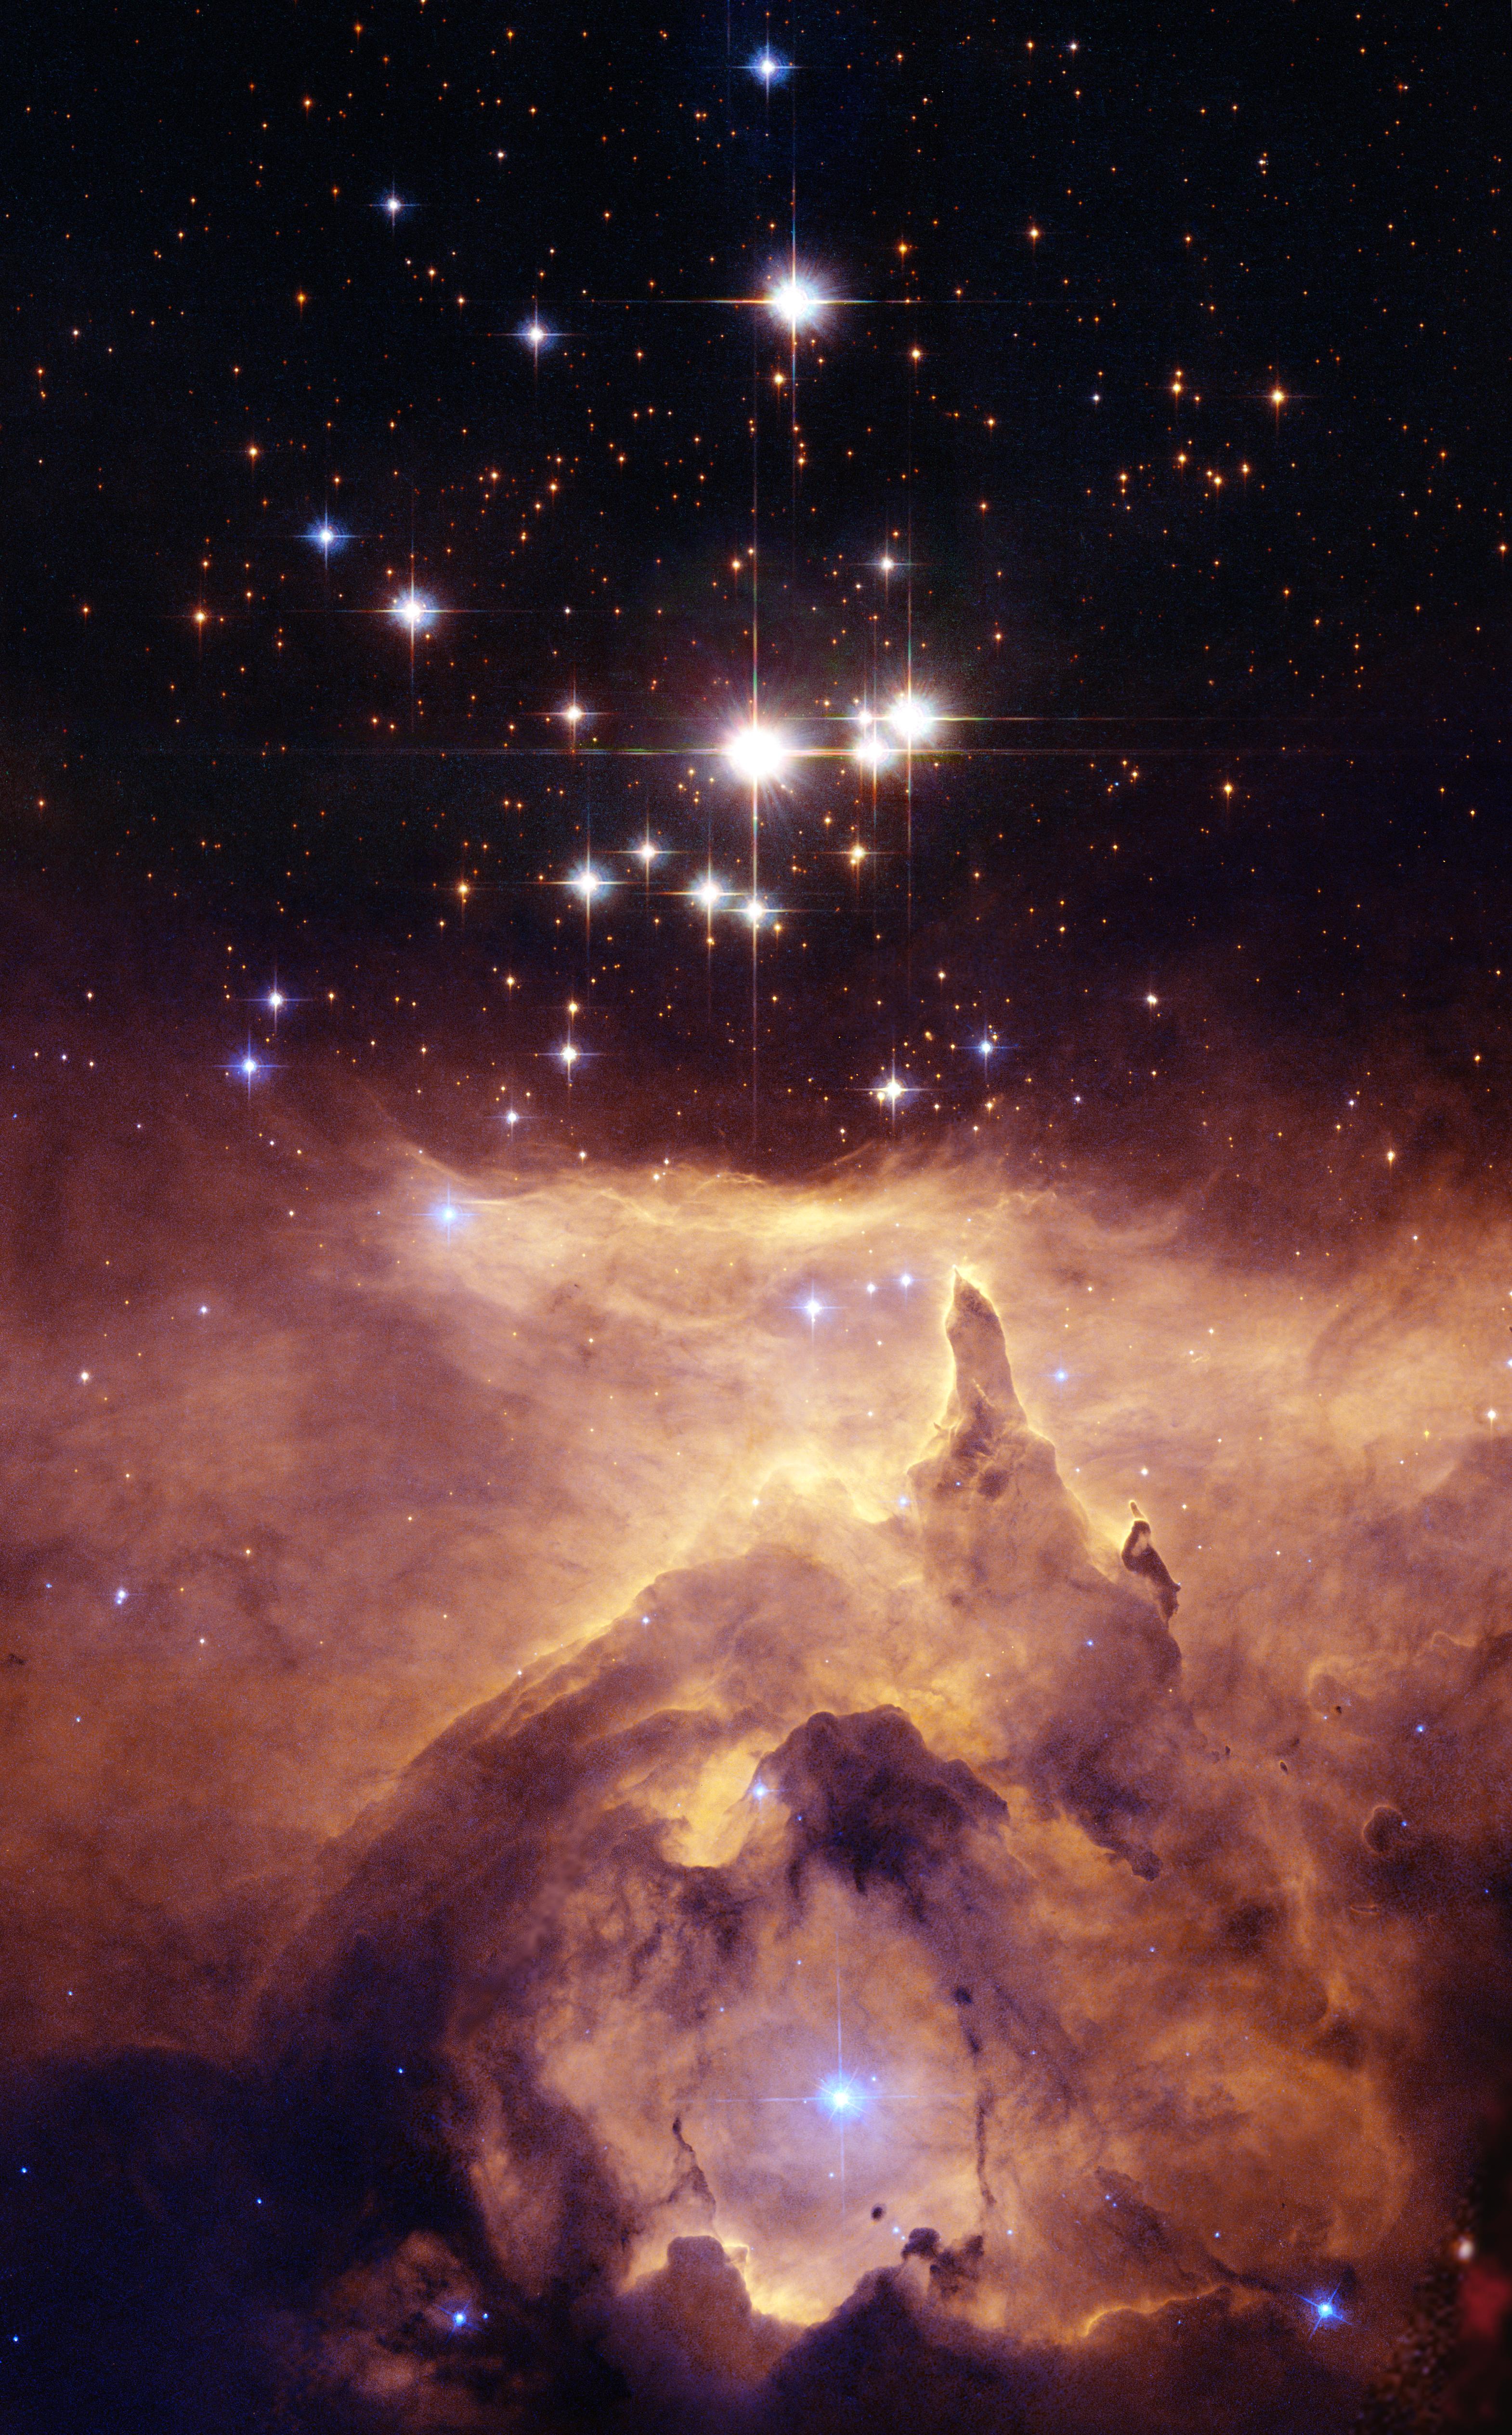
Pismis 24, the star cluster seen here in an image released on Dec. 11, 2006, lies within the much larger emission nebula called NGC 6357, located about 8,000 light-years from Earth. The brightest object in the picture was once thought to be a single star with an incredibly large mass of 200 to 300 solar masses. That would have made it by far the most massive known star in the galaxy and would have put it considerably above the currently believed upper mass limit of about 150 solar masses for individual stars. Measurements from NASA’s Hubble Space Telescope, however, discovered that Pismis 24-1 is actually two separate stars, and, in doing so, “halved” their mass to around 100-150 solar masses each.
Image credit: NASA, ESA and Jesús Maíz Apellániz (Instituto de Astrofísica de Andalucía, Spain); Acknowledgment: Davide De Martin (ESA/Hubble)
Far Out
Pismis 24, the star cluster seen here in an image released on Dec. 11, 2006, lies within the much larger emission nebula called NGC 6357, located about 8,000 light-years from Earth. The brightest object in the picture was once thought to be a single star with an incredibly large mass of 200 to 300 solar masses. That would have made it by far the most massive known star in the galaxy and would have put it considerably above the currently believed upper mass limit of about 150 solar masses for individual stars. Measurements from NASA’s Hubble Space Telescope, however, discovered that Pismis 24-1 is actually two separate stars, and, in doing so, “halved” their mass to around 100-150 solar masses each.
Image credit: NASA, ESA and Jesús Maíz Apellániz (Instituto de Astrofísica de Andalucía, Spain); Acknowledgment: Davide De Martin (ESA/Hubble)
NASA’s Hurricane Science, Tech, Data Help American Communities
- Earth
- Explore
- Science at Work
- Multimedia
- Data
- For Researchers
- About Us
ISS Astronaut/Earth Observatory
- NASA supports hurricane preparedness and response by providing satellite data and science before, during, and after storms.
- During hurricane season, NASA delivers timely flood maps, power outage insights, landslide risk assessments, and more to state and federal partners.
- NASA tests innovative technologies, from AI models to mini satellites, to enhance how we monitor hurricanes and their impacts.
- NASA’s long-term tracking of wind, ocean heat, and atmospheric moisture improves understanding of where hurricanes might form and intensify.
With the Atlantic hurricane season underway, NASA is again gearing up to produce cutting-edge research that strengthens the nation’s ability to prepare for and respond to severe weather. From satellite imagery of our planet to improved storm modeling, the agency’s work supports communities in anticipating and reducing the impacts of hurricanes.
In 2024, hurricanes including Helene and Milton showed NASA’s wide-ranging capabilities. As the storms approached the United States, the agency’s network of satellites and scientists swung into action. Within hours of landfall, NASA’s Disasters Response Coordination System was supplying emergency managers and others with flood maps, power outage assessments, and other crucial data.
“People might be surprised how deeply NASA is involved in hurricane science,” said Scott Braun, a research meteorologist at NASA’s Goddard Space Flight Center in Greenbelt, Maryland. “We are not the agencies issuing forecasts or warnings, but our technologies and science are making fundamental contributions to how we understand, predict, and respond to these storms.”
Disaster Response Powered by NASAWhen hurricanes strike, NASA’s Disasters Response Coordination System aids state and federal agencies, producing and sharing imagery and data, including the NASA Disasters Mapping Portal, which offers tools to assess storm damage.
One crucial tool is NASA’s Black Marble product suite, produced and maintained by NASA Goddard. Using data from the Visible Infrared Imaging Radiometer Suite (VIIRS), researchers and others can map nighttime lights and detect power outages.
Unlike traditional outage maps, which often show only county-level data, NASA’s Black Marble can provide a more detailed view. It offers calibrated, daily observations, enabling high-confidence tracking of neighborhood-level impacts. Emergency response teams in Florida, for instance, have used this imagery to assess conditions near hazardous waste sites before heading into the field after a hurricane.
before after
The state faced widespread power outages after winds from Hurricane Helene snapped trees, tore off roofs, and toppled power lines. View the full story NASA Earth Observatory/Lauren Dauphin beforeafter
The state faced widespread power outages after winds from Hurricane Helene snapped trees, tore off roofs, and toppled power lines. View the full story NASA Earth Observatory/Lauren Dauphin
before
after
Scientists with NASA’s Black Marble processed data from VIIRS on the NOAA-NASA Suomi NPP satellite to show how power outages darkened Augusta, Georgia, before and after Hurricane Helene. View the full story
CurtainToggle2-Up
Image Details
Other NASA technologies map flooding. Scientists at NASA’s Marshall Space Flight Center in Huntsville, Alabama used the European Space Agency’s Sentinel-1 synthetic aperture radar data and other data from the NASA/U.S. Geological Survey Landsat satellites and ESA’s Sentinel-2 to track flooding after multiple hurricanes in 2024, including Helene and Milton.
These maps were shared through the NASA Disasters Mapping Portal with state and federal emergency managers responding to storms’ impacts in Florida, North Carolina, South Carolina, and elsewhere.
“The ability to see floodwaters and landscape changes gives communities a critical edge during response and recovery,” said Shanna McClain, disasters program manager for NASA’s Earth Science Division at NASA headquarters in Washington. “It helps decision-makers act faster when every minute counts.”
Hurricanes don’t just knock out power or trigger flooding — they can also loosen mountains. After Hurricane Helene, NASA scientists partnered with USGS to tackle a different threat: landslides throughout the southern Appalachian Mountains. NASA’s Landslide Hazard Assessment for Situational Awareness tool, developed at NASA Goddard, can help spot landslide-prone areas by combining different troves of satellite data.
“The landslide model brings together a wide range of Earth science,” said Thomas Stanley, a research scientist at NASA Goddard. “It’s a real convergence of satellite observations — soil moisture, precipitation, elevation — each one adding a key piece to the puzzle.”
NASA and USGS used rainfall data and modeling to estimate landslide hazards in the Appalachians following Hurricane Helene, highlighting high-risk zones across western North Carolina. NASA/USGS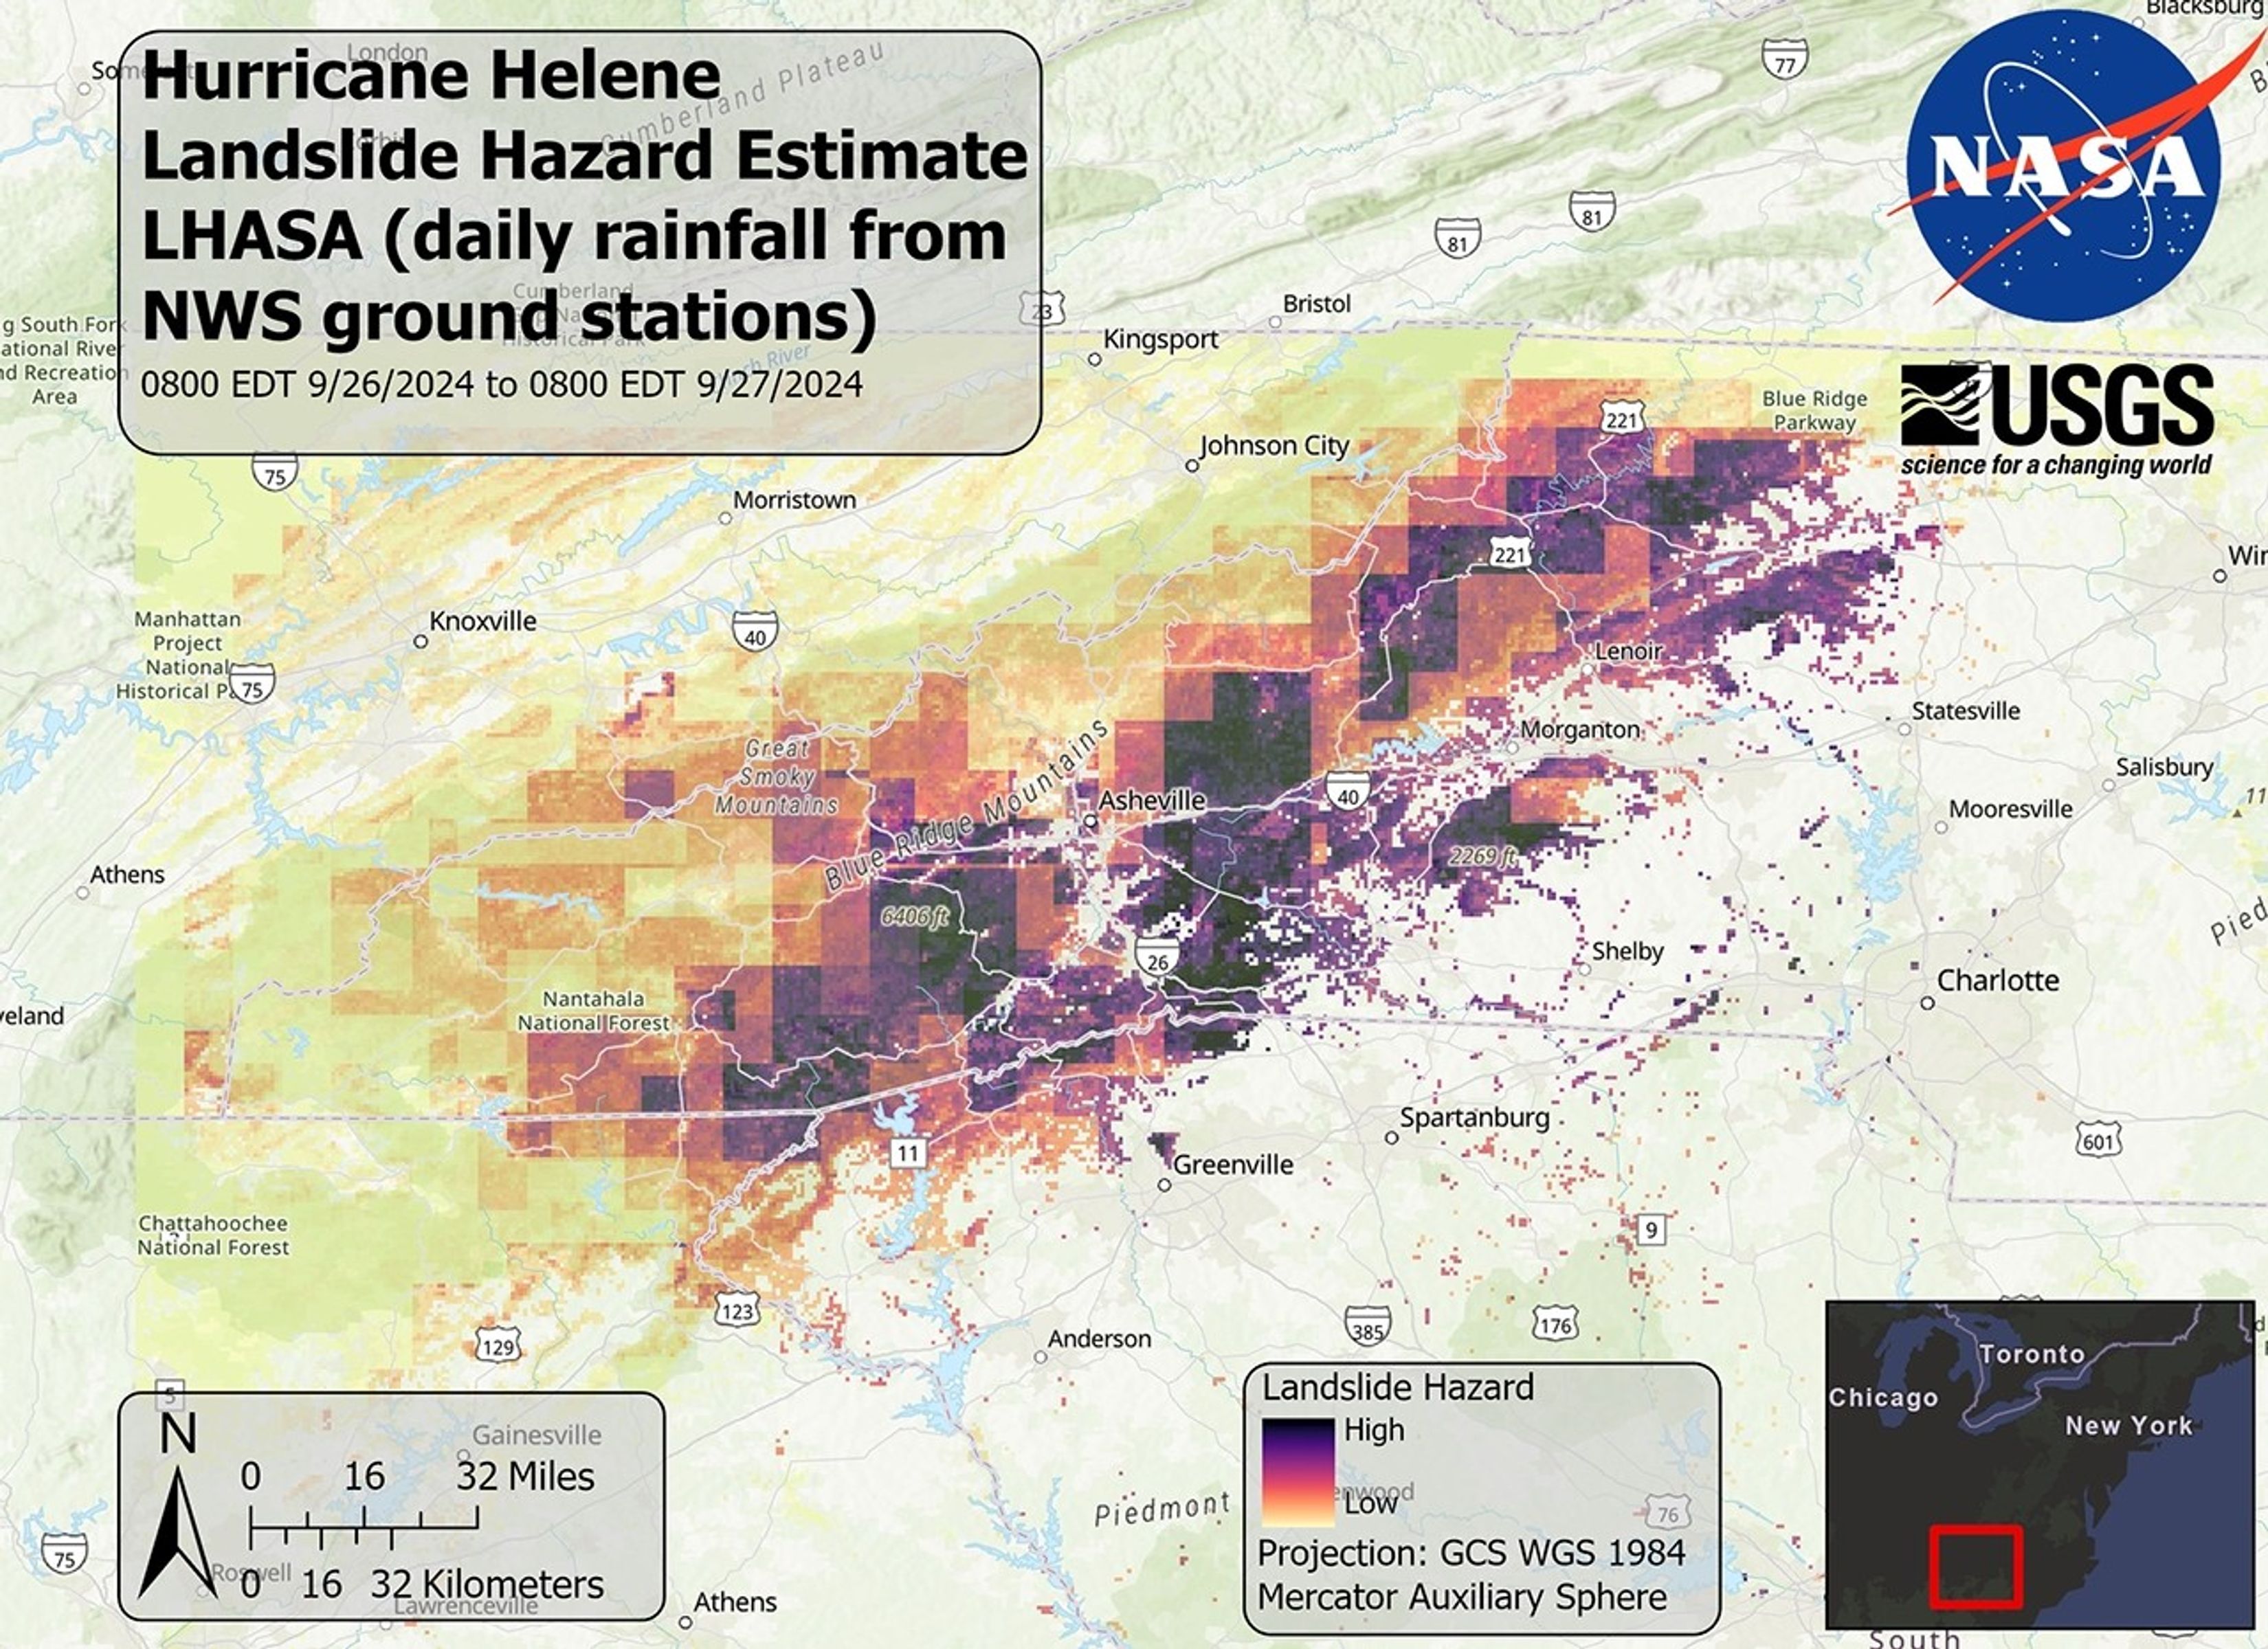
In the days during and after Helene, a NASA-USGS team adapted this model to incorporate ground-based rainfall measurements. “This collaboration proved crucial during the critical first days when lingering clouds prevented direct satellite imaging of landslides,” said Kate Allstadt, a research geophysicist at USGS. “Combining NASA and USGS landslide models guided aerial reconnaissance over four states and helped prioritize areas for detailed mapping.”
NASA Disasters Response coordinators also partnered with USGS to manually map likely landslide areas in North Carolina, South Carolina, and Virginia, using high-resolution satellite imagery. This partnership enabled early warnings to agencies such as the North Carolina Geological Survey about potential landslide zones before visual confirmation was possible.
Tracking Hurricanes in Near Real TimeAs hurricanes gather strength over warm ocean waters, NASA’s satellites begin tracking them. One effort providing essential data on hurricanes is the Global Precipitation Measurement (GPM) mission, a collaboration between NASA and the Japan Aerospace Exploration Agency. Passing over storms once or twice per day, the GPM core satellite captures high-resolution data on rainfall intensity and distribution.
“The GPM mission gives us an inside look at where a storm is dropping the most rain and how intense it is,” said George Huffman, GPM project scientist at NASA Goddard. “That kind of information helps forecasters make better predictions and gives communities more time to prepare for flooding and dangerous conditions.”
Huffman’s team leads NASA’s IMERG (Integrated Multi-satellitE Retrievals for GPM) product, which combines GPM Core Observatory data with observations from other satellites to generate near real-time, global rainfall estimates every 30 minutes. For example, IMERG tracked the record-breaking rainfall that fell during Hurricane Harvey in 2017, when parts of Texas saw more than 50 inches of rain.
Satellite-based rainfall data can be especially vital when a big storm like Harvey or Helene knocks out ground-based rain measurements, Huffman said.
Watch Hurricane Harvey as it makes landfall in Texas and Louisiana in 2017. The visualization depicts precipitation measured by the GPM mission, highlighting record-shattering rainfall over Texas and Louisiana. Blue is frozen precipitation, while green to red is rainfall. NASA’s Scientific Visualization StudioNASA also is working to turn precipitation data into practical flood predictions. One such effort, led by NASA-funded hydrologist Ed Beighley at Northeastern University in Boston, merges rainfall estimates from the GPM mission with National Weather Service river discharge models and surface water mapping methods to identify areas likely to experience flooding.
During Hurricane Helene, his team provided early versions of these flood maps to the North Carolina Department of Health and Human Services.
“In some cases, like with Helene, we could see where disasters were likely to be declared just from the rainfall data — days before the disaster declarations were made official,” Beighley said. “That kind of near real-time information could really help counties and health departments prepare and coordinate response efforts.”
That same focus on improving early flood prediction was at the heart of NASA’s response to Hurricane Debby when it made landfall in Florida in August 2024. At NASA Marshall, the Short-term Prediction Research and Transition (SPoRT) team used its Land Information System to track soil moisture levels, crucial for understanding the potential for flooding.
The team’s Streamflow-AI model — a machine learning tool trained to predict how rivers respond to rainfall — also forecasted rising waters in small streams and creeks in Florida and the Carolinas.
“The streamflow tool is used pretty heavily by the National Weather Service now to help inform flood forecasts, which then filters down to evacuation orders,” said Patrick Duran, a NASA Marshall research scientist with SPoRT.
NASA SPoRT’s Streamflow-AI model shows the flooding potential for the Swannanoa River in Asheville, North Carolina, during and after Hurricane Helene. NASA SPoRT Reinventing the Tech That Sees Into Storms
NASA doesn’t just collect data on hurricanes or aid in their aftermath — it is redefining the technology we use to observe and understand them. This work is not only improving forecasts and warnings but also helping to fuel the growth of America’s commercial satellite industry.
Take NASA’s TROPICS mission. Short for Time-Resolved Observations of Precipitation structure and storm Intensity with a Constellation of Smallsats, TROPICS represents a fundamental shift in how we might monitor hurricanes from space. Rather than relying solely on intermittent passes by larger satellites, TROPICS uses a group of small, lower-cost satellites working in concert to provide more frequent observations of tropical storm systems — offering a complementary approach to storm monitoring.
During Hurricane Helene, the TROPICS satellites tracked the storm through nearly its entire life cycle, capturing data on its rapid intensification from a tropical depression to a powerful category 4 hurricane before landfall in Florida’s Big Bend region.
Each TROPICS satellite carries a microwave radiometer. Unlike optical sensors, this instrument can see through clouds, making it ideal for tracking storms. The TROPICS’ radiometers are tuned to detect temperature, moisture, and precipitation patterns inside hurricanes.
“The TROPICS mission is really good at providing images of the structure of a storm, showing how well defined the eye is, which is key for improving forecasting,” said William Blackwell, TROPICS principal investigator at MIT Lincoln Laboratory in Massachusetts.
NASA’s TROPICS mission monitored Hurricane Helene throughout its life cycle. This visualization shows how the tropical depression rapidly intensified into a category 4 hurricane before hitting Florida and then moving inland. NASA’s Scientific Visualization StudioTomorrow.io, an American weather company, is using radiometer technology derived from TROPICS as it develops tools for commercial weather forecasting. The company also is working to adapt radar technology first tested on NASA’s RainCube mission.
RainCube, a small satellite about the size of a shoebox developed by NASA’s Jet Propulsion Laboratory in Southern California, operated from 2018 to 2020. It used radar to study precipitation, sending signals toward Earth and analyzing how long they took to bounce back, and how strong they were after reflecting off raindrops, snowflakes, and cloud ice.
Full-scale satellites have been using radar technology to make that kind of measurement for years. “The key thing with RainCube wasn’t bringing in new science,” said Simone Tanelli, RainCube principal scientist at JPL. “Instead, it was showing that we could give you similar data with a box that’s roughly 100 times smaller in volume than a full-size satellite.”
NASA also tests how other small, lower-cost instruments could transform how we monitor tropical storms. Two such tools — COWVR, short for Compact Ocean Wind Vector Radiometer measures ocean surface winds, and TEMPEST, short for Temporal Experiment for Storms and Tropical Systems tracks atmospheric water vapor — were launched to the International Space Station in 2021.
Using technology and designs from JPL and other NASA teams, TEMPEST and COWVR already are proving their value. Their data has been used by the U.S. Joint Typhoon Warning Center to help track and forecast powerful storms, such as Tropical Cyclone Mandous in December 2022.
Data from the COWVR and TEMPEST instruments aboard the ISS was used to create this image of Tropical Cyclone Mandous, which forecasters used to understand the December 2022 storm’s intensity and predict its path toward southern India. U.S. Joint Typhoon Warning Center/U.S. Naval Research Laboratory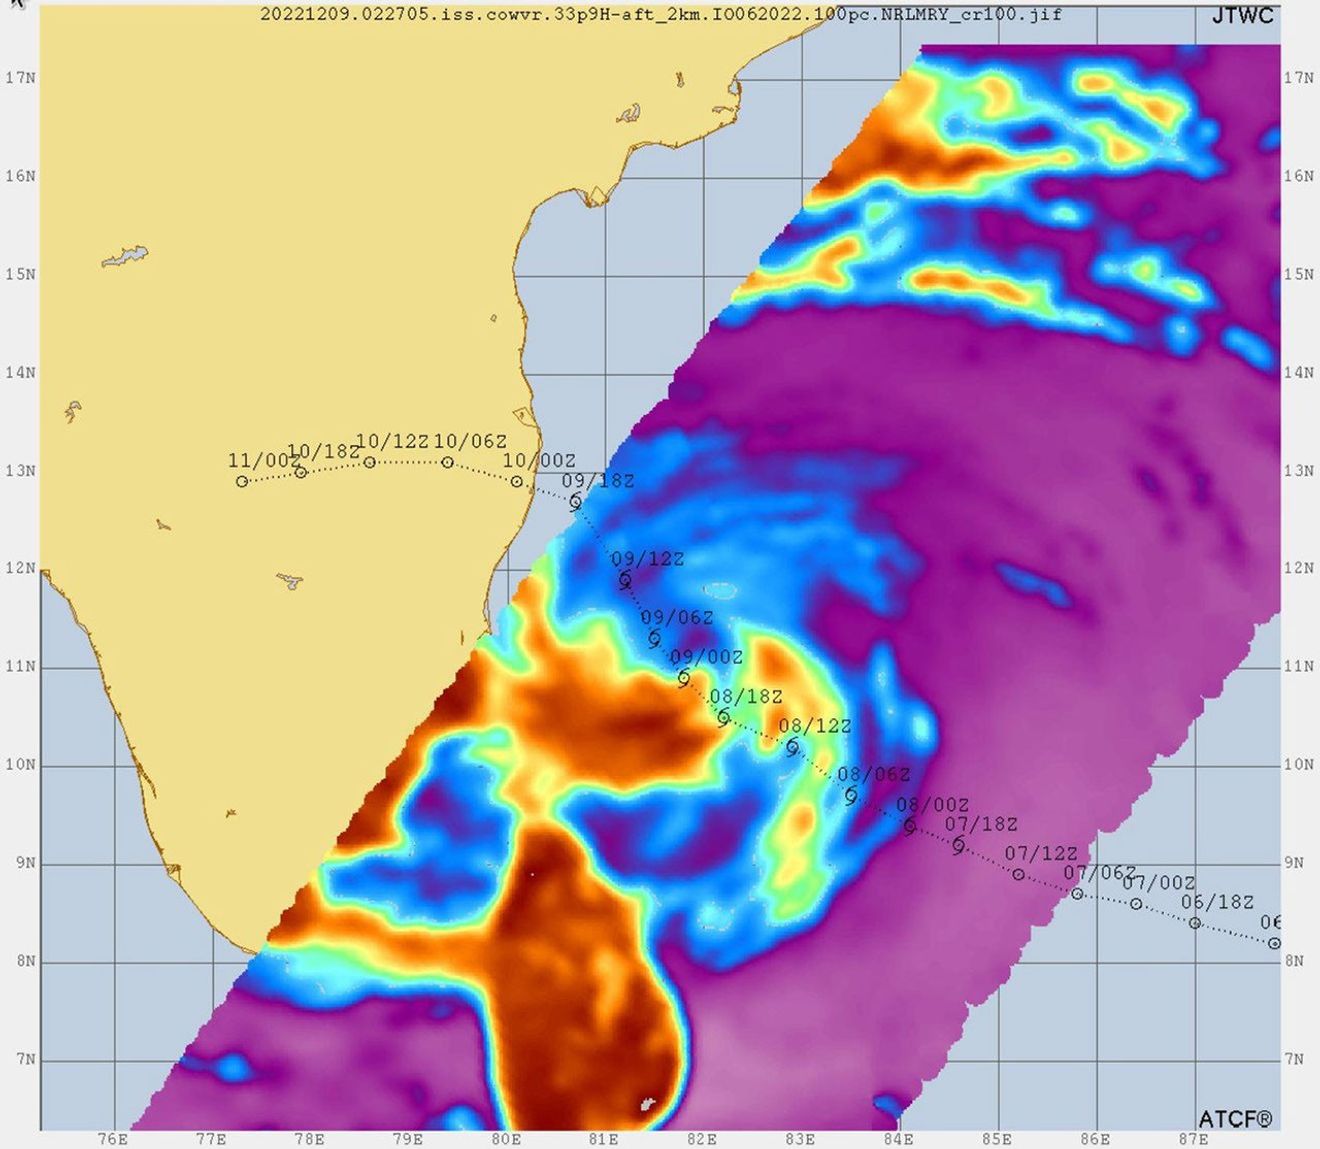
NASA researchers also are investigating lightning, which has emerged as a key clue in predicting rapid storm intensification, a dangerous phase of the hurricane life cycle that is one of the most difficult aspects of hurricane forecasting. Spikes in lightning activity, especially in the eyewall, can be an early sign that a storm is about to strengthen quickly.
The agency’s SPoRT project is researching how lightning data from the Geostationary Lightning Mapper can improve hurricane forecasting. This sensor provides a nearly continuous view of lightning activity over oceans and in remote land regions that have fewer weather observations. The instrument rides aboard NOAA’s (National Oceanic and Atmospheric Administration) GOES weather satellites.
“By studying the size and energy of lightning flashes inside hurricanes, we’re learning how they might signal whether a storm is about to intensify or weaken,” said Duran. “It’s an evolving area of research with a lot of potential.”
During Hurricane Helene, SPoRT’s lightning analyses revealed a burst of strong, frequent flashes in the eyewall just before the storm surged from category 2 to category 4 intensity. That’s exactly the kind of signal researchers hope to detect more reliably in the future.
Bright, large lightning flashes seen in Hurricane Helene’s eyewall, captured by NASA SPoRT’s Geostationary Lightning Mapper viewer, indicate the storm’s rapid intensification from category 2 to 4 just hours before landfall. NASA SPoRT
NASA frequently uses its airplanes to test new hurricane tech, too. In one recent example, scientists from NASA’s Langley Research Center in Hampton, Virginia, flew a cutting-edge 3-D Doppler wind lidar system across the United States, including making passes through the edges of Hurricane Helene. The instrument is designed to capture high-resolution wind data that can improve predictions of rapidly evolving storms, such as hurricanes and severe thunderstorms, where accurate wind observations are essential, but often lacking.
Braun compared these multiple data streams — from TROPICS, GPM, and other instruments — to medical imaging. “Think about how doctors use different types of scans like X-rays, MRIs, and ultrasound to understand what’s happening inside a patient’s body,” he said. “We’re doing something similar with hurricanes. Each system gives us a different view of the storm’s internal structure and environment, with the goal of improving forecasts.”
Watching For Hurricane Warning SignsLong before a hurricane takes shape, NASA satellites are already scanning the global ocean and atmosphere, closely tracking the conditions that give rise to powerful storms. One of the most important indicators is sea surface temperature.
NASA combines data from multiple satellites and sensors — such as the Moderate Resolution Imaging Spectroradiometer (MODIS) and VIIRS — to produce sea surface temperature maps like JPL’s Multi-scale Ultra-high Resolution Sea Surface Temperature product and SPoRT’s Sea Surface Temperature Composite product. These global maps, updated daily, support users such as the National Weather Service.
“Having high-resolution, reliable sources of sea surface temperature data is extremely useful,” said Brian McNoldy of the University of Miami, who studies hurricanes. “From one day to the next, these datasets help identify which parts of the tropical Atlantic are above or below average. That information lets forecasters anticipate where storms might strengthen or weaken.”
Hurricane Milton rapidly intensified to category 5 strength over warm gulf waters. View the full story NASA Earth Observatory/Wanmei Liang
Ocean surface temperatures are only part of the story. NASA also monitors sea surface height with missions such as Sentinel-6 Michael Freilich and SWOT (Surface Water and Ocean Topography), using these measurements as indicators for deeper ocean heat content, a key source of energy fueling hurricanes.
Other NASA-built satellites and sensors measure atmospheric moisture, ocean surface winds, and atmospheric stability, all essential factors influencing whether a storm strengthens or dissipates.
NASA also uses its aircraft to study early storm development up close. In 2022, the agency’s Convective Processes Experiment-Cabo Verde airborne campaign flew off the northwest coast of Africa to study weather systems that can give rise to hurricanes.
The team focused in part on African easterly waves — swirling disturbances in the atmosphere that often become the seeds of Atlantic storms. One of the waves they observed later developed into Tropical Storm Hermine. The mission also gathered data that same year just before hurricanes Fiona and Ian formed.
“The strength of NASA’s pre-storm monitoring lies in both the breadth of measurements we take and the decades-long consistency behind them,” said Will McCarty, manager of weather programs at NASA Headquarters.
“By combining data on sea surface temperature, ocean heat content, wind patterns, and more, we can see early on when conditions align dangerously — often before a storm visibly forms,” McCarty said. “It’s how we turn early warning into early action.”
About the Author Emily DeMarcoShare
Details Last Updated Jun 13, 2025 Related Terms Explore More 1 min read Leaf Year: Seeing Plants in Hyperspectral ColorPACE now allows scientists to see three different pigments in vegetation, helping scientists pinpoint even…
Article
7 days ago
6 min read What NASA Is Learning from the Biggest Geomagnetic Storm in 20 Years
Article
1 month ago
6 min read NASA Data Helps Map Tiny Plankton That Feed Giant Right Whales
Article
1 month ago
Keep Exploring Discover More Topics From NASA Earth
Your home. Our Mission. And the one planet that NASA studies more than any other.
Explore Earth Science
Earth Science in Action
NASA’s unique vantage point helps us inform solutions to enhance decision-making, improve livelihoods, and protect our planet.
Earth Multimedia & Galleries
NASA’s Hurricane Science, Tech, Data Help American Communities
- Earth
- Explore
- Science at Work
- Multimedia
- Data
- For Researchers
- About Us
ISS Astronaut/Earth Observatory
- NASA supports hurricane preparedness and response by providing satellite data and science before, during, and after storms.
- During hurricane season, NASA delivers timely flood maps, power outage insights, landslide risk assessments, and more to state and federal partners.
- NASA tests innovative technologies, from AI models to mini satellites, to enhance how we monitor hurricanes and their impacts.
- NASA’s long-term tracking of wind, ocean heat, and atmospheric moisture improves understanding of where hurricanes might form and intensify.
With the Atlantic hurricane season underway, NASA is again gearing up to produce cutting-edge research that strengthens the nation’s ability to prepare for and respond to severe weather. From satellite imagery of our planet to improved storm modeling, the agency’s work supports communities in anticipating and reducing the impacts of hurricanes.
In 2024, hurricanes including Helene and Milton showed NASA’s wide-ranging capabilities. As the storms approached the United States, the agency’s network of satellites and scientists swung into action. Within hours of landfall, NASA’s Disasters Response Coordination System was supplying emergency managers and others with flood maps, power outage assessments, and other crucial data.
“People might be surprised how deeply NASA is involved in hurricane science,” said Scott Braun, a research meteorologist at NASA’s Goddard Space Flight Center in Greenbelt, Maryland. “We are not the agencies issuing forecasts or warnings, but our technologies and science are making fundamental contributions to how we understand, predict, and respond to these storms.”
Disaster Response Powered by NASAWhen hurricanes strike, NASA’s Disasters Response Coordination System aids state and federal agencies, producing and sharing imagery and data, including the NASA Disasters Mapping Portal, which offers tools to assess storm damage.
One crucial tool is NASA’s Black Marble product suite, produced and maintained by NASA Goddard. Using data from the Visible Infrared Imaging Radiometer Suite (VIIRS), researchers and others can map nighttime lights and detect power outages.
Unlike traditional outage maps, which often show only county-level data, NASA’s Black Marble can provide a more detailed view. It offers calibrated, daily observations, enabling high-confidence tracking of neighborhood-level impacts. Emergency response teams in Florida, for instance, have used this imagery to assess conditions near hazardous waste sites before heading into the field after a hurricane.
before after
The state faced widespread power outages after winds from Hurricane Helene snapped trees, tore off roofs, and toppled power lines. View the full story NASA Earth Observatory/Lauren Dauphin beforeafter
The state faced widespread power outages after winds from Hurricane Helene snapped trees, tore off roofs, and toppled power lines. View the full story NASA Earth Observatory/Lauren Dauphin
before
after
Scientists with NASA’s Black Marble processed data from VIIRS on the NOAA-NASA Suomi NPP satellite to show how power outages darkened Augusta, Georgia, before and after Hurricane Helene. View the full story
CurtainToggle2-Up
Image Details
Other NASA technologies map flooding. Scientists at NASA’s Marshall Space Flight Center in Huntsville, Alabama used the European Space Agency’s Sentinel-1 synthetic aperture radar data and other data from the NASA/U.S. Geological Survey Landsat satellites and ESA’s Sentinel-2 to track flooding after multiple hurricanes in 2024, including Helene and Milton.
These maps were shared through the NASA Disasters Mapping Portal with state and federal emergency managers responding to storms’ impacts in Florida, North Carolina, South Carolina, and elsewhere.
“The ability to see floodwaters and landscape changes gives communities a critical edge during response and recovery,” said Shanna McClain, disasters program manager for NASA’s Earth Science Division at NASA headquarters in Washington. “It helps decision-makers act faster when every minute counts.”
Hurricanes don’t just knock out power or trigger flooding — they can also loosen mountains. After Hurricane Helene, NASA scientists partnered with USGS to tackle a different threat: landslides throughout the southern Appalachian Mountains. NASA’s Landslide Hazard Assessment for Situational Awareness tool, developed at NASA Goddard, can help spot landslide-prone areas by combining different troves of satellite data.
“The landslide model brings together a wide range of Earth science,” said Thomas Stanley, a research scientist at NASA Goddard. “It’s a real convergence of satellite observations — soil moisture, precipitation, elevation — each one adding a key piece to the puzzle.”
NASA and USGS used rainfall data and modeling to estimate landslide hazards in the Appalachians following Hurricane Helene, highlighting high-risk zones across western North Carolina. NASA/USGSIn the days during and after Helene, a NASA-USGS team adapted this model to incorporate ground-based rainfall measurements. “This collaboration proved crucial during the critical first days when lingering clouds prevented direct satellite imaging of landslides,” said Kate Allstadt, a research geophysicist at USGS. “Combining NASA and USGS landslide models guided aerial reconnaissance over four states and helped prioritize areas for detailed mapping.”
NASA Disasters Response coordinators also partnered with USGS to manually map likely landslide areas in North Carolina, South Carolina, and Virginia, using high-resolution satellite imagery. This partnership enabled early warnings to agencies such as the North Carolina Geological Survey about potential landslide zones before visual confirmation was possible.
Tracking Hurricanes in Near Real TimeAs hurricanes gather strength over warm ocean waters, NASA’s satellites begin tracking them. One effort providing essential data on hurricanes is the Global Precipitation Measurement (GPM) mission, a collaboration between NASA and the Japan Aerospace Exploration Agency. Passing over storms once or twice per day, the GPM core satellite captures high-resolution data on rainfall intensity and distribution.
“The GPM mission gives us an inside look at where a storm is dropping the most rain and how intense it is,” said George Huffman, GPM project scientist at NASA Goddard. “That kind of information helps forecasters make better predictions and gives communities more time to prepare for flooding and dangerous conditions.”
Huffman’s team leads NASA’s IMERG (Integrated Multi-satellitE Retrievals for GPM) product, which combines GPM Core Observatory data with observations from other satellites to generate near real-time, global rainfall estimates every 30 minutes. For example, IMERG tracked the record-breaking rainfall that fell during Hurricane Harvey in 2017, when parts of Texas saw more than 50 inches of rain.
Satellite-based rainfall data can be especially vital when a big storm like Harvey or Helene knocks out ground-based rain measurements, Huffman said.
Watch Hurricane Harvey as it makes landfall in Texas and Louisiana in 2017. The visualization depicts precipitation measured by the GPM mission, highlighting record-shattering rainfall over Texas and Louisiana. Blue is frozen precipitation, while green to red is rainfall. NASA’s Scientific Visualization StudioNASA also is working to turn precipitation data into practical flood predictions. One such effort, led by NASA-funded hydrologist Ed Beighley at Northeastern University in Boston, merges rainfall estimates from the GPM mission with National Weather Service river discharge models and surface water mapping methods to identify areas likely to experience flooding.
During Hurricane Helene, his team provided early versions of these flood maps to the North Carolina Department of Health and Human Services.
“In some cases, like with Helene, we could see where disasters were likely to be declared just from the rainfall data — days before the disaster declarations were made official,” Beighley said. “That kind of near real-time information could really help counties and health departments prepare and coordinate response efforts.”
That same focus on improving early flood prediction was at the heart of NASA’s response to Hurricane Debby when it made landfall in Florida in August 2024. At NASA Marshall, the Short-term Prediction Research and Transition (SPoRT) team used its Land Information System to track soil moisture levels, crucial for understanding the potential for flooding.
The team’s Streamflow-AI model — a machine learning tool trained to predict how rivers respond to rainfall — also forecasted rising waters in small streams and creeks in Florida and the Carolinas.
“The streamflow tool is used pretty heavily by the National Weather Service now to help inform flood forecasts, which then filters down to evacuation orders,” said Patrick Duran, a NASA Marshall research scientist with SPoRT.
NASA SPoRT’s Streamflow-AI model shows the flooding potential for the Swannanoa River in Asheville, North Carolina, during and after Hurricane Helene. NASA SPoRT Reinventing the Tech That Sees Into StormsNASA doesn’t just collect data on hurricanes or aid in their aftermath — it is redefining the technology we use to observe and understand them. This work is not only improving forecasts and warnings but also helping to fuel the growth of America’s commercial satellite industry.
Take NASA’s TROPICS mission. Short for Time-Resolved Observations of Precipitation structure and storm Intensity with a Constellation of Smallsats, TROPICS represents a fundamental shift in how we might monitor hurricanes from space. Rather than relying solely on intermittent passes by larger satellites, TROPICS uses a group of small, lower-cost satellites working in concert to provide more frequent observations of tropical storm systems — offering a complementary approach to storm monitoring.
During Hurricane Helene, the TROPICS satellites tracked the storm through nearly its entire life cycle, capturing data on its rapid intensification from a tropical depression to a powerful category 4 hurricane before landfall in Florida’s Big Bend region.
Each TROPICS satellite carries a microwave radiometer. Unlike optical sensors, this instrument can see through clouds, making it ideal for tracking storms. The TROPICS’ radiometers are tuned to detect temperature, moisture, and precipitation patterns inside hurricanes.
“The TROPICS mission is really good at providing images of the structure of a storm, showing how well defined the eye is, which is key for improving forecasting,” said William Blackwell, TROPICS principal investigator at MIT Lincoln Laboratory in Massachusetts.
NASA’s TROPICS mission monitored Hurricane Helene throughout its life cycle. This visualization shows how the tropical depression rapidly intensified into a category 4 hurricane before hitting Florida and then moving inland. NASA’s Scientific Visualization StudioTomorrow.io, an American weather company, is using radiometer technology derived from TROPICS as it develops tools for commercial weather forecasting. The company also is working to adapt radar technology first tested on NASA’s RainCube mission.
RainCube, a small satellite about the size of a shoebox developed by NASA’s Jet Propulsion Laboratory in Southern California, operated from 2018 to 2020. It used radar to study precipitation, sending signals toward Earth and analyzing how long they took to bounce back, and how strong they were after reflecting off raindrops, snowflakes, and cloud ice.
Full-scale satellites have been using radar technology to make that kind of measurement for years. “The key thing with RainCube wasn’t bringing in new science,” said Simone Tanelli, RainCube principal scientist at JPL. “Instead, it was showing that we could give you similar data with a box that’s roughly 100 times smaller in volume than a full-size satellite.”
NASA also tests how other small, lower-cost instruments could transform how we monitor tropical storms. Two such tools — COWVR, short for Compact Ocean Wind Vector Radiometer measures ocean surface winds, and TEMPEST, short for Temporal Experiment for Storms and Tropical Systems tracks atmospheric water vapor — were launched to the International Space Station in 2021.
Using technology and designs from JPL and other NASA teams, TEMPEST and COWVR already are proving their value. Their data has been used by the U.S. Joint Typhoon Warning Center to help track and forecast powerful storms, such as Tropical Cyclone Mandous in December 2022.
Data from the COWVR and TEMPEST instruments aboard the ISS was used to create this image of Tropical Cyclone Mandous, which forecasters used to understand the December 2022 storm’s intensity and predict its path toward southern India. U.S. Joint Typhoon Warning Center/U.S. Naval Research LaboratoryNASA researchers also are investigating lightning, which has emerged as a key clue in predicting rapid storm intensification, a dangerous phase of the hurricane life cycle that is one of the most difficult aspects of hurricane forecasting. Spikes in lightning activity, especially in the eyewall, can be an early sign that a storm is about to strengthen quickly.
The agency’s SPoRT project is researching how lightning data from the Geostationary Lightning Mapper can improve hurricane forecasting. This sensor provides a nearly continuous view of lightning activity over oceans and in remote land regions that have fewer weather observations. The instrument rides aboard NOAA’s (National Oceanic and Atmospheric Administration) GOES weather satellites.
“By studying the size and energy of lightning flashes inside hurricanes, we’re learning how they might signal whether a storm is about to intensify or weaken,” said Duran. “It’s an evolving area of research with a lot of potential.”
During Hurricane Helene, SPoRT’s lightning analyses revealed a burst of strong, frequent flashes in the eyewall just before the storm surged from category 2 to category 4 intensity. That’s exactly the kind of signal researchers hope to detect more reliably in the future.
Bright, large lightning flashes seen in Hurricane Helene’s eyewall, captured by NASA SPoRT’s Geostationary Lightning Mapper viewer, indicate the storm’s rapid intensification from category 2 to 4 just hours before landfall. NASA SPoRTNASA frequently uses its airplanes to test new hurricane tech, too. In one recent example, scientists from NASA’s Langley Research Center in Hampton, Virginia, flew a cutting-edge 3-D Doppler wind lidar system across the United States, including making passes through the edges of Hurricane Helene. The instrument is designed to capture high-resolution wind data that can improve predictions of rapidly evolving storms, such as hurricanes and severe thunderstorms, where accurate wind observations are essential, but often lacking.
Braun compared these multiple data streams — from TROPICS, GPM, and other instruments — to medical imaging. “Think about how doctors use different types of scans like X-rays, MRIs, and ultrasound to understand what’s happening inside a patient’s body,” he said. “We’re doing something similar with hurricanes. Each system gives us a different view of the storm’s internal structure and environment, with the goal of improving forecasts.”
Watching For Hurricane Warning SignsLong before a hurricane takes shape, NASA satellites are already scanning the global ocean and atmosphere, closely tracking the conditions that give rise to powerful storms. One of the most important indicators is sea surface temperature.
NASA combines data from multiple satellites and sensors — such as the Moderate Resolution Imaging Spectroradiometer (MODIS) and VIIRS — to produce sea surface temperature maps like JPL’s Multi-scale Ultra-high Resolution Sea Surface Temperature product and SPoRT’s Sea Surface Temperature Composite product. These global maps, updated daily, support users such as the National Weather Service.
“Having high-resolution, reliable sources of sea surface temperature data is extremely useful,” said Brian McNoldy of the University of Miami, who studies hurricanes. “From one day to the next, these datasets help identify which parts of the tropical Atlantic are above or below average. That information lets forecasters anticipate where storms might strengthen or weaken.”
Hurricane Milton rapidly intensified to category 5 strength over warm gulf waters. View the full story NASA Earth Observatory/Wanmei LiangOcean surface temperatures are only part of the story. NASA also monitors sea surface height with missions such as Sentinel-6 Michael Freilich and SWOT (Surface Water and Ocean Topography), using these measurements as indicators for deeper ocean heat content, a key source of energy fueling hurricanes.
Other NASA-built satellites and sensors measure atmospheric moisture, ocean surface winds, and atmospheric stability, all essential factors influencing whether a storm strengthens or dissipates.
NASA also uses its aircraft to study early storm development up close. In 2022, the agency’s Convective Processes Experiment-Cabo Verde airborne campaign flew off the northwest coast of Africa to study weather systems that can give rise to hurricanes.
The team focused in part on African easterly waves — swirling disturbances in the atmosphere that often become the seeds of Atlantic storms. One of the waves they observed later developed into Tropical Storm Hermine. The mission also gathered data that same year just before hurricanes Fiona and Ian formed.
“The strength of NASA’s pre-storm monitoring lies in both the breadth of measurements we take and the decades-long consistency behind them,” said Will McCarty, manager of weather programs at NASA Headquarters.
“By combining data on sea surface temperature, ocean heat content, wind patterns, and more, we can see early on when conditions align dangerously — often before a storm visibly forms,” McCarty said. “It’s how we turn early warning into early action.”
About the Author Emily DeMarcoShare
Details Last Updated Jun 13, 2025 Related Terms Explore More 1 min read Leaf Year: Seeing Plants in Hyperspectral ColorPACE now allows scientists to see three different pigments in vegetation, helping scientists pinpoint even…
Article
7 days ago
6 min read What NASA Is Learning from the Biggest Geomagnetic Storm in 20 Years
Article
1 month ago
6 min read NASA Data Helps Map Tiny Plankton That Feed Giant Right Whales
Article
1 month ago
Keep Exploring Discover More Topics From NASA Earth
Your home. Our Mission. And the one planet that NASA studies more than any other.
Explore Earth Science
Earth Science in Action
NASA’s unique vantage point helps us inform solutions to enhance decision-making, improve livelihoods, and protect our planet.
Earth Multimedia & Galleries
NASA Sensor on Space Station Eyes Contamination off California Coast
4 min read
Preparations for Next Moonwalk Simulations Underway (and Underwater) Instruments in space are helping scientists map wastewater plumes flowing into the Pacific Ocean from the heavily polluted Tijuana River, seen here with the San Diego sky-line to the north. NOAA
Proof-of-concept results from the mouth of the Tijuana River in San Diego County show how an instrument called EMIT could aid wastewater detection.
An instrument built at NASA’s Jet Propulsion Laboratory to map minerals on Earth is now revealing clues about water quality. A recent study found that EMIT (Earth Surface Mineral Dust Source Investigation) was able to identify signs of sewage in the water at a Southern California beach.
The authors of the study examined a large wastewater plume at the mouth of the Tijuana River, south of Imperial Beach near San Diego. Every year, millions of gallons of treated and untreated sewage enter the river, which carries pollutants through communities and a national reserve on the U.S.-Mexico border before emptying into the Pacific Ocean. Contaminated coastal waters have been known to impact human health — from beachgoers to U.S. Navy trainees — and harm marine ecosystems, fisheries, and wildlife.
For decades scientists have tracked water quality issues like harmful algal blooms using satellite instruments that analyze ocean color. Shades that range from vibrant red to bright green can reveal the presence of algae and phytoplankton. But other pollutants and harmful bacteria are more difficult to monitor because they’re harder to distinguish with traditional satellite sensors.
A plume spreads out to sea in this image captured off San Diego by the Sentinel-2 satellite on March 24, 2023. Both a spectroradiometer used to analyze water samples (yellow star) and NASA’s EMIT identified in the plume signs of a type of bacterium that can sicken humans and animals.SDSU/Eva Scrivner
That’s where EMIT comes in. NASA’s hyperspectral instrument orbits Earth aboard the International Space Station, observing sunlight reflecting off the planet below. Its advanced optical components split the visible and infrared wavelengths into hundreds of color bands. By analyzing each satellite scene pixel by pixel at finer spatial resolution, scientists can discern what molecules are present based on their unique spectral “fingerprint.”
Scientists compared EMIT’s observations of the Tijuana River plume with water samples they tested on the ground. Both EMIT and the ground-based instruments detected a spectral fingerprint pointing to phycocyanin, a pigment in cyanobacteria, an organism that can sicken humans and animals that ingest or inhale it.
‘Smoking Gun’Many beachgoers are already familiar with online water-quality dashboards, which often rely on samples collected in the field, said Christine Lee, a scientist at JPL in Southern California and a coauthor of the study. She noted the potential for EMIT to complement these efforts.
“From orbit you are able to look down and see that a wastewater plume is extending into places you haven’t sampled,” Lee said. “It’s like a diagnostic at the doctor’s office that tells you, ‘Hey, let’s take a closer look at this.’”
Lead author Eva Scrivner, a doctoral student at the University of Connecticut, said that the findings “show a ‘smoking gun’ of sorts for wastewater in the Tijuana River plume.” Scrivner, who led the study while at San Diego State University, added that EMIT could be useful for filling data gaps around intensely polluted sites where traditional water sampling takes a lot of time and money.
EMIT’s Many UsesThe technology behind EMIT is called imaging spectroscopy, which was pioneered at JPL in the 1980s. Imaging spectrometers developed at JPL over the decades have been used to support areas ranging from agriculture to forest health and firefighting.
When EMIT was launched in July 2022, it was solely aimed at mapping minerals and dust in Earth’s desert regions. That same sensitivity enabled it to spot the phycocyanin pigments off the California coast.
Scrivner hadn’t anticipated that an instrument initially devoted to exploring land could reveal insights about water. “The fact that EMIT’s findings over the coast are consistent with measurements in the field is compelling to water scientists,” she said. “It’s really exciting.”
To learn more about EMIT, visit:
https://earth.jpl.nasa.gov/emit/
News Media ContactsJane J. Lee / Andrew Wang
Jet Propulsion Laboratory, Pasadena, Calif.
626-379-6874 / 818-354-0307
jane.j.lee@jpl.nasa.gov / andrew.wang@jpl.nasa.gov
Written by Sally Younger
2025-078
Share Details Last Updated Jun 12, 2025 Related Terms Explore More 12 min read NASA’s Hurricane Science, Tech, Data Help American CommunitiesWith hurricane season underway, NASA is gearing up to produce cutting-edge research to bolster the…
Article 4 days ago 3 min read Studying Storms from Space Station Article 4 days ago 4 min read Welcome Home, Expedition 72 Crew! Article 5 days ago Keep Exploring Discover Related TopicsMissions
Humans in Space
Climate Change
Solar System
NASA Sensor on Space Station Eyes Contamination off California Coast
4 min read
Preparations for Next Moonwalk Simulations Underway (and Underwater) Instruments in space are helping scientists map wastewater plumes flowing into the Pacific Ocean from the heavily polluted Tijuana River, seen here with the San Diego sky-line to the north. NOAAProof-of-concept results from the mouth of the Tijuana River in San Diego County show how an instrument called EMIT could aid wastewater detection.
An instrument built at NASA’s Jet Propulsion Laboratory to map minerals on Earth is now revealing clues about water quality. A recent study found that EMIT (Earth Surface Mineral Dust Source Investigation) was able to identify signs of sewage in the water at a Southern California beach.
The authors of the study examined a large wastewater plume at the mouth of the Tijuana River, south of Imperial Beach near San Diego. Every year, millions of gallons of treated and untreated sewage enter the river, which carries pollutants through communities and a national reserve on the U.S.-Mexico border before emptying into the Pacific Ocean. Contaminated coastal waters have been known to impact human health — from beachgoers to U.S. Navy trainees — and harm marine ecosystems, fisheries, and wildlife.
For decades scientists have tracked water quality issues like harmful algal blooms using satellite instruments that analyze ocean color. Shades that range from vibrant red to bright green can reveal the presence of algae and phytoplankton. But other pollutants and harmful bacteria are more difficult to monitor because they’re harder to distinguish with traditional satellite sensors.
A plume spreads out to sea in this image captured off San Diego by the Sentinel-2 satellite on March 24, 2023. Both a spectroradiometer used to analyze water samples (yellow star) and NASA’s EMIT identified in the plume signs of a type of bacterium that can sicken humans and animals.SDSU/Eva ScrivnerThat’s where EMIT comes in. NASA’s hyperspectral instrument orbits Earth aboard the International Space Station, observing sunlight reflecting off the planet below. Its advanced optical components split the visible and infrared wavelengths into hundreds of color bands. By analyzing each satellite scene pixel by pixel at finer spatial resolution, scientists can discern what molecules are present based on their unique spectral “fingerprint.”
Scientists compared EMIT’s observations of the Tijuana River plume with water samples they tested on the ground. Both EMIT and the ground-based instruments detected a spectral fingerprint pointing to phycocyanin, a pigment in cyanobacteria, an organism that can sicken humans and animals that ingest or inhale it.
‘Smoking Gun’Many beachgoers are already familiar with online water-quality dashboards, which often rely on samples collected in the field, said Christine Lee, a scientist at JPL in Southern California and a coauthor of the study. She noted the potential for EMIT to complement these efforts.
“From orbit you are able to look down and see that a wastewater plume is extending into places you haven’t sampled,” Lee said. “It’s like a diagnostic at the doctor’s office that tells you, ‘Hey, let’s take a closer look at this.’”
Lead author Eva Scrivner, a doctoral student at the University of Connecticut, said that the findings “show a ‘smoking gun’ of sorts for wastewater in the Tijuana River plume.” Scrivner, who led the study while at San Diego State University, added that EMIT could be useful for filling data gaps around intensely polluted sites where traditional water sampling takes a lot of time and money.
EMIT’s Many UsesThe technology behind EMIT is called imaging spectroscopy, which was pioneered at JPL in the 1980s. Imaging spectrometers developed at JPL over the decades have been used to support areas ranging from agriculture to forest health and firefighting.
When EMIT was launched in July 2022, it was solely aimed at mapping minerals and dust in Earth’s desert regions. That same sensitivity enabled it to spot the phycocyanin pigments off the California coast.
Scrivner hadn’t anticipated that an instrument initially devoted to exploring land could reveal insights about water. “The fact that EMIT’s findings over the coast are consistent with measurements in the field is compelling to water scientists,” she said. “It’s really exciting.”
To learn more about EMIT, visit:
https://earth.jpl.nasa.gov/emit/
News Media ContactsJane J. Lee / Andrew Wang
Jet Propulsion Laboratory, Pasadena, Calif.
626-379-6874 / 818-354-0307
jane.j.lee@jpl.nasa.gov / andrew.wang@jpl.nasa.gov
Written by Sally Younger
2025-078
Share Details Last Updated Jun 12, 2025 Related Terms Explore More 12 min read NASA’s Hurricane Science, Tech, Data Help American CommunitiesWith hurricane season underway, NASA is gearing up to produce cutting-edge research to bolster the…
Article 4 days ago 3 min read Studying Storms from Space Station Article 4 days ago 4 min read Welcome Home, Expedition 72 Crew! Article 5 days ago Keep Exploring Discover Related TopicsMissions
Humans in Space
Climate Change
Solar System
NASA, Museum to Launch Junior Pilot School for Young Innovators
3 min read
Preparations for Next Moonwalk Simulations Underway (and Underwater) Students from Tropico Middle School in Rosamond, California, build their own paper planes as part of a project during NASA Aero Fair on April 9, 2025.NASA/Genaro Vavuris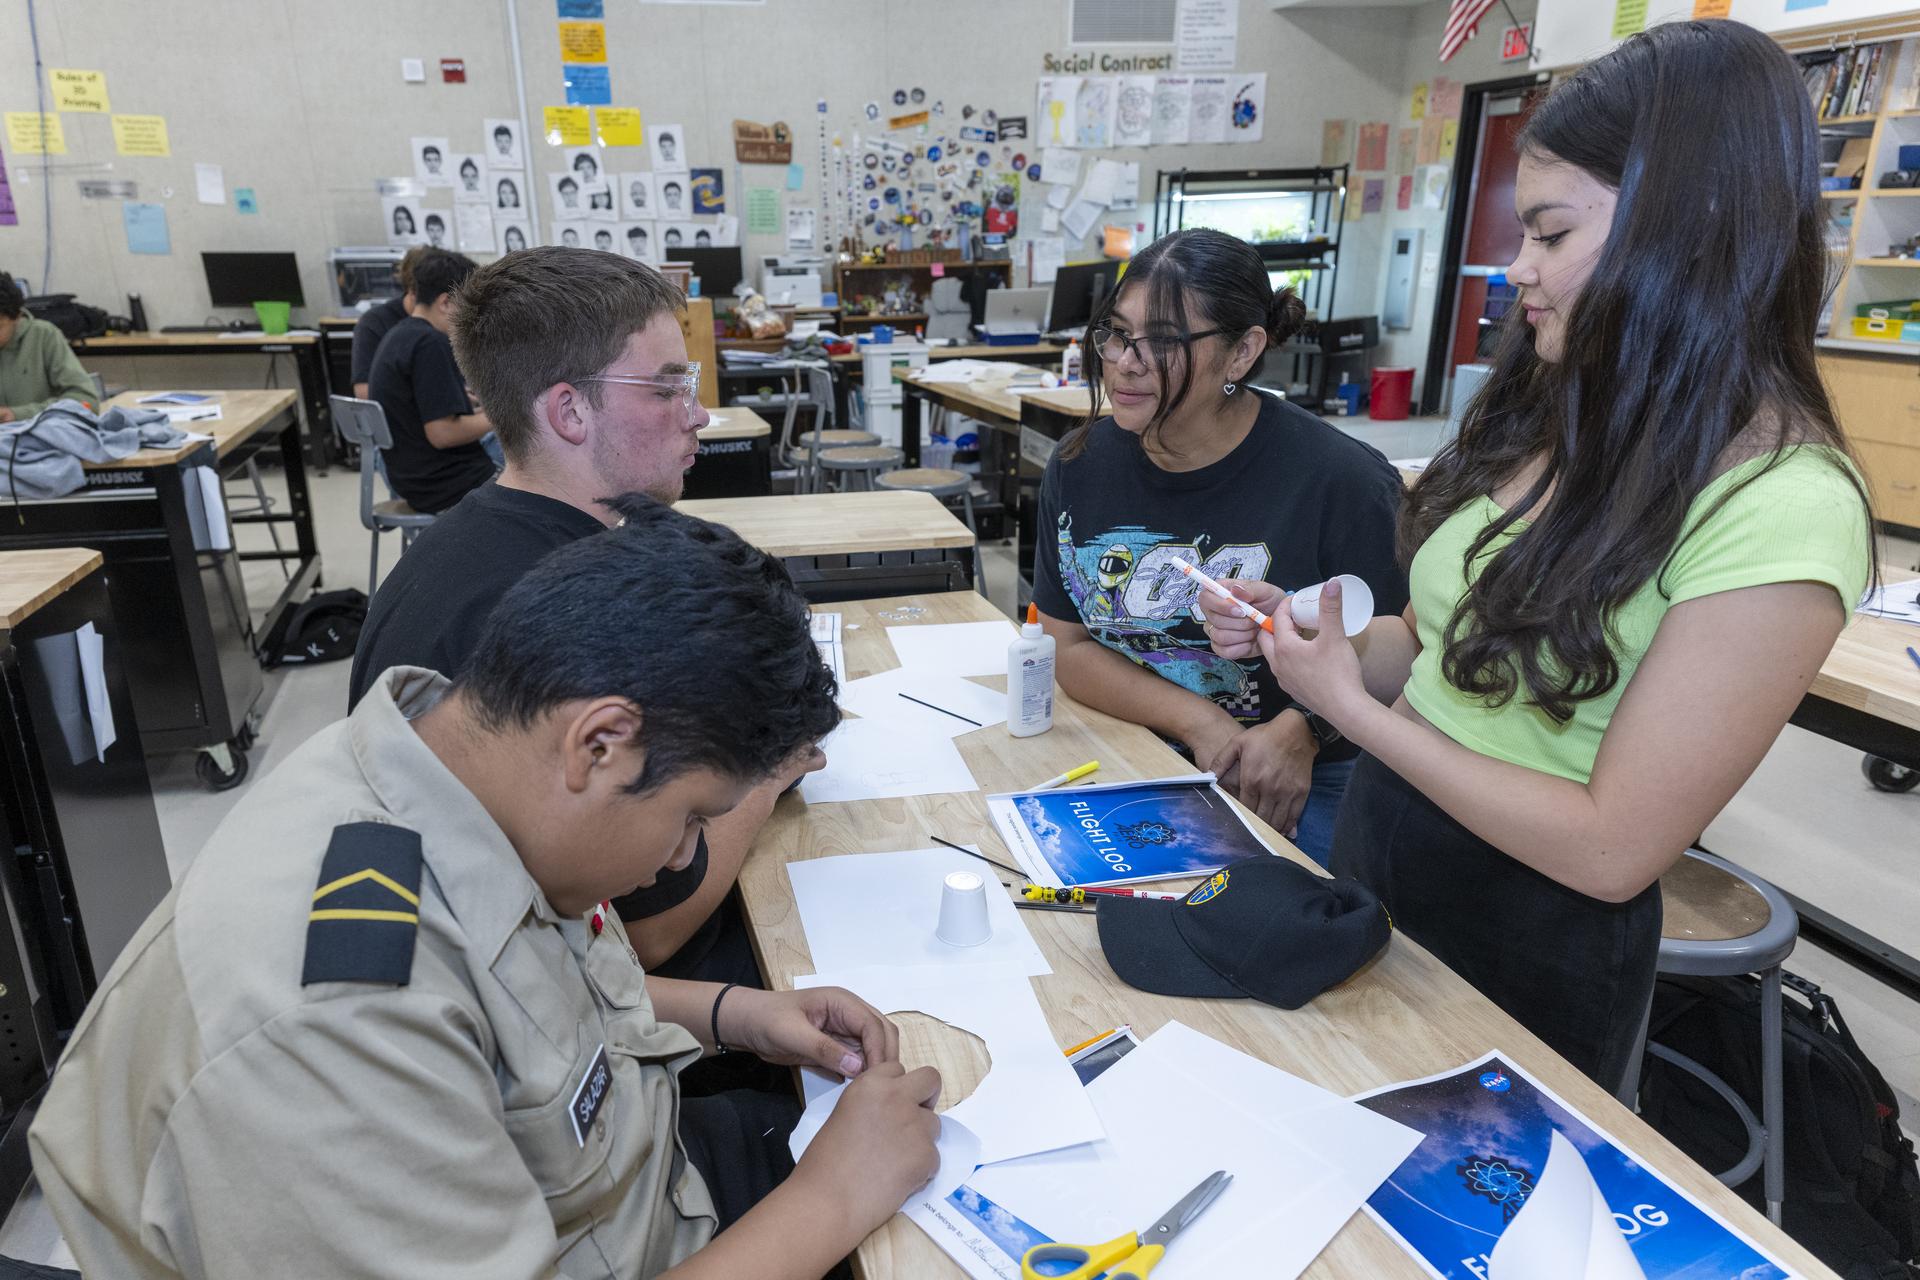
A new generation of aerospace explorers will soon embark on a hands-on summer experience focusing on careers in science, mathematics, engineering, and technology (STEM). This month, NASA’s Armstrong Flight Research Center in Edwards, California, and the Flight Test Museum Foundation will launch the 2025 Junior Test Pilot School.
Held at Blackbird Airpark and Joe Davies Heritage Airpark in Palmdale, California, this six-week program invites elementary-aged students to step into the shoes of test pilots and engineers from 9 a.m. to 2 p.m. Mondays through Fridays, June 16 through July 25. Registration is free through participating school districts and the Flight Test Museum. Students will have direct access to legendary aircraft such as A-12, SR-71, U-2, F-86 Sabre, and NASA Boeing 747 Space Shuttle Carrier Aircraft.
The Junior Test Pilot School combines authentic NASA-designed curriculum, immersive aerospace activities, and direct engagement with engineers, test pilots, and scientists to inspire future aerospace professionals in the Antelope Valley – home to one of the nation’s highest concentrations of STEM careers.
“This program offers more than a glimpse into aerospace, it provides students a hands-on opportunity to solve real-world problems and see themselves in future STEM roles,” said Dr. Amira Flores, program integration manager for NASA’s California Office of STEM Engagement.
Daily lessons cover eight core modules: flight principles, stealth engineering, altitude effects, speed and g-force, payload impact, maneuverability, reconnaissance design, and jet engine systems.
Additionally, in collaboration with NASA Armstrong’s Aero Fair program, students will be guided through the program’s Wildfire Design Challenge by a NASA volunteer. Following the engineering design process, students will collaborate to design and build a prototype of an aerial vehicle that suppresses wildfires.
“Our junior test pilots learn to analyze the aircraft to figure out why they were designed the way they are and think like an engineer,” said Lisa Sheldon Brown, director of education at the Flight Test Museum. “Research shows that academic trajectory is set by fifth grade, making this the critical window to inspire STEM interest and career awareness.”
The program is delivered in partnership with the City of Palmdale and is supported by industry sponsors, including Lockheed Martin and Northrop Grumman. These partners not only provide funding and volunteers but also elevate career exposure by introducing students to diverse aerospace professionals within the region.
NASA Armstrong is a hub of aeronautical innovation and STEM workforce development in the Antelope Valley. Through programs like Aero Fair and partnerships like Junior Test Pilots School, Armstrong inspires and equips the next generation of engineers, pilots, and scientists.
The Flight Test Museum Foundation preserves the legacy and promotes the future of aerospace through education programs and historical preservation at the Blackbird Airpark and forthcoming Flight Test Museum at Edwards Air Force Base in Edwards, California.
For more about NASA’s Armstrong Flight Research Center, visit:
https://www.nasa.gov/armstrong
– end –
Elena Aguirre
Armstrong Flight Research Center, Edwards, California
(661) 276-7004
elena.aguirre@nasa.gov
Dede Dinius
Armstrong Flight Research Center, Edwards, California
(661) 276-5701
darin.l.dinius@nasa.gov
Armstrong Flight Research Center
Humans in Space
Climate Change
Solar System
NASA, Museum to Launch Junior Pilot School for Young Innovators
3 min read
Preparations for Next Moonwalk Simulations Underway (and Underwater) Students from Tropico Middle School in Rosamond, California, build their own paper planes as part of a project during NASA Aero Fair on April 9, 2025.NASA/Genaro VavurisA new generation of aerospace explorers will soon embark on a hands-on summer experience focusing on careers in science, mathematics, engineering, and technology (STEM). This month, NASA’s Armstrong Flight Research Center in Edwards, California, and the Flight Test Museum Foundation will launch the 2025 Junior Test Pilot School.
Held at Blackbird Airpark and Joe Davies Heritage Airpark in Palmdale, California, this six-week program invites elementary-aged students to step into the shoes of test pilots and engineers from 9 a.m. to 2 p.m. Mondays through Fridays, June 16 through July 25. Registration is free through participating school districts and the Flight Test Museum. Students will have direct access to legendary aircraft such as A-12, SR-71, U-2, F-86 Sabre, and NASA Boeing 747 Space Shuttle Carrier Aircraft.
The Junior Test Pilot School combines authentic NASA-designed curriculum, immersive aerospace activities, and direct engagement with engineers, test pilots, and scientists to inspire future aerospace professionals in the Antelope Valley – home to one of the nation’s highest concentrations of STEM careers.
“This program offers more than a glimpse into aerospace, it provides students a hands-on opportunity to solve real-world problems and see themselves in future STEM roles,” said Dr. Amira Flores, program integration manager for NASA’s California Office of STEM Engagement.
Daily lessons cover eight core modules: flight principles, stealth engineering, altitude effects, speed and g-force, payload impact, maneuverability, reconnaissance design, and jet engine systems.
Additionally, in collaboration with NASA Armstrong’s Aero Fair program, students will be guided through the program’s Wildfire Design Challenge by a NASA volunteer. Following the engineering design process, students will collaborate to design and build a prototype of an aerial vehicle that suppresses wildfires.
“Our junior test pilots learn to analyze the aircraft to figure out why they were designed the way they are and think like an engineer,” said Lisa Sheldon Brown, director of education at the Flight Test Museum. “Research shows that academic trajectory is set by fifth grade, making this the critical window to inspire STEM interest and career awareness.”
The program is delivered in partnership with the City of Palmdale and is supported by industry sponsors, including Lockheed Martin and Northrop Grumman. These partners not only provide funding and volunteers but also elevate career exposure by introducing students to diverse aerospace professionals within the region.
NASA Armstrong is a hub of aeronautical innovation and STEM workforce development in the Antelope Valley. Through programs like Aero Fair and partnerships like Junior Test Pilots School, Armstrong inspires and equips the next generation of engineers, pilots, and scientists.
The Flight Test Museum Foundation preserves the legacy and promotes the future of aerospace through education programs and historical preservation at the Blackbird Airpark and forthcoming Flight Test Museum at Edwards Air Force Base in Edwards, California.
For more about NASA’s Armstrong Flight Research Center, visit:
https://www.nasa.gov/armstrong
– end –
Elena Aguirre
Armstrong Flight Research Center, Edwards, California
(661) 276-7004
elena.aguirre@nasa.gov
Dede Dinius
Armstrong Flight Research Center, Edwards, California
(661) 276-5701
darin.l.dinius@nasa.gov
Armstrong Flight Research Center
Humans in Space
Climate Change
Solar System
Star Trek to Star Wars, The Fantastic Four to Predator — here are 10 sci-fi comic books coming your way in 2025
It's our choice as the best smart telescope and it's rarely discounted — now with $420 off, this telescope deal is worth grabbing fast
The Vera C. Rubin Observatory is about to totally transform astronomy
The Vera C. Rubin Observatory is about to totally transform astronomy
The Vera Rubin Observatory is about to completely transform astronomy
The Vera Rubin Observatory is about to completely transform astronomy
European Space Agency reveals 3 key space missions threatened by Trump's NASA budget cuts
NASA Launching Rockets Into Radio-Disrupting Clouds
5 min read
NASA Launching Rockets Into Radio-Disrupting CloudsNASA is launching rockets from a remote Pacific island to study mysterious, high-altitude cloud-like structures that can disrupt critical communication systems. The mission, called Sporadic-E ElectroDynamics, or SEED, opens its three-week launch window from Kwajalein Atoll in the Marshall Islands on Friday, June 13.
The atmospheric features SEED is studying are known as Sporadic-E layers, and they create a host of problems for radio communications. When they are present, air traffic controllers and marine radio users may pick up signals from unusually distant regions, mistaking them for nearby sources. Military operators using radar to see beyond the horizon may detect false targets — nicknamed “ghosts” — or receive garbled signals that are tricky to decipher. Sporadic-E layers are constantly forming, moving, and dissipating, so these disruptions can be difficult to anticipate.
An animated illustration depicts Sporadic-E layers forming in the lower portions of the ionosphere, causing radio signals to reflect back to Earth before reaching higher layers of the ionosphere. NASA’s Goddard Space Flight Center/Conceptual Image Lab
Sporadic-E layers form in the ionosphere, a layer of Earth’s atmosphere that stretches from about 40 to 600 miles (60 to 1,000 kilometers) above sea level. Home to the International Space Station and most Earth-orbiting satellites, the ionosphere is also where we see the greatest impacts of space weather. Primarily driven by the Sun, space weather causes myriad problems for our communications with satellites and between ground systems. A better understanding of the ionosphere is key to keeping critical infrastructure running smoothly.
The ionosphere is named for the charged particles, or ions, that reside there. Some of these ions come from meteors, which burn up in the atmosphere and leave traces of ionized iron, magnesium, calcium, sodium, and potassium suspended in the sky. These “heavy metals” are more massive than the ionosphere’s typical residents and tend to sink to lower altitudes, below 90 miles (140 kilometers). Occasionally, they clump together to create dense clusters known as Sporadic-E layers.
The Perseids meteor shower peaks in mid-August. Meteors like these can deposit metals into Earth’s ionosphere that can help create cloud-like structures called Sporadic-E layers. NASA/Preston Dyches.jpg?w=2048&h=1363&fit=clip&crop=faces%2Cfocalpoint)
“These Sporadic-E layers are not visible to naked eye, and can only be seen by radars. In the radar plots, some layers appear like patchy and puffy clouds, while others spread out, similar to an overcast sky, which we call blanketing Sporadic-E layer” said Aroh Barjatya, the SEED mission’s principal investigator and a professor of engineering physics at Embry-Riddle Aeronautical University in Daytona Beach, Florida. The SEED team includes scientists from Embry-Riddle, Boston College in Massachusetts, and Clemson University in South Carolina.
“There’s a lot of interest in predicting these layers and understanding their dynamics because of how they interfere with communications,” Barjatya said.
A Mystery at the EquatorScientists can explain Sporadic-E layers when they form at midlatitudes but not when they appear close to Earth’s equator — such as near Kwajalein Atoll, where the SEED mission will launch.
In the Northern and Southern Hemispheres, Sporadic-E layers can be thought of as particle traffic jams.
Think of ions in the atmosphere as miniature cars traveling single file in lanes defined by Earth’s magnetic field lines. These lanes connect Earth end to end — emerging near the South Pole, bowing around the equator, and plunging back into the North Pole.
A conceptual animation shows Earth’s magnetic field. The blue lines radiating from Earth represent the magnetic field lines that charged particles travel along. NASA’s Goddard Space Flight Center/Conceptual Image Lab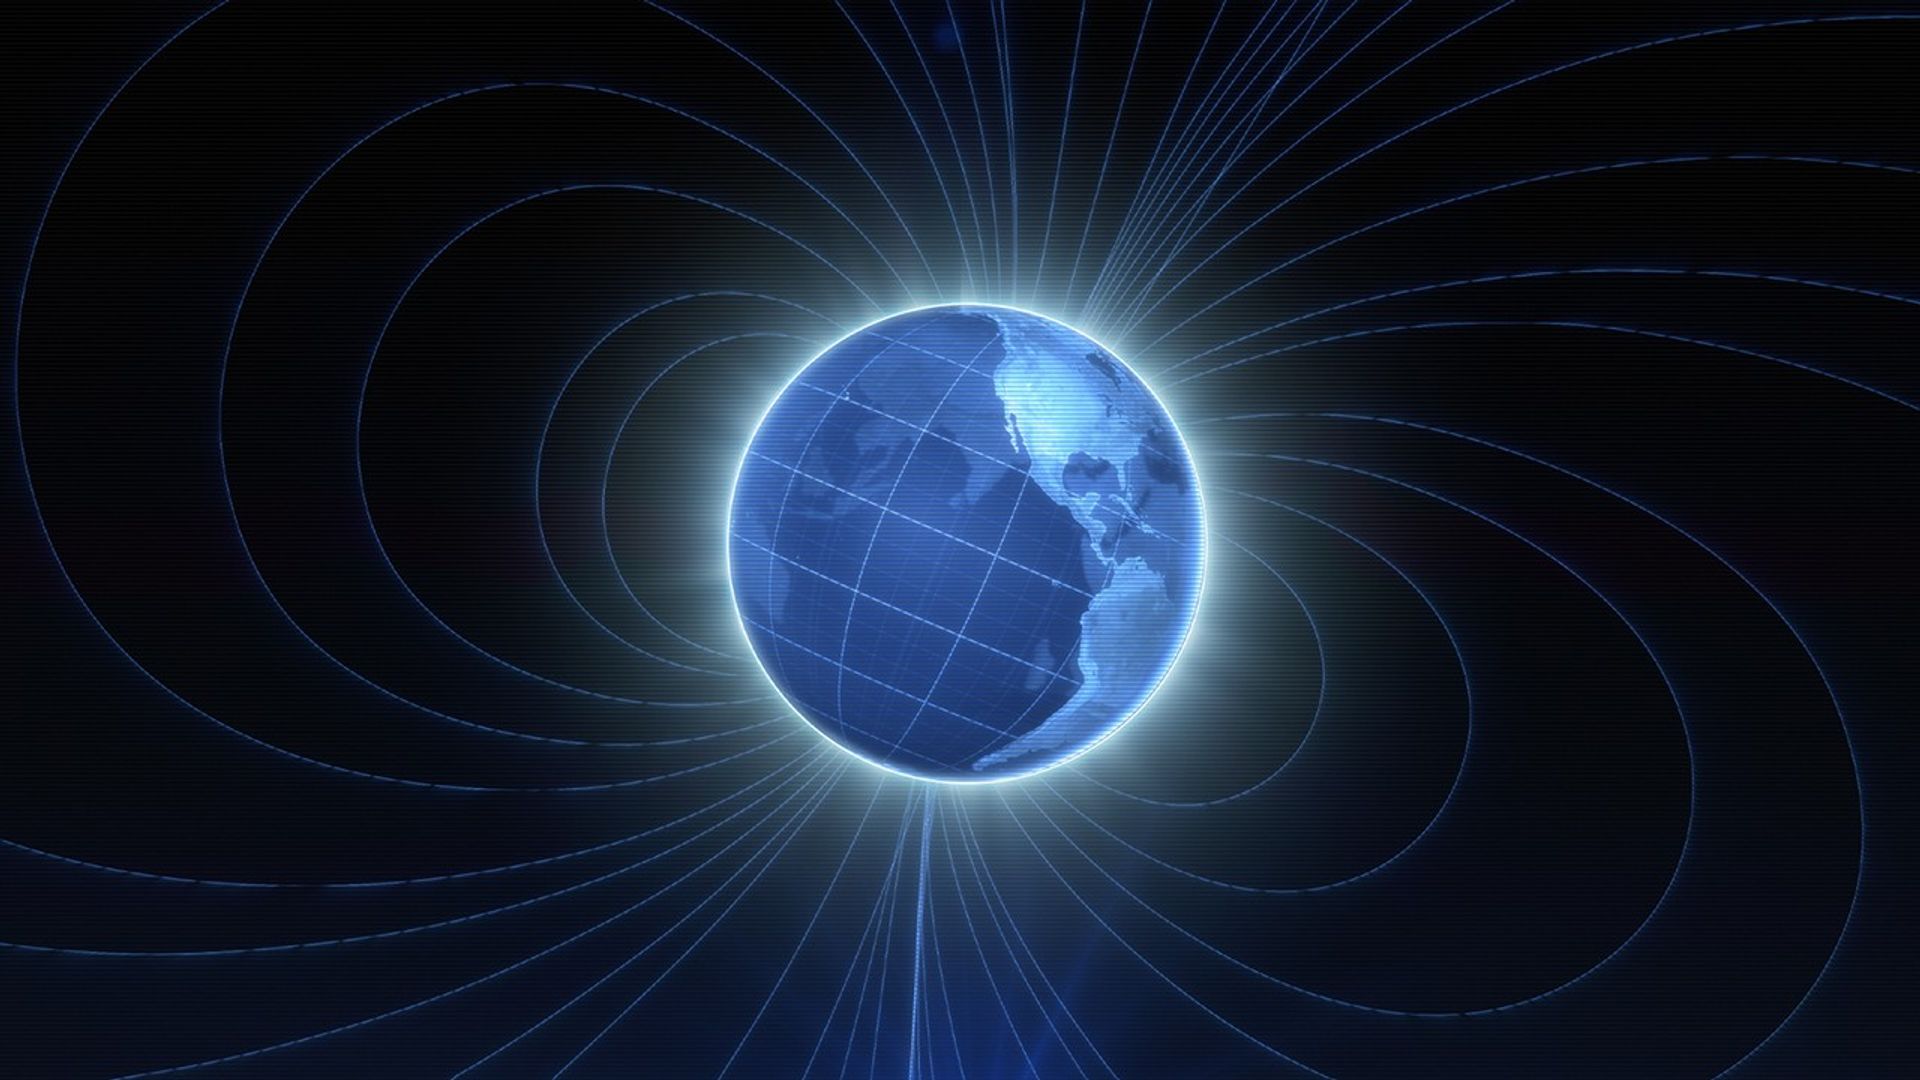
At Earth’s midlatitudes, the field lines angle toward the ground, descending through atmospheric layers with varying wind speeds and directions. As the ions pass through these layers, they experience wind shear — turbulent gusts that cause their orderly line to clump together. These particle pileups form Sporadic-E layers.
But near the magnetic equator, this explanation doesn’t work. There, Earth’s magnetic field lines run parallel to the surface and do not intersect atmospheric layers with differing winds, so Sporadic-E layers shouldn’t form. Yet, they do — though less frequently.
“We’re launching from the closest place NASA can to the magnetic equator,” Barjatya said, “to study the physics that existing theory doesn’t fully explain.”
Taking to the SkiesTo investigate, Barjatya developed SEED to study low-latitude Sporadic-E layers from the inside. The mission relies on sounding rockets — uncrewed suborbital spacecraft carrying scientific instruments. Their flights last only a few minutes but can be launched precisely at fleeting targets.
Beginning the night of June 13, Barjatya and his team will monitor ALTAIR (ARPA Long-Range Tracking and Instrumentation Radar), a high-powered, ground-based radar system at the launch site, for signs of developing Sporadic-E layers. When conditions are right, Barjatya will give the launch command. A few minutes later, the rocket will be in flight.
The SEED science team and mission management team in front of the ARPA Long-Range Tracking and Instrumentation Radar (ALTAIR). The SEED team will use ALTAIR to monitor the ionosphere for signs of Sporadic-E layers and time the launch. U.S. Army Space and Missile Defense Command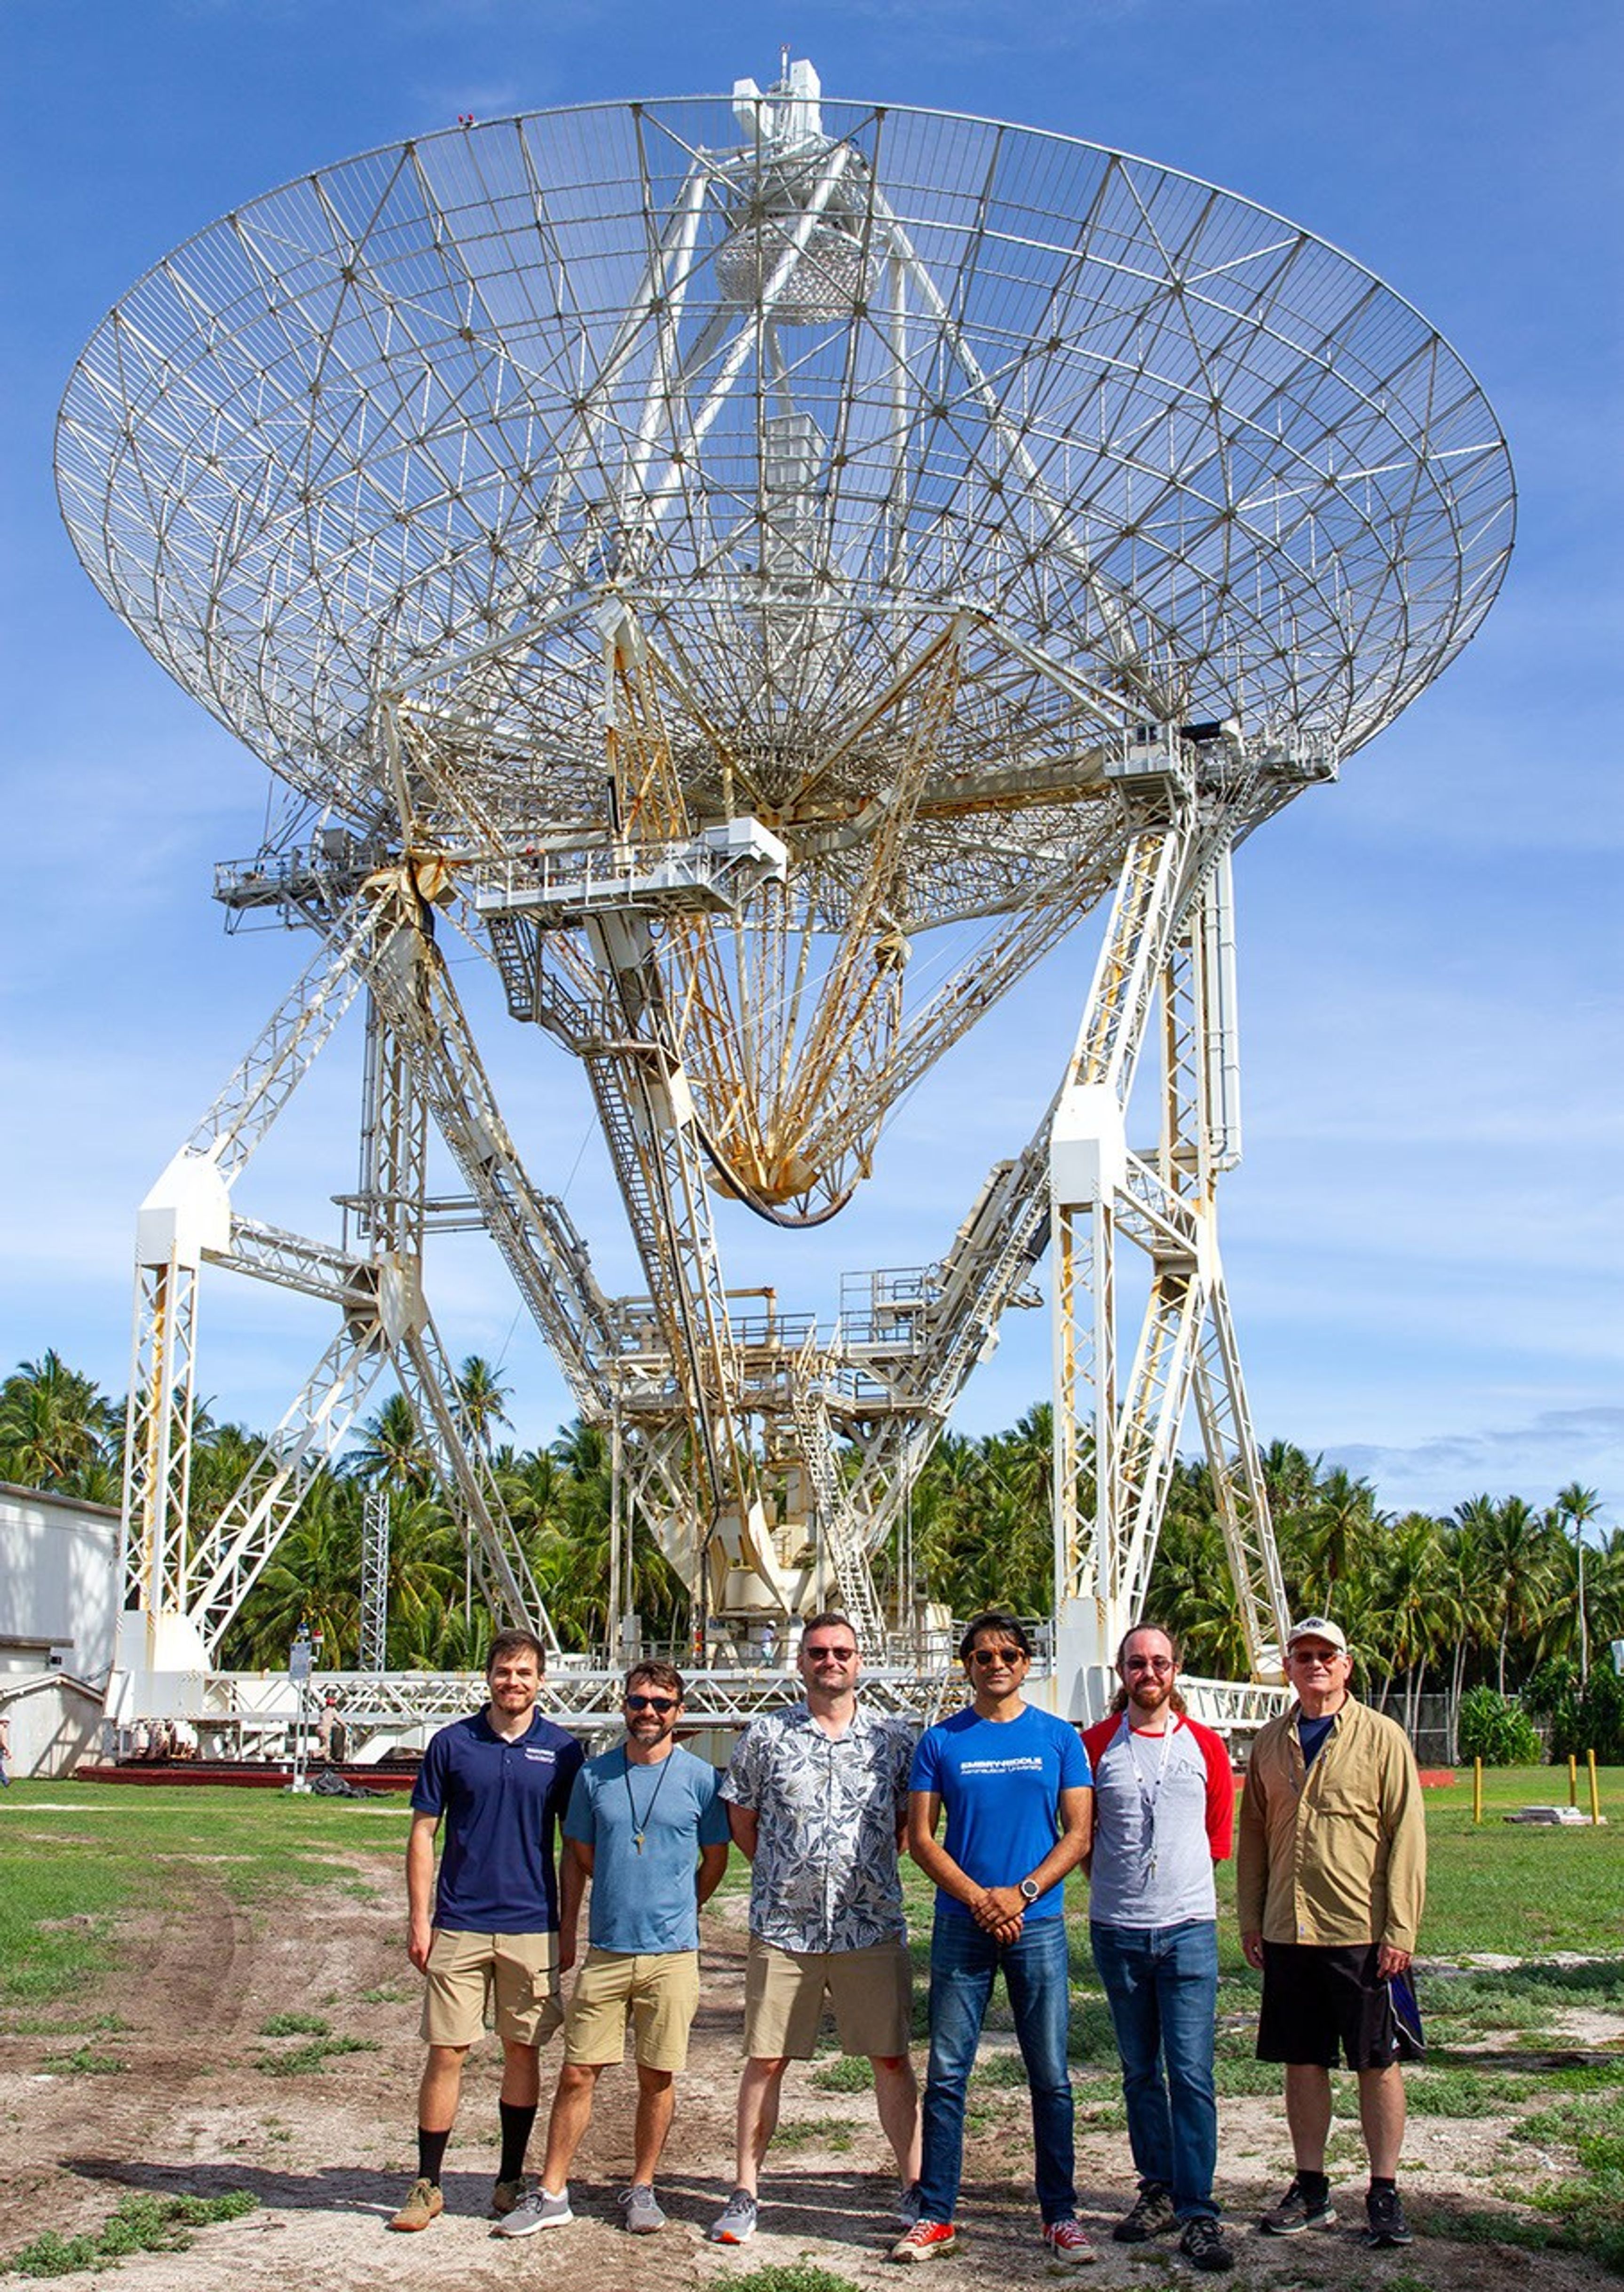
On ascent, the rocket will release colorful vapor tracers. Ground-based cameras will track the tracers to measure wind patterns in three dimensions. Once inside the Sporadic-E layer, the rocket will deploy four subpayloads — miniature detectors that will measure particle density and magnetic field strength at multiple points. The data will be transmitted back to the ground as the rocket descends.
On another night during the launch window, the team will launch a second, nearly identical rocket to collect additional data under potentially different conditions.
Barjatya and his team will use the data to improve computer models of the ionosphere, aiming to explain how Sporadic-E layers form so close to the equator.
“Sporadic-E layers are part of a much larger, more complicated physical system that is home to space-based assets we rely on every day,” Barjatya said. “This launch gets us closer to understanding another key piece of Earth’s interface to space.”
NASA’s Goddard Space Flight Center, Greenbelt, Md.
Share Details Last Updated Jun 12, 2025 Related Terms Explore More 9 min read The Earth Observer Editor’s Corner: April–June 2025Article
22 hours ago
5 min read NASA’s Webb ‘UNCOVERs’ Galaxy Population Driving Cosmic Renovation
Article
22 hours ago
6 min read Frigid Exoplanet in Strange Orbit Imaged by NASA’s Webb
Article
2 days ago
Keep Exploring Discover Related Topics
Sounding Rockets
Ionosphere, Thermosphere & Mesosphere
Space Weather
Solar flares, coronal mass ejections, solar particle events, and the solar wind form the recipe space weather that affects life…
Solar System