
Feed aggregator
A controversial experiment threatened to kill the multiverse in 2025
A controversial experiment threatened to kill the multiverse in 2025
Benefits of mRNA cancer vaccines could exceed $75 billion in US alone
Benefits of mRNA cancer vaccines could exceed $75 billion in US alone
The Earth Observer: Offering Perspectives from Space through Time
38 min read
The Earth Observer: Offering Perspectives from Space through TimeAn Intertwined History: The Earth Observer and EOS
The Earth Observer, a newsletter issued for nearly 37 years, will release its last online content at the close of 2025. This newsletter evolved in parallel with NASA’s Earth Observing System (EOS). It is almost impossible to speak of this newsletter without mentioning EOS. As The Earth Observer prepares its final publication, NASA also plans to shutter its three EOS flagship satellites (discussed below) possibly as early as the end of 2026.
While EOS was “much more than its satellites,” one cannot deny that the satellite missions and their iconic images provide an entry point to the overarching work conducted by the EOS science teams for almost three decades. These efforts spanned crucial complementary ground- and aircraft-based observations along with focused field campaigns to coordinate observations across multiple levels of Earth system time and spatial scales. The teams worked (and continue to work) closely with the NASA Earth Science Division Earth Observing System Data and Information System (EOSDIS) and related Science Investigator Processing System (SIPS) facilities, as well as developed and enhanced the algorithms that support the satellite products. Readers who wish to learn more about these topics should consult The Earth Observer’s archives page, which contains much of the history of this work.
During this point of inflection, The Earth Observer’s publication team felt it important to pause and reflect on the significance of the work detailed in the newsletter throughout this brief slip of time. The result is the article that follows.
A Flagship of an Idea: Almost Four Decades of Science
As described in the article, A Condensed History of the Earth Observing System (EOS) [June 1989, 1:3. 2–3], what would become known as EOS had its foundation in the recommendations of an ad hoc NASA study group that convened in 1981 to “determine what could and should be done to study integrated Earth science measurement needs.” Initially, the study group envisioned several large platforms in space, each with numerous instruments that would be serviced by the Space Shuttle, similar to servicing of the Hubble Telescope on several occasions. Known as System Z [Sept.–Oct. 2008, 20:5, 4–7], this early vision “laid the groundwork for a Mission to Planet Earth” but was reimagined after the tragic loss of the Space Shuttle Challenger in January 1986. An article written at the end of the Shuttle program included a sidebar that detailed the impracticality of launching shuttle missions into polar orbit to service EOS satellites, see Polar Shuttle Launches: The Path Almost Taken, [Sept.–Oct. 2011, 23:5, 6–7]. Eventually, the large space platform concept morphed into several mid-size flagship satellite missions, known today as Terra, Aqua, and Aura. Smaller satellite missions would supplement and enhance the data gathered by the “big three” satellites – see Figure 1.
To view this video please enable JavaScript, and consider upgrading to a web browser that
supports HTML5 video
Technological advances further enhanced and refined this vision, allowing satellites to fly in close formation to capture near-simultaneous measurements in much the same way they would if they were on a single platform. The Afternoon Constellation, or A-Train, is a shining example of this international effort and is described in more detail below.
NASA released the first EOS Announcement of Opportunity in 1988, and a panel selected the winning proposals. An EOS Project Science Office was established to manage the projects. During this time of rapid development, NASA leadership was keenly aware of the need to keep the international EOS community abreast of the latest information. Enter The Earth Observer newsletter. First published in March 1989, the newsletter was the natural conduit to bridge this communication gap. To set the stage of how things have changed, an early article, titled Direct Transmissions of EOS Data to Worldwide Users [July–Aug. 1990, 2:6, 2–4], introduced the readership to the World Wide Web, which promoted “a ‘place’ where scientists communicate with each other and with the data they have collected with the help of their professional colleagues from the engineering and operations disciplines.”
In the more than 1000 printed pages published in the past three decades. The Earth Observer has chronicled the story of EOS and NASA’s broader Earth Science program. The publication has captured – often in meticulous detail – the intensive work behind the scenes that has gone into the development of the technologies, algorithms, and data centers that gather data from Earth observing satellites, suborbital observations, and other experiments to inform end users who use the data to address societal issues.
In the years before the first EOS missions launched, the newsletter reported in earnest on Investigator Working Group (IWG) meetings, Payload Panel Reviews (reviewing the instruments planned for the EOS platforms), and Mission and Instrument Science Team Meetings. As EOS matured, the newsletter began reporting on the development and implementation of specific science missions, launches, milestones, and research generated from the data collected. The editorial staff began publishing more feature articles to appear along with the meeting and workshop reports. The newsletter shared news stories developed by NASA’s Earth Science News Team and other bimonthly content (e.g., Education Update, Science in the News). “The Editor’s Corner” column in the newsletter gave the EOS Senior Project Scientist a platform to offer commentary on current events in NASA Earth Science as well as on the content of the current issue of the newsletter. While not formally named for the first few issues, an editorial article has been a cornerstone of the publication since the beginning.
The Earth Observer has produced several articles reflecting on its interwoven history with EOS, such as The Earth Observer: Twenty-Five Years Telling NASA’s Earth Science Story [March–April 2014, 26:2, 4–12] and A Thirtieth Anniversary Reflection from the Executive Editor {March–April 2019, 31:2, 4–6]. These stories expand upon the topics covered in the brief review presented in this article.
Satellite Missions: the Backbone of EOS Science
EOS was originally organized around 24 critical science measurements deemed integral to understand planetary processes and assess variability, long-term trends, and climate change. These science measurements serve as a roadmap for organizing EOS data products and mission objectives. The 24 measurements coalesced into five broad categories that reflect Earth science disciplines:
- Atmosphere: aerosol properties, cloud properties (e.g., fraction and opacity), atmospheric temperature and pressure profiles, water vapor, ozone (O3), trace gases [e.g., carbon dioxide (CO2), sulfur dioxide, and formaldehyde], and total solar irradiance;
- Ocean: ocean color (chlorophyll), sea surface temperature, sea ice cover and motion, ocean surface topography and sea level, and sea surface salinity;
- Land/Cryosphere: land surface temperature, soil moisture, snow and ice cover (extent and elevation), land cover and change (e.g., forest cover), and topography;
- Radiation/Energy Balance: radiant energy balance (incoming and outgoing radiation), and precipitation (e.g., rainfall, snow); and
- Solid Earth: static gravity field and synthetic aperture radar observations.
The Grand Vision of EOS: Three Flagships Leading the Earth Observing Fleet
In the late 1980s and early 1990s, a team of scientists envisaged the concept for two missions – EOS-AM1 and EOS-PM1. The synergy of this system was the ability to make observations in the morning (10:30 AM mean local time, or MLT), a time when cloud cover over the tropical equatorial and other land regions would be at a minimum, and afternoon (1:30 PM MLT), a time when continental convection would peak. The plan was to have two instruments – the Moderate Resolution Imaging Spectroradiometer (MODIS) and Clouds and Earth’s Radiant Energy System (CERES) – overlap on the two platforms along with other instruments unique to each mission.
In parallel, the teams envisioned EOS-CHEM1, a satellite platform identical to EOS-PM1 but carrying a payload focused on atmospheric chemistry. Like EOS-PM1, EOS-CHEM1 would be placed in an afternoon orbit but lag slightly in its equatorial crossing time (1:45 PM MLT) to optimize its position for atmospheric chemistry observations.
Each mission was slated to be the first in a series that would launch at five-year intervals to ensure continuity of critical Earth science measurements. Budgetary realities and technical advances eventually rendered plans for the second and third series of each satellite obsolete; however, all three flagship missions endured far beyond their planned six-year lifetime and have outlasted the originally proposed 15-year timeframe for each series.
Terra
Terra, originally named EOS-AM1, launched in December 1999 – see Figure 2. Terra carries five instruments – MODIS, CERES (two copies), Multiangle Imaging Spectroradiometer (MISR), Advanced Spaceborne Thermal Emission and Reflection Radiometer (ASTER), and Measurements of Pollution in the Troposphere (MOPITT) – and was designed to capture information about Earth’s atmosphere, carbon cycle and ecosystems, climate variability, water and energy cycle, weather, and the planet’s surface and interior. The Earth Observer captured early Terra data in the article, Terra Spacecraft Open For Business [March–April 2000, 12:2, 24].
After over 26 years in service, Terra remains in orbit and continues to gather data; as of this writing all instruments accept MOPITT remain active. However, since 2020 the spacecraft has been allowed to drift from its carefully maintained 10:30 AM MLT equator crossing time toward earlier MLT crossings. This was done to conserve enough fuel to control Terra’s eventual atmospheric reentry. The Terra team also conducted orbital lowering maneuver on the spacecraft in 2022. A more complete history of Terra is available in the online article, Terra: The End of An Era, published on December 29, 2025.
Figure 2. An artistic rendering of the Terra spacecraft. The image shows the locations of its five instruments. Note that there are two Clouds and Earth’s Radiant Energy System instruments aboard the satellite and one each of the other four instruments. Figure credit: NASA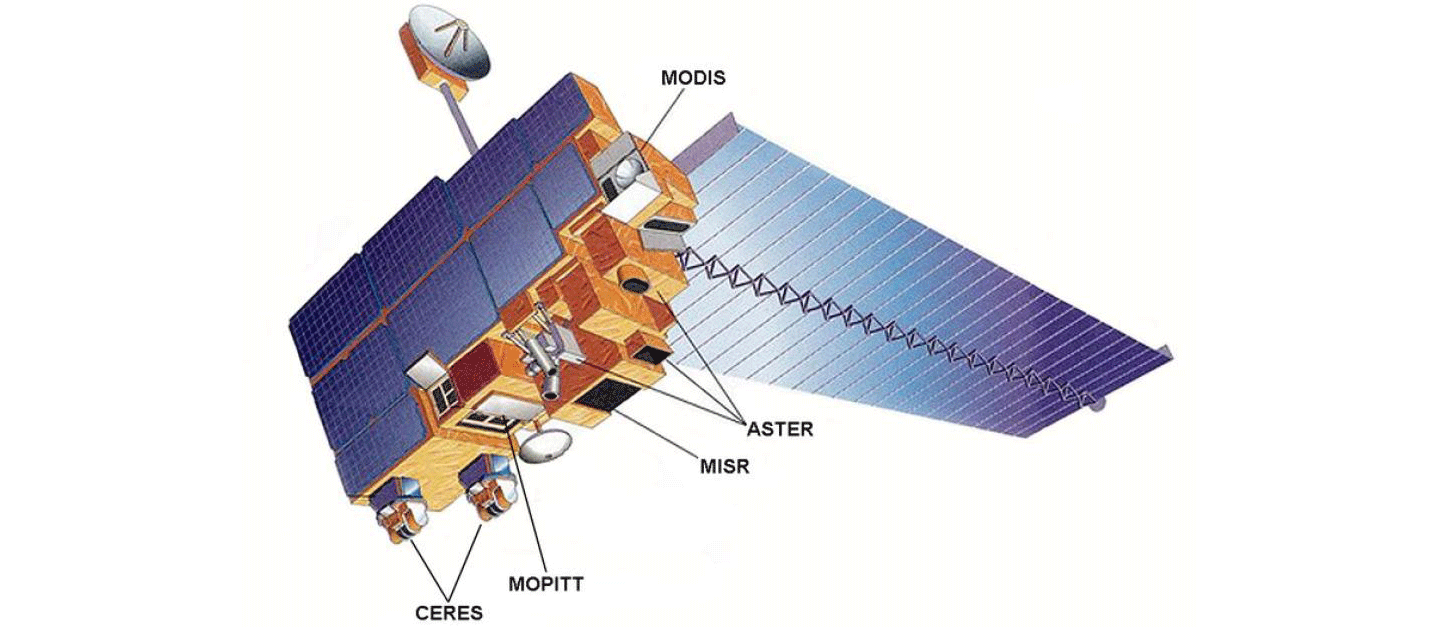
Aqua
Aqua, originally named EOS-PM1, launched in May 2002 – see Figure 3. An article in The Earth Observer at the time of launch described the mission, Aqua is Launched! [March–April 2002, 14:2, 2]. The second EOS flagship carried six different instruments into orbit – Atmospheric Infrared Sounder (AIRS), Advanced Microwave Sounding Unit–A (AMSU-A1 and -A2), CERES (two copies), MODIS (both of which also fly on Terra), the Advanced Microwave Scanning Radiometer for EOS (AMSR–E), and Humidity Sounder for Brazil (HSB). Aqua’s mission focused on collecting data on global precipitation, evaporation, and the cycling of water. Aqua paired its data with Terra, offering the scientific community additional insights into the daily cycles for important scientific parameters to understand the global water cycle.
The Earth Observer article, Aqua: 10 Years After Launch [Nov.–Dec. 2012, 24:6, 4–17] provides an overview of the mission’s accomplishments during its first decade in orbit. Due to fuel limitations, Aqua completed the last of its drag makeup maneuvers in December 2021. Like Terra, the satellite is now in a free-drift mode, slowly descending below the A-Train orbit and crossing the equator later and at lower altitudes. A more recent newsletter article, Aqua Turns 20 [May–June 2022, 34:3, 5–12] reflects on Aqua’s accomplishments and legacy after two decades in orbit. As of this writing MODIS, CERES, AMSU, and CERES remain active.
Figure 3. An artistic rendering of NASA’s Aqua satellite. The mission collects data about the Earth’s water cycle, including evaporation from the oceans, water vapor in the atmosphere, clouds, precipitation, soil moisture, sea ice, land ice, and snow cover on the land and the ocean. Figure credit: NASAAura
Originally named EOS-CHEM1, Aura was the third and final flagship mission, and was launched in July 2004 – see Figure 4. The Earth Observer detailed the first post-launch science team meeting, Aura Science Team Meeting [March–April 2004, 17:2, 8–11]. Aura followed a Sun-synchronous, near-polar orbit, crossing the equator 15 minutes after Aqua. Similar to Aqua, Aura completed its final inclination adjustment maneuver in April 2023 to save its remaining fuel to allow for controlled reentry. As a consequence, the satellite has drifted out of the A-Train orbit, slowly continuing to move to a later equatorial crossing time and lower orbit altitude.
Aura’s payload included four instruments: the Microwave Limb Sounder (MLS), High Resolution Dynamics Limb Sounder (HIRDLS), Tropospheric Emission Spectrometer (TES), and Ozone Monitoring Instrument (OMI). These instruments gather information on trace gases and aerosols in the atmosphere. The key mission objectives aimed to monitor recovery of the stratospheric O3 hole, evaluate air quality, and monitor the role of the atmosphere in climate change. The article, Aura Celebrates Ten Years in Orbit [Nov.–Dec. 2014, 26:6, 4–16] detailed Aura’s first decade of accomplishments. The online article, Aura at 20 Years, published Sept. 16, 2024, reported on Aura’s status and achievements as it began its third decade of continuous operations. As of this writing MLS and OMI remain active.
Figure 4. An artistic rendering of the Aura satellite. Aura gathers information on trace gases and aerosols in the atmosphere. Figure credit: NASA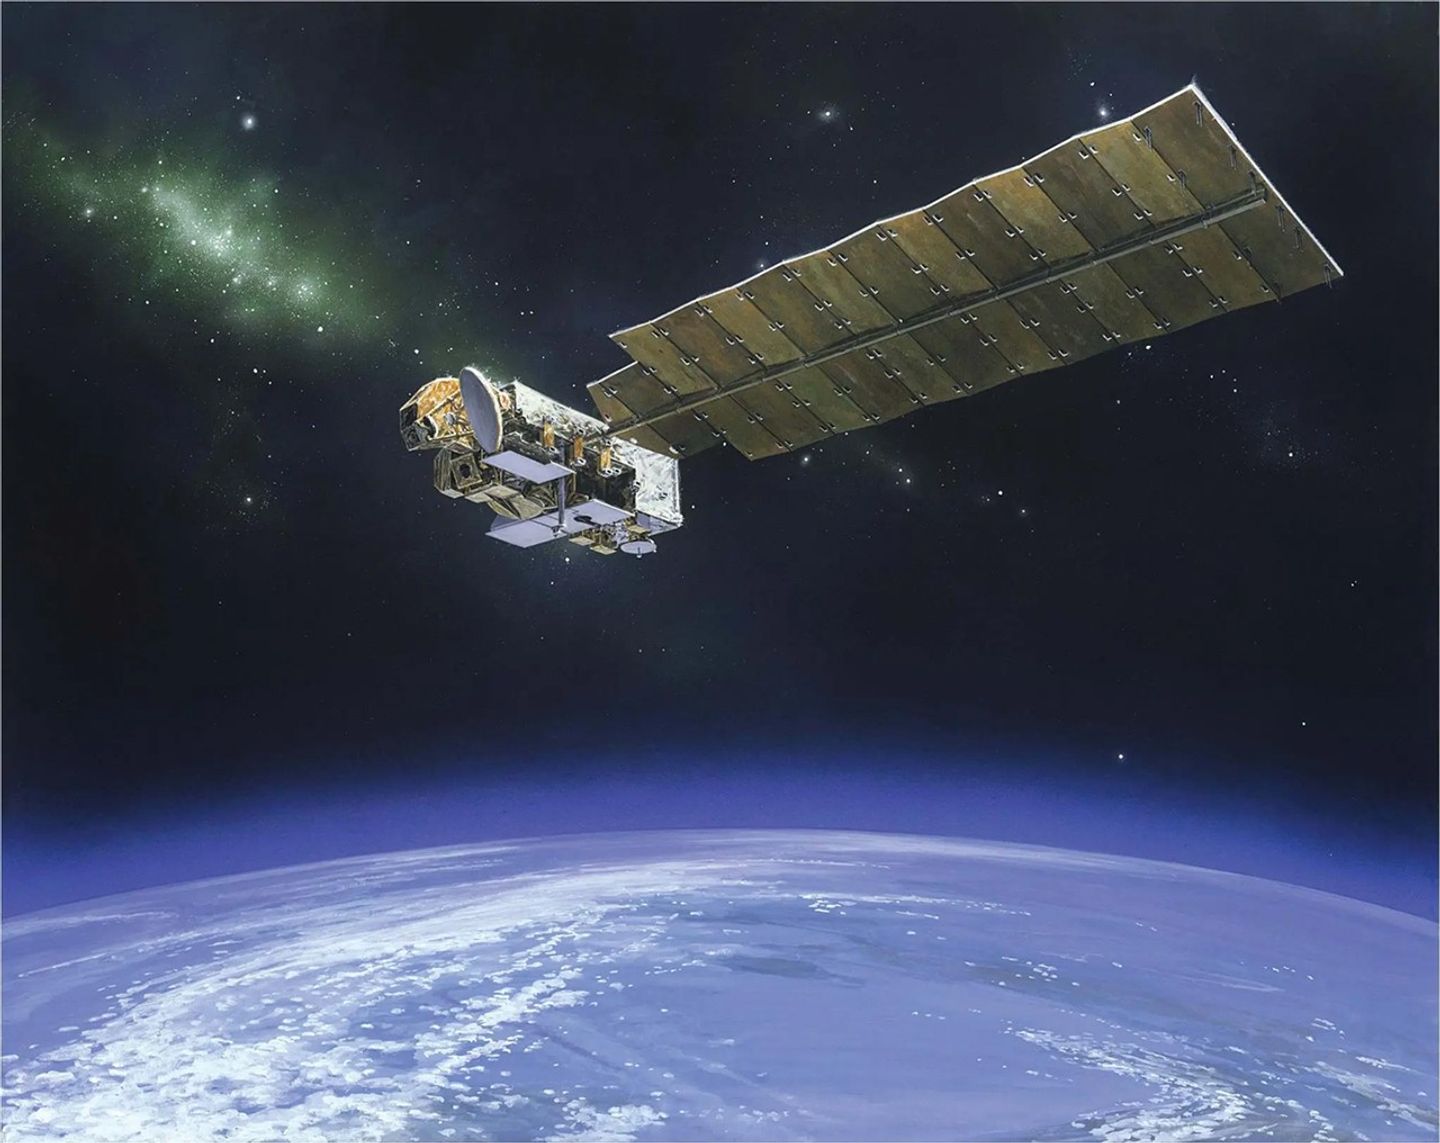
Building and Dismantling the “A-Train”
Between 2002 and 2014, a series of satellites joined the A-Train constellation – see Figure 5. This international effort includes the two EOS flagship satellites with afternoon equatorial crossing times (Aqua and Aura) as well as the Orbiting Carbon Observatory–2 (OCO-2), CloudSat, and the Cloud-Aerosol Lidar and Infrared Pathfinder Satellite Observations (CALIPSO). In addition, Polarization and Anisotropy of Reflectances for Atmospheric Sciences coupled with observations from a Lidar (PARASOL) and Global Change Observation Missions with a focus on the water cycle (GCOM-W) are two international missions that became part of the A-Train constellation.
In the past decade, many of the satellites in the A-Train have either retired or have been allowed to drift out of the constellation. As of this writing, only two satellites – OCO-2 and GCOM-W1 – remain in their positions in the A-Train gathering data.
Three A-Train symposiums have been organized to bring the Earth science community together to discuss the achievements and future synergy of these missions. The outcome from each of these meetings were reported in The Earth Observer. The most recent of these was: The Third A-Train Symposium: Summary and Perspectives on a Decade of Constellation-Based Earth Observations [July–Aug. 2017, 29:4, 4–18].
Figure 5. An artistic depiction of all the satellites that participated in the Afternoon Constellation (A-Train), except for Polarization and Anisotropy of Reflectances for Atmospheric Sciences coupled with observations from a Lidar (PARASOL). CloudSat and Cloud-Aerosol Lidar and Infrared Pathfinder Satellite Observations (CALIPSO) lowered their orbits. Called the C-Train, the orbit of these satellites overlapped the A-Train, enabling science observations with other A-Train missions. More details about the A-train is available on the constellation’s website. Figure credit: NASA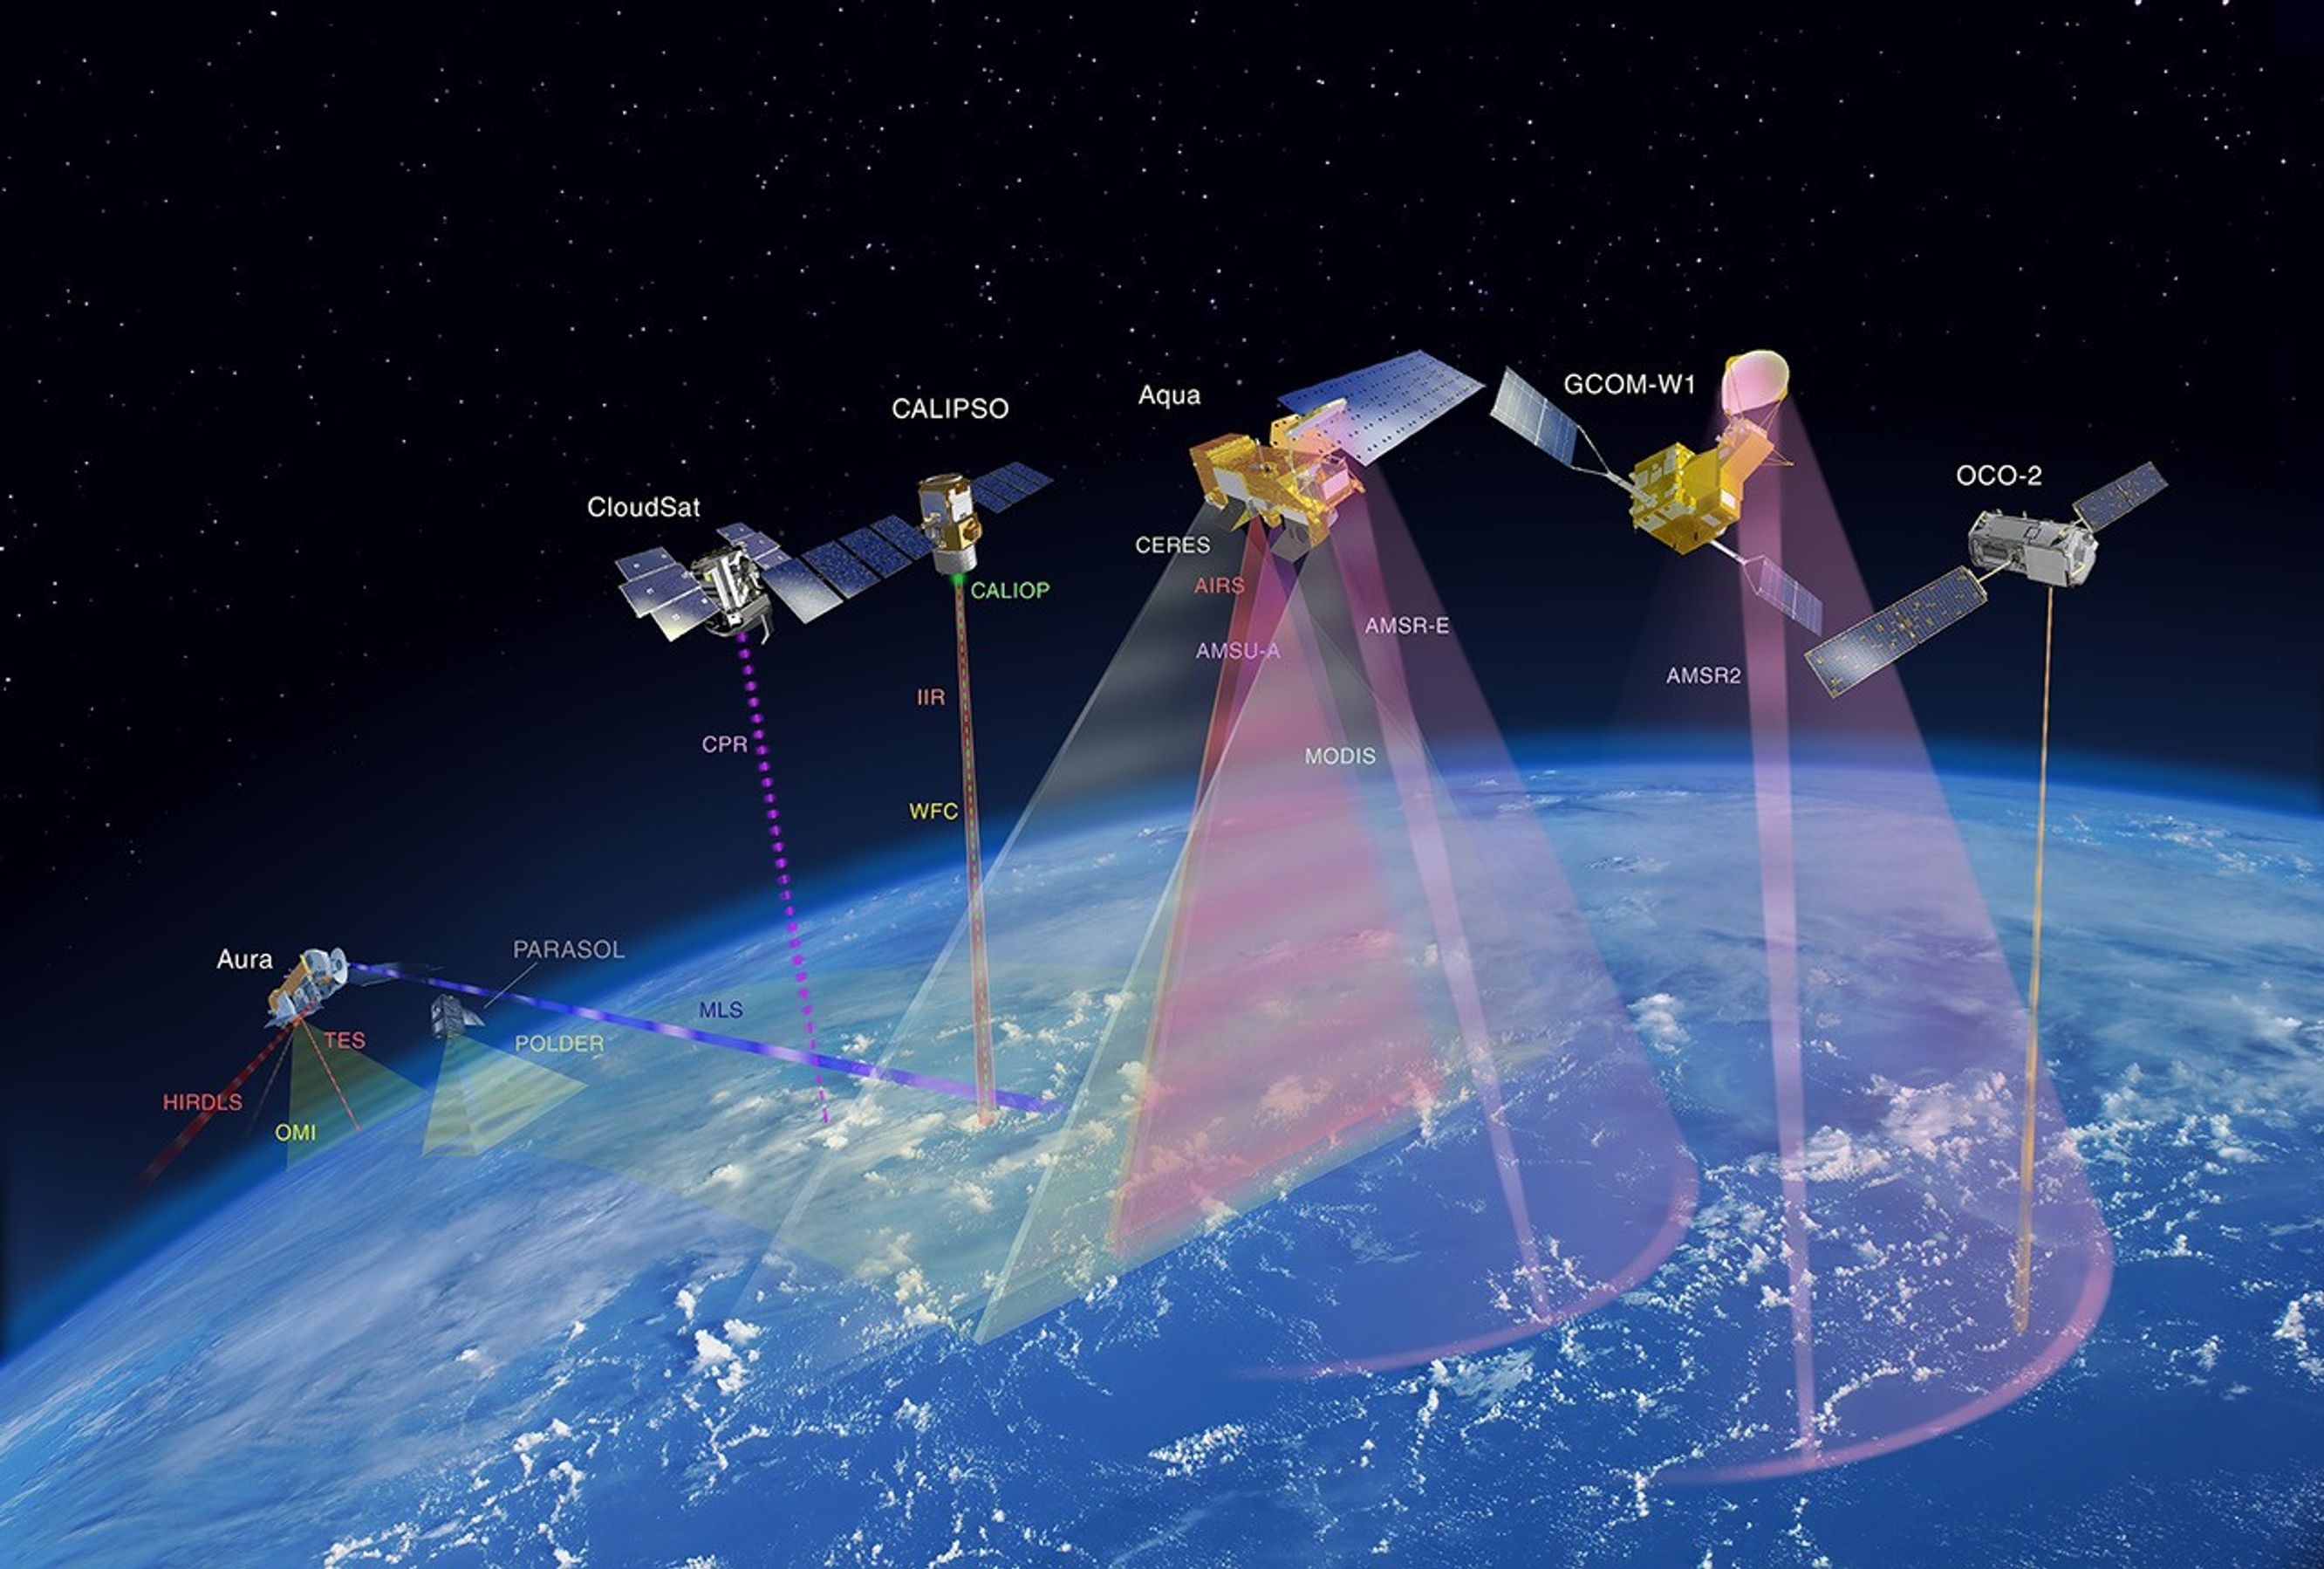
Science from the EOS Fleet
The next several sections provide a highlight of science from key missions outside of Terra, Aqua, and Aura. The content has been organized in terms of measurements – with an overarching focus on water (oceans and fresh water), atmosphere, and land. This summary is far from exhaustive. A record of much of the amazing science conducted during these missions is detailed in the archives of The Earth Observer.
Interpreting an Ocean of Data
When viewed from space, Earth has been described as a “blue marble.” The planet’s abundance of liquid water is found in the oceans, and while not potable, the oceans play a critical role in regulating Earth’s climate. Satellites provide an unparalleled way to study the global ocean. With each new mission, the process of data collection has been refined and improved. The scientific community can now measure ocean color as a proxy for surface productivity as well as measure subtle changes in surface ocean salinity. These data have improved weather and climate models to increase the accuracy of storm projection and help the scientific community better understand the movement of energy around the planet.
Aqua was the flagship mission dedicated to studying water on Earth, but other missions have contributed and expanded on this data record. For example, Japan’s GCOM-W1 mission, also known as SHIZUKU (Japanese for droplet), continues to gather information on precipitation, water vapor, wind velocity above the ocean, sea water temperature, water levels on land, and snow depths. These data support weather models to improve forecasts to monitor tropical cyclones. The subsections that follow provide examples of how data from these satellites support different science objectives, as well as examples of the science deciphered by both flagship and ancillary platforms within the A-Train. All of these missions and science have been covered in The Earth Observer over the past several decades.
Discerning the Ocean’s True Colors
Ocean color data are crucial for studying the primary productivity and biogeochemistry of the oceans. The Coastal Zone Color Scanner (CZCS), launched on the Nimbus 7 satellite in 1978 and ceasing operations in 1986 – gave the earliest perspective of the oceans from space. SeaWiFS, which served as a follow-on to CZCS, was launched on the privately owned Seastar spacecraft on Aug. 1, 1997 to produce ocean color data and offered a synoptic look at the global biosphere. This mission was a data-buy, where NASA purchased the data from Orbital Imaging Corporation. An article in The Earth Observer, titled Sea-viewing Wide Field-of-view Sensor [March–April 1998, 10:2, 20–22] detailed how the satellite gathered chlorophyll-a data that was calibrated to field measurements from a Marine Optical Buoy. The research community have used this information to understand primary productivity in the surface ocean and global biogeochemistry. This data offered an early assessment of the role of the ocean in the global carbon cycle. It also produced one of the first global perspectives of the impact of El Niño and La Nina events around the world. Coastal and fishery managers have used this data to improve the health of these important ecosystems. Launched for a five-year mission, SeaWiFs gathered data until December 2010.
More recently, NASA launched the Plankton, Aerosol, Cloud ocean Ecosystem (PACE) satellite in February 2024 to gather data on ocean and terrestrial ecosystem productivity – see Figure 6. While other missions studied ocean color in the interim between SeaWiFS and PACE (e.g., MODIS on Terra and Aqua), PACE offers an exponential leap forward with its three-instrument payload that includes: the Ocean Color Instrument (OCI), Hyper-Angular Rainbow Polarimeter–2 (HARP2), and Spectropolarimeter for Planetary Exploration (SPEXone). The PACE mission aims to clarify how the ocean and atmosphere exchange CO2, a key factor in understanding the evolution of Earth’s climate system. The satellite also examines the role of aerosols in providing micronutrients that fuel phytoplankton growth in the surface ocean. The data gathered extends the aerosol and ocean biological, ecological, and biogeochemical records that were initiated by other satellites. The Dec. 29, 2025 article, Keeping Up with PACE: Summary of the 2025 PAC3 Meeting, reports on three recent meetings related to the mission.
Figure 6. An artistic rendering of the Plankton, Aerosol, Cloud ocean Ecosystem (PACE) observatory and the instrument panels that it carries. PACE focuses on clarifying how the ocean and atmosphere exchange carbon dioxide. Figure credit: NASA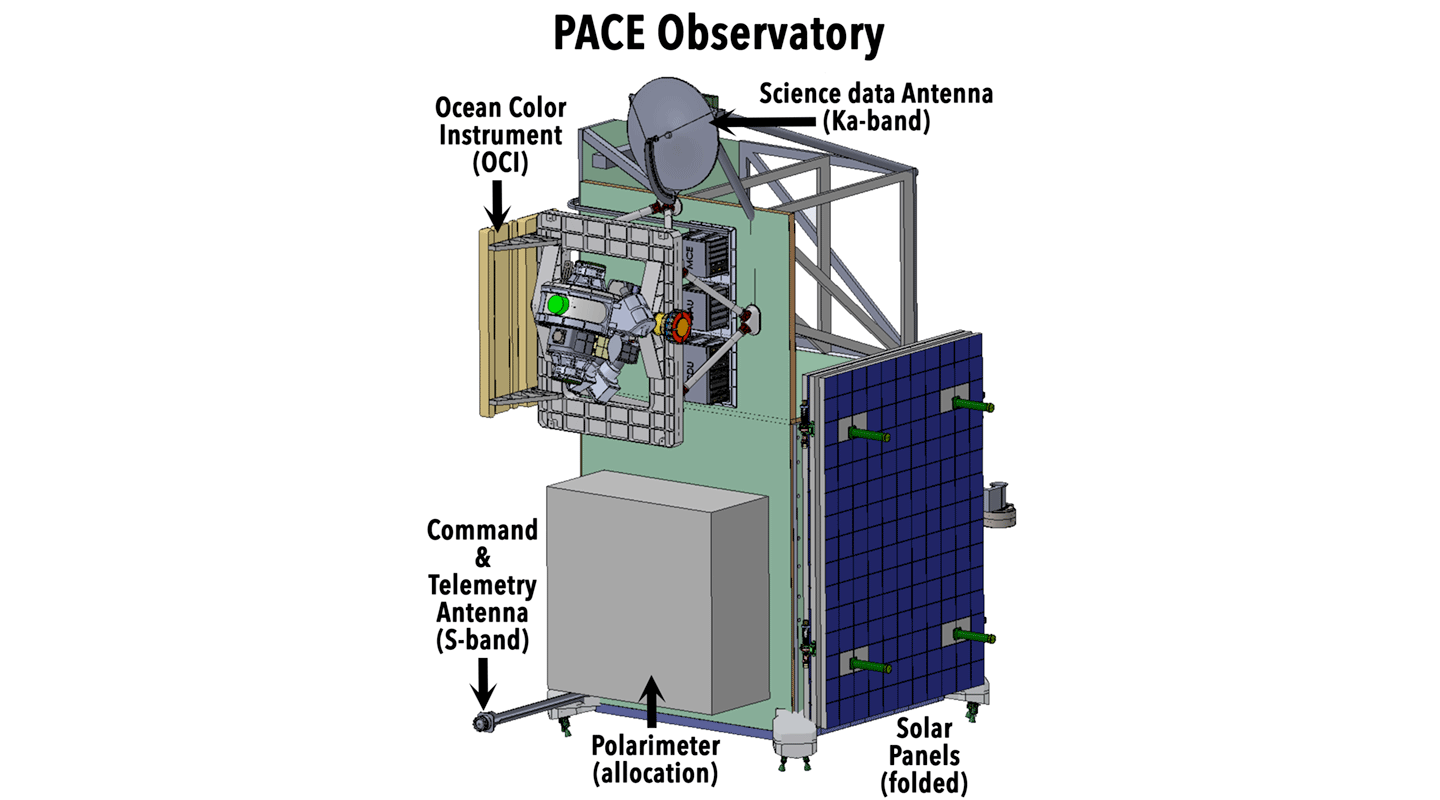
Mapping the Ocean Surface to Reveal the Rising Seas
The Ocean Surface Topography (TOPEX)/Poseidon mission, launched on Aug. 10, 1992, was the first in a series of missions that have measured ocean surface topography, or the variations in sea surface height. This record now extends more than 30 years. TOPEX/Poseidon spent more than 13 years in orbit. The data gathered helped to improve the scientific community’s understanding of ocean circulation and its impact on global climate – including sea level rise. TOPEX/Poseidon produced the first global views of seasonal current changes, which allowed scientists to forecast and better understand El Niño events. These early efforts to distribute data were captured in The Earth Observer article, Jet Propulsion Laboratory DAAC Begins TOPEX Data Distribution [March–April 1993, 6:2, 24].
Jason followed TOPEX/Poseidon to continue the measure of sea level as well as wind speed and wave height for more than 95% of Earth’s ice-free ocean – see Figure 7. Jason consists of a series of satellites, with Jason-1, launched in 2001, remaining in orbit for 11 years. It was followed by Jason-2, also called the Ocean Surface Topography Mission (OSTM), which was launched in 2008. Jason-2 gathered data for 11 years. Jason-3 launched in January 2016 and remains in orbit, continuing the sea level dataset. The Earth Observer has reported on meetings of the Ocean Surface Topography Science Team over the years. The online article, Summary of the 2023 Ocean Surface Topography Team Meeting, was published May 31, 2024 and includes the most recent updates available.
Figure 7. Beginning with TOPEX/Poseidon in 1992, a series of ocean surface topography missions have maintained a continuous record of global sea surface height data with the best possible accuracy along the same exact ground track. Dubbed the “reference” altimetry missions, shown here are TOPEX/Poseidon, Jason-1, and the Ocean Surface Topography Mission/Jason-2 (OSTM/Jason-2) in the tandem orbit pattern. This is used to cross-calibrate each mission to the next. By flying in formation, just one minute apart for a period of several months, scientists can be sure that each successive mission is exactly calibrated to its predecessor. Connecting each record to the next, these reference missions have built a record of sea level that stretches more than 30 years with centimeter level accuracy for every corner of the ocean. The reference mission has now been taken over by, Sentinel 6 Michael Freilich, which will hand the baton to the recently launched Sentinel 6B sometime in 2026. Figure credit: NASA/JPL/CNES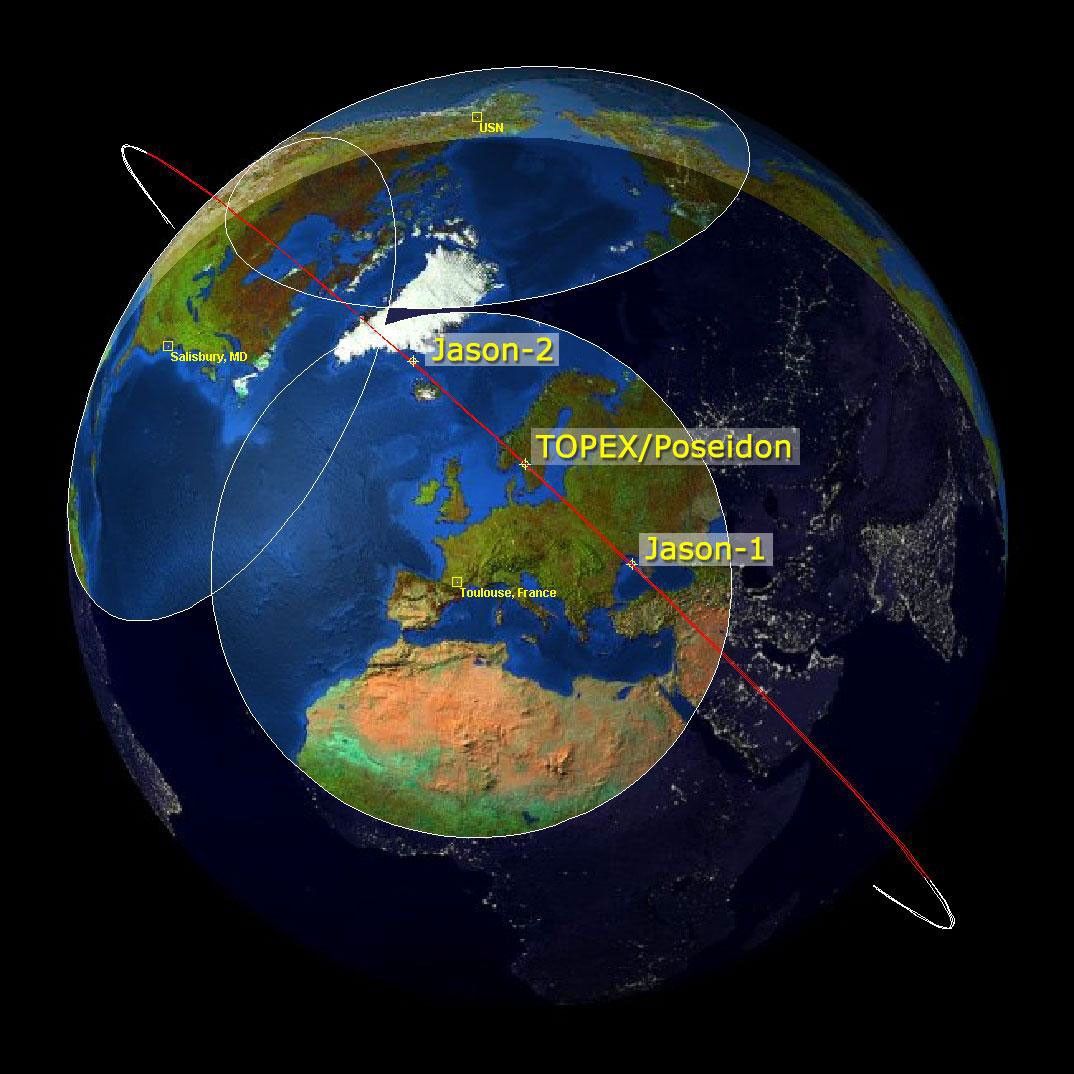
The international partnership between the United States [NASA and the National Oceanic and Atmospheric Administration (NOAA)], the European Space Agency (ESA), and the French Space Agency [Centre National d’Études Spatiales (CNES)] collaborate to create the ESA’s Copernicus Sentinel–6 missions. The Sentinel-6B, launched Nov. 16, 2025, will follow the path of the Sentinel-6 Michael Freilich (originally called Sentinel–6A) satellite, which has been in orbit for five years – see Figure 8. These two Sentinel 6 missions continue the global measurements of sea level, wind speed, wave height, and atmospheric temperature. The data will be used in marine weather forecasts as well as to improve commercial and naval navigation, search and rescue missions, and tracking garbage and pollutants in the ocean. To learn more about Sentinel-6B, see the online article, Sentinel-6B Extends Global Ocean Height Record, published Dec. 22, 2025.
While the Surface Water and Ocean Topography (SWOT) mission is fully described in the next section – with emphasis placed on its novel surface water observation capabilities – it should be noted that SWOT is also an ocean topography mission that obtains data similar to TOPEX/Poseidon, Jason, and Sentinel-6 missions. These data will contribute to the long-term time series of the sea surface height record.
Figure 8. Sentinel-6B, an Earth-observing satellite jointly developed by NASA and U.S. and European partners, will observe the ocean and measure sea level rise to provide insights into our home planet that will improve weather forecasts and flood predictions, increase public safety, and protect coastal infrastructure. The Sentinel missions are part of the European Space Agency’s Copernicus Programme. Figure credit: NASA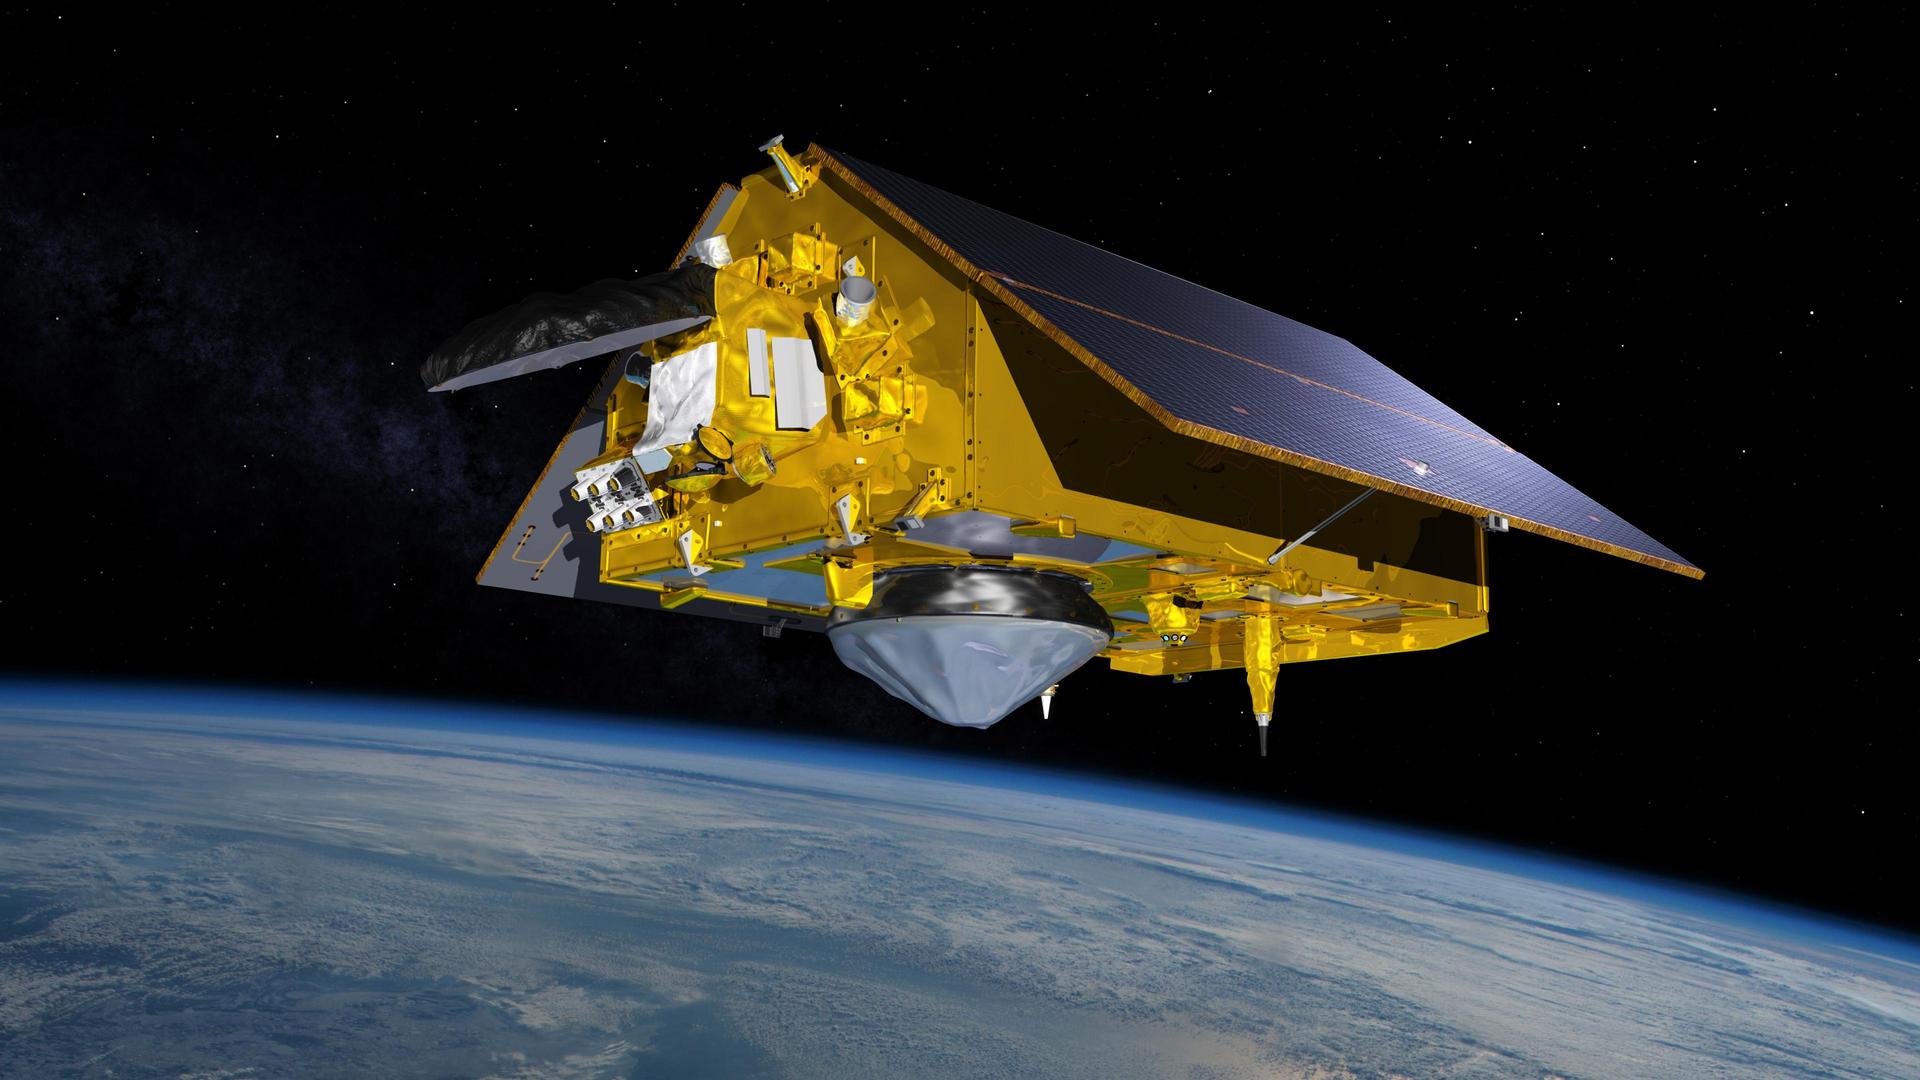
Sampling the Salty Seas
Launched June 2011, Aquarius was an international collaboration between NASA and Argentina’s Comisión Nacional de Actividades Espaciales (CONAE). The cooperative effort was detailed in the article, Aquarius: A Brief (Recent) History of an International Effort [July–Aug. 2010, 22:4, 4–5]. The satellite carried a microwave radiometer that was sensitive enough to measure salinity to an accuracy of 0.2 practical salinity units (psu) on a monthly basis. It also carried a scatterometer to measure surface ocean roughness. Pairing data from the two instruments allowed the team to overcome the challenges of measuring salinity from space. This feat is detailed in the article, For Aquarius, Sampling Seas No ‘Grain of Salt’ Task [July–Aug. 2011, 23:4, 42–43]. The more accurate, global measurements of ocean salinity that Aquarius obtained have helped the research community better understand ocean circulation. The mission ended in 2015, after the satellite experienced a power failure.
Focusing on Freshwater
While most water on the planet is housed in the ocean, fresh water is a primary concern for life on the planet. Fresh water accounts for ~3% of the total amount water on the planet. Of that small amount, a significant portion is locked in ice on land and as sea ice. The remaining water flows on Earth’s surface and underground. Maintaining a supply of fresh water is critically important to our survival. The location, status, and purity of this precious resource continues to be an on-going focus for many of the missions.
Monitoring Rain and Snow
The joint NASA/National Space Development Agency of Japan (NASDA – which is now known as the Japan Aerospace Exploration Agency, or JAXA) Tropical Rainfall Measuring Mission (TRMM) carried a Microwave Imager, Visible Infrared Scanner, and Precipitation Radar to gather tropical and subtropical rainfall observations (and two related instruments) – see Figure 9. These data filled a critical knowledge gap – to understand the interactions between the sea, air, and land. Over the years, these data were incorporated into numerous computer models to clarify the role of tropical rainfall on global circulation and formed the basis for experimental quasi-global merged satellite precipitation products. The Earth Observer detailed the early data collection in the article titled TRMMing the Uncertainties: Preliminary Data from the Tropical Rainfall Measuring Mission [May–June 1998, 10:3, 48–50]. The mission was extended twice but eventually the satellite’s maneuvering fuel was exhausted, resulting in a slow decline in the orbital altitude beginning in 2014, with reentry in 2015. Data from TRMM have improved understanding of storm structure of cloud systems, produced reliable global latent heating estimates to improve water transfer estimates within the atmosphere, and continue to be used in calibrating modern precipitation products for the TRMM era.
Figure 9. Artistic rendering of the Tropical Rainfall Measuring Mission (TRMM) in space over a hurricane. TRMM was launched in 1997 and remained in operation until 2015. The satellite was designed to improve our understanding of the distribution and variability of precipitation within the tropics as part of the water cycle in the current climate system. Figure credit: NASA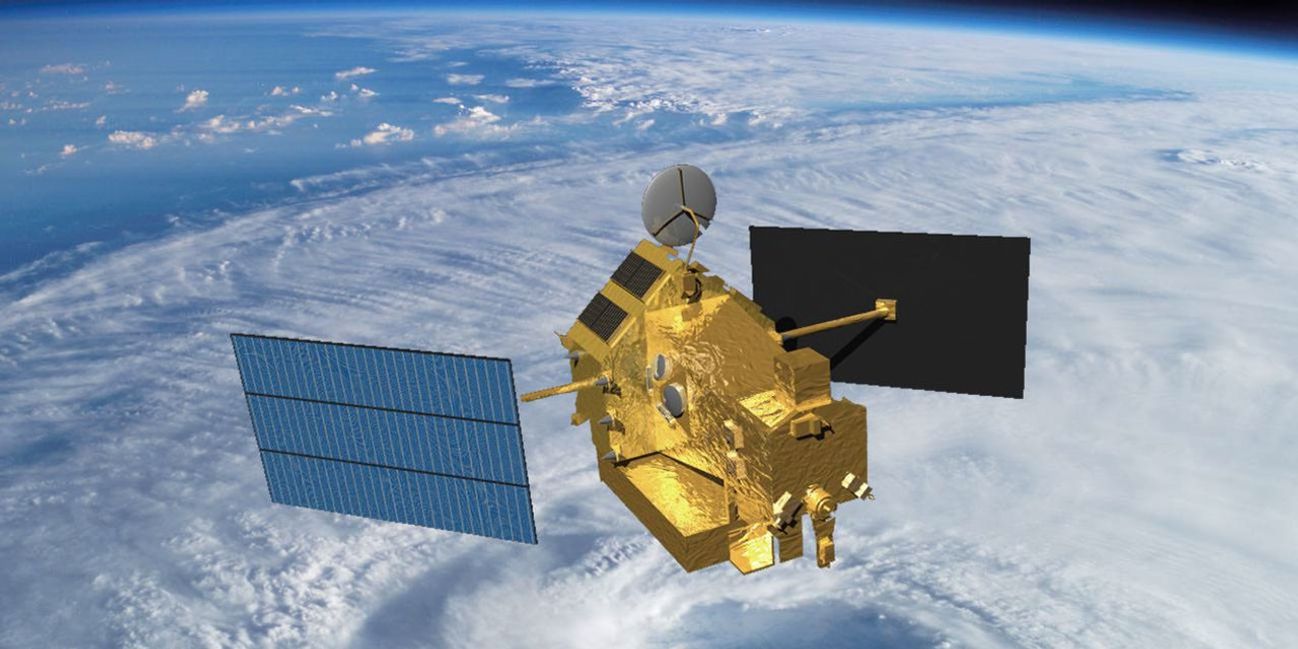
To continue the efforts that began with TRMM – and extend coverage to most of the globe – NASA and JAXA launched the Global Precipitation Measurement (GPM) mission in 2014. This satellite aims to advance our understanding of water and energy cycles, improve forecasting of extreme weather events, and extend current capabilities to use accurate and timely information of precipitation to directly benefit society. The Earth Observer detailed the accomplishments of this mission in the online article, GPM Celebrates Ten Years of Observing Precipitation for Science and Society, published Oct. 3, 2024.
Surveying Earth’s Surface Water
Introduced briefly in the previous section, the SWOT mission is a joint venture between the United States and France. Launched in December 2022, SWOT is conducting the first global survey of Earth’s surface water – see Photo. The mission was introduced to the EOS community in The Earth Observer article, Summary of the 2022 Ocean Surface Topography Science Team Meeting [May–June 2023, 35:3, 19–23]. SWOT carries the Ka-band Radar Interferometer (KaRIN) – the first spaceborne, wide-swath, altimetry instrument capable of high-resolution measurements of sea surface height in the ocean and freshwater bodies. SWOT covers most of the world’s ocean and freshwater bodies with repeated high-resolution elevation measurements. This data have been applied to monitor rivers across the Amazon basin, simulate land/hydrology processes, and predict streamflow. A more comprehensive overview of SWOT applications is detailed in online article, Summary of the 10th SWOT Applications Workshop, published Sept. 20, 2024.
Photo 1. Workers in a clean room in Cannes, France, load the Surface Water and Ocean Topography (SWOT) satellite into a container in preparation for shipping the spacecraft to the United States. SWOT provides the first global survey of Earth’s surface water. Photo credit: Centre National d’Études Spatiales (CNES), Thales Alenia Space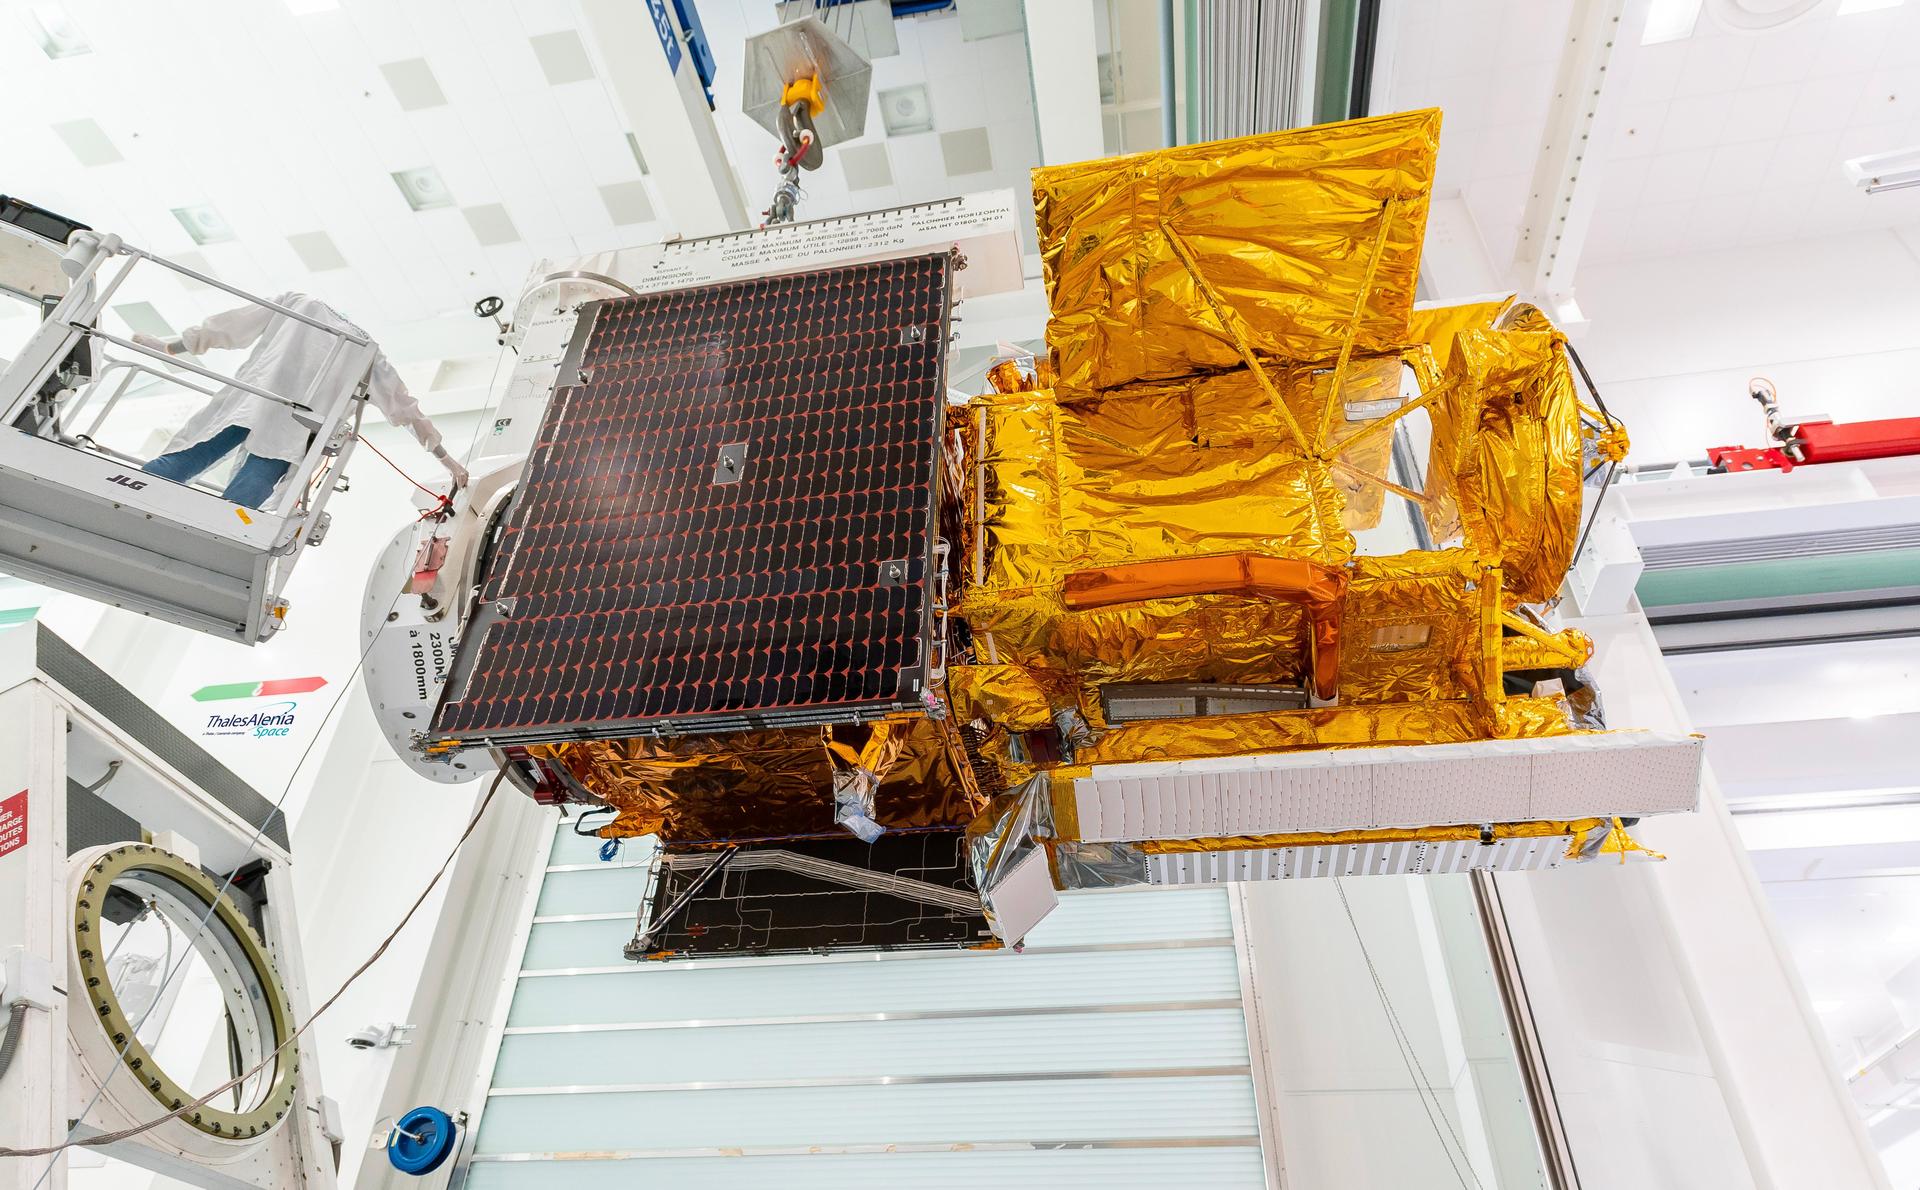
Gracefully Tracking Water Movement
The twin GRACE satellites were launched on March 17, 2002. The mission, a partnership between NASA and the German GeoForschungsZentrum (GFZ) Helmholtz Centre for Geosciences was developed to measure Earth’s shifting masses – most of which comes from water – and map the planet’s gravitational field using a K-band microwave ranging system and accelerometers. Some early results of the satellites appeared in The Editor’s Corner column [Nov.–Dec. 2002, 14:6, 1–2]. GRACE enabled groundbreaking insights into Earth’s evolving water cycle as the satellites tracked monthly mass variations in ice sheets and glaciers, near-surface and underground water storage, the amount of water in large lakes and rivers, as well as changes in sea level and ocean currents.
GRACE’s mission was extended with the GRACE-Follow On (GRACE-FO) mission launched in 2018 – see Figure 10. GRACE-FO continues comprehensive tracking water movement across the planet, including groundwater measurements that have important applications for everyday life. The most recent developments of the GRACE-FO science meeting was detailed in an online article, Summary of the 2023 GRACE Follow-On Science Team Meeting, published March 30, 2024 – and also published in the final print issue [Jan.–Feb. 2024, 35:7, 19–26]. The data gathered during the GRACE-FO mission details large-scale changes in Earth’s groundwater reservoirs, Greenland and Antarctica’s sensitivity to warming ocean waters, and even subtle shifts deep in Earth’s interior that reveal how large earthquakes can develop.
In 2028, NASA will move into a third-generation of gravity observations with the launch of GRACE-Continuity, or GRACE-C, which will further expand the foundational observations of global mass change and expand the societal and economic applications that have been created from these data.
Figure 10. An artistic rendering of the twin Gravity Recovery and Climate Experiment-Follow-On (GRACE-FO) satellites that, like the original GRACE twins, follow each other in orbit, separated by about 137 miles (220 km). GRACE tracks water movement across the planet’s surface. Figure credit: NASA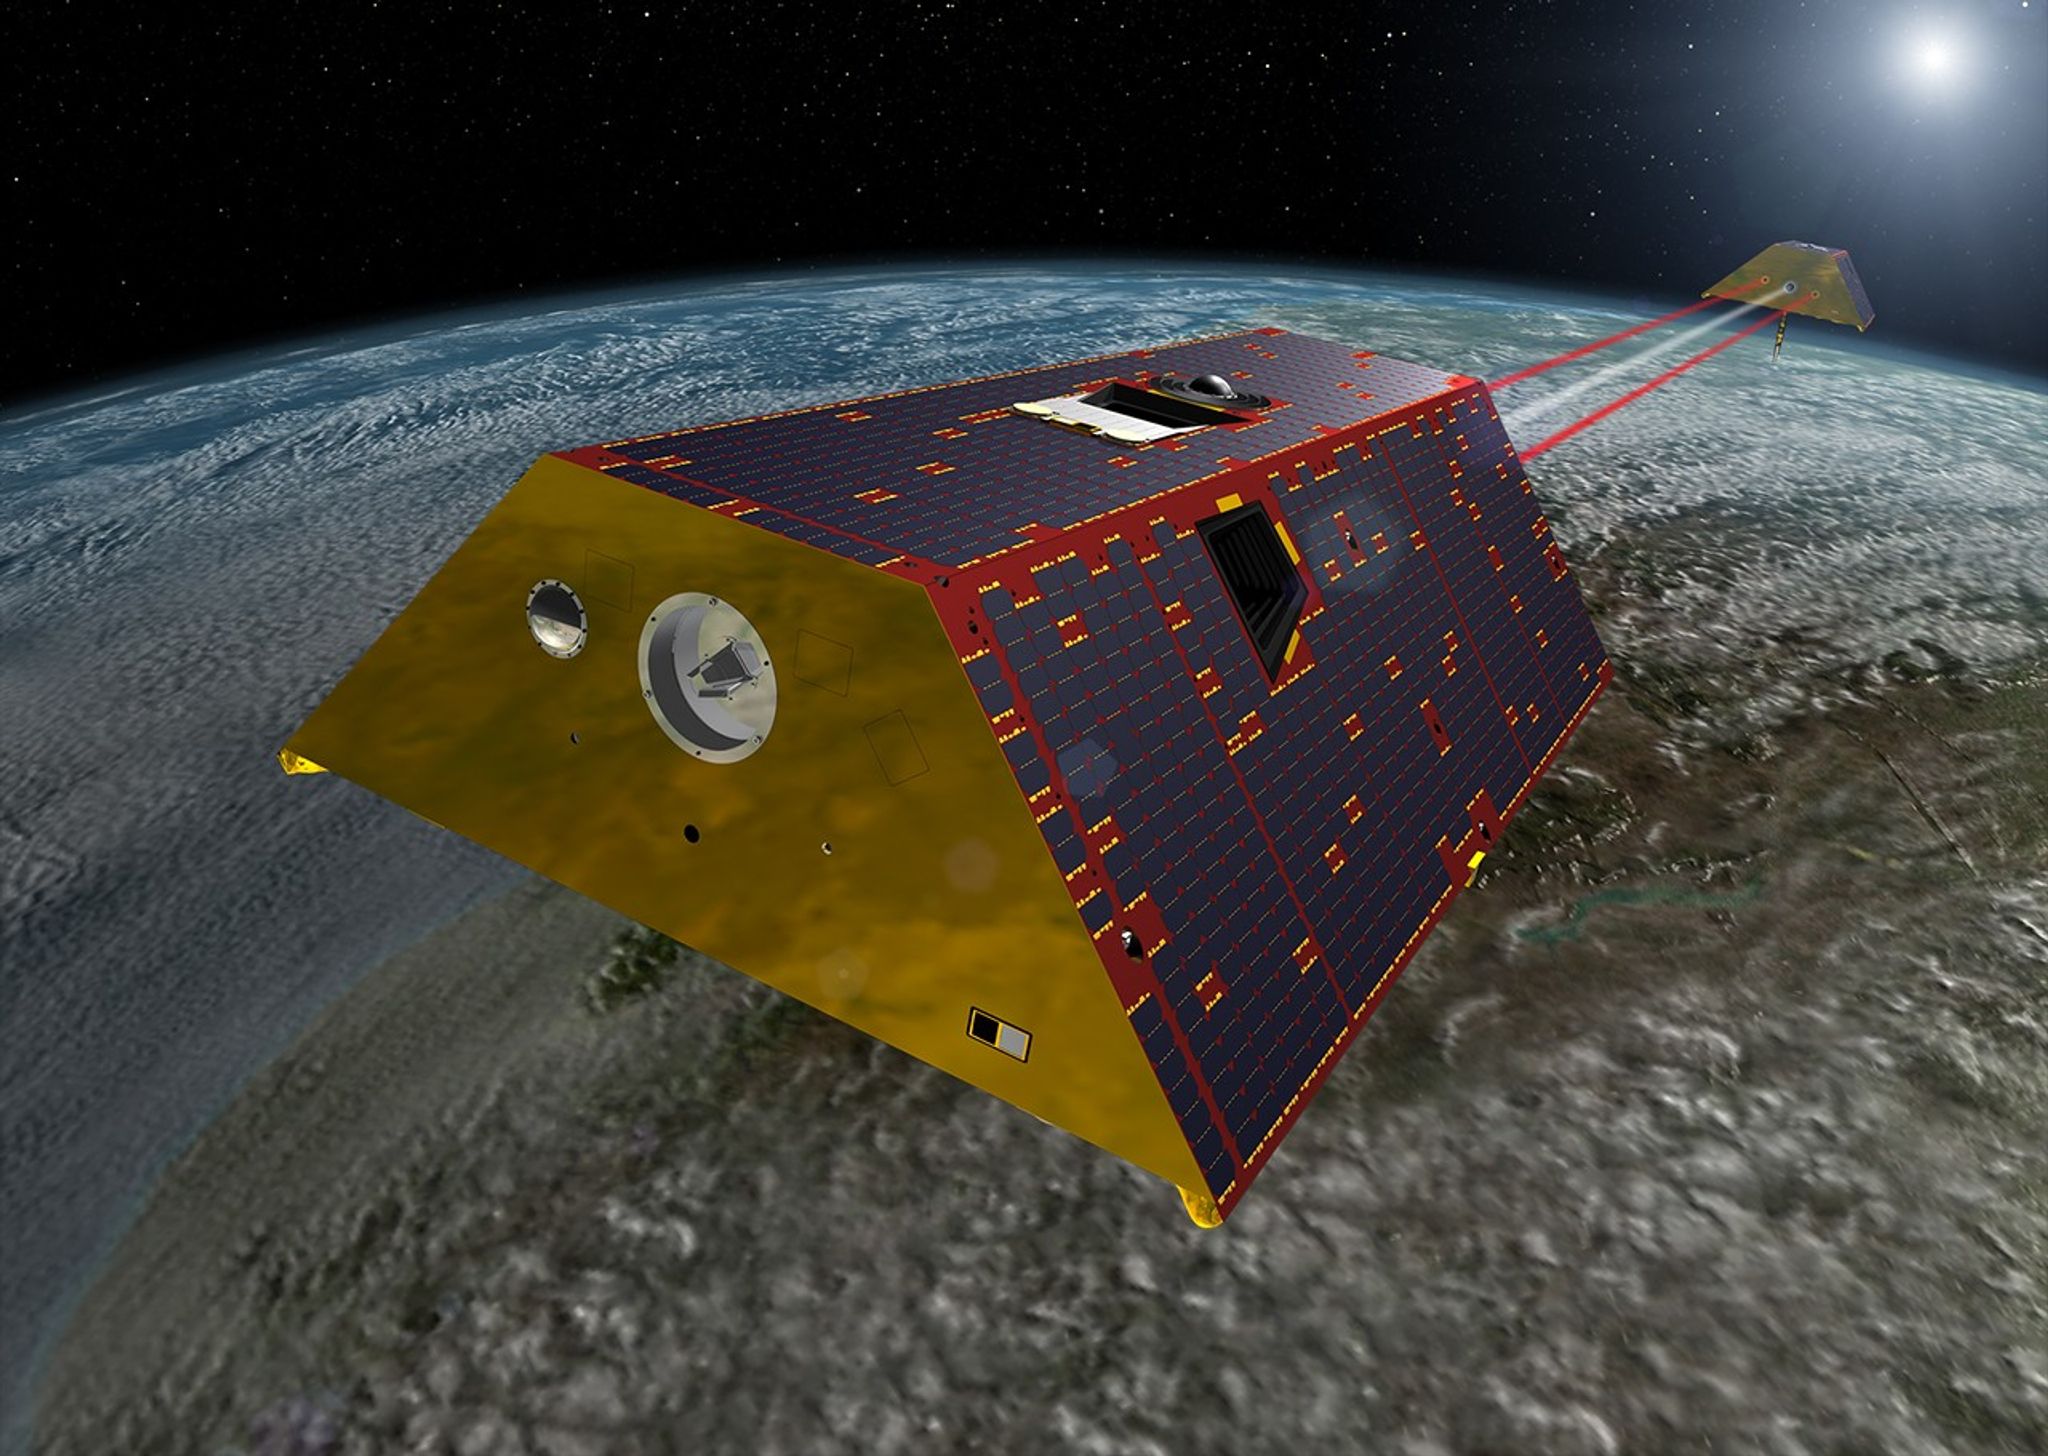
Assessing the Atmosphere from Above
Earth has a unique atmospheric makeup that maintains a stable temperature allowing life to thrive. As far as we know, our atmosphere is unique in the universe. Satellites provide an unparalleled perspective to study variability in the column of air extending from Earth’s surface. While Aura has a suite of instruments making a wide range of atmospheric chemistry measurements, other missions also measure the abundance and impact of atmospheric constituents that, while often invisible to the unaided eye, can have profound impacts on Earth’s air quality and climate. These data have also improved climate models and help the scientific community better understand how energy is emitted into space.
Tracking Tiny Particles with Big Impacts
France’s PARASOL mission was an original member of the international A-Train constellation. Launched in 2004. PARASOL sought to capture the radiative and microphysical properties of clouds and tiny atmospheric aerosol particles using a unique multiangle imaging POLDER polarimeter.
NASA’s Glory mission was intended for operation in the A-Train; it carried a multiangle polarimeter as its instrument. Unfortunately, the spacecraft failed to separate from the Taurus rocket due to a fairing separation failure during its launch in 2011. As a result, POLDER on PARASOL was the only atmospheric polarimeter to fly in space until two (SPEXone and HARP2) launched as part of NASA’s PACE mission. Researchers gathered information from POLDER and other A-Train instruments about how aerosols affect the formation of precipitations and clouds, the movement of water around the planet, and the reflection and absorption of radiative energy that impact overall planetary climate. PARASOL was deactivated in 2013 after nine years in service.
Cloud particles form when water vapor nucleates onto aerosols; changes in one can impact the other. After many years and conversations, it was decided to pair two NASA Earth System Science Pathfinder (ESSP) missions – CloudSat and CALIPSO – and fly them in coordination with each other and with other A-Train satellites. By combining the two datasets, it was possible to explore cloud and aerosol processes. This information helped the community drill into the larger climate questions. The two satellites were launched on the same Delta-II rocket from Vandenberg Air Force Base in California on April 28, 2006. CloudSat used a 94 GHz cloud profiling radar that is 1000 times more sensitive than a typical weather radar, capable of distinguishing between cloud particles and precipitation. CALIPSO contained a Cloud-Aerosol Lidar with Orthogonal Polarization (CALIOP), Wide-Field Camera, and Imaging Infrared Radiometer to detect and distinguish between aerosol particles and cloud particles.
The Earth Observer captured the early data collection of the two satellites in the article, CloudSat and CALIPSO: A Long Journey to Launch…But What a Year It’s Been!! [May–June 2007, 19:3, 7–12]. The later article, A Useful Pursuit of Shadows: CloudSat and CALIPSO Celebrate Ten Years of Observing Clouds and Aerosols [July–Aug. 2016, 28:4, 4–12] provided a review of the accomplishments of the missions after 10 years in orbit. CALIPSO and CloudSat were both deactivated in 2023 after 17 years of service.
An Oracle of High-Altitude Wisdom
The Stratospheric Aerosol and Gas Experiment (SAGE) has experienced several iterations, extending back nearly half a century. The initial SAGE mission launched on Feb. 18, 1979, aboard the Applications Explorer Mission-B (AEM-B) to measure vertical distribution of aerosols and important gases in the upper troposphere and stratosphere (UTS). The satellite failed after three years in orbit. In 1984, SAGE II began collecting data on stratospheric O3, producing a stable record of this important greenhouse gas from 1984–2005. SAGE III was launched on Метеор-3М (SAGE III/M3M). The third-generation satellite produced an accurate measurement of the vertical structure of aerosols, O3, water vapor, and other important trace gases in the upper troposphere and stratosphere. The satellite was terminated on March 6, 2006, following a power supply system failure, resulting in loss of communication with the satellite.
Another version of SAGE III was launched to the International Space Station (ISS) on Feb. 19, 2017, where it was installed on the EXpedite the PRocessing of Experiments to Space Station (ExPRESS) Logistics Carrier [ELC-4] – an unpressurized attached payload platform for ISS. SAGE III/ISS, which is shown mounted on ELC-4 in Figure 11, has completed its prime mission after three years of operation. NASA granted approval to extend the SAGE III/ISS mission through at least 2026 – meaning the instrument will continue to provide the public and science community with world-class vertical profiles of O3, aerosol, water vapor, and other trace gases, e.g., nitrogen dioxide (NO2) and nitrate (NO3), data products for at least another year. An article titled, Summary of the 2024 SAGE III/ISS Meeting, published May 26, 2025, details the latest findings from SAGE.
Figure 11. An artistic rendering of the Stratospheric Aerosol and Gas Experiment-III (SAGE-III), which is externally mounted on the International Space Station’s Japanese Experiment Module–Exposed Facility (JEM-EF) EXPRESS Logistics Carrier (ELC)-4. SAGE III/ISS measures the vertical structure of aerosols, ozone (O3), water vapor, and other important trace gasses in the upper troposphere and stratosphere. Figure credit: NASA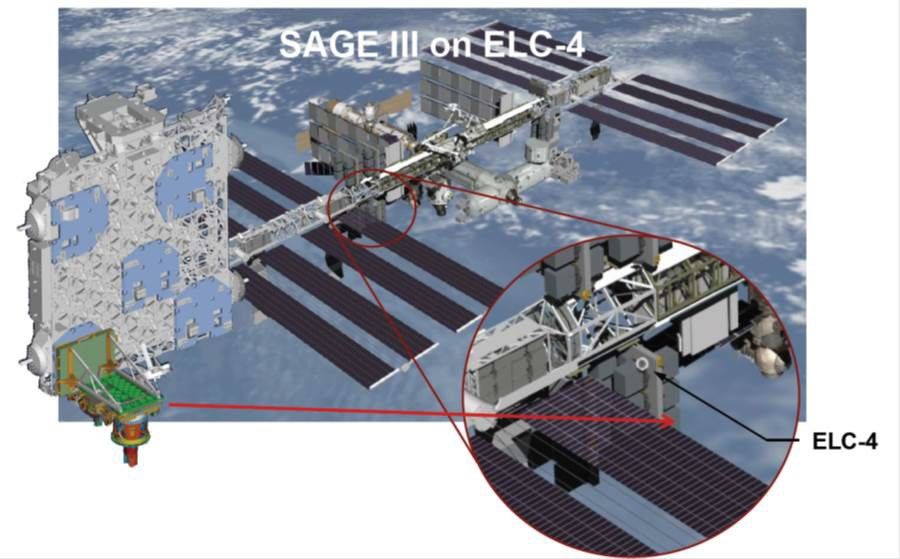
Watching Earth Exhale
The Orbiting Carbon Observatory (OCO) was launched into space in February 2009, but it failed to separate from the Taurus rocket during its ascent, leading to mission failure and loss of the satellite. Undaunted, the EOS community began again and assembled OCO-2, which was successfully launched into orbit, joining the A-Train on July 2, 2014 – see Figure 12. The satellite’s mission focused on making precise, high-resolution measurements of atmospheric CO2. OCO-2 measures reflected sunlight that interacts with the atmosphere. Using diffraction gratings to separate the reflected sunlight into spectra, OCO-2 measures the absorption levels for the different molecular bands to calculate CO2 concentration. This information is invaluable for the quantification of CO2 emissions and can characterize both sources and sinks of this critical greenhouse gas. The mission was detailed in an article, titled Orbiting Carbon Observatory-2: Observing CO2 from Space [July–Aug. 2014, 26:4, 4–12].
On May 4, 2019, NASA launched the third iteration in the OCO group to the ISS. It was subsequently installed on the Japanese Experiment Module–Exposed Facility (JEM-EF). Constructed from parts left over from OCO-2, OCO-3 continues the mission of making CO2 measurements with a focus on daily variability. In particular, the measurements explore the role of plants and trees in the major tropical rain forests of South America, Africa, and Southeast Asia. As of today, both OCO-2 and OCO–3 remain operational and gathering data.
The science team reflected on both these missions in a recent article posted in the online article, A Tapestry of Tales: 10th Anniversary Reflections from NASA’S OCO-2 Mission, published Aug. 12, 2025.
Figure 12. An artistic rendering of OCO-2 in orbit above Earth. OCO-2 measures the concentration of trace gases in the atmosphere. Figure credit: NASA/JPL-Caltech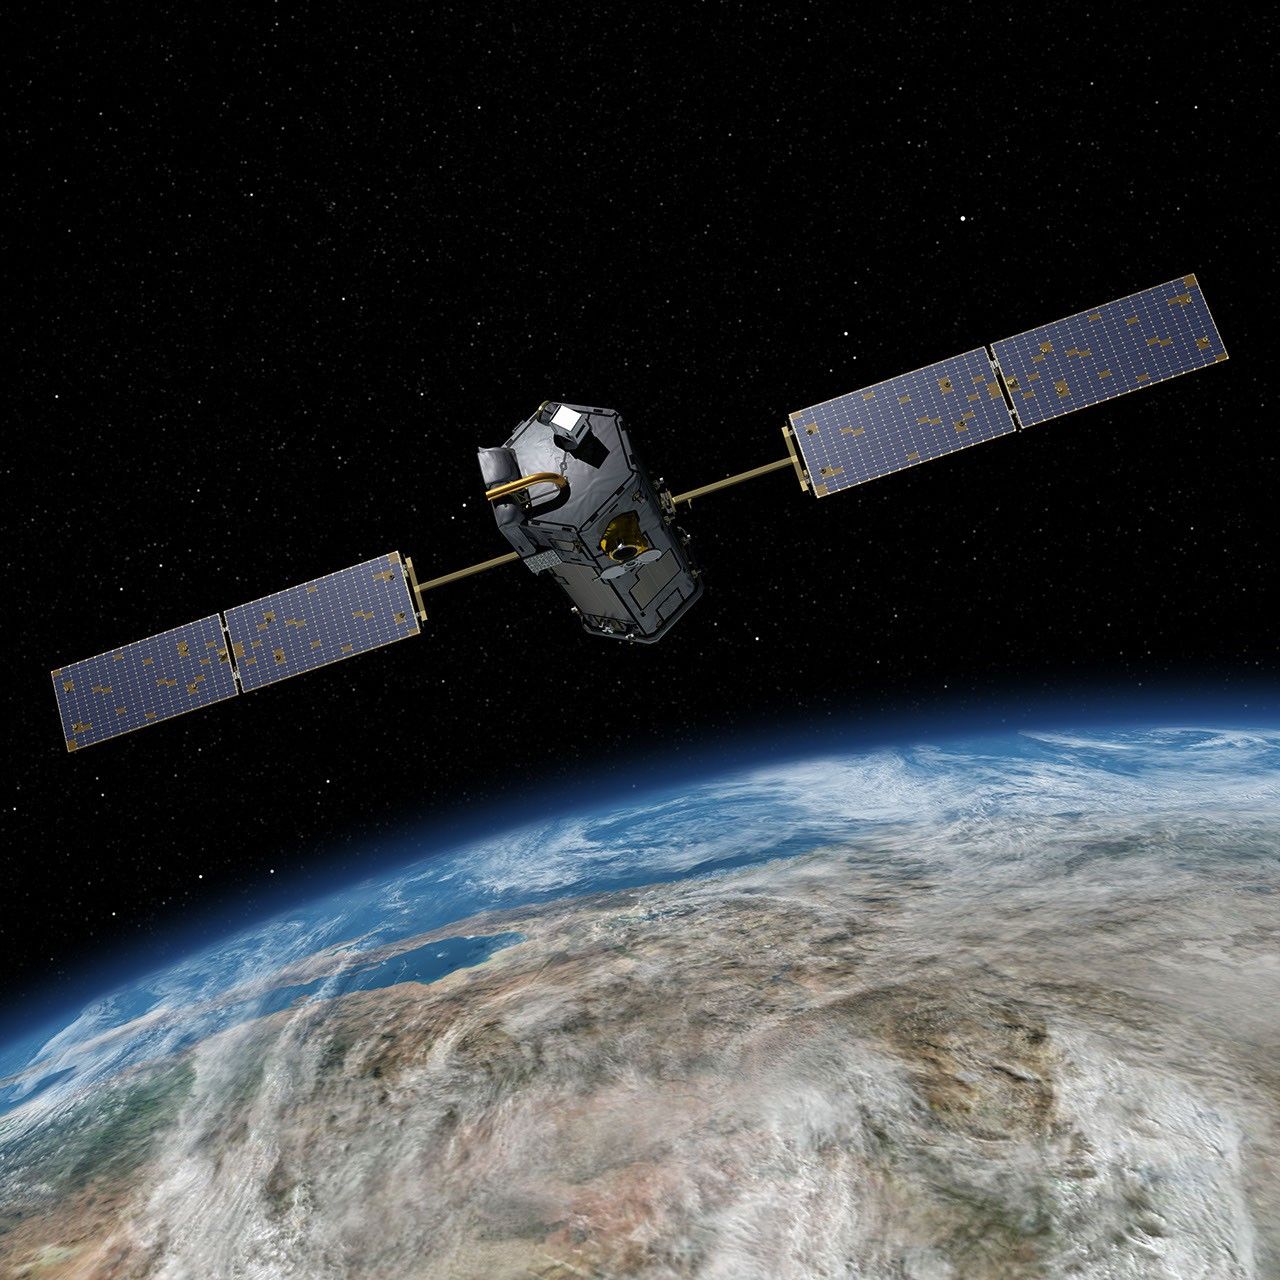
Tracking the Sun’s Output
In December 1999, NASA launched the Active Cavity Radiometer Irradiance Monitor Satellite (ACRIMSAT) satellite to extend the more than two-decade record of total solar irradiance (TSI). Scientists use this important measurement to quantify the solar energy input to the planet and thereby its interactions with Earth’s oceans, land masses, and atmosphere. It is also a critical component to understand variations of the planet’s climate. The Active Cavity Radiometer Irradiance Monitor 3 (ACRIM3) instrument onboard combined the best features of the ACRIM I (flown on the Solar Maximum Mission), ACRIM II (flown on the Upper Atmosphere Research Satellite), and SpaceLab-1 ACRIM (flown on Space Shuttle Columbia, STS 9). ACRIM3 improved on its predecessors by incorporating a new electronics and package design. The Earth Observer captured the initial information from this mission in the article, The ACRIMSAT/ACRIM3 Experiment — Extending the Precision, Long-Term Total Solar Irradiance Climate Database [May–June 2001, 13:3, 14–17]. ACRIMSAT spent 14 years in orbit and ACRIM3 extended the TSI record to 36 years (i.e., building on measurements from previous ACRIM missions).
NASA continued its quest to observe the incident solar energy budget with the launch of the Solar Radiation and Climate Experiment (SORCE) in January 2003. SORCE focused on measuring solar radiation incident to the top of the Earth’s atmosphere. The Total Irradiance Monitor (TIM) onboard continued the TSI record that the ACRIM series of satellites established. In addition to TIM, the satellite carried a Spectral Irradiance Monitor (SIM), an Extreme Ultraviolet (XUV) Photometer System [XPS], and a stellar observation from the Solar Stellar Irradiance Comparison Experiment (SOLSTICE). The satellite has produced groundbreaking TSI and spectral solar irradiance (SSI) measurements – two key inputs for atmosphere and climate modeling.
Early results from SORCE are detailed in the article, The SORCE (SOlar Radiation and Climate Experiment) Satellite Successfully Launched [Jan.–Feb. 2003, 15:1, 16–19]. The article, The SORCE Mission Celebrates 10 Years [Jan.–Feb. 2013, 25:1, 3–13] details the most significant results from a decade of SORCE observations. Designed for a five-year mission, SORCE gathered data until 2020 – although a degradation of a battery power that began in 2008 increasingly hindered data collection for the remainder of the mission. During its time in orbit, SORCE captured two of the Sun’s 11-year solar cycles and observed the solar cycle minimum in both 2008 and 2019. SORCE’s orbit will decay and re-enter Earth’s atmosphere in 2032.
To continue the crucial long-term TSI and the SSI record that SORCE originated, NASA launched the Total and Spectral Solar Irradiance Sensor (TSIS-1) to the ISS on Dec. 15, 2017, which was installed on JEM-EF ELC-3. The satellite’s mission set out to measure the total amount of sunlight that falls on the planet’s surface – see Visualization 1. This data will clarify the distribution of different wavelengths of light. TSIS-1 was introduced in The Earth Observer article, Summary of the 2018 Sun–Climate Symposium [May–June 2018, 30:3, 21–27]. Similar to SORCE, TSIS-1 carries a TIM and SIM. The instrument extends the multidecadal SSI record and provides highly accurate, stable, and continuous observations that are critical to understanding the present climate conditions and predicting future conditions. The most recent efforts from this mission were detailed in the online article, Summary of the 2023 Sun–Climate Symposium, published July 18, 2024. TSIS-1 has been extended by at least three more years as part of the Earth Sciences Senior Review process. A follow-on mission, TSIS-2, is under development to extend the long-term observational record through continued TSI and SSI measurements.
Visualization 1. NASA’s Total and Spectral solar Irradiance Sensor (TSIS-1) measures the total amount of solar energy input to Earth as well as the distribution of the Sun’s energy across a wide range of wavelengths. The animation illustrates the various wavelengths of light that are partially reflected into space at different places in the column of atmosphere above the ground.Visualization credit: NASA
Chronicling the Changing Land Surface
Along with Terra, other satellites also provide global estimates about the land. Each new mission provides the scientific community more information to refine these measurements. These data have improved climate models as well as improved our understanding of how the planet’s interior is altering the surface of the planet.
Measuring Ice and Vegetation Heights
NASA launched ICESat in 2003 on a three-to-five-year mission to provide information on ice sheet mass balance and cloud properties. It carried the Geoscience Laser Altimeter System (GLAS), which combines a precision surface lidar with a sensitive dual-wavelength cloud and aerosol lidar. ICESat was decommissioned seven years after launch. The science team began efforts for the follow-on mission, ICESat-2, which launched on Sept. 15, 2018 – see Figure 13. Data collected during a series of Operation IceBridge field campaigns to the Arctic and Antarctic helped to fill the data gap between the two satellite missions – allowing for continuity of measurements. ICESat-2 carries a payload of a photon-counting laser altimeter on its three-year mission. The laser is split into six beams capable of measuring the elevation of the cryosphere, including ice sheets, glaciers, and sea ice, down to a fraction of an inch. The laser altimeter also gathers the height of ocean and land surfaces, including forests, snow, lakes, rivers, ocean waves, and urban areas. The mission objective includes quantifying polar ice sheet contribution to sea-level change, estimating sea-ice thickness, and measuring vegetation canopy height. The mission was detailed in The Earth Observer article, ICESat-2: Measuring the Height of Ice from Space [Sept.–Oct.. 2018, 30:5, 4–10]. The research community has been using this information to investigate how the ice sheets of Antarctica and Greenland are changing as the planet warms.
Figure 13. Illustration of the Ice, Cloud, and land Elevation Satellite-2 (ICESat-2) spacecraft. ICESat-2 measures the elevation of aspects of the cryosphere, including ice sheets, glaciers, and sea ice. Figure credit: NASA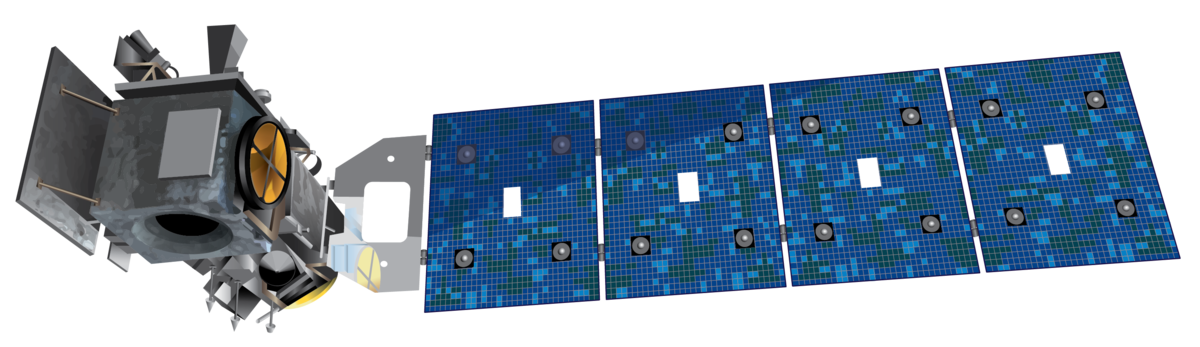
NASA’s Global Ecosystem Dynamics Investigation (GEDI – pronounced “jedi”) mission was launched to the ISS on Dec. 5, 2018 and was subsequently installed on the JEM–EF ELC-6. From that vantage point GEDI produces high-resolution laser ranging observations of the three-dimensional (3D) structure of Earth that can be used to make precise measurements of forest canopy height and canopy vertical structure – see Visualization 2. These measurements have improved understanding of important atmospheric and water cycling processes, biodiversity, and habitat. Upon completion of its prime mission, which lasted from December 2018 to March 2023, GEDI was moved from the ISS’s EFU-6 to EFU-7 (storage). Since April 2024, the GEDI instrument has been back in its original location on EFU-6 and continues to collect high-resolution observations of Earth’s 3D structure from space. The GEDI research team hopes the mission can continue collecting data until 2030.
To view this video please enable JavaScript, and consider upgrading to a web browser that
supports HTML5 video
The GEDI mission has been covered in The Earth Observer through summaries of periodic meetings of the GEDI Science Team. The online article, Summary of the 2025 GEDI Science Team Meeting, is the most recent installment of GEDI’s progress, published on Aug. 18, 2025. This article includes discussion of “the return of the GEDI” from hibernation and the science results since then.
Monitoring Earth in Intricate Detail
The Soil Moisture Active Passive (SMAP) mission was designed to measure the amount of water in surface soil across Earth. The satellite was launched from Vandenberg Air Force Base on Jan. 31, 2015. The satellite payload consisted of both an active microwave radar and a passive microwave radiometer to measure a swath of the planet 1000-km (~621-mi) wide. The radar transmitter failed just nine months after launch on July 7, 2015. Although the loss of the radar was unfortunate, the nine months where both instruments functioned provided an invaluable dataset that established the dependence of L-band radar signals on soil moisture, vegetative water content, and freeze–thaw state. Two of these variables (surface soil moisture and freeze–thaw state) are critical variables that influence the planet’s water, energy, and carbon cycles. The three variables influence weather and climate. Furthermore, the SMAP team quickly turned a setback into a success. They repurposed the channels that had been dedicated to the radar to record the reflected signals from the Global Navigation Satellite System (GNSS) constellation in August 2015, making SMAP the first full-polarimetric GNSS reflectometer in space for the investigation of land surface and cryosphere.
The Earth Observer article, SMAP: Mapping Soil Moisture and Freeze/Thaw State from Space [Jan.–Feb. 2015, 27:1, 14–19] offered a preview of SMAP that was published shortly after its launch. A more recent online article, A Decade of Global Water Cycle Monitoring: The Soil Moisture Active Passive Mission, published Aug. 18, 2025, reflects on the achievements of SMAP after a decade of operations.
More specific to vegetation water content, NASA launched the ECOsystem Spaceborne Thermal Radiometer Experiment on Space Station (ECOSTRESS) to ISS on June 29, 2018. It was subsequently installed on the JEM–EF ELC 10, placing it in close proximity to GEDI (installed on ELC 6) and enabling combined observations. While GEDI focuses on the canopy height and related characteristics, ECOSTRESS monitors the combined evaporation and transpiration of living plants – known as evapotranspiration (ET). ECOSTRESS determines ET indirectly through measurements of the thermal infrared brightness temperatures of plants.
As with GEDI, The Earth Observer has reported on the activities of the ECOSTRESS mission. The most recent coverage was in the article, ECOSTRESS 2019 Workshop Summary: Science, Applications, and Hands-On Training [July–Aug. 2018, 31:4, 15–18.]
Last, but certainly not least, the most recent Earth observing satellite to launch is a joint venture between NASA and the Indian Space Research Organization (ISRO). The NASA-ISRO Synthetic Aperture Radar (NISAR) took to the skies on July 30, 2025, from the Satish Dhawan Space Centre on India’s southeastern coast aboard an ISRO Geosynchronous Satellite Launch Vehicle (GSLV) rocket 5. The mission was designed to observe and measure some of the planet’s most complex processes – see Figure 14. The launch was lauded in the Editor’s Corner published online on Sept. 10, 2025.
NISAR uses two different radar frequencies – L-band and S-band synthetic aperture radar (SAR). The dual system can penetrate clouds and forest canopies to allow researchers to measure changes on the planet’s surface, down to a centimeter (~0.4 in). This level of detail allows the research community to investigate ecosystem disturbances, ice-sheet collapse, natural hazards, sea level rise, and groundwater issues. The satellite will also capture changes in forest and wetland ecosystems. It will expand on our understanding of deformation of the planetary crust that can help predict earthquakes, landslides, and volcanic activity. All of this data will help mitigate damage from a disaster and help communities prepare a disaster response. Some early results from the both NISAR radars are discussed in the Final Editor’s Corner column, published online on Dec. 29, 2025.
Figure 14. The NASA-ISRO Synthetic Aperture Radar (NISAR) Synthetic Aperture Radar can observer Earth’s land and ice with unmatched precision, offering real-time insights into earthquakes, floods, and climate shifts. Figure credit: NASA/Jet Propulsion Laboratory–Caltech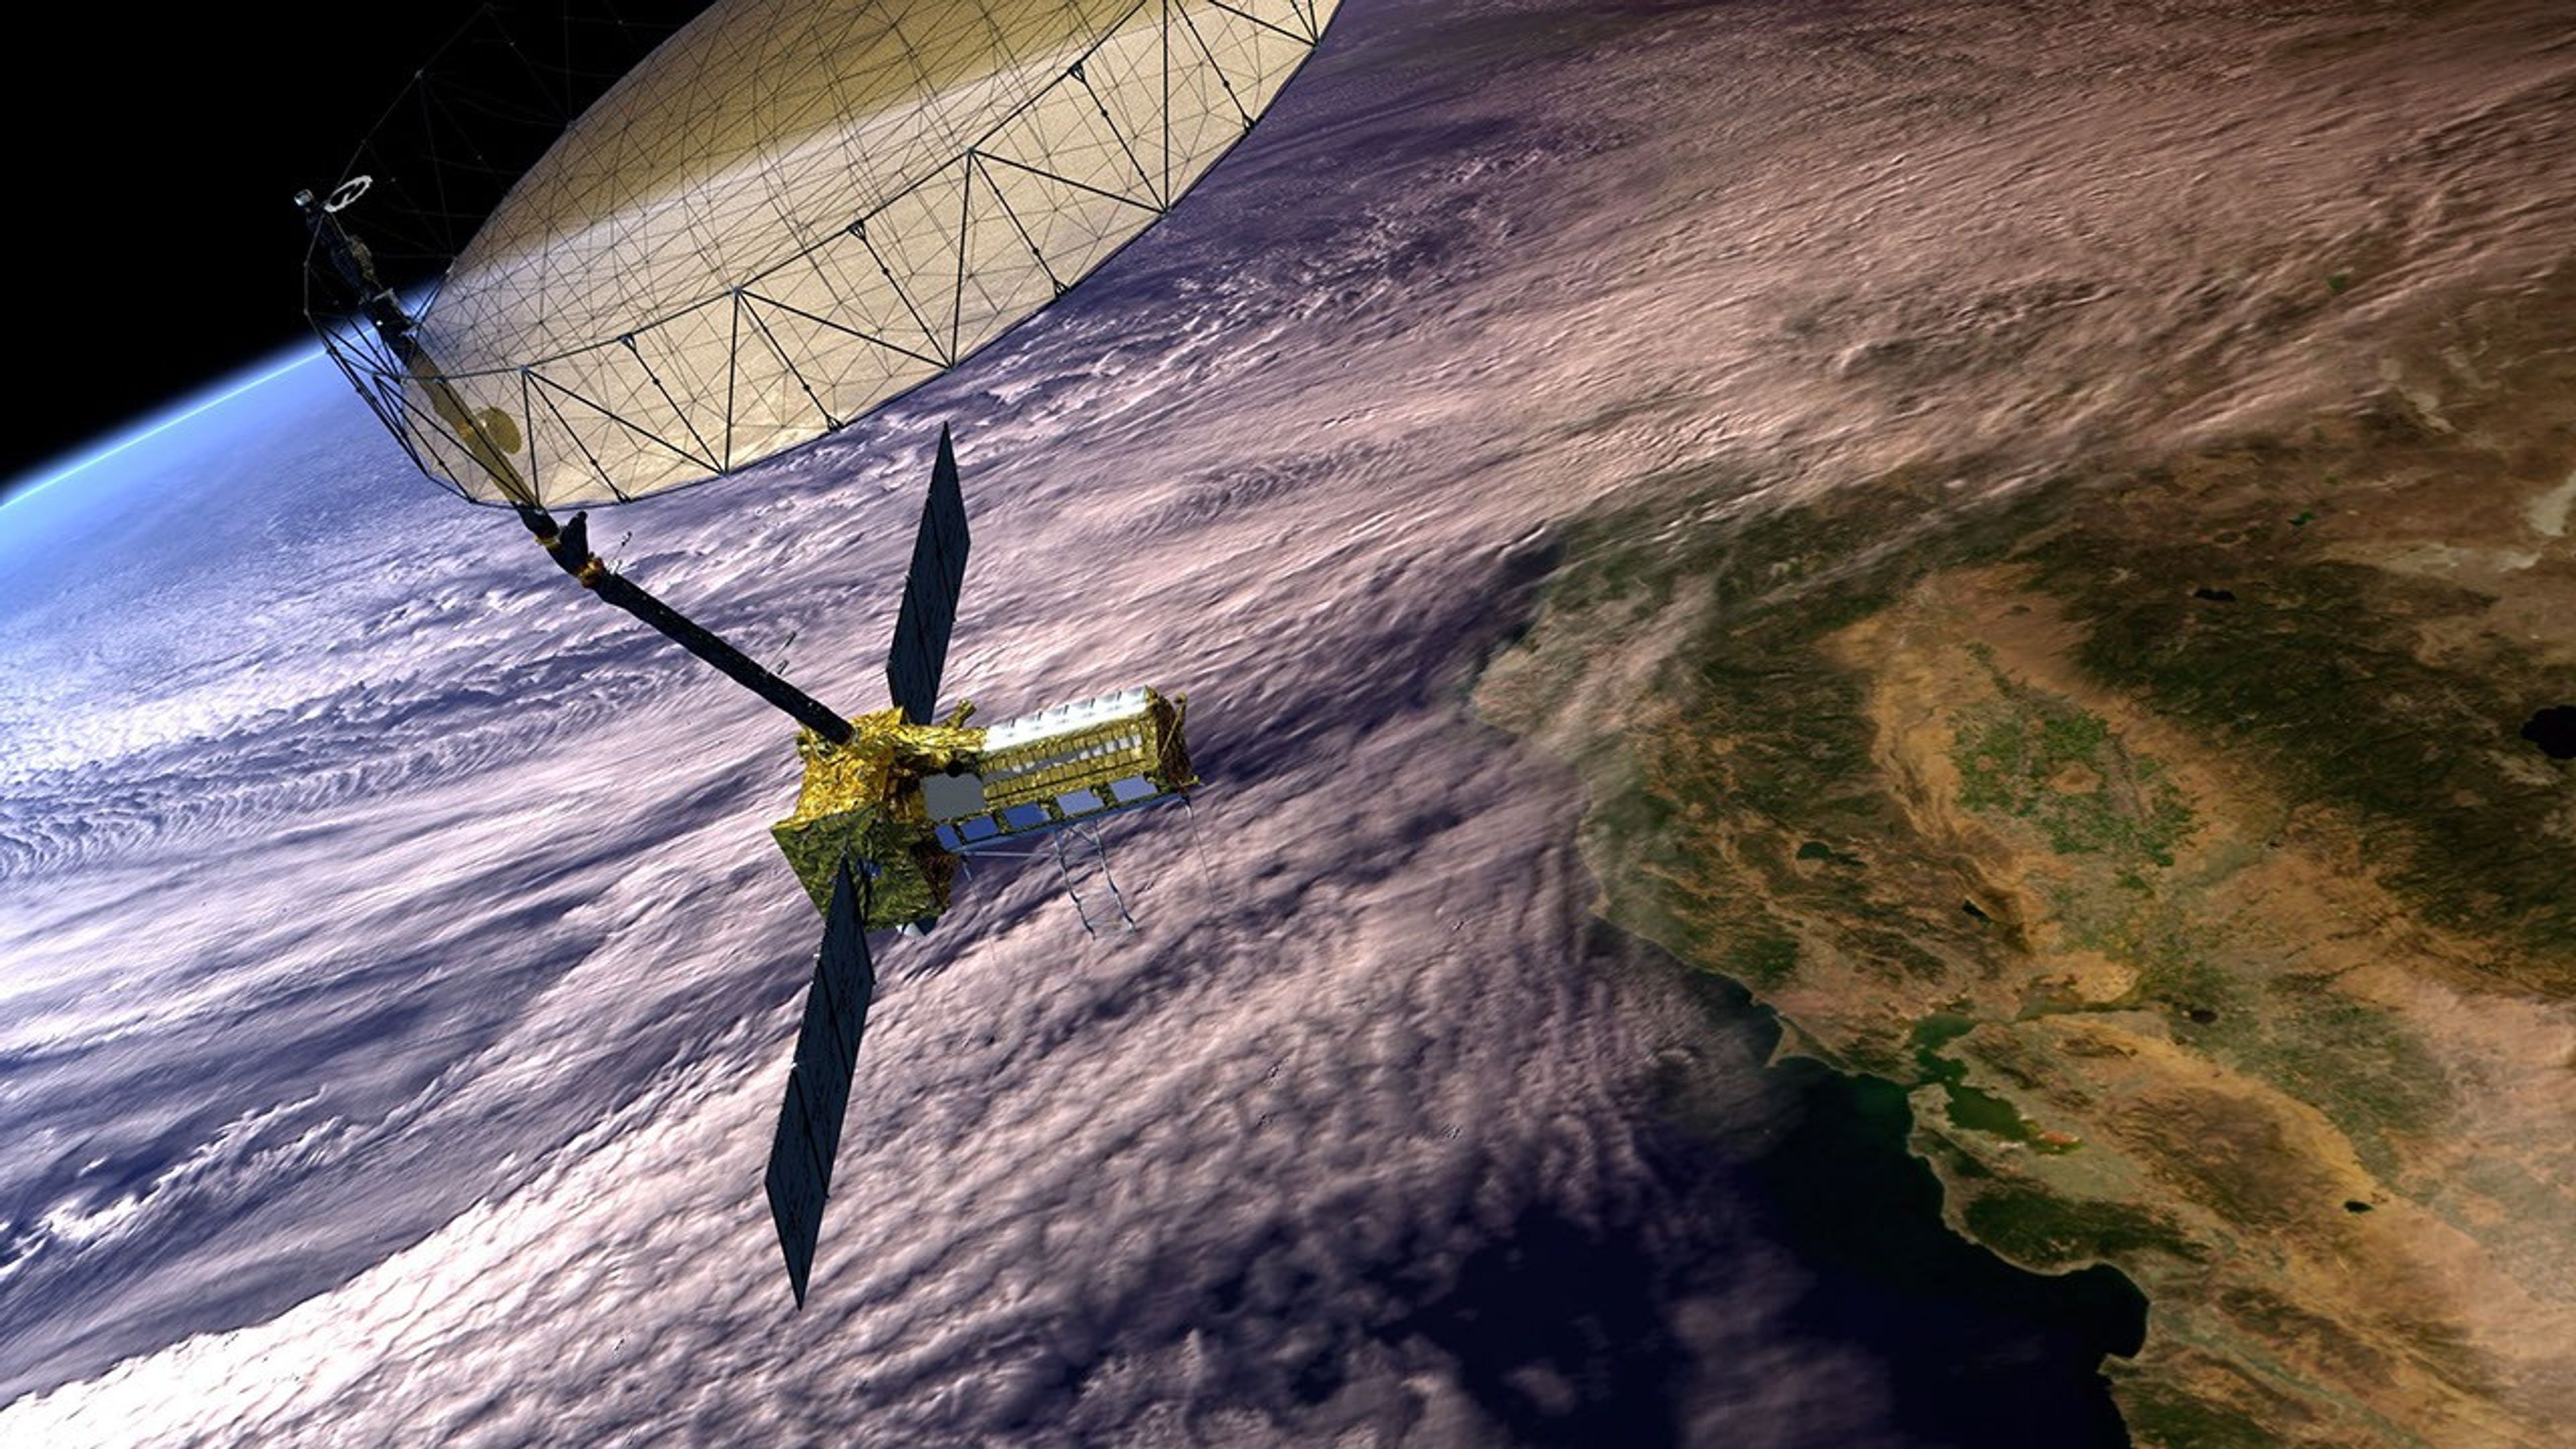
Conclusion
Over the past 36 years, The Earth Observer has borne witness to some of the most monumental scientific achievements of NASA Earth Science and chronicled those stories for the community. While the format of the publication evolved considerably over the years, the satellite missions that have been the focus of this article are one of the primary “lenses” that the newsletter has had to observe and reflect on the story of NASA Earth Science. These continuous global observations have revolutionized society’s knowledge of our home planet and how humans might be altering it.
The staff of The Earth Observer have navigated many different modes of communication over the past three-and-a-half decades, but the commitment to delivering high-quality content has remained constant. It has been the highest honor of every member of our publication team – past and present – to work on this material. While the newsletter is coming to an end, it is hoped that the Archives page continues to be a rich source of historic information about NASA’s EOS and Earth science over the past three and a half decades.
On behalf of the current Editorial Team, we, the authors of this reflection, wish to thank every person who has contributed to the success of this newsletter over the years – and to extend to all in the NASA Earth Science community best wishes for the year ahead and continued success in your remote observation endeavors.
Stacy Kish
NASA’s Goddard Space Flight Center/EarthSpin
stacykishwrites@gmail.com
Alan B. Ward
NASA’s Goddard Space Flight Center/Global Science &Technology Inc.
alan.b.ward@nasa.gov
The Earth Observer: Offering Perspectives from Space through Time
38 min read
The Earth Observer: Offering Perspectives from Space through TimeAn Intertwined History: The Earth Observer and EOS
The Earth Observer, a newsletter issued for nearly 37 years, will release its last online content at the close of 2025. This newsletter evolved in parallel with NASA’s Earth Observing System (EOS). It is almost impossible to speak of this newsletter without mentioning EOS. As The Earth Observer prepares its final publication, NASA also plans to shutter its three EOS flagship satellites (discussed below) possibly as early as the end of 2026.
While EOS was “much more than its satellites,” one cannot deny that the satellite missions and their iconic images provide an entry point to the overarching work conducted by the EOS science teams for almost three decades. These efforts spanned crucial complementary ground- and aircraft-based observations along with focused field campaigns to coordinate observations across multiple levels of Earth system time and spatial scales. The teams worked (and continue to work) closely with the NASA Earth Science Division Earth Observing System Data and Information System (EOSDIS) and related Science Investigator Processing System (SIPS) facilities, as well as developed and enhanced the algorithms that support the satellite products. Readers who wish to learn more about these topics should consult The Earth Observer’s archives page, which contains much of the history of this work.
During this point of inflection, The Earth Observer’s publication team felt it important to pause and reflect on the significance of the work detailed in the newsletter throughout this brief slip of time. The result is the article that follows.
A Flagship of an Idea: Almost Four Decades of Science
As described in the article, A Condensed History of the Earth Observing System (EOS) [June 1989, 1:3. 2–3], what would become known as EOS had its foundation in the recommendations of an ad hoc NASA study group that convened in 1981 to “determine what could and should be done to study integrated Earth science measurement needs.” Initially, the study group envisioned several large platforms in space, each with numerous instruments that would be serviced by the Space Shuttle, similar to servicing of the Hubble Telescope on several occasions. Known as System Z [Sept.–Oct. 2008, 20:5, 4–7], this early vision “laid the groundwork for a Mission to Planet Earth” but was reimagined after the tragic loss of the Space Shuttle Challenger in January 1986. An article written at the end of the Shuttle program included a sidebar that detailed the impracticality of launching shuttle missions into polar orbit to service EOS satellites, see Polar Shuttle Launches: The Path Almost Taken, [Sept.–Oct. 2011, 23:5, 6–7]. Eventually, the large space platform concept morphed into several mid-size flagship satellite missions, known today as Terra, Aqua, and Aura. Smaller satellite missions would supplement and enhance the data gathered by the “big three” satellites – see Figure 1.
To view this video please enable JavaScript, and consider upgrading to a web browser that
supports HTML5 video
Technological advances further enhanced and refined this vision, allowing satellites to fly in close formation to capture near-simultaneous measurements in much the same way they would if they were on a single platform. The Afternoon Constellation, or A-Train, is a shining example of this international effort and is described in more detail below.
NASA released the first EOS Announcement of Opportunity in 1988, and a panel selected the winning proposals. An EOS Project Science Office was established to manage the projects. During this time of rapid development, NASA leadership was keenly aware of the need to keep the international EOS community abreast of the latest information. Enter The Earth Observer newsletter. First published in March 1989, the newsletter was the natural conduit to bridge this communication gap. To set the stage of how things have changed, an early article, titled Direct Transmissions of EOS Data to Worldwide Users [July–Aug. 1990, 2:6, 2–4], introduced the readership to the World Wide Web, which promoted “a ‘place’ where scientists communicate with each other and with the data they have collected with the help of their professional colleagues from the engineering and operations disciplines.”
In the more than 1000 printed pages published in the past three decades. The Earth Observer has chronicled the story of EOS and NASA’s broader Earth Science program. The publication has captured – often in meticulous detail – the intensive work behind the scenes that has gone into the development of the technologies, algorithms, and data centers that gather data from Earth observing satellites, suborbital observations, and other experiments to inform end users who use the data to address societal issues.
In the years before the first EOS missions launched, the newsletter reported in earnest on Investigator Working Group (IWG) meetings, Payload Panel Reviews (reviewing the instruments planned for the EOS platforms), and Mission and Instrument Science Team Meetings. As EOS matured, the newsletter began reporting on the development and implementation of specific science missions, launches, milestones, and research generated from the data collected. The editorial staff began publishing more feature articles to appear along with the meeting and workshop reports. The newsletter shared news stories developed by NASA’s Earth Science News Team and other bimonthly content (e.g., Education Update, Science in the News). “The Editor’s Corner” column in the newsletter gave the EOS Senior Project Scientist a platform to offer commentary on current events in NASA Earth Science as well as on the content of the current issue of the newsletter. While not formally named for the first few issues, an editorial article has been a cornerstone of the publication since the beginning.
The Earth Observer has produced several articles reflecting on its interwoven history with EOS, such as The Earth Observer: Twenty-Five Years Telling NASA’s Earth Science Story [March–April 2014, 26:2, 4–12] and A Thirtieth Anniversary Reflection from the Executive Editor {March–April 2019, 31:2, 4–6]. These stories expand upon the topics covered in the brief review presented in this article.
Satellite Missions: the Backbone of EOS Science
EOS was originally organized around 24 critical science measurements deemed integral to understand planetary processes and assess variability, long-term trends, and climate change. These science measurements serve as a roadmap for organizing EOS data products and mission objectives. The 24 measurements coalesced into five broad categories that reflect Earth science disciplines:
- Atmosphere: aerosol properties, cloud properties (e.g., fraction and opacity), atmospheric temperature and pressure profiles, water vapor, ozone (O3), trace gases [e.g., carbon dioxide (CO2), sulfur dioxide, and formaldehyde], and total solar irradiance;
- Ocean: ocean color (chlorophyll), sea surface temperature, sea ice cover and motion, ocean surface topography and sea level, and sea surface salinity;
- Land/Cryosphere: land surface temperature, soil moisture, snow and ice cover (extent and elevation), land cover and change (e.g., forest cover), and topography;
- Radiation/Energy Balance: radiant energy balance (incoming and outgoing radiation), and precipitation (e.g., rainfall, snow); and
- Solid Earth: static gravity field and synthetic aperture radar observations.
The Grand Vision of EOS: Three Flagships Leading the Earth Observing Fleet
In the late 1980s and early 1990s, a team of scientists envisaged the concept for two missions – EOS-AM1 and EOS-PM1. The synergy of this system was the ability to make observations in the morning (10:30 AM mean local time, or MLT), a time when cloud cover over the tropical equatorial and other land regions would be at a minimum, and afternoon (1:30 PM MLT), a time when continental convection would peak. The plan was to have two instruments – the Moderate Resolution Imaging Spectroradiometer (MODIS) and Clouds and Earth’s Radiant Energy System (CERES) – overlap on the two platforms along with other instruments unique to each mission.
In parallel, the teams envisioned EOS-CHEM1, a satellite platform identical to EOS-PM1 but carrying a payload focused on atmospheric chemistry. Like EOS-PM1, EOS-CHEM1 would be placed in an afternoon orbit but lag slightly in its equatorial crossing time (1:45 PM MLT) to optimize its position for atmospheric chemistry observations.
Each mission was slated to be the first in a series that would launch at five-year intervals to ensure continuity of critical Earth science measurements. Budgetary realities and technical advances eventually rendered plans for the second and third series of each satellite obsolete; however, all three flagship missions endured far beyond their planned six-year lifetime and have outlasted the originally proposed 15-year timeframe for each series.
Terra
Terra, originally named EOS-AM1, launched in December 1999 – see Figure 2. Terra carries five instruments – MODIS, CERES (two copies), Multiangle Imaging Spectroradiometer (MISR), Advanced Spaceborne Thermal Emission and Reflection Radiometer (ASTER), and Measurements of Pollution in the Troposphere (MOPITT) – and was designed to capture information about Earth’s atmosphere, carbon cycle and ecosystems, climate variability, water and energy cycle, weather, and the planet’s surface and interior. The Earth Observer captured early Terra data in the article, Terra Spacecraft Open For Business [March–April 2000, 12:2, 24].
After over 26 years in service, Terra remains in orbit and continues to gather data; as of this writing all instruments accept MOPITT remain active. However, since 2020 the spacecraft has been allowed to drift from its carefully maintained 10:30 AM MLT equator crossing time toward earlier MLT crossings. This was done to conserve enough fuel to control Terra’s eventual atmospheric reentry. The Terra team also conducted orbital lowering maneuver on the spacecraft in 2022. A more complete history of Terra is available in the online article, Terra: The End of An Era, published on December 29, 2025.
Figure 2. An artistic rendering of the Terra spacecraft. The image shows the locations of its five instruments. Note that there are two Clouds and Earth’s Radiant Energy System instruments aboard the satellite and one each of the other four instruments. Figure credit: NASAAqua
Aqua, originally named EOS-PM1, launched in May 2002 – see Figure 3. An article in The Earth Observer at the time of launch described the mission, Aqua is Launched! [March–April 2002, 14:2, 2]. The second EOS flagship carried six different instruments into orbit – Atmospheric Infrared Sounder (AIRS), Advanced Microwave Sounding Unit–A (AMSU-A1 and -A2), CERES (two copies), MODIS (both of which also fly on Terra), the Advanced Microwave Scanning Radiometer for EOS (AMSR–E), and Humidity Sounder for Brazil (HSB). Aqua’s mission focused on collecting data on global precipitation, evaporation, and the cycling of water. Aqua paired its data with Terra, offering the scientific community additional insights into the daily cycles for important scientific parameters to understand the global water cycle.
The Earth Observer article, Aqua: 10 Years After Launch [Nov.–Dec. 2012, 24:6, 4–17] provides an overview of the mission’s accomplishments during its first decade in orbit. Due to fuel limitations, Aqua completed the last of its drag makeup maneuvers in December 2021. Like Terra, the satellite is now in a free-drift mode, slowly descending below the A-Train orbit and crossing the equator later and at lower altitudes. A more recent newsletter article, Aqua Turns 20 [May–June 2022, 34:3, 5–12] reflects on Aqua’s accomplishments and legacy after two decades in orbit. As of this writing MODIS, CERES, AMSU, and CERES remain active.
Figure 3. An artistic rendering of NASA’s Aqua satellite. The mission collects data about the Earth’s water cycle, including evaporation from the oceans, water vapor in the atmosphere, clouds, precipitation, soil moisture, sea ice, land ice, and snow cover on the land and the ocean. Figure credit: NASAAura
Originally named EOS-CHEM1, Aura was the third and final flagship mission, and was launched in July 2004 – see Figure 4. The Earth Observer detailed the first post-launch science team meeting, Aura Science Team Meeting [March–April 2004, 17:2, 8–11]. Aura followed a Sun-synchronous, near-polar orbit, crossing the equator 15 minutes after Aqua. Similar to Aqua, Aura completed its final inclination adjustment maneuver in April 2023 to save its remaining fuel to allow for controlled reentry. As a consequence, the satellite has drifted out of the A-Train orbit, slowly continuing to move to a later equatorial crossing time and lower orbit altitude.
Aura’s payload included four instruments: the Microwave Limb Sounder (MLS), High Resolution Dynamics Limb Sounder (HIRDLS), Tropospheric Emission Spectrometer (TES), and Ozone Monitoring Instrument (OMI). These instruments gather information on trace gases and aerosols in the atmosphere. The key mission objectives aimed to monitor recovery of the stratospheric O3 hole, evaluate air quality, and monitor the role of the atmosphere in climate change. The article, Aura Celebrates Ten Years in Orbit [Nov.–Dec. 2014, 26:6, 4–16] detailed Aura’s first decade of accomplishments. The online article, Aura at 20 Years, published Sept. 16, 2024, reported on Aura’s status and achievements as it began its third decade of continuous operations. As of this writing MLS and OMI remain active.
Figure 4. An artistic rendering of the Aura satellite. Aura gathers information on trace gases and aerosols in the atmosphere. Figure credit: NASABuilding and Dismantling the “A-Train”
Between 2002 and 2014, a series of satellites joined the A-Train constellation – see Figure 5. This international effort includes the two EOS flagship satellites with afternoon equatorial crossing times (Aqua and Aura) as well as the Orbiting Carbon Observatory–2 (OCO-2), CloudSat, and the Cloud-Aerosol Lidar and Infrared Pathfinder Satellite Observations (CALIPSO). In addition, Polarization and Anisotropy of Reflectances for Atmospheric Sciences coupled with observations from a Lidar (PARASOL) and Global Change Observation Missions with a focus on the water cycle (GCOM-W) are two international missions that became part of the A-Train constellation.
In the past decade, many of the satellites in the A-Train have either retired or have been allowed to drift out of the constellation. As of this writing, only two satellites – OCO-2 and GCOM-W1 – remain in their positions in the A-Train gathering data.
Three A-Train symposiums have been organized to bring the Earth science community together to discuss the achievements and future synergy of these missions. The outcome from each of these meetings were reported in The Earth Observer. The most recent of these was: The Third A-Train Symposium: Summary and Perspectives on a Decade of Constellation-Based Earth Observations [July–Aug. 2017, 29:4, 4–18].
Figure 5. An artistic depiction of all the satellites that participated in the Afternoon Constellation (A-Train), except for Polarization and Anisotropy of Reflectances for Atmospheric Sciences coupled with observations from a Lidar (PARASOL). CloudSat and Cloud-Aerosol Lidar and Infrared Pathfinder Satellite Observations (CALIPSO) lowered their orbits. Called the C-Train, the orbit of these satellites overlapped the A-Train, enabling science observations with other A-Train missions. More details about the A-train is available on the constellation’s website. Figure credit: NASAScience from the EOS Fleet
The next several sections provide a highlight of science from key missions outside of Terra, Aqua, and Aura. The content has been organized in terms of measurements – with an overarching focus on water (oceans and fresh water), atmosphere, and land. This summary is far from exhaustive. A record of much of the amazing science conducted during these missions is detailed in the archives of The Earth Observer.
Interpreting an Ocean of Data
When viewed from space, Earth has been described as a “blue marble.” The planet’s abundance of liquid water is found in the oceans, and while not potable, the oceans play a critical role in regulating Earth’s climate. Satellites provide an unparalleled way to study the global ocean. With each new mission, the process of data collection has been refined and improved. The scientific community can now measure ocean color as a proxy for surface productivity as well as measure subtle changes in surface ocean salinity. These data have improved weather and climate models to increase the accuracy of storm projection and help the scientific community better understand the movement of energy around the planet.
Aqua was the flagship mission dedicated to studying water on Earth, but other missions have contributed and expanded on this data record. For example, Japan’s GCOM-W1 mission, also known as SHIZUKU (Japanese for droplet), continues to gather information on precipitation, water vapor, wind velocity above the ocean, sea water temperature, water levels on land, and snow depths. These data support weather models to improve forecasts to monitor tropical cyclones. The subsections that follow provide examples of how data from these satellites support different science objectives, as well as examples of the science deciphered by both flagship and ancillary platforms within the A-Train. All of these missions and science have been covered in The Earth Observer over the past several decades.
Discerning the Ocean’s True Colors
Ocean color data are crucial for studying the primary productivity and biogeochemistry of the oceans. The Coastal Zone Color Scanner (CZCS), launched on the Nimbus 7 satellite in 1978 and ceasing operations in 1986 – gave the earliest perspective of the oceans from space. SeaWiFS, which served as a follow-on to CZCS, was launched on the privately owned Seastar spacecraft on Aug. 1, 1997 to produce ocean color data and offered a synoptic look at the global biosphere. This mission was a data-buy, where NASA purchased the data from Orbital Imaging Corporation. An article in The Earth Observer, titled Sea-viewing Wide Field-of-view Sensor [March–April 1998, 10:2, 20–22] detailed how the satellite gathered chlorophyll-a data that was calibrated to field measurements from a Marine Optical Buoy. The research community have used this information to understand primary productivity in the surface ocean and global biogeochemistry. This data offered an early assessment of the role of the ocean in the global carbon cycle. It also produced one of the first global perspectives of the impact of El Niño and La Nina events around the world. Coastal and fishery managers have used this data to improve the health of these important ecosystems. Launched for a five-year mission, SeaWiFs gathered data until December 2010.
More recently, NASA launched the Plankton, Aerosol, Cloud ocean Ecosystem (PACE) satellite in February 2024 to gather data on ocean and terrestrial ecosystem productivity – see Figure 6. While other missions studied ocean color in the interim between SeaWiFS and PACE (e.g., MODIS on Terra and Aqua), PACE offers an exponential leap forward with its three-instrument payload that includes: the Ocean Color Instrument (OCI), Hyper-Angular Rainbow Polarimeter–2 (HARP2), and Spectropolarimeter for Planetary Exploration (SPEXone). The PACE mission aims to clarify how the ocean and atmosphere exchange CO2, a key factor in understanding the evolution of Earth’s climate system. The satellite also examines the role of aerosols in providing micronutrients that fuel phytoplankton growth in the surface ocean. The data gathered extends the aerosol and ocean biological, ecological, and biogeochemical records that were initiated by other satellites. The Dec. 29, 2025 article, Keeping Up with PACE: Summary of the 2025 PAC3 Meeting, reports on three recent meetings related to the mission.
Figure 6. An artistic rendering of the Plankton, Aerosol, Cloud ocean Ecosystem (PACE) observatory and the instrument panels that it carries. PACE focuses on clarifying how the ocean and atmosphere exchange carbon dioxide. Figure credit: NASAMapping the Ocean Surface to Reveal the Rising Seas
The Ocean Surface Topography (TOPEX)/Poseidon mission, launched on Aug. 10, 1992, was the first in a series of missions that have measured ocean surface topography, or the variations in sea surface height. This record now extends more than 30 years. TOPEX/Poseidon spent more than 13 years in orbit. The data gathered helped to improve the scientific community’s understanding of ocean circulation and its impact on global climate – including sea level rise. TOPEX/Poseidon produced the first global views of seasonal current changes, which allowed scientists to forecast and better understand El Niño events. These early efforts to distribute data were captured in The Earth Observer article, Jet Propulsion Laboratory DAAC Begins TOPEX Data Distribution [March–April 1993, 6:2, 24].
Jason followed TOPEX/Poseidon to continue the measure of sea level as well as wind speed and wave height for more than 95% of Earth’s ice-free ocean – see Figure 7. Jason consists of a series of satellites, with Jason-1, launched in 2001, remaining in orbit for 11 years. It was followed by Jason-2, also called the Ocean Surface Topography Mission (OSTM), which was launched in 2008. Jason-2 gathered data for 11 years. Jason-3 launched in January 2016 and remains in orbit, continuing the sea level dataset. The Earth Observer has reported on meetings of the Ocean Surface Topography Science Team over the years. The online article, Summary of the 2023 Ocean Surface Topography Team Meeting, was published May 31, 2024 and includes the most recent updates available.
Figure 7. Beginning with TOPEX/Poseidon in 1992, a series of ocean surface topography missions have maintained a continuous record of global sea surface height data with the best possible accuracy along the same exact ground track. Dubbed the “reference” altimetry missions, shown here are TOPEX/Poseidon, Jason-1, and the Ocean Surface Topography Mission/Jason-2 (OSTM/Jason-2) in the tandem orbit pattern. This is used to cross-calibrate each mission to the next. By flying in formation, just one minute apart for a period of several months, scientists can be sure that each successive mission is exactly calibrated to its predecessor. Connecting each record to the next, these reference missions have built a record of sea level that stretches more than 30 years with centimeter level accuracy for every corner of the ocean. The reference mission has now been taken over by, Sentinel 6 Michael Freilich, which will hand the baton to the recently launched Sentinel 6B sometime in 2026. Figure credit: NASA/JPL/CNESThe international partnership between the United States [NASA and the National Oceanic and Atmospheric Administration (NOAA)], the European Space Agency (ESA), and the French Space Agency [Centre National d’Études Spatiales (CNES)] collaborate to create the ESA’s Copernicus Sentinel–6 missions. The Sentinel-6B, launched Nov. 16, 2025, will follow the path of the Sentinel-6 Michael Freilich (originally called Sentinel–6A) satellite, which has been in orbit for five years – see Figure 8. These two Sentinel 6 missions continue the global measurements of sea level, wind speed, wave height, and atmospheric temperature. The data will be used in marine weather forecasts as well as to improve commercial and naval navigation, search and rescue missions, and tracking garbage and pollutants in the ocean. To learn more about Sentinel-6B, see the online article, Sentinel-6B Extends Global Ocean Height Record, published Dec. 22, 2025.
While the Surface Water and Ocean Topography (SWOT) mission is fully described in the next section – with emphasis placed on its novel surface water observation capabilities – it should be noted that SWOT is also an ocean topography mission that obtains data similar to TOPEX/Poseidon, Jason, and Sentinel-6 missions. These data will contribute to the long-term time series of the sea surface height record.
Figure 8. Sentinel-6B, an Earth-observing satellite jointly developed by NASA and U.S. and European partners, will observe the ocean and measure sea level rise to provide insights into our home planet that will improve weather forecasts and flood predictions, increase public safety, and protect coastal infrastructure. The Sentinel missions are part of the European Space Agency’s Copernicus Programme. Figure credit: NASASampling the Salty Seas
Launched June 2011, Aquarius was an international collaboration between NASA and Argentina’s Comisión Nacional de Actividades Espaciales (CONAE). The cooperative effort was detailed in the article, Aquarius: A Brief (Recent) History of an International Effort [July–Aug. 2010, 22:4, 4–5]. The satellite carried a microwave radiometer that was sensitive enough to measure salinity to an accuracy of 0.2 practical salinity units (psu) on a monthly basis. It also carried a scatterometer to measure surface ocean roughness. Pairing data from the two instruments allowed the team to overcome the challenges of measuring salinity from space. This feat is detailed in the article, For Aquarius, Sampling Seas No ‘Grain of Salt’ Task [July–Aug. 2011, 23:4, 42–43]. The more accurate, global measurements of ocean salinity that Aquarius obtained have helped the research community better understand ocean circulation. The mission ended in 2015, after the satellite experienced a power failure.
Focusing on Freshwater
While most water on the planet is housed in the ocean, fresh water is a primary concern for life on the planet. Fresh water accounts for ~3% of the total amount water on the planet. Of that small amount, a significant portion is locked in ice on land and as sea ice. The remaining water flows on Earth’s surface and underground. Maintaining a supply of fresh water is critically important to our survival. The location, status, and purity of this precious resource continues to be an on-going focus for many of the missions.
Monitoring Rain and Snow
The joint NASA/National Space Development Agency of Japan (NASDA – which is now known as the Japan Aerospace Exploration Agency, or JAXA) Tropical Rainfall Measuring Mission (TRMM) carried a Microwave Imager, Visible Infrared Scanner, and Precipitation Radar to gather tropical and subtropical rainfall observations (and two related instruments) – see Figure 9. These data filled a critical knowledge gap – to understand the interactions between the sea, air, and land. Over the years, these data were incorporated into numerous computer models to clarify the role of tropical rainfall on global circulation and formed the basis for experimental quasi-global merged satellite precipitation products. The Earth Observer detailed the early data collection in the article titled TRMMing the Uncertainties: Preliminary Data from the Tropical Rainfall Measuring Mission [May–June 1998, 10:3, 48–50]. The mission was extended twice but eventually the satellite’s maneuvering fuel was exhausted, resulting in a slow decline in the orbital altitude beginning in 2014, with reentry in 2015. Data from TRMM have improved understanding of storm structure of cloud systems, produced reliable global latent heating estimates to improve water transfer estimates within the atmosphere, and continue to be used in calibrating modern precipitation products for the TRMM era.
Figure 9. Artistic rendering of the Tropical Rainfall Measuring Mission (TRMM) in space over a hurricane. TRMM was launched in 1997 and remained in operation until 2015. The satellite was designed to improve our understanding of the distribution and variability of precipitation within the tropics as part of the water cycle in the current climate system. Figure credit: NASATo continue the efforts that began with TRMM – and extend coverage to most of the globe – NASA and JAXA launched the Global Precipitation Measurement (GPM) mission in 2014. This satellite aims to advance our understanding of water and energy cycles, improve forecasting of extreme weather events, and extend current capabilities to use accurate and timely information of precipitation to directly benefit society. The Earth Observer detailed the accomplishments of this mission in the online article, GPM Celebrates Ten Years of Observing Precipitation for Science and Society, published Oct. 3, 2024.
Surveying Earth’s Surface Water
Introduced briefly in the previous section, the SWOT mission is a joint venture between the United States and France. Launched in December 2022, SWOT is conducting the first global survey of Earth’s surface water – see Photo. The mission was introduced to the EOS community in The Earth Observer article, Summary of the 2022 Ocean Surface Topography Science Team Meeting [May–June 2023, 35:3, 19–23]. SWOT carries the Ka-band Radar Interferometer (KaRIN) – the first spaceborne, wide-swath, altimetry instrument capable of high-resolution measurements of sea surface height in the ocean and freshwater bodies. SWOT covers most of the world’s ocean and freshwater bodies with repeated high-resolution elevation measurements. This data have been applied to monitor rivers across the Amazon basin, simulate land/hydrology processes, and predict streamflow. A more comprehensive overview of SWOT applications is detailed in online article, Summary of the 10th SWOT Applications Workshop, published Sept. 20, 2024.
Photo 1. Workers in a clean room in Cannes, France, load the Surface Water and Ocean Topography (SWOT) satellite into a container in preparation for shipping the spacecraft to the United States. SWOT provides the first global survey of Earth’s surface water. Photo credit: Centre National d’Études Spatiales (CNES), Thales Alenia SpaceGracefully Tracking Water Movement
The twin GRACE satellites were launched on March 17, 2002. The mission, a partnership between NASA and the German GeoForschungsZentrum (GFZ) Helmholtz Centre for Geosciences was developed to measure Earth’s shifting masses – most of which comes from water – and map the planet’s gravitational field using a K-band microwave ranging system and accelerometers. Some early results of the satellites appeared in The Editor’s Corner column [Nov.–Dec. 2002, 14:6, 1–2]. GRACE enabled groundbreaking insights into Earth’s evolving water cycle as the satellites tracked monthly mass variations in ice sheets and glaciers, near-surface and underground water storage, the amount of water in large lakes and rivers, as well as changes in sea level and ocean currents.
GRACE’s mission was extended with the GRACE-Follow On (GRACE-FO) mission launched in 2018 – see Figure 10. GRACE-FO continues comprehensive tracking water movement across the planet, including groundwater measurements that have important applications for everyday life. The most recent developments of the GRACE-FO science meeting was detailed in an online article, Summary of the 2023 GRACE Follow-On Science Team Meeting, published March 30, 2024 – and also published in the final print issue [Jan.–Feb. 2024, 35:7, 19–26]. The data gathered during the GRACE-FO mission details large-scale changes in Earth’s groundwater reservoirs, Greenland and Antarctica’s sensitivity to warming ocean waters, and even subtle shifts deep in Earth’s interior that reveal how large earthquakes can develop.
In 2028, NASA will move into a third-generation of gravity observations with the launch of GRACE-Continuity, or GRACE-C, which will further expand the foundational observations of global mass change and expand the societal and economic applications that have been created from these data.
Figure 10. An artistic rendering of the twin Gravity Recovery and Climate Experiment-Follow-On (GRACE-FO) satellites that, like the original GRACE twins, follow each other in orbit, separated by about 137 miles (220 km). GRACE tracks water movement across the planet’s surface. Figure credit: NASAAssessing the Atmosphere from Above
Earth has a unique atmospheric makeup that maintains a stable temperature allowing life to thrive. As far as we know, our atmosphere is unique in the universe. Satellites provide an unparalleled perspective to study variability in the column of air extending from Earth’s surface. While Aura has a suite of instruments making a wide range of atmospheric chemistry measurements, other missions also measure the abundance and impact of atmospheric constituents that, while often invisible to the unaided eye, can have profound impacts on Earth’s air quality and climate. These data have also improved climate models and help the scientific community better understand how energy is emitted into space.
Tracking Tiny Particles with Big Impacts
France’s PARASOL mission was an original member of the international A-Train constellation. Launched in 2004. PARASOL sought to capture the radiative and microphysical properties of clouds and tiny atmospheric aerosol particles using a unique multiangle imaging POLDER polarimeter.
NASA’s Glory mission was intended for operation in the A-Train; it carried a multiangle polarimeter as its instrument. Unfortunately, the spacecraft failed to separate from the Taurus rocket due to a fairing separation failure during its launch in 2011. As a result, POLDER on PARASOL was the only atmospheric polarimeter to fly in space until two (SPEXone and HARP2) launched as part of NASA’s PACE mission. Researchers gathered information from POLDER and other A-Train instruments about how aerosols affect the formation of precipitations and clouds, the movement of water around the planet, and the reflection and absorption of radiative energy that impact overall planetary climate. PARASOL was deactivated in 2013 after nine years in service.
Cloud particles form when water vapor nucleates onto aerosols; changes in one can impact the other. After many years and conversations, it was decided to pair two NASA Earth System Science Pathfinder (ESSP) missions – CloudSat and CALIPSO – and fly them in coordination with each other and with other A-Train satellites. By combining the two datasets, it was possible to explore cloud and aerosol processes. This information helped the community drill into the larger climate questions. The two satellites were launched on the same Delta-II rocket from Vandenberg Air Force Base in California on April 28, 2006. CloudSat used a 94 GHz cloud profiling radar that is 1000 times more sensitive than a typical weather radar, capable of distinguishing between cloud particles and precipitation. CALIPSO contained a Cloud-Aerosol Lidar with Orthogonal Polarization (CALIOP), Wide-Field Camera, and Imaging Infrared Radiometer to detect and distinguish between aerosol particles and cloud particles.
The Earth Observer captured the early data collection of the two satellites in the article, CloudSat and CALIPSO: A Long Journey to Launch…But What a Year It’s Been!! [May–June 2007, 19:3, 7–12]. The later article, A Useful Pursuit of Shadows: CloudSat and CALIPSO Celebrate Ten Years of Observing Clouds and Aerosols [July–Aug. 2016, 28:4, 4–12] provided a review of the accomplishments of the missions after 10 years in orbit. CALIPSO and CloudSat were both deactivated in 2023 after 17 years of service.
An Oracle of High-Altitude Wisdom
The Stratospheric Aerosol and Gas Experiment (SAGE) has experienced several iterations, extending back nearly half a century. The initial SAGE mission launched on Feb. 18, 1979, aboard the Applications Explorer Mission-B (AEM-B) to measure vertical distribution of aerosols and important gases in the upper troposphere and stratosphere (UTS). The satellite failed after three years in orbit. In 1984, SAGE II began collecting data on stratospheric O3, producing a stable record of this important greenhouse gas from 1984–2005. SAGE III was launched on Метеор-3М (SAGE III/M3M). The third-generation satellite produced an accurate measurement of the vertical structure of aerosols, O3, water vapor, and other important trace gases in the upper troposphere and stratosphere. The satellite was terminated on March 6, 2006, following a power supply system failure, resulting in loss of communication with the satellite.
Another version of SAGE III was launched to the International Space Station (ISS) on Feb. 19, 2017, where it was installed on the EXpedite the PRocessing of Experiments to Space Station (ExPRESS) Logistics Carrier [ELC-4] – an unpressurized attached payload platform for ISS. SAGE III/ISS, which is shown mounted on ELC-4 in Figure 11, has completed its prime mission after three years of operation. NASA granted approval to extend the SAGE III/ISS mission through at least 2026 – meaning the instrument will continue to provide the public and science community with world-class vertical profiles of O3, aerosol, water vapor, and other trace gases, e.g., nitrogen dioxide (NO2) and nitrate (NO3), data products for at least another year. An article titled, Summary of the 2024 SAGE III/ISS Meeting, published May 26, 2025, details the latest findings from SAGE.
Figure 11. An artistic rendering of the Stratospheric Aerosol and Gas Experiment-III (SAGE-III), which is externally mounted on the International Space Station’s Japanese Experiment Module–Exposed Facility (JEM-EF) EXPRESS Logistics Carrier (ELC)-4. SAGE III/ISS measures the vertical structure of aerosols, ozone (O3), water vapor, and other important trace gasses in the upper troposphere and stratosphere. Figure credit: NASAWatching Earth Exhale
The Orbiting Carbon Observatory (OCO) was launched into space in February 2009, but it failed to separate from the Taurus rocket during its ascent, leading to mission failure and loss of the satellite. Undaunted, the EOS community began again and assembled OCO-2, which was successfully launched into orbit, joining the A-Train on July 2, 2014 – see Figure 12. The satellite’s mission focused on making precise, high-resolution measurements of atmospheric CO2. OCO-2 measures reflected sunlight that interacts with the atmosphere. Using diffraction gratings to separate the reflected sunlight into spectra, OCO-2 measures the absorption levels for the different molecular bands to calculate CO2 concentration. This information is invaluable for the quantification of CO2 emissions and can characterize both sources and sinks of this critical greenhouse gas. The mission was detailed in an article, titled Orbiting Carbon Observatory-2: Observing CO2 from Space [July–Aug. 2014, 26:4, 4–12].
On May 4, 2019, NASA launched the third iteration in the OCO group to the ISS. It was subsequently installed on the Japanese Experiment Module–Exposed Facility (JEM-EF). Constructed from parts left over from OCO-2, OCO-3 continues the mission of making CO2 measurements with a focus on daily variability. In particular, the measurements explore the role of plants and trees in the major tropical rain forests of South America, Africa, and Southeast Asia. As of today, both OCO-2 and OCO–3 remain operational and gathering data.
The science team reflected on both these missions in a recent article posted in the online article, A Tapestry of Tales: 10th Anniversary Reflections from NASA’S OCO-2 Mission, published Aug. 12, 2025.
Figure 12. An artistic rendering of OCO-2 in orbit above Earth. OCO-2 measures the concentration of trace gases in the atmosphere. Figure credit: NASA/JPL-CaltechTracking the Sun’s Output
In December 1999, NASA launched the Active Cavity Radiometer Irradiance Monitor Satellite (ACRIMSAT) satellite to extend the more than two-decade record of total solar irradiance (TSI). Scientists use this important measurement to quantify the solar energy input to the planet and thereby its interactions with Earth’s oceans, land masses, and atmosphere. It is also a critical component to understand variations of the planet’s climate. The Active Cavity Radiometer Irradiance Monitor 3 (ACRIM3) instrument onboard combined the best features of the ACRIM I (flown on the Solar Maximum Mission), ACRIM II (flown on the Upper Atmosphere Research Satellite), and SpaceLab-1 ACRIM (flown on Space Shuttle Columbia, STS 9). ACRIM3 improved on its predecessors by incorporating a new electronics and package design. The Earth Observer captured the initial information from this mission in the article, The ACRIMSAT/ACRIM3 Experiment — Extending the Precision, Long-Term Total Solar Irradiance Climate Database [May–June 2001, 13:3, 14–17]. ACRIMSAT spent 14 years in orbit and ACRIM3 extended the TSI record to 36 years (i.e., building on measurements from previous ACRIM missions).
NASA continued its quest to observe the incident solar energy budget with the launch of the Solar Radiation and Climate Experiment (SORCE) in January 2003. SORCE focused on measuring solar radiation incident to the top of the Earth’s atmosphere. The Total Irradiance Monitor (TIM) onboard continued the TSI record that the ACRIM series of satellites established. In addition to TIM, the satellite carried a Spectral Irradiance Monitor (SIM), an Extreme Ultraviolet (XUV) Photometer System [XPS], and a stellar observation from the Solar Stellar Irradiance Comparison Experiment (SOLSTICE). The satellite has produced groundbreaking TSI and spectral solar irradiance (SSI) measurements – two key inputs for atmosphere and climate modeling.
Early results from SORCE are detailed in the article, The SORCE (SOlar Radiation and Climate Experiment) Satellite Successfully Launched [Jan.–Feb. 2003, 15:1, 16–19]. The article, The SORCE Mission Celebrates 10 Years [Jan.–Feb. 2013, 25:1, 3–13] details the most significant results from a decade of SORCE observations. Designed for a five-year mission, SORCE gathered data until 2020 – although a degradation of a battery power that began in 2008 increasingly hindered data collection for the remainder of the mission. During its time in orbit, SORCE captured two of the Sun’s 11-year solar cycles and observed the solar cycle minimum in both 2008 and 2019. SORCE’s orbit will decay and re-enter Earth’s atmosphere in 2032.
To continue the crucial long-term TSI and the SSI record that SORCE originated, NASA launched the Total and Spectral Solar Irradiance Sensor (TSIS-1) to the ISS on Dec. 15, 2017, which was installed on JEM-EF ELC-3. The satellite’s mission set out to measure the total amount of sunlight that falls on the planet’s surface – see Visualization 1. This data will clarify the distribution of different wavelengths of light. TSIS-1 was introduced in The Earth Observer article, Summary of the 2018 Sun–Climate Symposium [May–June 2018, 30:3, 21–27]. Similar to SORCE, TSIS-1 carries a TIM and SIM. The instrument extends the multidecadal SSI record and provides highly accurate, stable, and continuous observations that are critical to understanding the present climate conditions and predicting future conditions. The most recent efforts from this mission were detailed in the online article, Summary of the 2023 Sun–Climate Symposium, published July 18, 2024. TSIS-1 has been extended by at least three more years as part of the Earth Sciences Senior Review process. A follow-on mission, TSIS-2, is under development to extend the long-term observational record through continued TSI and SSI measurements.
Visualization 1. NASA’s Total and Spectral solar Irradiance Sensor (TSIS-1) measures the total amount of solar energy input to Earth as well as the distribution of the Sun’s energy across a wide range of wavelengths. The animation illustrates the various wavelengths of light that are partially reflected into space at different places in the column of atmosphere above the ground.Visualization credit: NASA
Chronicling the Changing Land Surface
Along with Terra, other satellites also provide global estimates about the land. Each new mission provides the scientific community more information to refine these measurements. These data have improved climate models as well as improved our understanding of how the planet’s interior is altering the surface of the planet.
Measuring Ice and Vegetation Heights
NASA launched ICESat in 2003 on a three-to-five-year mission to provide information on ice sheet mass balance and cloud properties. It carried the Geoscience Laser Altimeter System (GLAS), which combines a precision surface lidar with a sensitive dual-wavelength cloud and aerosol lidar. ICESat was decommissioned seven years after launch. The science team began efforts for the follow-on mission, ICESat-2, which launched on Sept. 15, 2018 – see Figure 13. Data collected during a series of Operation IceBridge field campaigns to the Arctic and Antarctic helped to fill the data gap between the two satellite missions – allowing for continuity of measurements. ICESat-2 carries a payload of a photon-counting laser altimeter on its three-year mission. The laser is split into six beams capable of measuring the elevation of the cryosphere, including ice sheets, glaciers, and sea ice, down to a fraction of an inch. The laser altimeter also gathers the height of ocean and land surfaces, including forests, snow, lakes, rivers, ocean waves, and urban areas. The mission objective includes quantifying polar ice sheet contribution to sea-level change, estimating sea-ice thickness, and measuring vegetation canopy height. The mission was detailed in The Earth Observer article, ICESat-2: Measuring the Height of Ice from Space [Sept.–Oct.. 2018, 30:5, 4–10]. The research community has been using this information to investigate how the ice sheets of Antarctica and Greenland are changing as the planet warms.
Figure 13. Illustration of the Ice, Cloud, and land Elevation Satellite-2 (ICESat-2) spacecraft. ICESat-2 measures the elevation of aspects of the cryosphere, including ice sheets, glaciers, and sea ice. Figure credit: NASANASA’s Global Ecosystem Dynamics Investigation (GEDI – pronounced “jedi”) mission was launched to the ISS on Dec. 5, 2018 and was subsequently installed on the JEM–EF ELC-6. From that vantage point GEDI produces high-resolution laser ranging observations of the three-dimensional (3D) structure of Earth that can be used to make precise measurements of forest canopy height and canopy vertical structure – see Visualization 2. These measurements have improved understanding of important atmospheric and water cycling processes, biodiversity, and habitat. Upon completion of its prime mission, which lasted from December 2018 to March 2023, GEDI was moved from the ISS’s EFU-6 to EFU-7 (storage). Since April 2024, the GEDI instrument has been back in its original location on EFU-6 and continues to collect high-resolution observations of Earth’s 3D structure from space. The GEDI research team hopes the mission can continue collecting data until 2030.
To view this video please enable JavaScript, and consider upgrading to a web browser that
supports HTML5 video
The GEDI mission has been covered in The Earth Observer through summaries of periodic meetings of the GEDI Science Team. The online article, Summary of the 2025 GEDI Science Team Meeting, is the most recent installment of GEDI’s progress, published on Aug. 18, 2025. This article includes discussion of “the return of the GEDI” from hibernation and the science results since then.
Monitoring Earth in Intricate Detail
The Soil Moisture Active Passive (SMAP) mission was designed to measure the amount of water in surface soil across Earth. The satellite was launched from Vandenberg Air Force Base on Jan. 31, 2015. The satellite payload consisted of both an active microwave radar and a passive microwave radiometer to measure a swath of the planet 1000-km (~621-mi) wide. The radar transmitter failed just nine months after launch on July 7, 2015. Although the loss of the radar was unfortunate, the nine months where both instruments functioned provided an invaluable dataset that established the dependence of L-band radar signals on soil moisture, vegetative water content, and freeze–thaw state. Two of these variables (surface soil moisture and freeze–thaw state) are critical variables that influence the planet’s water, energy, and carbon cycles. The three variables influence weather and climate. Furthermore, the SMAP team quickly turned a setback into a success. They repurposed the channels that had been dedicated to the radar to record the reflected signals from the Global Navigation Satellite System (GNSS) constellation in August 2015, making SMAP the first full-polarimetric GNSS reflectometer in space for the investigation of land surface and cryosphere.
The Earth Observer article, SMAP: Mapping Soil Moisture and Freeze/Thaw State from Space [Jan.–Feb. 2015, 27:1, 14–19] offered a preview of SMAP that was published shortly after its launch. A more recent online article, A Decade of Global Water Cycle Monitoring: The Soil Moisture Active Passive Mission, published Aug. 18, 2025, reflects on the achievements of SMAP after a decade of operations.
More specific to vegetation water content, NASA launched the ECOsystem Spaceborne Thermal Radiometer Experiment on Space Station (ECOSTRESS) to ISS on June 29, 2018. It was subsequently installed on the JEM–EF ELC 10, placing it in close proximity to GEDI (installed on ELC 6) and enabling combined observations. While GEDI focuses on the canopy height and related characteristics, ECOSTRESS monitors the combined evaporation and transpiration of living plants – known as evapotranspiration (ET). ECOSTRESS determines ET indirectly through measurements of the thermal infrared brightness temperatures of plants.
As with GEDI, The Earth Observer has reported on the activities of the ECOSTRESS mission. The most recent coverage was in the article, ECOSTRESS 2019 Workshop Summary: Science, Applications, and Hands-On Training [July–Aug. 2018, 31:4, 15–18.]
Last, but certainly not least, the most recent Earth observing satellite to launch is a joint venture between NASA and the Indian Space Research Organization (ISRO). The NASA-ISRO Synthetic Aperture Radar (NISAR) took to the skies on July 30, 2025, from the Satish Dhawan Space Centre on India’s southeastern coast aboard an ISRO Geosynchronous Satellite Launch Vehicle (GSLV) rocket 5. The mission was designed to observe and measure some of the planet’s most complex processes – see Figure 14. The launch was lauded in the Editor’s Corner published online on Sept. 10, 2025.
NISAR uses two different radar frequencies – L-band and S-band synthetic aperture radar (SAR). The dual system can penetrate clouds and forest canopies to allow researchers to measure changes on the planet’s surface, down to a centimeter (~0.4 in). This level of detail allows the research community to investigate ecosystem disturbances, ice-sheet collapse, natural hazards, sea level rise, and groundwater issues. The satellite will also capture changes in forest and wetland ecosystems. It will expand on our understanding of deformation of the planetary crust that can help predict earthquakes, landslides, and volcanic activity. All of this data will help mitigate damage from a disaster and help communities prepare a disaster response. Some early results from the both NISAR radars are discussed in the Final Editor’s Corner column, published online on Dec. 29, 2025.
Figure 14. The NASA-ISRO Synthetic Aperture Radar (NISAR) Synthetic Aperture Radar can observer Earth’s land and ice with unmatched precision, offering real-time insights into earthquakes, floods, and climate shifts. Figure credit: NASA/Jet Propulsion Laboratory–CaltechConclusion
Over the past 36 years, The Earth Observer has borne witness to some of the most monumental scientific achievements of NASA Earth Science and chronicled those stories for the community. While the format of the publication evolved considerably over the years, the satellite missions that have been the focus of this article are one of the primary “lenses” that the newsletter has had to observe and reflect on the story of NASA Earth Science. These continuous global observations have revolutionized society’s knowledge of our home planet and how humans might be altering it.
The staff of The Earth Observer have navigated many different modes of communication over the past three-and-a-half decades, but the commitment to delivering high-quality content has remained constant. It has been the highest honor of every member of our publication team – past and present – to work on this material. While the newsletter is coming to an end, it is hoped that the Archives page continues to be a rich source of historic information about NASA’s EOS and Earth science over the past three and a half decades.
On behalf of the current Editorial Team, we, the authors of this reflection, wish to thank every person who has contributed to the success of this newsletter over the years – and to extend to all in the NASA Earth Science community best wishes for the year ahead and continued success in your remote observation endeavors.
Stacy Kish
NASA’s Goddard Space Flight Center/EarthSpin
stacykishwrites@gmail.com
Alan B. Ward
NASA’s Goddard Space Flight Center/Global Science &Technology Inc.
alan.b.ward@nasa.gov
A Pioneering Study Assesses the Likelihood of Asteroid Mining
A team led by the Institute of Space Sciences (ICE-CSIC) analyzed samples of C-type asteroids in a recent study. Their findings support the idea that these asteroids can serve as a crucial source of materials if and when asteroid mining is realized.
Why Supermassive Black Holes Turn Down Feasts
Supermassive black holes have a reputation for devouring everything in sight, but new observations from the Atacama Large Millimetre/submillimetre Array reveal they can be surprisingly picky eaters. Even when galaxy mergers deliver enormous amounts of cold molecular gas directly to a black hole’s doorstep, many choose to nibble rather than gorge raising questions about what triggers feeding episodes. The discovery suggests black hole growth during galaxy collisions may be far more inefficient and episodic than we previously thought.
Terra: The End of An Era
27 min read
Terra: The End of An EraIntroduction
Launched into the night sky more than 26 years ago, on Dec. 19, 1999, from Vandenberg Air Force Base (now Space Force Base), Terra was NASA’s first Earth Observing System (EOS) flagship mission to study Earth’s land surface from space via a coordinated series of polar-orbiting and low-inclination satellites that produce long-term global observations useful for understanding the interactions between Earth’s atmosphere, land, snow and ice, oceans, and radiant energy balance. Scheduled for a six-year tour, Terra outlasted its life expectancy by nearly two decades. Despite its longevity, Terra’s mission scientists stopped making inclination adjustments in 2020, allowing the satellite to slowly drift out of its contained orbit. The mission team have also begun the painful process of shutting down the five key instruments as the satellite is prepped for retirement.
“Terra’s impressive human legacy stems from the fact that the mission’s history is grounded in NASA icons,” said Nyssa Rayne [NASA Goddard Space Flight Center (GSFC)—Terra Outreach & Communications Coordinator]. “Even today, Terra continues to benefit from legendary figures, including the current project scientist and instrument calibration/validation experts, who have shaped this mission in monumental ways.”
An Auspicious Beginning to More Than Two Decades of Science
Terra’s mission of discovery was designed to provide a better understanding of the total Earth system. When Terra launched, on the cusp of the 21st century, the research community knew very little about how the land interacted with the atmosphere on a regional and continental scale. The community also lacked a way to quantify surface properties, such as albedo, roughness, evaporation rate, and photosynthesis, from satellite data.
Terra was designed, engineered, and programmed to address these knowledge gaps. Often described as a small bus, Terra measures almost 7-m (23-ft) long and 3.5 m (11 ft) across. In the vast expanse of space, however, Terra travels in an orbit around Earth, like a gnat circling the Sphere in Las Vegas. Carried into space aboard an Atlas-Centaur IIAS expendable launch vehicle from Vandenberg Air Force Base, CA, Terra was placed in orbit 705 km (438 mi) above the planet’s surface, capturing a viewing swatch from each overpass that could be stitched together to produce whole global images. Its flight path was designed to cross the equator to coincide with the time of day when cloud cover along the equator was at a minimum (10:30 AM mean local time).
Five Instruments Wrapped in a Silver Package
First named EOS-AM1, the concept of the Terra mission was envisioned in the 1980s and implemented in the 1990s. Terra builds on the lessons learned from past pioneering programs, including the Upper Atmosphere Research Satellite (UARS), Landsat, the Ocean Topography Experiment (TOPEX)/Poseidon, and the series of Total Ozone Mapping Spectrometer (TOMS) instruments. After many scientific conversations and arguments, it was finally decided that Terra would carry five instruments capable of gathering data that would benefit a variety of Earth scientific disciplines – see Figure 1. An international effort, Terra carries instruments from the United States, Japan, and Canada that allow scientists to document relationships between Earth’s systems and examine their connections. The five instruments include:
Advanced Spaceborne Thermal Emission and Reflection Radiometer (ASTER), which obtains high-resolution images of Earth at 14 different wavelengths of the electromagnetic spectrum that can be used to create detailed maps of land surface, temperature, emissivity, reflectance, and elevation;
Clouds and the Earth’s Radiant Energy System (CERES), which measures Earth’s total radiation budget as well as cloud property estimates that enable scientists to clarify the role that clouds play in the planet’s radiative flux;
Measurement of Pollution in the Troposphere (MOPITT), which measured the distribution, transport, source, and sinks of carbon monoxide (CO) in the troposphere;
Multi-angle Imaging SpectroRadiometer (MISR), which improves the field’s understanding of the fate of sunlight in Earth’s environment, distinguishing between different types of clouds, aerosol particles, and surfaces; and
Moderate Resolution Imaging Spectroradiometer (MODIS), which combines data gathered from CERES and MISR to determine the impact of clouds and aerosols on the Earth’s energy budget.
Figure 1. An artistic rendering of the Terra spacecraft that shows the location of five instruments in its payload: Advanced Spaceborne Thermal Emission and Reflection Radiometer (ASTER), Clouds and the Earth’s Radiant Energy System (CERES), Measurement of Pollution in the Troposphere (MOPITT), Multi-angle Imaging SpectroRadiometer (MISR), and Moderate Resolution Imaging Spectroradiometer (MODIS). Terra carries two CERES instruments and one each of the other four. Figure credit: NASAFocusing a Zoom Lens on Earth
“ASTER’s accurate topographic data will be used for engineering, energy exploration, conserving natural resources, environmental management, public works design, firefighting, recreation, geology and city planning, to name just a few areas,” Michael Abrams [NASA Jet Propulsion Laboratory—U.S. Principal Investigator] told Universe Today in a June 30, 2009 article.
ASTER was designed to capture high-resolution images of Earth. The data cover a range of land scales – anything from the size of 14 bath towels (15 m2 per pixel) to one-fifth of a basketball court (90 m2 per pixel). The instrument was developed as a partnership between NASA, Japan’s Ministry of Economy, Trade and Industry (METI), the National Institute of Advanced Industrial Science and Technology (AIST) in Japan, and the Japan Space Systems (J-spacesystems).
ASTER consists of three telescopes – Visible Near-Infrared (VNIR), Short-Wave Infrared (SWIR), and Thermal Infrared (TIR). (The SWIR is no longer operational.) All three instruments point perpendicular to the direction of motion to change the viewing angle and produce stereoscopic images of our planet. The three telescopes also gather high-resolution images at 14 different bands of the electromagnetic spectrum, ranging from visible to infrared light.
The instrument’s data are used to create detailed maps of land surface temperature, reflectance, and emissivity, how effectively a surface emits thermal radiation. ASTER also produces detailed views of the effects of Earth’s landforms and topography – see Figure 2. These data are used to understand factors that control climate conditions, e.g., evaporation, water flow, and mass movement. It can also be used to explore how fire can change Earth’s surface.
Figure 2. A topographic map of San Francisco, CA developed with Advanced Spaceborne Thermal Emission and Reflection Radiometer (ASTER) data using Global Digital Elevation Model Version 3. Shading represents different elevations of relief. Figure credit: NASA/ Ministry of Economy, Trade and Industry/Advanced Information Systems Technology/Japan Space Systems, and U.S./Japan ASTER Science Team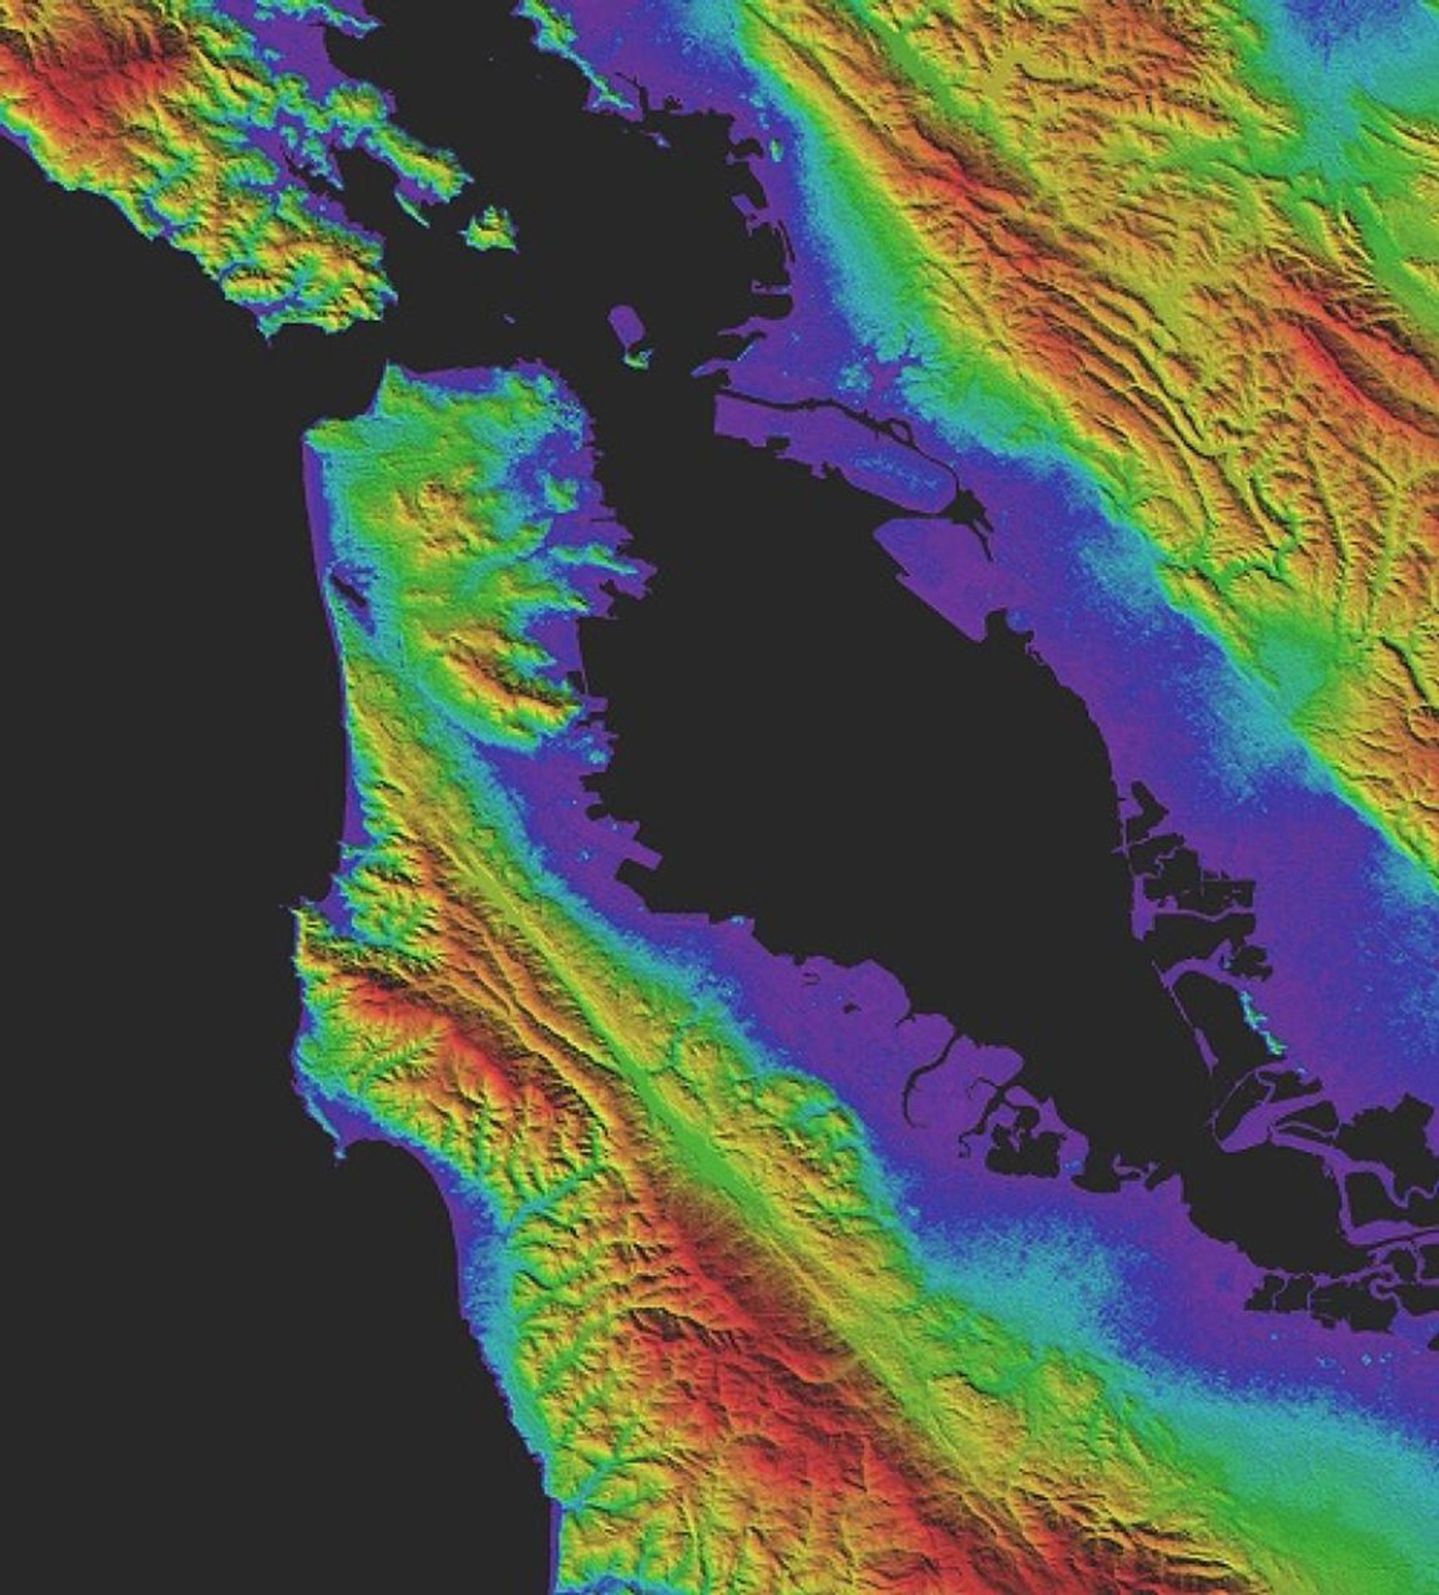
Earth’s Reflection Affects Climate
“Earth’s climate is really driven by a delicate balance between how much of the Sun’s energy is absorbed by the Earth as visible light, and how much the Earth emits to space in the form of infrared radiation,” Norman Loeb [Langley Research Center—PI] told EarthSky in a Nov. 30, 2009 article. “The objective is to observe the Earth’s radiation budget, together with the clouds…over several years, and preferably over several decades, [that] enables us to improve our understanding of how the climate system is changing and really provides an invaluable resource for testing climate models that are used to simulate future climate change.”
Terra maintains two CERES instruments that measure albedo, or solar radiation reflected from Earth’s surface, and emitted thermal infrared radiation. It also explores the role that clouds play in modulating radiative fluxes by examining solar-reflected and Earth-emitted radiation from the land surface to the top of the atmosphere.
CERES was developed at NASA’s Langley Research Center. Terra has two CERES instruments onboard – although one is no longer functional. While they were both operational, one CERES instrument would gather information using cross-track scan mode, where a mirror sweeps back and forth, perpendicular to the sensor’s path. This mode builds two-dimensional images of Earth. The second instrument would gather information in biaxial scan mode, where scanning occurs along two different axes simultaneously. These data provide angular flux information to derive Earth’s radiation balance.Now, Terra’s remaining functional CERES instrument operates in biaxial scan mode and has done so while Terra has drifted from its 10:30 MLT equator crossing time toward earlier MLT crossings.
Researchers pair CERES data with other instruments on Terra to create a fully resolved global diurnal cycle of Earth’s radiation budget at the surface and at different layers of the atmosphere, including the top of the atmosphere. The CERES data products capture variations in Earth’s radiation budget at hourly, daily, and monthly timescales. Climate, weather, and applied science research communities use this data to address a range of research topics that involve the exchange of energy between Earth and space and between the major components of the Earth system – see Figure 3. The article, The State of CERES: Updates and Highlights, published Dec. 29, 2025, contains more details on the current status of the CERES instruments flying on Terra and other platforms as well as summaries of the latest science results.
Figure 3. Sea surface temperature gathered by Terra’s Clouds and the Earth’s Radiant Energy System (CERES) instrument on Jan. 1, 2023. Warm surface water is depicted by red and cooler surface water is depicted by blue and green. Figure credit: NASA Worldview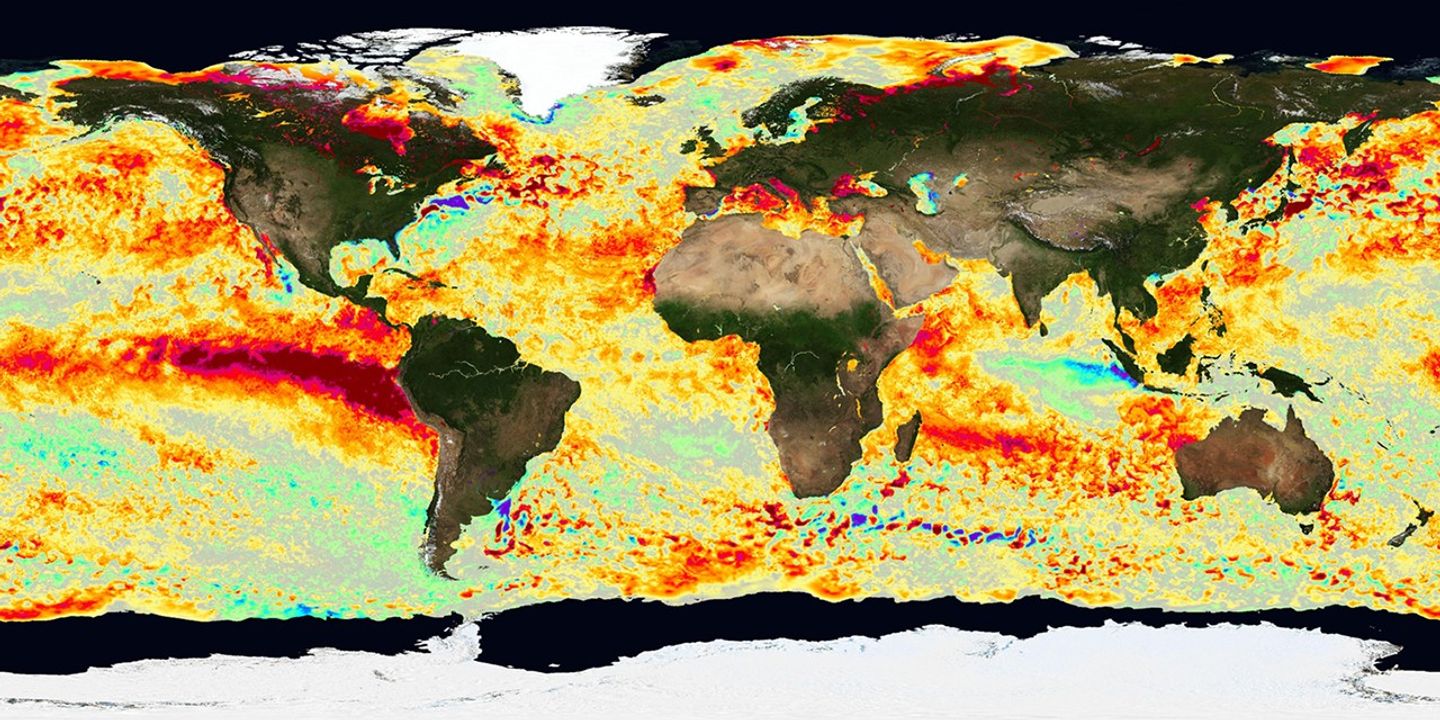
Checking in on the Lower Atmosphere from Space
MOPITT was designed to obtain information about the lower atmosphere – especially as it interacts with the land and ocean biospheres. It was developed as a joint project between the Canadian Space Agency, the University of Toronto, and the National Center for Atmospheric Research (NCAR) in Boulder, CO. The instrument has a spatial resolution of 22 km (14 mi) and covers a swath of Earth’s surface about half the size of Los Angeles [640 km (398 mi)].
MOPITT uses gas correlation spectroscopy to measure the concentration, fate, and distribution of CO, a product of car exhaust, forest fires, and factory exhaust. MOPITT offers near-global coverage every three days of the region being scanned – see Figure 4. These data help scientists identify sources of regional pollution, monitor regional pollution patterns, and track the long-range transport of pollutants.
MOPITT was the longest running record of CO concentration collected from space. The dataset is often combined with MISR data to map aerosols and CO to track sources of air pollution. On April 9, 2025, MOPITT was the first casualty of Terra’s slow demise. It was turned off to conserve energy for the remaining four instruments.
Figure 4. A map of the average carbon monoxide (CO) concentration gathered by Terra’s Measurement of Pollution in the Troposphere (MOPITT) over North America in August 2024. Figure credit: Measurement of Pollution in the Troposphere Instrument Operations Centre, University of Toronto
Focusing on the Tiniest Particles from Multiple Perspectives
“The MISR team has pioneered novel methods for tracking aerosol abundances and particle properties, cloud and aerosol plume heights, height-resolved wind vectors, ice and vegetation structures, and other physical attributes of our planet,” said David Diner [NASA/Jet Propulsion Laboratory—MISR PI]. “These efforts and those of the broader scientific community have led to key insights about how the Earth’s climate and environment are changing.”
MISR was developed at NASA’s Jet Propulsion Laboratory to measure variations of surface and cloud properties as well as aerosols – see Figure 5. These data are used to evaluate the long-term interactions between sunlight and aerosols in the atmosphere and on Earth. Researchers can use MISR data to monitor the monthly, seasonal, and long-term trends in the amount and type of atmospheric aerosol particles.
MISR trains its nine cameras on Earth to capture images from multiple angles that gather reflected sunlight scattered by Earth’s surface, clouds, and suspended airborne particles within a 360-km (224-mi) swath of land. One camera points to the lowest point, while others provide forward and aft-ward view angles at 26.1°, 45.6°, 60.0°, and 70.5°. As MODIS flies overhead, each region of Earth’s surface is successively imaged by all nine cameras in each of four wavelengths that span the visible and infrared spectrum. Its capabilities allow measurements of natural and human-caused particulate matter in the atmosphere, particulate abundance and type, heights of aerosol plumes and cloud tops, along with their speed and direction of motion and the types and extent of land surface cover.
Figure 5. Multi-angle Imaging SpectroRadiometer (MISR) images of aerosol optical depth (AOD) from the new aerosol product in the form of three-month moving averages. The data presented were collected in 2006. Figure credit: NASA’s Atmospheric Science Data Center
According to Diner, outdoor airborne fine particulate matter constitutes the largest environmental health risk worldwide. This fine particulate matter are responsible for millions of premature deaths per year as well as a wide range of adverse human health outcomes. Terra revolutionized the study of these particles, making it possible for researchers to distinguish aerosols resulting from natural and anthropogenic sources and to investigate how different types of aerosols impact human health. Diner points to how MISR data has been used to examine particulate matter in regions of rapid urbanization, such as Asia and North Africa, as well as track aerosol transport after wildfires.
“MISR’s greatest achievement is the diversity of scientific investigations and research papers that have resulted from its unique observational approach,” he said. Diner also points to the associated retrieval algorithms, which have produced an unprecedented data record spanning more than two and a half decades.
The Swiss Army Knife in Terra’s Toolkit
MODIS was designed to monitor atmospheric, land, and oceanic processes, including surface temperature, ocean color, global vegetation, cloud characteristics, temperature and moisture profiles, and snow cover. The instrument was developed at NASA’s Goddard Space Flight Center. It provides large-scale coverage, about 2300 km (~1429 mi) of land at a spatial resolution of 250 m (~820 ft). MODIS can visualize every point on Earth every one to two days. This approach is ideal for tracking a variety of Earth’s systems. It measures the distribution and properties of clouds, as well as aerosols, water vapor, and temperature. MODIS data are also used as input to a radiative transfer model that calculates radiative fluxes at the surface and within the atmosphere.
Figure 6. An image of Typhoon Ragasa captured on Sept. 18, 2025 in the western Pacific Ocean a few hundred miles east of the Philippines. Figure credit: NASA Earth Observatory image by Wanmei Liang, using MODIS data from NASA EOSDIS LANCE and GIBS/Worldview
MODIS data helps scientists determine the amount of water vapor in a column of the atmosphere and the vertical distribution of temperature and water vapor, measurements that are crucial to understanding Earth’s climate system. MODIS also uses visible images and remotely sensed data to monitor changes in land cover by natural forces, such as fires, or anthropogenic changes, such as cropland burning and farming. MODIS data help researchers understand photosynthetic activity of plants on land and in the ocean to improve estimates of the gaseous mixture in the atmosphere. MODIS data also improves weather models and forecasts that can prepare communities for major storm events – see Figure 6.
Researchers combine atmospheric models developed using MODIS data with aerosol products from MISR data to create a generation of maps of near-surface particulate matter concentrations that have been used in numerous health studies. One such study is the Global Burden of Disease, which estimates that more than four million premature deaths occur each year due to exposure to airborne particles.
Data, Data Everywhere, Managing Decades of Information
Terra instruments have been in operation since the satellite was launched more than a quarter of a century ago. The technology at the time was state-of-the-art, allowing Terra to complete more than 100,000 orbits, downloading and transmitting data twice during each orbit to ground stations in Alaska, Norway, and NASA’s Wallops Flight Facility. Terra has produced the longest record of environmental data providing the research community a way to evaluate the effects of natural and human-induced changes in the environment.
The five (now four) instruments gather near real-time data for use in monitoring and managing on-going events. The vast amount of data has generated 87 data products that are distributed through the Land Processes Distributed Active Archive Center (LPDAAC), the Atmospheric Science Data Center (ASDC), the Ocean Color Web, the Atmosphere Archive and Distribution System, and the National Snow and Ice Data Center (NSIDC). The datasets work in concert with other data products to expand the scientific community’s knowledge about Earth systems, resulting in more than 27,000 scientific publications.
The EOS Data and Information System (EOSDIS) provides end-to-end capabilities for managing science data as part of the Earth Science Data Information System (ESDIS). It processes Level 1–4 data products. For those wishing to learn more, The Earth Observer published a comprehensive review of NASA’s Earth Science Data Operations (as of 2017) in the article, Earth Science Data Operations: Acquiring, Distributing, and Delivering NASA Data for the Benefit of Society [March–April 2017, 29:2, 4–18].
Terra’s data in the EOSDIS archive constitute an invaluable two-decade-long record of a wide range of Earth processes. Higher level data processing is completed by Science Investigator-led Processing Systems. In addition, data is available in a variety of archives. Earthdata Search and Earth Explorer make all ASTER products available to all users at no cost. It contains Level-1 (L1A), L1B, L1T data, as well as data from the Global Digital Elevation Model and the North American ASTER Land Surface Emissivity Database. The U.S. Geological Survey Global Visualization Viewer (GLoVis) and ASTER/AIST data archives allow users to search the entire ASTER data archive using a browser interface. Application for Extracting and Exploring Analysis Ready Samples (AppEEARS) offers a simple and efficient way to access and transform geospatial data from a variety of federal data archives. It allows users to subset geospatial datasets using spatial, temporal, and band/layer parameters.
Over the past two decades, Terra’s data acquisition process has transitioned from scheduled downloads to data-driven acquisition. In a 2020 EarthData article, Greg Dell [Earth Science Mission Operations—Project Deputy Director-Operations] explained the priorities in managing data moving from a model of producing a long-term record for the research community to getting data that the scientific community can use as quickly as possible.
“This is a big paradigm shift over the course of the mission,” said Dell. “We’ve been able to accommodate this paradigm shift with ground automation and better, faster networks.”
Crunching the reams of data gathered by Terra’s five instruments requires a series of algorithms so the scientific community can use it effectively. The acknowledgement of this need began at the launch of the mission, with the creation of the Algorithm Theoretical Basis Documents (ATBDs). ATBDs provided the theoretical basis – both the physical theory and the mathematical procedures and possible assumptions being applied – for the calculations that have to be made to convert the radiances received by the instruments to geophysical quantities. Even in Terra’s early days, developers invited panelists from around the world to evaluate algorithmic iterations to assess the strengths and weaknesses of the code. This perspective has continued with the review of newer algorithms by the user community to ensure they can use the data effectively.
In a continued momentum toward transformation, NASA funded the development of Terra Fusion, a new dataset and toolkit that merges the data gathered by the five instruments into a format and spatial context to be used by scientists. The one dataset approach allows the community to find synergy to address large, real-world problems. Data fusion continues to facilitate new research into air pollution, smoke from wildfires, clouds and aerosols, ocean biology, agriculture and land use, vegetation dynamics, hydrology, Earth’s radiation budget, and other Earth science fields that have traditionally used Terra data.
Terra Science Gives Back to Communities Around the World
According to Rayne, since it began in 1988, the idea behind EOS was that interdisciplinary science teams would collaborate with NASA groups to address real-world problems. This unique approach brought together teams that previously may have been siloed across the agency and academia to increase the momentum driving team science. These efforts have yielded impressive outcomes that have advanced various scientific fields but also benefited people around the world. The following subsections describe ways that Terra data have been applied to a variety of topics of societal interest and importance.
Chasing the Path of Totality During an Eclipse
While an eclipse is not highly unusual, it is an exciting event to witness. The shadow that forms when the Moon blocks the Sun’s radiation briefly changes the environment, dropping atmospheric temperature, quieting birds, and imparting an eerie sense of awe. Often these events do not cross heavily populated parts of the planet. During the past quarter century, Terra has had several opportunities to observe eclipses from its orbital vantage point – a prime location to follow the path of totality where the Sun’s rays are completely blocked from Earth’s surface.
Not long after Terra’s launch, the Moon cast a shadow that moved across southeast Asia and North America during an annular solar eclipse on June 20, 2002. Few regions were within the path of totality to witness this event, but MISR on Terra trained its nine cameras along the path to monitor the effect of the eclipse as it passed the central Pacific Ocean.
MODIS also captured true-color images of an exceptionally long total solar eclipse on July 2009 that reached 6 minutes and 39 seconds. The path of totality crossed Japan, Korea, and eastern China.
During the August 2017 eclipse, the path of totality cut across the United States, with a shadow passing over Oregon, Idaho, Wyoming, Nebraska, Kansas, Missouri, Illinois, Kentucky, Tennessee, North Carolina, Georgia, and South Carolina. MODIS captured false-color images of the shadow – see Figure 7. It was the first eclipse to cross the entire continent in almost 100 years and the first to travel coast-to-coast since the founding of the country in 1776. The Earth Observer reported on this remarkable event in NASA Provides Unique Views of the 2017 “Eclipse Across America” [Sept.–Oct. 2017, 29:5, 4–17].
Figure 7. Terra’s Moderate Resolution Imaging Spectroradiometer (MODIS) sensor captured the data used to create the composite image during several overpasses that were collected at different times. Figure credit: Joshua Stevens and Jesse Allen [both: NASA Earth Observatory]
Finally, Terra’s location was not ideal to capture the April 8, 2024 path of totality that crossed over the eastern United States and Canada. However, the satellite was able to capture most of the shadow with limited visible contrast. The Earth Observer staff participated in festivities and covered the event in the article, “Looking Back on Looking Up: The 2024 Total Solar Eclipse,” published on Aug. 22, 2024.
Monitoring Remote Regions for the Spark of a Flame
Terra provides the bird’s eye view of the planet’s surface that is perfect for monitoring remote regions. This vantage point is beneficial for land managers who use Terra’s data to inform decisions and prepare communities for threats, including wildfire and hurricanes. Data from Terra can also be used to map changes to an ecosystem after a fire event.
Terra’s MODIS produced false-color image of the area ravaged by the Camp Fire in 2018, which spanned an area roughly the size of Chicago. Researchers, fire management, and policy makers could interactively browse more than 700 global, full-resolution satellite image layers. The images were paired with underlying data to monitor and evaluate the scarred region – see Figure 8.
Figure 8. A map showing the extent of the Camp Fire in 2018, which was composed using data from the Moderate Resolution Imaging Spectroradiometer (MODIS). The red, black, gold, orange, and green markings indicate different structures in the region affected by the wildfire. The red structures were destroyed completely during the fire. The black structures remained untouched. Green, yellow, and orange structures experienced a degree of fire damage (10–50%). More than 13,000 residential buildings, 500 commercial buildings, and 4,000 other buildings were destroyed in the fire. Figure credit: NASA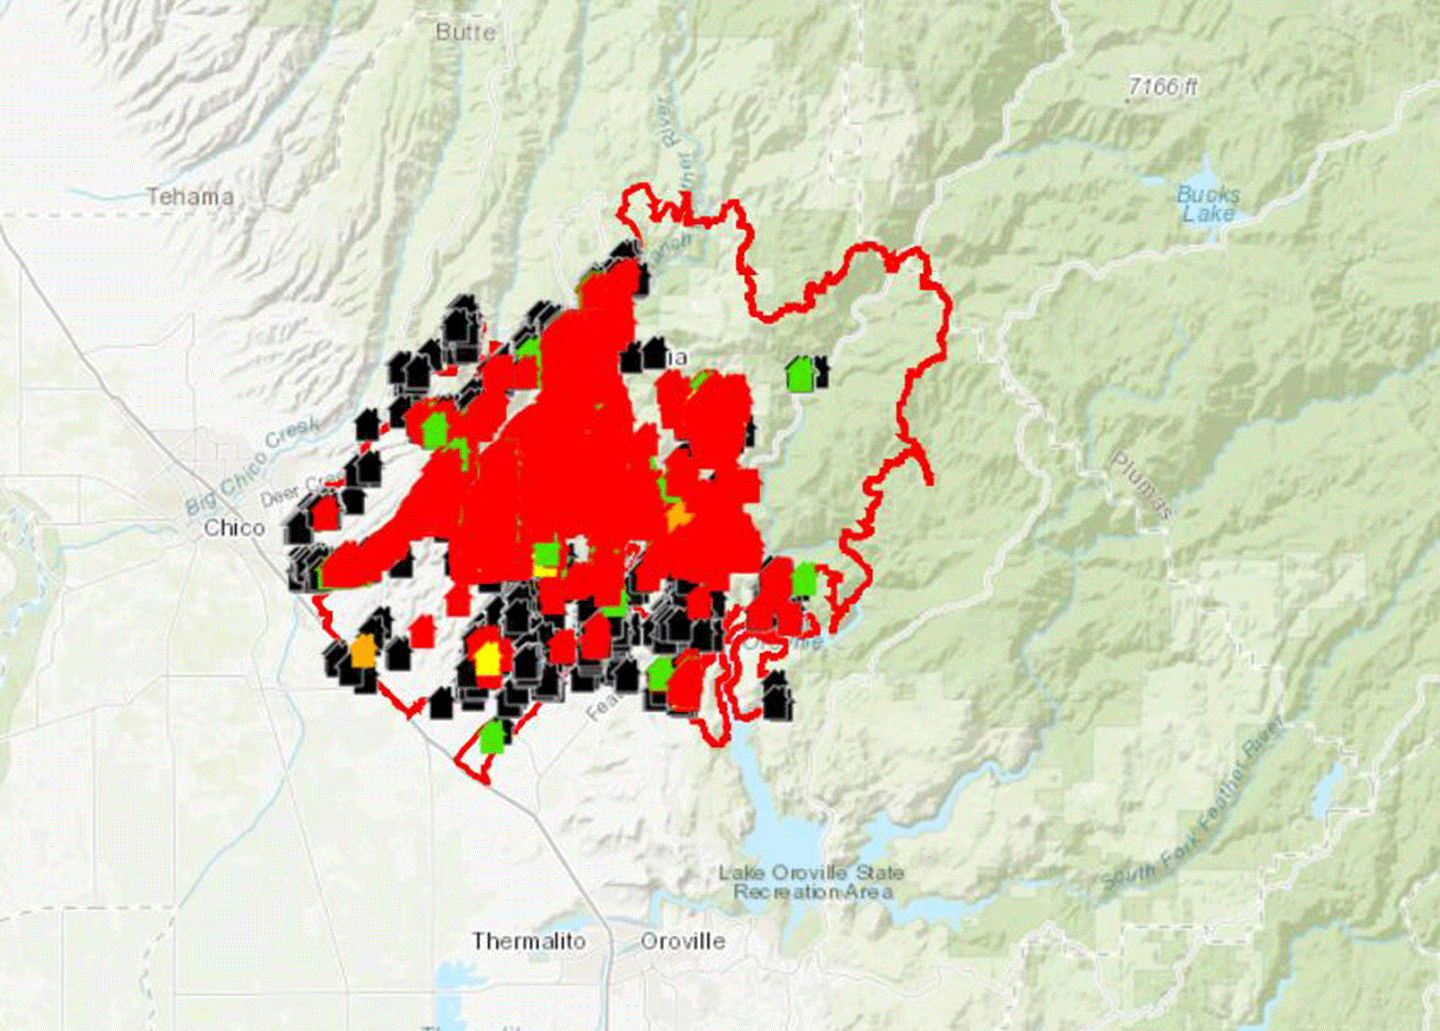
Terra has also captured images from fires in the state of New South Wales in southeastern Australia. In November 2019, the fire season began early with Terra capturing smoke on the edge of the continent. The resulting 70 fires that season destroyed 1.1 million hectares (2.7 million acres). In addition to monitoring the fire damage after containment, scientists use Terra data to monitor the movement of smoke across the continent and around the planet.
The following year, Terra captured images of California’s Mineral fire, which began in July 2020 and grew to more than 11,000 acres (17 mi2) amid favorable fire conditions of high winds and dry grass and timber in the region. Fire management used MODIS information to monitor sparks that had potential for starting new fires. This information helped determine evacuation orders and kept surrounding communities apprised of the fire’s movement.
Heavy Rain Inundates the Outback
Researchers use the instruments on Terra to provide a set of eyes to monitor for fires, but it is also beneficial for monitoring flood conditions. Channel Country in the Australian outback is a region that experiences cycles of drought and flood. During periods of heavy rainfall, the excess water drains to a nearby lake. The wet periods can promote growth in pasture lands and support wetlands and endemic species.
In March 2025, this region received unusually heavy rain. In one week, more than a year’s worth of rain fell, swelling multiple rivers and inundating roadways that isolated small towns and grazing lands for weeks. MODIS captured images of flooding across the region – see Figure 9. Officials used the images from Terra and Landsat to direct helicopter evacuations of citizens and livestock.
Experts monitored the region in real time throughout the event. They cited several factors for the unusually heavy rain, including streams of humid air from the north and east that converged over interior Queensland. They also pointed to a low-pressure trough that drove the moisture-laden air to higher and cooler levels of the atmosphere, triggering the formation and release of heavy rain.
Figure 9. The Moderate Resolution Imaging Spectroradiometer (MODIS) captured wide-spread flooding across western Australia on March 29, 2025. The false-color images of the region show water (dark and light blue), land (brown), and vegetation (green). Figure credit: NASA Earth Observatory images by Michala Garrison, using Landsat data from the U.S. Geological Survey and MODIS data from NASA EOSDIS LANCE and GIBS/Worldview
Tracking Churning Ice from Space
Explorers have sought a shortcut from the Atlantic to the Pacific Ocean for centuries. The race for the Northwest Passage was supercharged in the 19th century to shore up trade routes. Many explorers accepted this challenge, and many lives were lost in the quest. It was not until 1905 that Roald Amundsen successfully navigated the Arctic Ocean, emerging into the Pacific Ocean from the Amundsen Gulf, named on his behalf.
The Arctic Ocean continues to be an area of interest today, not only for trade, but also because of the valuable mineral resources along the surrounding shallow continental shelf. Yet, this region still remains tricky to navigate due to chaotic growth and movement of sea ice around the confined northern ocean.
MODIS captured images of this remote region of the planet, offering a bird’s eye view of stationary ice clinging to the shallow shelf. Using this information, researchers studied the seasonal break-up of ice in 2024. They noted the churning, slow rotation of the ice before chocking the few outlet paths into the Atlantic and Pacific Oceans – see Figure 10. Monitoring the release of icebergs updates the status of navigating shipping lanes.
Figure 10. Terra’s Moderate Resolution Imaging Spectroradiometer (MODIS) captured floating fragments of sea ice flowing across the Fram Strait, a 450-km (280-mi) passage between the Arctic Ocean and the Greenland Sea. Figure credit: Wanmei Liang [NASA Earth Observatory]
An Eye on an Eruption
MODIS is also beneficial in monitoring volcanic eruptions from space. On Jan. 18, 2017, Terra passed over Alaska and captured an ash plume emanating from the Bogoslof Volcano on Bogoslof Island along the southern edge of the Bering Sea – see Figure 11. Researchers from the Alaska Volcano Observatory (AVO) in collaboration with the U.S. Geological Survey, the University of Alaska Fairbanks Geophysical Institute, and the Alaska Division of Geological and Geophysical Surveys produced updates as the eruption evolved. The group issues one of four levels of alert ranging from calm (green) to imminent eruption (red). AVO announced a red alert for Bogoslof on Jan. 19, 2017. Beyond the ash plume, the cloud of debris produced cumulonimbus clouds that resulted in lightning strikes.
Figure 11. NASA’s Terra Satellite captures the eruption of the Bogoslof volcano in Alaska, emitting steam and ash around 9:00 PM on Jan. 3, 2017. Figure credit: Jeff Schmaltz [Moderate Resolution Imaging Spectroradiometer (MODIS) Rapid Response Team]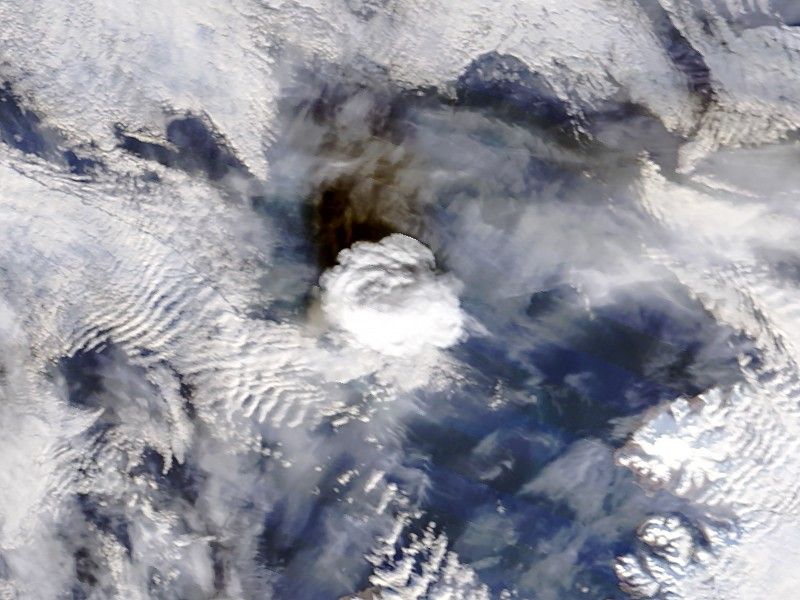
Tracking Lumbering Atmospheric Monsters
Terra instruments provide researchers information about the location and intensification of tropical storms in the Atlantic Ocean and cyclones in the Pacific Ocean. The National Hurricane Center uses information from Terra and other satellites to observe the storm and predict its potential path before issuing watches and warnings to communities in the line of danger.
On Sept. 2, 2008, a disturbance n in the North Atlantic Ocean caught the scientific community’s attention. The storm received a name – Omar – and Terra offered one of the many lenses to monitor its movement across the Atlantic – see Figure 12. The following day, Omar was downgraded to a tropical depression but then it moved over a warm patch of ocean water – allowing it to rapidly intensify into a category 4 hurricane. Forecasters relied on the constant stream of information from Terra’s instruments to update their models and keep the community apprised of the storm’s movement to prepare and make plans for evacuation.
Figure 12. NASA’s Terra satellite produce an image of hurricane Omar as the storm faced strong wind shear on Sept. 2, 2008 in the North Atlantic Ocean. Figure credit: NASA Worldview, Earth Observing System Data and Information System (EOSDIS)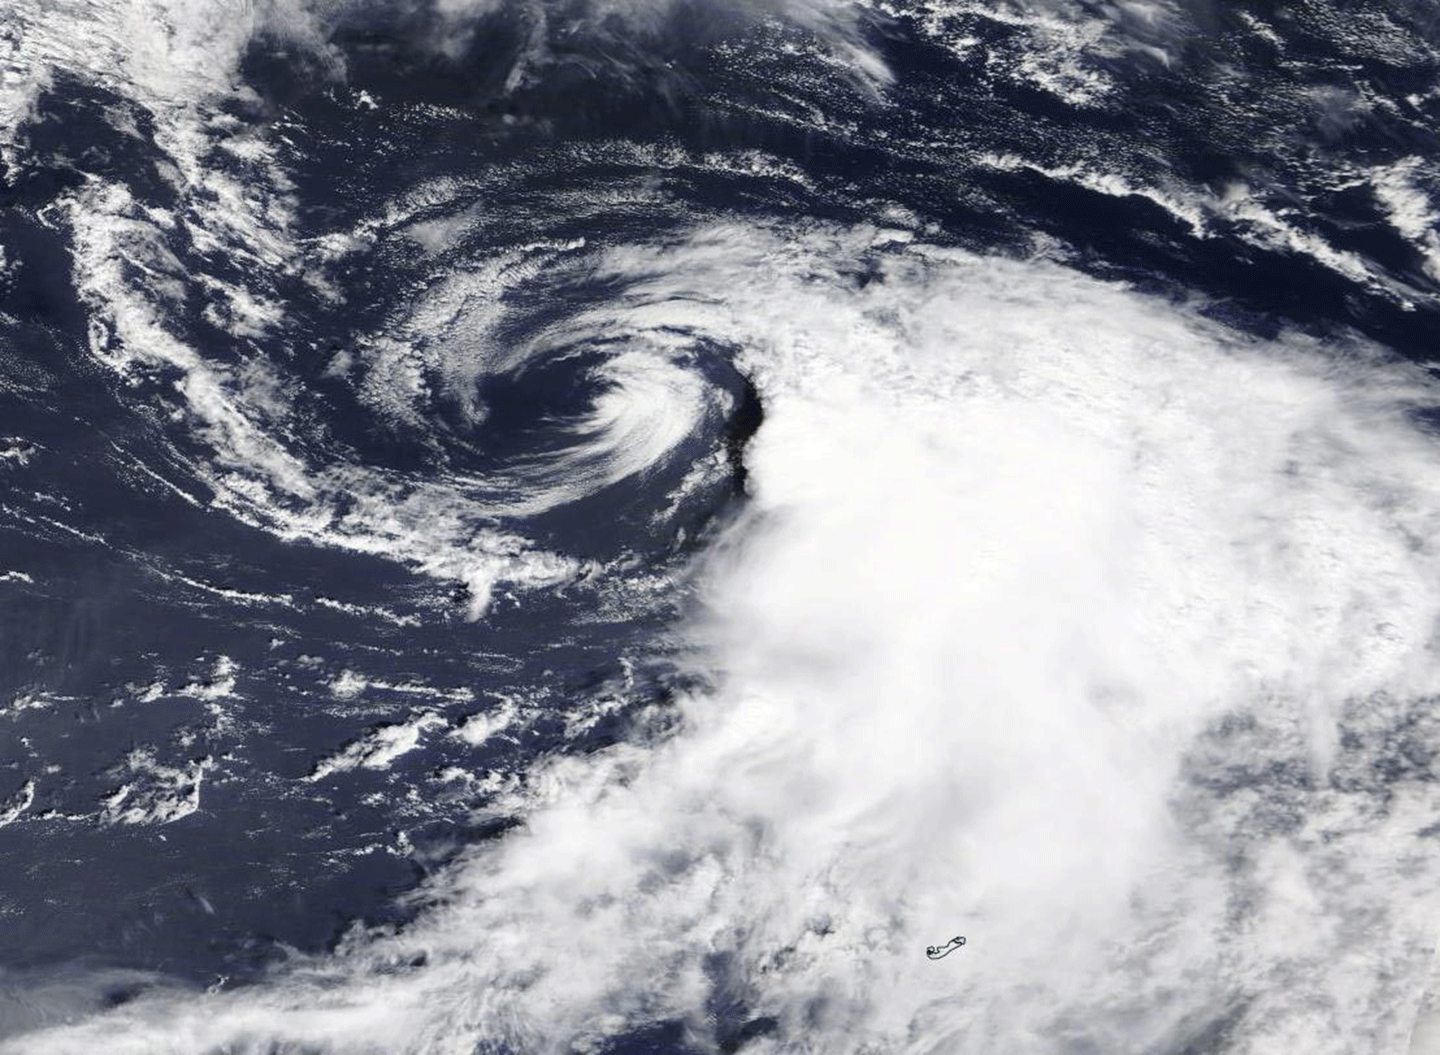
During the early months of the COVID-19 pandemic, Terra continued to monitor the planet from high above. On Aug. 25, 2020, MODIS produced images of a collection of thunderstorms at the center of an intensifying hurricane, named Laura, forming in the Gulf of Mexico. MISR trained its nine cameras on the storm to gather information on changing windspeed and cloud-top height as the storm intensified – see Figure 13. Laura made landfall at Cameron, LA at 1:00 AM as a category 4 hurricane, with sustained winds of 150 mph (130 knots). The hurricane was the strongest storm to hit southwest Louisiana since 1851 when storm records were initiated.
Figure 13. On Aug. 25, 2020 at 12:35 AM EDT, the Moderate Resolution Imaging Spectroradiometer (MODIS) captured the most powerful thunderstorms (yellow) around the eye of hurricane Laura. The temperature at the top of the clouds descended to -80 °F (-62.2 °C). Figure credit: NASA/National Renewable Energy Laboratory
Far Surpassing the Six-year Lifespan… but an Inevitable Decline
Since its launch, Terra has consistently orbited Earth from pole to pole, training all five instruments on the planet’s surface and gathering simultaneous data, with the Earth Science Mission Operations (ESMO) team vigilantly monitoring the satellite’s energy and performance day and (until quite recently) night. As the satellite aged, the team began performing periodic inclination adjustments to maintain the satellite’s orbit and preserve its fuel supply to ensure it could continue to collect data. Their oversight has been so effective that a mission designed with a six-year lifetime continues to operate in 2026. This unplanned longevity is true for all three of the EOS flagships. The article, The Earth Observer: Offering Perspectives from Space through Time, published Dec. 29, 2025, has more to say about the development of Terra and other the EOS flagship missions and the observations made by NASA’s Earth observing fleet.
Inevitably, the decades in Earth’s orbit has taken a toll on the flight hardware. Eventually the fuel to keep the satellite stable in its orbit will run out – even if the instruments onboard are still functioning nominally. To conserve Terra’s remaining fuel to allow for controlled reentry into Earth’s atmosphere and to extend science operations aa long as possible, in late 2020 NASA Headquarters decided it was time to stop making adjustments to maintain Terra’s orbit. As a consequence, the satellite has begun to drift in its orbit, slowly sliding into an earlier equator crossing time. By Fall 2022, Terra’s orbit lowered to about 5 km (3 mi) and began crossing the equator at 10:15 AM. While these changes seem significant, they only created minor adjustments to orbital repeat time and swath width. The research community continued to gather data about atmospheric dynamics, water and energy cycles, atmospheric chemistry, physical and radiative properties of clouds, air-land exchanges of energy, carbon and water, and vertical profiles of CO vulcanology. The Earth Observer discussed the consequences – and opportunities – of these orbit shifts to Terra (and Aqua and Aura) in the article NASA Holds Discussions about the Future of the EOS Flagship Missions [Jan.–Feb. 2023, 35:1, 13–17].
Along with the adjustments in Terra’s orbit, the satellite has also experienced power limitations due to slow degradation of the battery that powers the spacecraft. While ESMO and the instrument Science Teams managed these reductions for as long as possible without impacts on science, early this year the first sacrifice had to be made. MOPITT was switched to safe mode on Feb. 1, 2025 and then turned off on April 9, 2025. As of this writing, the remaining four instruments continue to function, with limitations to the ASTER telescopes.
“It really is a testament to great work by the entire team for being able to keep this spacecraft up in the air and healthy and to be able to produce like it has,” Terri Wood [EDOS—Project Manager] told EarthData in 2020. “It’s people, processes, and programs that make this happen. I just think it’s a real testament to what we can do around here.”
Since Terra’s launch, NASA has sent a series of satellites into orbit to explore the planet’s surface and ultimately learn more about our home. The Afternoon Constellation (A-Train) consisted of five NASA satellites – Aqua (launched in 2002), Aura (launched in 2004), the second Orbiting Carbon Observatory (launched in 2014), the Cloud-Aerosol Lidar and Infrared Pathfinder Satellite Observations (CALIPSO), and CloudSat (both launched in 2006), as well as international partner missions. More information on the A-Train satellites are available in the article, “The Earth Observer: Offering Perspectives from Space through Time,” referenced earlier. These eyes in the sky continue to produce the data that scientists need to answer long-standing questions and tackle complex concerns with new, imaginative approaches.
A Bittersweet Conclusion
Terra began as a spark of imagination during collective conversations among the scientific community more than 40 years ago. This unique approach to team science has resulted in one of the first satellites to study Earth from a holistic perspective, gathering data about the land, water and the atmosphere at the same time, contributing to a diverse collection of scientific disciplines to tackle large questions through team science. Unlike many previous, smaller satellites, Terra was designed from scratch with state-of-the-art technology. The exquisite design ensured each instrument continued to collect data long past the six-year lifespan, offering scientists around the world a long-term record of the planet.
As Terra reaches its conclusion, it will be joined by two sister satellites – Aqua and Aura. The loss of these three EOS flagship satellites, launched more than 20 years earlier, will change the way scientists monitor Earth and affect our understanding of the radiative balance of the planet. May the final years of Terra ignite the imagination of the next generation of scientists to catapult the study of our planet for generations to come.
“Terra was the quintessential and most significant of all of the EOS satellites that made contributions to all aspects of Earth science,” said Michael King [Earth Observing System—former Senior Project Scientist and MODIS—Team Lead]. “All five of the Terra [instruments] made significant and, in many cases, first-of-a-kind global observations relevant to climate change.”
Stacy Kish
NASA’s Goddard Space Flight Center/EarthSpin
stacykishwrites@gmail.com
Terra: The End of An Era
27 min read
Terra: The End of An EraIntroduction
Launched into the night sky more than 26 years ago, on Dec. 19, 1999, from Vandenberg Air Force Base (now Space Force Base), Terra was NASA’s first Earth Observing System (EOS) flagship mission to study Earth’s land surface from space via a coordinated series of polar-orbiting and low-inclination satellites that produce long-term global observations useful for understanding the interactions between Earth’s atmosphere, land, snow and ice, oceans, and radiant energy balance. Scheduled for a six-year tour, Terra outlasted its life expectancy by nearly two decades. Despite its longevity, Terra’s mission scientists stopped making inclination adjustments in 2020, allowing the satellite to slowly drift out of its contained orbit. The mission team have also begun the painful process of shutting down the five key instruments as the satellite is prepped for retirement.
“Terra’s impressive human legacy stems from the fact that the mission’s history is grounded in NASA icons,” said Nyssa Rayne [NASA Goddard Space Flight Center (GSFC)—Terra Outreach & Communications Coordinator]. “Even today, Terra continues to benefit from legendary figures, including the current project scientist and instrument calibration/validation experts, who have shaped this mission in monumental ways.”
An Auspicious Beginning to More Than Two Decades of Science
Terra’s mission of discovery was designed to provide a better understanding of the total Earth system. When Terra launched, on the cusp of the 21st century, the research community knew very little about how the land interacted with the atmosphere on a regional and continental scale. The community also lacked a way to quantify surface properties, such as albedo, roughness, evaporation rate, and photosynthesis, from satellite data.
Terra was designed, engineered, and programmed to address these knowledge gaps. Often described as a small bus, Terra measures almost 7-m (23-ft) long and 3.5 m (11 ft) across. In the vast expanse of space, however, Terra travels in an orbit around Earth, like a gnat circling the Sphere in Las Vegas. Carried into space aboard an Atlas-Centaur IIAS expendable launch vehicle from Vandenberg Air Force Base, CA, Terra was placed in orbit 705 km (438 mi) above the planet’s surface, capturing a viewing swatch from each overpass that could be stitched together to produce whole global images. Its flight path was designed to cross the equator to coincide with the time of day when cloud cover along the equator was at a minimum (10:30 AM mean local time).
Five Instruments Wrapped in a Silver Package
First named EOS-AM1, the concept of the Terra mission was envisioned in the 1980s and implemented in the 1990s. Terra builds on the lessons learned from past pioneering programs, including the Upper Atmosphere Research Satellite (UARS), Landsat, the Ocean Topography Experiment (TOPEX)/Poseidon, and the series of Total Ozone Mapping Spectrometer (TOMS) instruments. After many scientific conversations and arguments, it was finally decided that Terra would carry five instruments capable of gathering data that would benefit a variety of Earth scientific disciplines – see Figure 1. An international effort, Terra carries instruments from the United States, Japan, and Canada that allow scientists to document relationships between Earth’s systems and examine their connections. The five instruments include:
Advanced Spaceborne Thermal Emission and Reflection Radiometer (ASTER), which obtains high-resolution images of Earth at 14 different wavelengths of the electromagnetic spectrum that can be used to create detailed maps of land surface, temperature, emissivity, reflectance, and elevation;
Clouds and the Earth’s Radiant Energy System (CERES), which measures Earth’s total radiation budget as well as cloud property estimates that enable scientists to clarify the role that clouds play in the planet’s radiative flux;
Measurement of Pollution in the Troposphere (MOPITT), which measured the distribution, transport, source, and sinks of carbon monoxide (CO) in the troposphere;
Multi-angle Imaging SpectroRadiometer (MISR), which improves the field’s understanding of the fate of sunlight in Earth’s environment, distinguishing between different types of clouds, aerosol particles, and surfaces; and
Moderate Resolution Imaging Spectroradiometer (MODIS), which combines data gathered from CERES and MISR to determine the impact of clouds and aerosols on the Earth’s energy budget.
Figure 1. An artistic rendering of the Terra spacecraft that shows the location of five instruments in its payload: Advanced Spaceborne Thermal Emission and Reflection Radiometer (ASTER), Clouds and the Earth’s Radiant Energy System (CERES), Measurement of Pollution in the Troposphere (MOPITT), Multi-angle Imaging SpectroRadiometer (MISR), and Moderate Resolution Imaging Spectroradiometer (MODIS). Terra carries two CERES instruments and one each of the other four. Figure credit: NASAFocusing a Zoom Lens on Earth
“ASTER’s accurate topographic data will be used for engineering, energy exploration, conserving natural resources, environmental management, public works design, firefighting, recreation, geology and city planning, to name just a few areas,” Michael Abrams [NASA Jet Propulsion Laboratory—U.S. Principal Investigator] told Universe Today in a June 30, 2009 article.
ASTER was designed to capture high-resolution images of Earth. The data cover a range of land scales – anything from the size of 14 bath towels (15 m2 per pixel) to one-fifth of a basketball court (90 m2 per pixel). The instrument was developed as a partnership between NASA, Japan’s Ministry of Economy, Trade and Industry (METI), the National Institute of Advanced Industrial Science and Technology (AIST) in Japan, and the Japan Space Systems (J-spacesystems).
ASTER consists of three telescopes – Visible Near-Infrared (VNIR), Short-Wave Infrared (SWIR), and Thermal Infrared (TIR). (The SWIR is no longer operational.) All three instruments point perpendicular to the direction of motion to change the viewing angle and produce stereoscopic images of our planet. The three telescopes also gather high-resolution images at 14 different bands of the electromagnetic spectrum, ranging from visible to infrared light.
The instrument’s data are used to create detailed maps of land surface temperature, reflectance, and emissivity, how effectively a surface emits thermal radiation. ASTER also produces detailed views of the effects of Earth’s landforms and topography – see Figure 2. These data are used to understand factors that control climate conditions, e.g., evaporation, water flow, and mass movement. It can also be used to explore how fire can change Earth’s surface.
Figure 2. A topographic map of San Francisco, CA developed with Advanced Spaceborne Thermal Emission and Reflection Radiometer (ASTER) data using Global Digital Elevation Model Version 3. Shading represents different elevations of relief. Figure credit: NASA/ Ministry of Economy, Trade and Industry/Advanced Information Systems Technology/Japan Space Systems, and U.S./Japan ASTER Science TeamEarth’s Reflection Affects Climate
“Earth’s climate is really driven by a delicate balance between how much of the Sun’s energy is absorbed by the Earth as visible light, and how much the Earth emits to space in the form of infrared radiation,” Norman Loeb [Langley Research Center—PI] told EarthSky in a Nov. 30, 2009 article. “The objective is to observe the Earth’s radiation budget, together with the clouds…over several years, and preferably over several decades, [that] enables us to improve our understanding of how the climate system is changing and really provides an invaluable resource for testing climate models that are used to simulate future climate change.”
Terra maintains two CERES instruments that measure albedo, or solar radiation reflected from Earth’s surface, and emitted thermal infrared radiation. It also explores the role that clouds play in modulating radiative fluxes by examining solar-reflected and Earth-emitted radiation from the land surface to the top of the atmosphere.
CERES was developed at NASA’s Langley Research Center. Terra has two CERES instruments onboard – although one is no longer functional. While they were both operational, one CERES instrument would gather information using cross-track scan mode, where a mirror sweeps back and forth, perpendicular to the sensor’s path. This mode builds two-dimensional images of Earth. The second instrument would gather information in biaxial scan mode, where scanning occurs along two different axes simultaneously. These data provide angular flux information to derive Earth’s radiation balance.Now, Terra’s remaining functional CERES instrument operates in biaxial scan mode and has done so while Terra has drifted from its 10:30 MLT equator crossing time toward earlier MLT crossings.
Researchers pair CERES data with other instruments on Terra to create a fully resolved global diurnal cycle of Earth’s radiation budget at the surface and at different layers of the atmosphere, including the top of the atmosphere. The CERES data products capture variations in Earth’s radiation budget at hourly, daily, and monthly timescales. Climate, weather, and applied science research communities use this data to address a range of research topics that involve the exchange of energy between Earth and space and between the major components of the Earth system – see Figure 3. The article, The State of CERES: Updates and Highlights, published Dec. 29, 2025, contains more details on the current status of the CERES instruments flying on Terra and other platforms as well as summaries of the latest science results.
Figure 3. Sea surface temperature gathered by Terra’s Clouds and the Earth’s Radiant Energy System (CERES) instrument on Jan. 1, 2023. Warm surface water is depicted by red and cooler surface water is depicted by blue and green. Figure credit: NASA WorldviewChecking in on the Lower Atmosphere from Space
MOPITT was designed to obtain information about the lower atmosphere – especially as it interacts with the land and ocean biospheres. It was developed as a joint project between the Canadian Space Agency, the University of Toronto, and the National Center for Atmospheric Research (NCAR) in Boulder, CO. The instrument has a spatial resolution of 22 km (14 mi) and covers a swath of Earth’s surface about half the size of Los Angeles [640 km (398 mi)].
MOPITT uses gas correlation spectroscopy to measure the concentration, fate, and distribution of CO, a product of car exhaust, forest fires, and factory exhaust. MOPITT offers near-global coverage every three days of the region being scanned – see Figure 4. These data help scientists identify sources of regional pollution, monitor regional pollution patterns, and track the long-range transport of pollutants.
MOPITT was the longest running record of CO concentration collected from space. The dataset is often combined with MISR data to map aerosols and CO to track sources of air pollution. On April 9, 2025, MOPITT was the first casualty of Terra’s slow demise. It was turned off to conserve energy for the remaining four instruments.
Figure 4. A map of the average carbon monoxide (CO) concentration gathered by Terra’s Measurement of Pollution in the Troposphere (MOPITT) over North America in August 2024. Figure credit: Measurement of Pollution in the Troposphere Instrument Operations Centre, University of TorontoFocusing on the Tiniest Particles from Multiple Perspectives
“The MISR team has pioneered novel methods for tracking aerosol abundances and particle properties, cloud and aerosol plume heights, height-resolved wind vectors, ice and vegetation structures, and other physical attributes of our planet,” said David Diner [NASA/Jet Propulsion Laboratory—MISR PI]. “These efforts and those of the broader scientific community have led to key insights about how the Earth’s climate and environment are changing.”
MISR was developed at NASA’s Jet Propulsion Laboratory to measure variations of surface and cloud properties as well as aerosols – see Figure 5. These data are used to evaluate the long-term interactions between sunlight and aerosols in the atmosphere and on Earth. Researchers can use MISR data to monitor the monthly, seasonal, and long-term trends in the amount and type of atmospheric aerosol particles.
MISR trains its nine cameras on Earth to capture images from multiple angles that gather reflected sunlight scattered by Earth’s surface, clouds, and suspended airborne particles within a 360-km (224-mi) swath of land. One camera points to the lowest point, while others provide forward and aft-ward view angles at 26.1°, 45.6°, 60.0°, and 70.5°. As MODIS flies overhead, each region of Earth’s surface is successively imaged by all nine cameras in each of four wavelengths that span the visible and infrared spectrum. Its capabilities allow measurements of natural and human-caused particulate matter in the atmosphere, particulate abundance and type, heights of aerosol plumes and cloud tops, along with their speed and direction of motion and the types and extent of land surface cover.
Figure 5. Multi-angle Imaging SpectroRadiometer (MISR) images of aerosol optical depth (AOD) from the new aerosol product in the form of three-month moving averages. The data presented were collected in 2006. Figure credit: NASA’s Atmospheric Science Data CenterAccording to Diner, outdoor airborne fine particulate matter constitutes the largest environmental health risk worldwide. This fine particulate matter are responsible for millions of premature deaths per year as well as a wide range of adverse human health outcomes. Terra revolutionized the study of these particles, making it possible for researchers to distinguish aerosols resulting from natural and anthropogenic sources and to investigate how different types of aerosols impact human health. Diner points to how MISR data has been used to examine particulate matter in regions of rapid urbanization, such as Asia and North Africa, as well as track aerosol transport after wildfires.
“MISR’s greatest achievement is the diversity of scientific investigations and research papers that have resulted from its unique observational approach,” he said. Diner also points to the associated retrieval algorithms, which have produced an unprecedented data record spanning more than two and a half decades.
The Swiss Army Knife in Terra’s Toolkit
MODIS was designed to monitor atmospheric, land, and oceanic processes, including surface temperature, ocean color, global vegetation, cloud characteristics, temperature and moisture profiles, and snow cover. The instrument was developed at NASA’s Goddard Space Flight Center. It provides large-scale coverage, about 2300 km (~1429 mi) of land at a spatial resolution of 250 m (~820 ft). MODIS can visualize every point on Earth every one to two days. This approach is ideal for tracking a variety of Earth’s systems. It measures the distribution and properties of clouds, as well as aerosols, water vapor, and temperature. MODIS data are also used as input to a radiative transfer model that calculates radiative fluxes at the surface and within the atmosphere.
Figure 6. An image of Typhoon Ragasa captured on Sept. 18, 2025 in the western Pacific Ocean a few hundred miles east of the Philippines. Figure credit: NASA Earth Observatory image by Wanmei Liang, using MODIS data from NASA EOSDIS LANCE and GIBS/WorldviewMODIS data helps scientists determine the amount of water vapor in a column of the atmosphere and the vertical distribution of temperature and water vapor, measurements that are crucial to understanding Earth’s climate system. MODIS also uses visible images and remotely sensed data to monitor changes in land cover by natural forces, such as fires, or anthropogenic changes, such as cropland burning and farming. MODIS data help researchers understand photosynthetic activity of plants on land and in the ocean to improve estimates of the gaseous mixture in the atmosphere. MODIS data also improves weather models and forecasts that can prepare communities for major storm events – see Figure 6.
Researchers combine atmospheric models developed using MODIS data with aerosol products from MISR data to create a generation of maps of near-surface particulate matter concentrations that have been used in numerous health studies. One such study is the Global Burden of Disease, which estimates that more than four million premature deaths occur each year due to exposure to airborne particles.
Data, Data Everywhere, Managing Decades of Information
Terra instruments have been in operation since the satellite was launched more than a quarter of a century ago. The technology at the time was state-of-the-art, allowing Terra to complete more than 100,000 orbits, downloading and transmitting data twice during each orbit to ground stations in Alaska, Norway, and NASA’s Wallops Flight Facility. Terra has produced the longest record of environmental data providing the research community a way to evaluate the effects of natural and human-induced changes in the environment.
The five (now four) instruments gather near real-time data for use in monitoring and managing on-going events. The vast amount of data has generated 87 data products that are distributed through the Land Processes Distributed Active Archive Center (LPDAAC), the Atmospheric Science Data Center (ASDC), the Ocean Color Web, the Atmosphere Archive and Distribution System, and the National Snow and Ice Data Center (NSIDC). The datasets work in concert with other data products to expand the scientific community’s knowledge about Earth systems, resulting in more than 27,000 scientific publications.
The EOS Data and Information System (EOSDIS) provides end-to-end capabilities for managing science data as part of the Earth Science Data Information System (ESDIS). It processes Level 1–4 data products. For those wishing to learn more, The Earth Observer published a comprehensive review of NASA’s Earth Science Data Operations (as of 2017) in the article, Earth Science Data Operations: Acquiring, Distributing, and Delivering NASA Data for the Benefit of Society [March–April 2017, 29:2, 4–18].
Terra’s data in the EOSDIS archive constitute an invaluable two-decade-long record of a wide range of Earth processes. Higher level data processing is completed by Science Investigator-led Processing Systems. In addition, data is available in a variety of archives. Earthdata Search and Earth Explorer make all ASTER products available to all users at no cost. It contains Level-1 (L1A), L1B, L1T data, as well as data from the Global Digital Elevation Model and the North American ASTER Land Surface Emissivity Database. The U.S. Geological Survey Global Visualization Viewer (GLoVis) and ASTER/AIST data archives allow users to search the entire ASTER data archive using a browser interface. Application for Extracting and Exploring Analysis Ready Samples (AppEEARS) offers a simple and efficient way to access and transform geospatial data from a variety of federal data archives. It allows users to subset geospatial datasets using spatial, temporal, and band/layer parameters.
Over the past two decades, Terra’s data acquisition process has transitioned from scheduled downloads to data-driven acquisition. In a 2020 EarthData article, Greg Dell [Earth Science Mission Operations—Project Deputy Director-Operations] explained the priorities in managing data moving from a model of producing a long-term record for the research community to getting data that the scientific community can use as quickly as possible.
“This is a big paradigm shift over the course of the mission,” said Dell. “We’ve been able to accommodate this paradigm shift with ground automation and better, faster networks.”
Crunching the reams of data gathered by Terra’s five instruments requires a series of algorithms so the scientific community can use it effectively. The acknowledgement of this need began at the launch of the mission, with the creation of the Algorithm Theoretical Basis Documents (ATBDs). ATBDs provided the theoretical basis – both the physical theory and the mathematical procedures and possible assumptions being applied – for the calculations that have to be made to convert the radiances received by the instruments to geophysical quantities. Even in Terra’s early days, developers invited panelists from around the world to evaluate algorithmic iterations to assess the strengths and weaknesses of the code. This perspective has continued with the review of newer algorithms by the user community to ensure they can use the data effectively.
In a continued momentum toward transformation, NASA funded the development of Terra Fusion, a new dataset and toolkit that merges the data gathered by the five instruments into a format and spatial context to be used by scientists. The one dataset approach allows the community to find synergy to address large, real-world problems. Data fusion continues to facilitate new research into air pollution, smoke from wildfires, clouds and aerosols, ocean biology, agriculture and land use, vegetation dynamics, hydrology, Earth’s radiation budget, and other Earth science fields that have traditionally used Terra data.
Terra Science Gives Back to Communities Around the World
According to Rayne, since it began in 1988, the idea behind EOS was that interdisciplinary science teams would collaborate with NASA groups to address real-world problems. This unique approach brought together teams that previously may have been siloed across the agency and academia to increase the momentum driving team science. These efforts have yielded impressive outcomes that have advanced various scientific fields but also benefited people around the world. The following subsections describe ways that Terra data have been applied to a variety of topics of societal interest and importance.
Chasing the Path of Totality During an Eclipse
While an eclipse is not highly unusual, it is an exciting event to witness. The shadow that forms when the Moon blocks the Sun’s radiation briefly changes the environment, dropping atmospheric temperature, quieting birds, and imparting an eerie sense of awe. Often these events do not cross heavily populated parts of the planet. During the past quarter century, Terra has had several opportunities to observe eclipses from its orbital vantage point – a prime location to follow the path of totality where the Sun’s rays are completely blocked from Earth’s surface.
Not long after Terra’s launch, the Moon cast a shadow that moved across southeast Asia and North America during an annular solar eclipse on June 20, 2002. Few regions were within the path of totality to witness this event, but MISR on Terra trained its nine cameras along the path to monitor the effect of the eclipse as it passed the central Pacific Ocean.
MODIS also captured true-color images of an exceptionally long total solar eclipse on July 2009 that reached 6 minutes and 39 seconds. The path of totality crossed Japan, Korea, and eastern China.
During the August 2017 eclipse, the path of totality cut across the United States, with a shadow passing over Oregon, Idaho, Wyoming, Nebraska, Kansas, Missouri, Illinois, Kentucky, Tennessee, North Carolina, Georgia, and South Carolina. MODIS captured false-color images of the shadow – see Figure 7. It was the first eclipse to cross the entire continent in almost 100 years and the first to travel coast-to-coast since the founding of the country in 1776. The Earth Observer reported on this remarkable event in NASA Provides Unique Views of the 2017 “Eclipse Across America” [Sept.–Oct. 2017, 29:5, 4–17].
Figure 7. Terra’s Moderate Resolution Imaging Spectroradiometer (MODIS) sensor captured the data used to create the composite image during several overpasses that were collected at different times. Figure credit: Joshua Stevens and Jesse Allen [both: NASA Earth Observatory]Finally, Terra’s location was not ideal to capture the April 8, 2024 path of totality that crossed over the eastern United States and Canada. However, the satellite was able to capture most of the shadow with limited visible contrast. The Earth Observer staff participated in festivities and covered the event in the article, “Looking Back on Looking Up: The 2024 Total Solar Eclipse,” published on Aug. 22, 2024.
Monitoring Remote Regions for the Spark of a Flame
Terra provides the bird’s eye view of the planet’s surface that is perfect for monitoring remote regions. This vantage point is beneficial for land managers who use Terra’s data to inform decisions and prepare communities for threats, including wildfire and hurricanes. Data from Terra can also be used to map changes to an ecosystem after a fire event.
Terra’s MODIS produced false-color image of the area ravaged by the Camp Fire in 2018, which spanned an area roughly the size of Chicago. Researchers, fire management, and policy makers could interactively browse more than 700 global, full-resolution satellite image layers. The images were paired with underlying data to monitor and evaluate the scarred region – see Figure 8.
Figure 8. A map showing the extent of the Camp Fire in 2018, which was composed using data from the Moderate Resolution Imaging Spectroradiometer (MODIS). The red, black, gold, orange, and green markings indicate different structures in the region affected by the wildfire. The red structures were destroyed completely during the fire. The black structures remained untouched. Green, yellow, and orange structures experienced a degree of fire damage (10–50%). More than 13,000 residential buildings, 500 commercial buildings, and 4,000 other buildings were destroyed in the fire. Figure credit: NASATerra has also captured images from fires in the state of New South Wales in southeastern Australia. In November 2019, the fire season began early with Terra capturing smoke on the edge of the continent. The resulting 70 fires that season destroyed 1.1 million hectares (2.7 million acres). In addition to monitoring the fire damage after containment, scientists use Terra data to monitor the movement of smoke across the continent and around the planet.
The following year, Terra captured images of California’s Mineral fire, which began in July 2020 and grew to more than 11,000 acres (17 mi2) amid favorable fire conditions of high winds and dry grass and timber in the region. Fire management used MODIS information to monitor sparks that had potential for starting new fires. This information helped determine evacuation orders and kept surrounding communities apprised of the fire’s movement.
Heavy Rain Inundates the Outback
Researchers use the instruments on Terra to provide a set of eyes to monitor for fires, but it is also beneficial for monitoring flood conditions. Channel Country in the Australian outback is a region that experiences cycles of drought and flood. During periods of heavy rainfall, the excess water drains to a nearby lake. The wet periods can promote growth in pasture lands and support wetlands and endemic species.
In March 2025, this region received unusually heavy rain. In one week, more than a year’s worth of rain fell, swelling multiple rivers and inundating roadways that isolated small towns and grazing lands for weeks. MODIS captured images of flooding across the region – see Figure 9. Officials used the images from Terra and Landsat to direct helicopter evacuations of citizens and livestock.
Experts monitored the region in real time throughout the event. They cited several factors for the unusually heavy rain, including streams of humid air from the north and east that converged over interior Queensland. They also pointed to a low-pressure trough that drove the moisture-laden air to higher and cooler levels of the atmosphere, triggering the formation and release of heavy rain.
Figure 9. The Moderate Resolution Imaging Spectroradiometer (MODIS) captured wide-spread flooding across western Australia on March 29, 2025. The false-color images of the region show water (dark and light blue), land (brown), and vegetation (green). Figure credit: NASA Earth Observatory images by Michala Garrison, using Landsat data from the U.S. Geological Survey and MODIS data from NASA EOSDIS LANCE and GIBS/WorldviewTracking Churning Ice from Space
Explorers have sought a shortcut from the Atlantic to the Pacific Ocean for centuries. The race for the Northwest Passage was supercharged in the 19th century to shore up trade routes. Many explorers accepted this challenge, and many lives were lost in the quest. It was not until 1905 that Roald Amundsen successfully navigated the Arctic Ocean, emerging into the Pacific Ocean from the Amundsen Gulf, named on his behalf.
The Arctic Ocean continues to be an area of interest today, not only for trade, but also because of the valuable mineral resources along the surrounding shallow continental shelf. Yet, this region still remains tricky to navigate due to chaotic growth and movement of sea ice around the confined northern ocean.
MODIS captured images of this remote region of the planet, offering a bird’s eye view of stationary ice clinging to the shallow shelf. Using this information, researchers studied the seasonal break-up of ice in 2024. They noted the churning, slow rotation of the ice before chocking the few outlet paths into the Atlantic and Pacific Oceans – see Figure 10. Monitoring the release of icebergs updates the status of navigating shipping lanes.
Figure 10. Terra’s Moderate Resolution Imaging Spectroradiometer (MODIS) captured floating fragments of sea ice flowing across the Fram Strait, a 450-km (280-mi) passage between the Arctic Ocean and the Greenland Sea. Figure credit: Wanmei Liang [NASA Earth Observatory]An Eye on an Eruption
MODIS is also beneficial in monitoring volcanic eruptions from space. On Jan. 18, 2017, Terra passed over Alaska and captured an ash plume emanating from the Bogoslof Volcano on Bogoslof Island along the southern edge of the Bering Sea – see Figure 11. Researchers from the Alaska Volcano Observatory (AVO) in collaboration with the U.S. Geological Survey, the University of Alaska Fairbanks Geophysical Institute, and the Alaska Division of Geological and Geophysical Surveys produced updates as the eruption evolved. The group issues one of four levels of alert ranging from calm (green) to imminent eruption (red). AVO announced a red alert for Bogoslof on Jan. 19, 2017. Beyond the ash plume, the cloud of debris produced cumulonimbus clouds that resulted in lightning strikes.
Figure 11. NASA’s Terra Satellite captures the eruption of the Bogoslof volcano in Alaska, emitting steam and ash around 9:00 PM on Jan. 3, 2017. Figure credit: Jeff Schmaltz [Moderate Resolution Imaging Spectroradiometer (MODIS) Rapid Response Team]Tracking Lumbering Atmospheric Monsters
Terra instruments provide researchers information about the location and intensification of tropical storms in the Atlantic Ocean and cyclones in the Pacific Ocean. The National Hurricane Center uses information from Terra and other satellites to observe the storm and predict its potential path before issuing watches and warnings to communities in the line of danger.
On Sept. 2, 2008, a disturbance n in the North Atlantic Ocean caught the scientific community’s attention. The storm received a name – Omar – and Terra offered one of the many lenses to monitor its movement across the Atlantic – see Figure 12. The following day, Omar was downgraded to a tropical depression but then it moved over a warm patch of ocean water – allowing it to rapidly intensify into a category 4 hurricane. Forecasters relied on the constant stream of information from Terra’s instruments to update their models and keep the community apprised of the storm’s movement to prepare and make plans for evacuation.
Figure 12. NASA’s Terra satellite produce an image of hurricane Omar as the storm faced strong wind shear on Sept. 2, 2008 in the North Atlantic Ocean. Figure credit: NASA Worldview, Earth Observing System Data and Information System (EOSDIS)During the early months of the COVID-19 pandemic, Terra continued to monitor the planet from high above. On Aug. 25, 2020, MODIS produced images of a collection of thunderstorms at the center of an intensifying hurricane, named Laura, forming in the Gulf of Mexico. MISR trained its nine cameras on the storm to gather information on changing windspeed and cloud-top height as the storm intensified – see Figure 13. Laura made landfall at Cameron, LA at 1:00 AM as a category 4 hurricane, with sustained winds of 150 mph (130 knots). The hurricane was the strongest storm to hit southwest Louisiana since 1851 when storm records were initiated.
Figure 13. On Aug. 25, 2020 at 12:35 AM EDT, the Moderate Resolution Imaging Spectroradiometer (MODIS) captured the most powerful thunderstorms (yellow) around the eye of hurricane Laura. The temperature at the top of the clouds descended to -80 °F (-62.2 °C). Figure credit: NASA/National Renewable Energy LaboratoryFar Surpassing the Six-year Lifespan… but an Inevitable Decline
Since its launch, Terra has consistently orbited Earth from pole to pole, training all five instruments on the planet’s surface and gathering simultaneous data, with the Earth Science Mission Operations (ESMO) team vigilantly monitoring the satellite’s energy and performance day and (until quite recently) night. As the satellite aged, the team began performing periodic inclination adjustments to maintain the satellite’s orbit and preserve its fuel supply to ensure it could continue to collect data. Their oversight has been so effective that a mission designed with a six-year lifetime continues to operate in 2026. This unplanned longevity is true for all three of the EOS flagships. The article, The Earth Observer: Offering Perspectives from Space through Time, published Dec. 29, 2025, has more to say about the development of Terra and other the EOS flagship missions and the observations made by NASA’s Earth observing fleet.
Inevitably, the decades in Earth’s orbit has taken a toll on the flight hardware. Eventually the fuel to keep the satellite stable in its orbit will run out – even if the instruments onboard are still functioning nominally. To conserve Terra’s remaining fuel to allow for controlled reentry into Earth’s atmosphere and to extend science operations aa long as possible, in late 2020 NASA Headquarters decided it was time to stop making adjustments to maintain Terra’s orbit. As a consequence, the satellite has begun to drift in its orbit, slowly sliding into an earlier equator crossing time. By Fall 2022, Terra’s orbit lowered to about 5 km (3 mi) and began crossing the equator at 10:15 AM. While these changes seem significant, they only created minor adjustments to orbital repeat time and swath width. The research community continued to gather data about atmospheric dynamics, water and energy cycles, atmospheric chemistry, physical and radiative properties of clouds, air-land exchanges of energy, carbon and water, and vertical profiles of CO vulcanology. The Earth Observer discussed the consequences – and opportunities – of these orbit shifts to Terra (and Aqua and Aura) in the article NASA Holds Discussions about the Future of the EOS Flagship Missions [Jan.–Feb. 2023, 35:1, 13–17].
Along with the adjustments in Terra’s orbit, the satellite has also experienced power limitations due to slow degradation of the battery that powers the spacecraft. While ESMO and the instrument Science Teams managed these reductions for as long as possible without impacts on science, early this year the first sacrifice had to be made. MOPITT was switched to safe mode on Feb. 1, 2025 and then turned off on April 9, 2025. As of this writing, the remaining four instruments continue to function, with limitations to the ASTER telescopes.
“It really is a testament to great work by the entire team for being able to keep this spacecraft up in the air and healthy and to be able to produce like it has,” Terri Wood [EDOS—Project Manager] told EarthData in 2020. “It’s people, processes, and programs that make this happen. I just think it’s a real testament to what we can do around here.”
Since Terra’s launch, NASA has sent a series of satellites into orbit to explore the planet’s surface and ultimately learn more about our home. The Afternoon Constellation (A-Train) consisted of five NASA satellites – Aqua (launched in 2002), Aura (launched in 2004), the second Orbiting Carbon Observatory (launched in 2014), the Cloud-Aerosol Lidar and Infrared Pathfinder Satellite Observations (CALIPSO), and CloudSat (both launched in 2006), as well as international partner missions. More information on the A-Train satellites are available in the article, “The Earth Observer: Offering Perspectives from Space through Time,” referenced earlier. These eyes in the sky continue to produce the data that scientists need to answer long-standing questions and tackle complex concerns with new, imaginative approaches.
A Bittersweet Conclusion
Terra began as a spark of imagination during collective conversations among the scientific community more than 40 years ago. This unique approach to team science has resulted in one of the first satellites to study Earth from a holistic perspective, gathering data about the land, water and the atmosphere at the same time, contributing to a diverse collection of scientific disciplines to tackle large questions through team science. Unlike many previous, smaller satellites, Terra was designed from scratch with state-of-the-art technology. The exquisite design ensured each instrument continued to collect data long past the six-year lifespan, offering scientists around the world a long-term record of the planet.
As Terra reaches its conclusion, it will be joined by two sister satellites – Aqua and Aura. The loss of these three EOS flagship satellites, launched more than 20 years earlier, will change the way scientists monitor Earth and affect our understanding of the radiative balance of the planet. May the final years of Terra ignite the imagination of the next generation of scientists to catapult the study of our planet for generations to come.
“Terra was the quintessential and most significant of all of the EOS satellites that made contributions to all aspects of Earth science,” said Michael King [Earth Observing System—former Senior Project Scientist and MODIS—Team Lead]. “All five of the Terra [instruments] made significant and, in many cases, first-of-a-kind global observations relevant to climate change.”
Stacy Kish
NASA’s Goddard Space Flight Center/EarthSpin
stacykishwrites@gmail.com
The Final Earth Observer Editor’s Corner: October–December 2025
14 min read
The Final Earth Observer Editor’s Corner: October–December 2025It is with a heavy heart that I announce that NASA Earth Science Communications has directed The Earth Observer to conduct an orderly shutdown of the publication. No new content will be published after Dec. 31, 2025.
While the sunset of The Earth Observer is bittersweet for our team, the good news is that all of the rich historical and descriptive content preserved on The Earth Observer‘s archives page will remain accessible to the world. If you’ve never checked this page out, I highly encourage you to do so. You’ll find all of our archived issues saved in a PDF format, and – if you scroll down the page – you’ll find an annotated bibliography with links to numerous entries about a variety of topics to provide the historic context of the progress and accomplishments of the Earth Observing System (EOS).
–Alan Ward, Executive Editor, The Earth Observer
Almost 37 years ago, in March 1989, the first issue of The Earth Observer newsletter was released – see Figure 1. The three-page document contained one article that explained the rationale for the National Oceanic and Atmospheric Administration (NOAA) forgoing earlier plans to place instruments on NASA’s first EOS polar platform – at that time envisioned as one of several large platforms operated by NASA, NOAA, Europe, and Japan, with numerous instruments on each platform. Along with this article, that first issue featured an EOS launch schedule, a list of publications and acronyms, and a personals section. Yes, personals. It’s hard to believe that a NASA newsletter would feature personals but remember that this first issue was published at a time before the internet was widely available. The newsletter served as a bridge to quickly connect hundreds of newly chosen EOS investigators scattered worldwide with the latest EOS program developments. The content of early issues included the latest reports from Investigators Working Group meetings, payload panel reviews, and instrument Science Team Meetings (STM). In short, before the Web, The Earth Observer was the thread that kept the various EOS teams connected.
The Earth Observer issue covers: March 1989 (first issue) and Nov. 1989.”> The Earth Observer issue covers: March 1989 (first issue) and Nov. 1989. Figure 1. The look of The Earth Observer has evolved over the years. This graphic shows the evolution of the newsletter’s front-page over the past 36 years. Note how our logo evolved and eventually disappeared. After 2004, new NASA communications guidelines required the NASA logo to be shown on the front instead of the individual program logo. Since 2011, online issues of The Earth Observer have been available in color. A redesign in 2019 included the new logo and tagline for the 30th anniversary; the logo was removed and the tagline tweaked in 2020. The final print issue was published in May 2024. The Earth Observer began publishing content online Summer 2024. The last photo in the series shows the home page for The Earth Observer’s website as of December 2025, which will remain accessible after 2025 as a historic archive. Credit: Debbi McLean/NASA’s Goddard Space Flight Center The Earth Observer issue covers:: Jan.–Feb. 1997 and Jan–Feb. 2000.”> The Earth Observer issue covers:: Jan.–Feb. 1997 and Jan–Feb. 2000. Figure 1. The look of The Earth Observer has evolved over the years. This graphic shows the evolution of the newsletter’s front-page over the past 36 years. Note how our logo evolved and eventually disappeared. After 2004, new NASA communications guidelines required the NASA logo to be shown on the front instead of the individual program logo. Since 2011, online issues of The Earth Observer have been available in color. A redesign in 2019 included the new logo and tagline for the 30th anniversary; the logo was removed and the tagline tweaked in 2020. The final print issue was published in May 2024. The Earth Observer began publishing content online Summer 2024 The last photo in the series shows the home page for The Earth Observer’s website as of December 2025, which will remain accessible after 2025 as a historic archives. Credit: Debbi McLean/NASA’s Goddard Space Flight Center The Earth Observer issue covers: Jan.–Feb. 2006 and Jan.–Feb. 2008.”> The Earth Observer issue covers: Jan.–Feb. 2006 and Jan.–Feb. 2008. Figure 1. The look of The Earth Observer has evolved over the years. This graphic shows the evolution of the newsletter’s front-page over the past 36 years. Note how our logo evolved and eventually disappeared. After 2004, new NASA communications guidelines required the NASA logo to be shown on the front instead of the individual program logo. Since 2011, online issues of The Earth Observer have been available in color. A redesign in 2019 included the new logo and tagline for the 30th anniversary; the logo was removed and the tagline tweaked in 2020. The final print issue was published in May 2024. The Earth Observer began publishing content online Summer 2024 The last photo in the series shows the home page for The Earth Observer’s website as of December 2025, which will remain accessible after 2025 as a historic archives. Credit: Debbi McLean/NASA’s Goddard Space Flight Center The Earth Observer issue covers: Jan.–/Feb. 2011 (now in color) and March–April 2014 (25th anniversary).”> The Earth Observer issue covers: Jan.–/Feb. 2011 (now in color) and March–April 2014 (25th anniversary). Figure 1. The look of The Earth Observer has evolved over the years. This graphic shows the evolution of the newsletter’s front-page over the past 36 years. Note how our logo evolved and eventually disappeared. After 2004, new NASA communications guidelines required the NASA logo to be shown on the front instead of the individual program logo. Since 2011, online issues of The Earth Observer have been available in color. A redesign in 2019 included the new logo and tagline for the 30th anniversary; the logo was removed and the tagline tweaked in 2020. The final print issue was published in May 2024. The Earth Observer began publishing content online Summer 2024 The last photo in the series shows the home page for The Earth Observer’s website as of December 2025, which will remain accessible after 2025 as a historic archives. Credit: Debbi McLean/NASA’s Goddard Space Flight Center The Earth Observe issue covers: Jan.–Feb. 2019 (30th anniversary) and Jan.–Feb. 2020.”> The Earth Observe issue covers: Jan.–Feb. 2019 (30th anniversary) and Jan.–Feb. 2020. Figure 1. The look of The Earth Observer has evolved over the years. This graphic shows the evolution of the newsletter’s front-page over the past 36 years. Note how our logo evolved and eventually disappeared. After 2004, new NASA communications guidelines required the NASA logo to be shown on the front instead of the individual program logo. Since 2011, online issues of The Earth Observer have been available in color. A redesign in 2019 included the new logo and tagline for the 30th anniversary; the logo was removed and the tagline tweaked in 2020. The final print issue was published in May 2024. The Earth Observer began publishing content online Summer 2024 The last photo in the series shows the home page for The Earth Observer’s website as of December 2025, which will remain accessible after 2025 as a historic archives. Credit: Debbi McLean/NASA’s Goddard Space Flight Center The Earth Observer‘s final pdf issue cover (May 2024) and website screenshot (Dec.2025).”> The Earth Observer‘s final pdf issue cover (May 2024) and website screenshot (Dec.2025). Figure 1. The look of The Earth Observer has evolved over the years. This graphic shows the evolution of the newsletter’s front-page over the past 36 years. Note how our logo evolved and eventually disappeared. After 2004, new NASA communications guidelines required the NASA logo to be shown on the front instead of the individual program logo. Since 2011, online issues of The Earth Observer have been available in color. A redesign in 2019 included the new logo and tagline for the 30th anniversary; the logo was removed and the tagline tweaked in 2020. The final print issue was published in May 2024. The Earth Observer began publishing content online Summer 2024 The last photo in the series shows the home page for The Earth Observer’s website as of December 2025, which will remain accessible after 2025 as a historic archives. Credit: Mike Marosy/NASA’s Goddard Space Flight CenterThe history of The Earth Observer is intimately intertwined with the development of EOS; it is difficult to speak of one entity without discussing the other. Over the years, as EOS grew from an idea into actual spacecraft and instruments launching and flying in space, the newsletter began chronicling their journey. Early issues of The Earth Observer describe – often in meticulous detail – the meetings and deliberations during which the EOS concept evolved through various revisions and restructuring before the first EOS mission took flight. In the end, NASA launched three mid-sized “flagship” missions (about the size of a small bus) that became known as Terra (1999), Aqua (2002), and Aura (2004) and complemented their measurement capabilities with numerous other small-to-mid-sized missions. The result is the Earth-observing fleet in orbit above us today. Many of these missions fly in polar, low Earth, or geosynchronous orbit, while several others observe the Earth from the perspective of the International Space Station (ISS) – see Figure 2.
EOS missions are known for their longevity; many missions (and their follow-ons) have long outlived their anticipated life cycle. Each of these missions beam back reams of raw data that must be processed and stored so that it can be accessed and used as input to computer models and scientific studies to understand past environmental conditions, place our current situation in the proper context, and make predictions about the future path our planet could follow.
To view this video please enable JavaScript, and consider upgrading to a web browser that
supports HTML5 video
During its nearly 37-year run, The Earth Observer has borne witness to the successes, failures, frustrations, and advancements of EOS, and of the broader Earth Science endeavors of NASA and its domestic and international partners. Given that publication of this final content marks the end of an era, the newsletter team felt it appropriate to offer some perspective on the newsletter’s contribution. The feature that resulted focuses on the relationship between The Earth Observer and EOS – with specific emphasis on our reporting on satellite missions. See the online article, The Earth Observer: Offering Perspectives from Space Through Time, to learn more.
One of the final items published focuses on Terra, the first EOS flagship, which launched into the night sky on Dec. 18, 1999 from Vandenberg Space Force [then Air Force Base (VSFB)] in California on what was designed as a six-year mission of discovery. Terra’s payload included five instruments – Advanced Spaceborne Thermal Emission and Reflection Radiometer (ASTER), Clouds and the Earth’s Radiant Energy System (CERES), Measurement of Pollution in the Troposphere (MOPITT), Multi-angle Imaging SpectroRadiometer (MISR), and Moderate Resolution Imaging Spectroradiometer (MODIS) – intended to collect data that would fill in gaps in our knowledge of the Earth System (as it stood on the cusp of the 21st century). In particular, the satellite gathered information about how land interacts with the atmosphere on a regional and continental scale. The mission also focused on measuring key planetary characteristics needed to understand Earth’s changing environment (e.g., albedo, roughness, evaporation rate, and photosynthesis). The goal was to provide a holistic approach to address larger scientific questions. For more than 26 years, Terra has trained her five instruments toward Earth and gathered data to address wildfires, flooding, hurricanes, and polar ice.
As 2020 drew to a close, in order to conserve enough fuel for the end of the mission, NASA Headquarters decided it was time to for Terra to stop conducting the periodic maneuvers to maintain its 10:30 AM equator crossing. After ceasing maneuvers, the satellite began to drift, which Terra (and the other flagships) have done for the past few years. As Terra’s life draws to a close, it continues to ignite the imagination of the next generation of scientists to catapult the study of our planet for generations to come. Refer to the article, Terra: The End of an Era, to learn more about the feat of engineering that has kept the satellite gathering data two decades past the end of its “Prime Mission” and the key scientific achievements that have resulted.
Since 1997, six CERES instruments have been launched on the EOS and the Joint Polar Satellite System (JPSS) platforms, including the Tropical Rainfall Measuring Mission (TRMM), Terra [2], Aqua [2], the Suomi National Polar-orbiting Platform (Suomi NPP), and the Joint Polar Satellite System–1 (JPSS-1, now named NOAA–20) missions, and used to study Earth’s radiation budget (ERB) – the amount of sunlight absorbed by Earth and the amount of infrared energy emitted back to space – that has a strong influence on climate. Researchers pair measurements from CERES instruments with information gathered from other sources to clarify ERB. While the latency of CERES data prevents it from being used for weather forecasting directly, the information on ERB can be used to verify the radiation parameterization of computer models used to make weather forecasts and predictions about future climate conditions. The ERB data can also be applied to other science research and applications that benefit society. As an example, researchers have used this data to accurately detail changes in the movement of energy from Earth – especially the role that clouds and aerosols play in Earth’s energy budget. The CERES Science Team has a long history of recording proceedings of their meetings in The Earth Observer. It is thus appropriate that a CERES STM summary should be among the last items published this newsletter. Read more about the current status of CERES in space in the article, The State of CERES: Updates and Highlights.
The CERES STM also includes an update on the Polar Radiant Energy in the Far InfraRed Experiment (PREFIRE) mission, which publicly released its data products in June 2025. PREFIRE measurements are being used to quantify the far-infrared spectrum beyond 15 mm – which accounts for over 50% of the outgoing long wave radiation in polar regions. Additionally, the atmospheric greenhouse effect is sensitive to thin clouds and small water vapor concentration that have strong far infrared signatures. PREFIRE consists of two shoebox-sized CubeSats, which launched into near polar orbits on separate Rocket Lab Electron rockets from New Zealand in May and June of 2024. Each CubeSat has a miniaturized infrared spectrometer onboard covering 5 to 53 mm with 0.84 mm sampling and a planned operational life of one year. A complete infrared emission spectrum will provide fingerprints to differentiate between several important feedback processes (e.g., cloudiness and water vapor) that leads to Arctic warming, sea ice loss, ice sheet melt, and sea level rise.
NOAA and NASA have partnered in many endeavors together. The Earth Observer has reported on these collaborations over the years. One well known example is the two agency’s partnership to develop and launch the Geostationary Operational Environmental Satellites (GOES). This mission has become the backbone of short-term forecasts and warnings of severe weather and environmental hazards. The first satellite, GOES-1, launched in 1975; the most recent, GOES-19, launched in 2024. The technology onboard has improved exponentially over the past five decades. The article, Sentinels in the Sky: 50 Years of GOES Satellite Observations, describes this progression, highlights some of the data obtained, and provides insights into each of these incremental advancements over the past 50 years in this satellite series.
Turning now to another recent launch, the Plankton, Aerosol, Cloud, ocean Ecosystem (PACE) satellite continues to operate nominally. The data PACE returns allow the scientific community to explore the Earth’s ocean, atmosphere, and land surfaces. In February 2025 (10 days prior to the first anniversary of the mission’s launch), the PACE community gathered at NASA’s Goddard Institute for Space Studies (GISS) for the PAC3 meeting, which was so named because it combined three PACE-related activities: the PACE Postlaunch Airborne eXperiment (PACE–PAX), the third PACE Science and Applications Team (SAT3), and the PACE Validation Science Team (PVST). The PAC3 meeting included updates on the three instruments on PACE: the Ocean Color Instrument (OCI), the Hyper-Angular Rainbow Polarimeter–2 (HARP2), and the Spectropolarimeter for Planetary Exploration (SPEXone).
In addition to reporting on PACE, participants during the meeting gave updates on the latest news about the Earth Cloud Aerosol and Radiation Explorer (EarthCARE) observatory, including preparation for validation activities as part of the joint efforts of the European Space Agency (ESA) and Japan Aerospace eXploration Agency (JAXA). The article also details operational highlights, including validation and aerosol products and cloud products. Several Science and Applications Team (SAT3) groups presented results from studies using PACE data and PACE validation studies. The PACE Science Team will continue to monitor Earth and have identified strategies to continue the long-term data calibration and algorithm refinement to ensure the ongoing delivery of information to the research community. The article, Keeping Up with PACE: Summary of the 2025 PAC3 Meeting, provides a full summary of this event.
On Nov. 16, 2025, the Sentinel-6B mission launched from VSFB. The newest satellite in NASA’s Earth observing fleet measures sea levels with an accuracy of one inch every second, covering 90 percent of the oceans every 10 days. It will also contribute the record of atmospheric temperature and humidity measurements. These data are beneficial in observing movement of surface currents, monitoring the transfer of heat through the oceans and around the planet, and tracking changes in water temperature. Sentinel-6B will carry several instruments on this mission, including a radar altimeter, an advanced microwave radiometer, and a radio occultation antenna. The satellite’s observations will be paired with information from other spacecraft to provide detailed information about Earth’s atmosphere that will contribute high-resolution data for computer models to improve weather forecasting.
Sentinel-6B is another shining example of successful collaboration between NASA and NOAA, along with several European partners – ESA, the European Organisation for the Exploitation of Meteorological Satellites (EUMETSAT), Centre National d’Études Spatiales (CNES), and the European Commission.
Sentinel-6B has publicly released an image showing some of its first observations since launch. The map shows sea levels across a vast stretch of the eastern seaboard and Atlantic Ocean – see Figure 3. The image combines data from Sentinel–6B and its “twin” Sentinel-6 Michael Freilich, which launched in 2020. The data were obtained on Nov. 26, 2025 – just ten days after Sentinel-6B launched.
Figure 3. Sentinel-6B (S6B) and Sentinel-6 Michael Freilich (S6MF) captured data on Nov. 26, 2025 of sea levels across a vast stretch of the Atlantic Ocean. Within the crisscrossing bands, red indicates higher water height relative to the long-term average; blue indicates lower water height. The tracks are layered atop the combined observations of all available sea-level satellites. S6MF currently serves as the “reference” mission, allowing data from all other altimeters to be accurately combined into maps like this one. Credit: EUMETSAT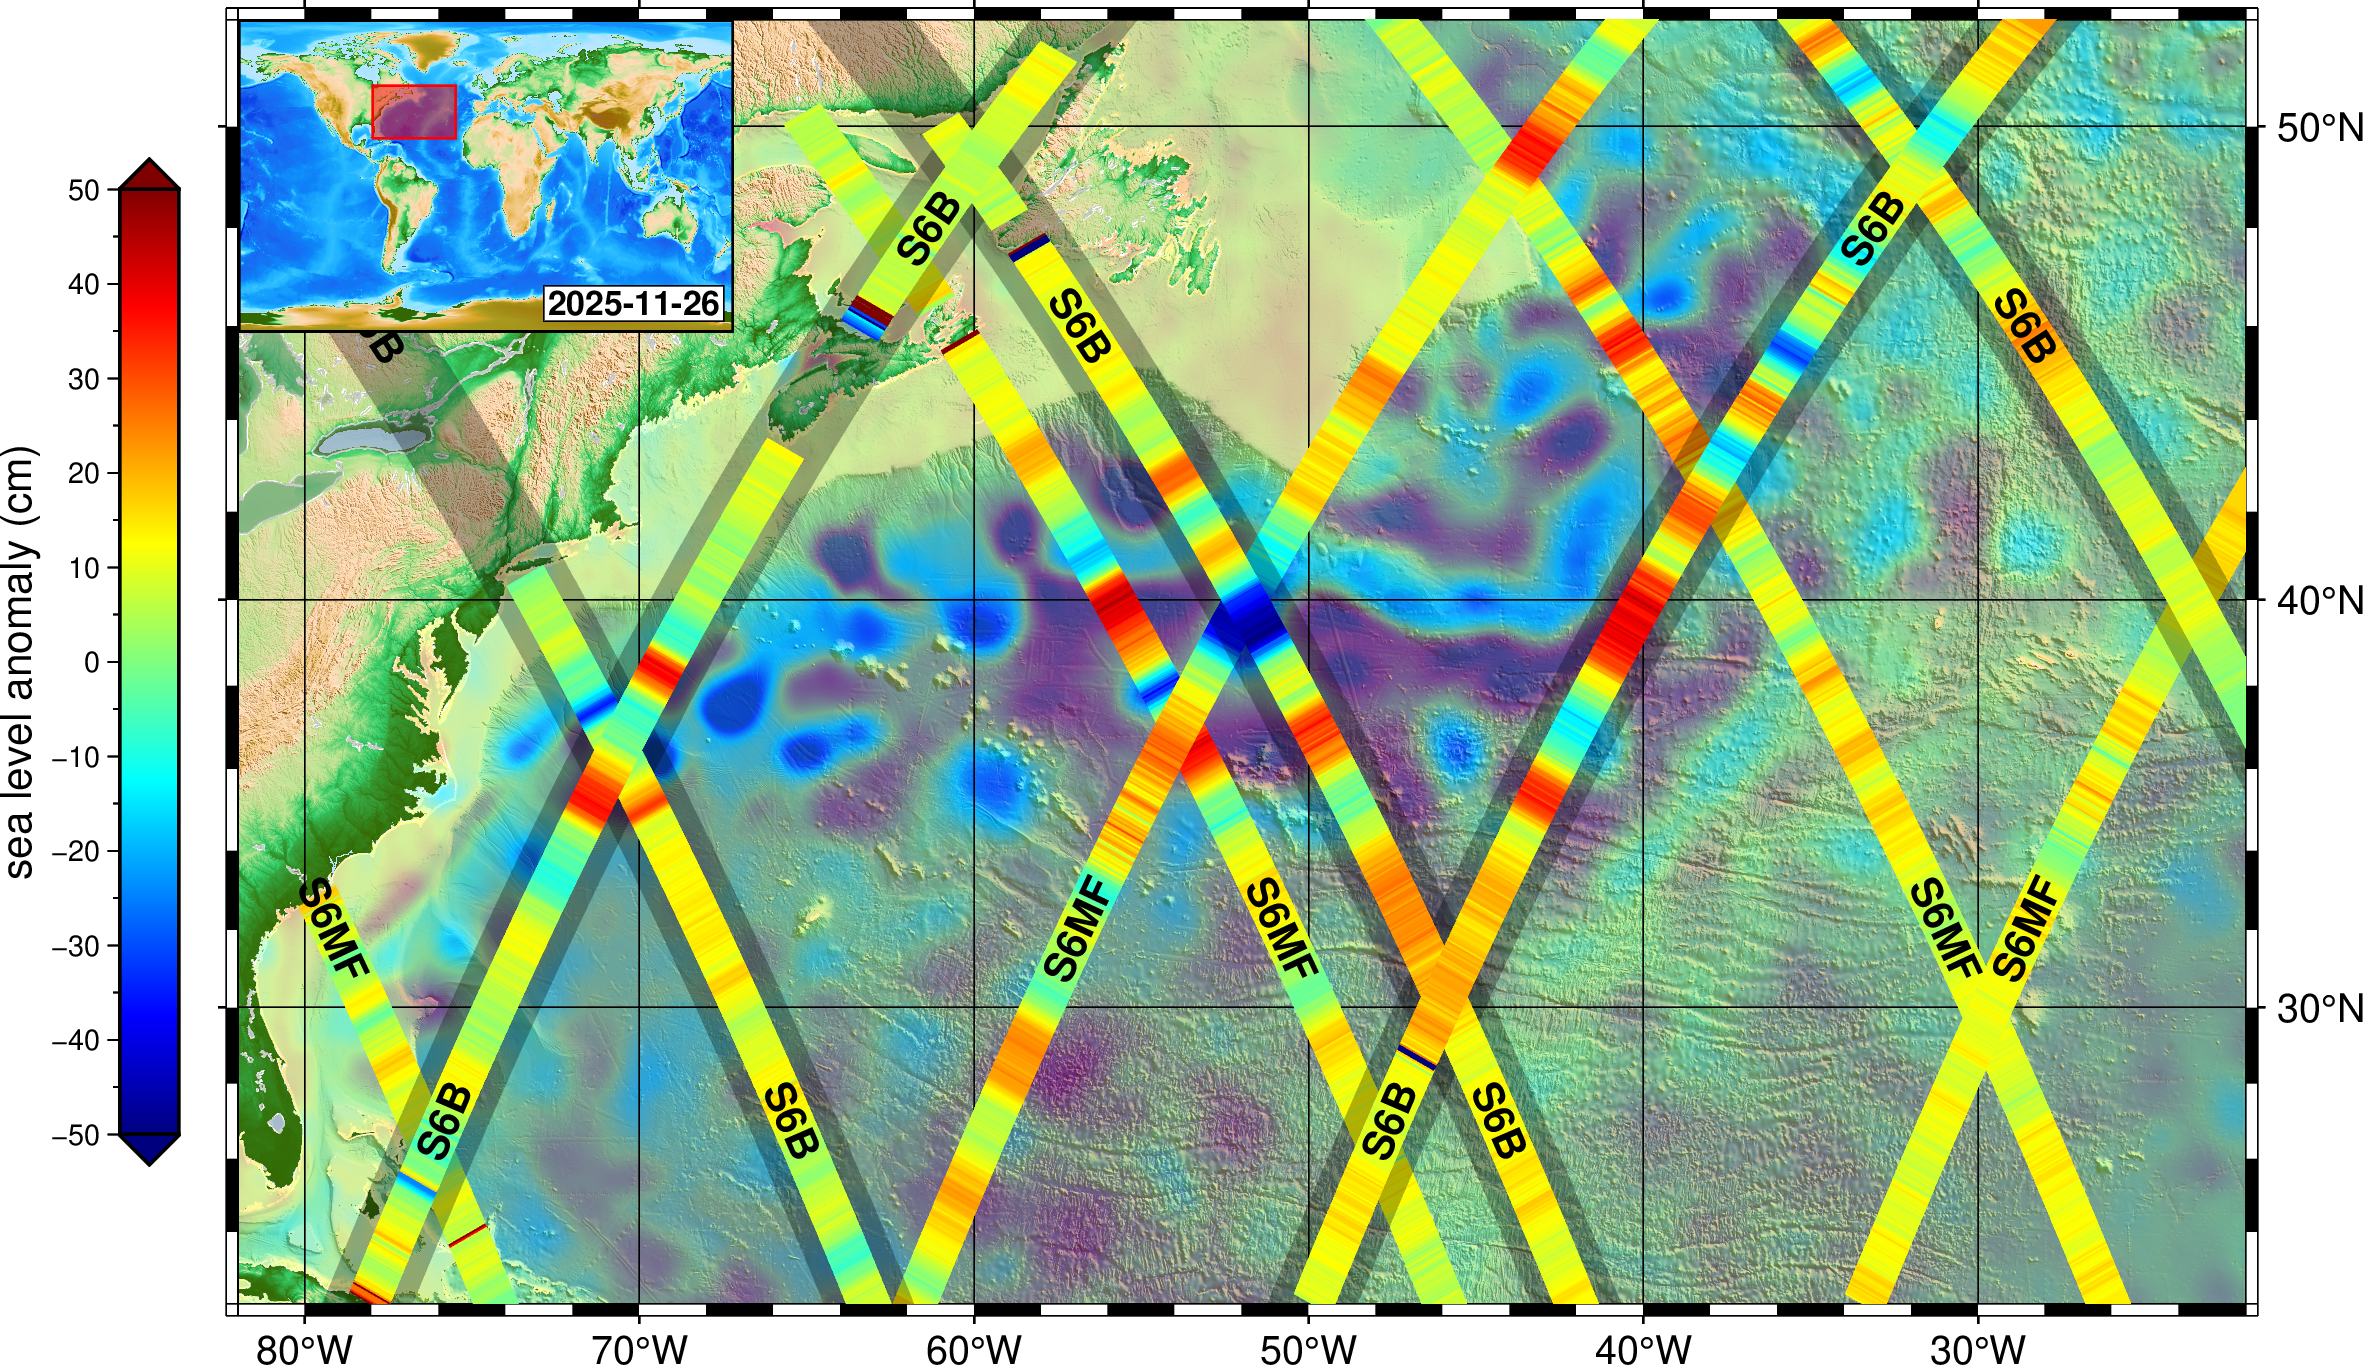
Together, Sentinel-6B and Sentinel-6 Michael Freilich make up the Copernicus Sentinel-6/Jason- Continuity of Service (CS) mission developed by NASA, ESA, EUMETSAT, and NOAA. Sentinel–6/Jason CS continues a series of ocean surface topography missions that began three decades ago with the NASA/CNES Ocean Topography Experiment (TOPEX)/Poseidon mission. The article, Sentinel-6B Extends Global Ocean Height Record, provides an overview of this latest addition to the NASA and to the international Earth observing fleet.
The July–Sept. 2025 posting of “The Editor’s Corner” reported on the successful launch of the joint NASA–Indian Space Research Organization (ISRO) Synthetic Aperture Radar (NISAR) mission on July 30, 2025 from the Satish Dhawan Space Centre on India’s southeastern coast aboard an ISRO Geosynchronous Satellite Launch Vehicle (GSLV) rocket 5. Soon after launch, NISAR entered its Commissioning phase to test out systems before science operations begin. A key milestone of that phase was the completion of the deployment of the 39-ft (12-m) radar antenna reflector on Aug. 15, 2025. A few days later, on Aug. 19, 2025, NISAR obtained its first image and on Nov. 28, 2025, ISRO made the image (and others) publicly available – see Figure 4.
Figure 4. The first NISAR S-band Synthetic Aperture Radar (SAR) image, acquired on Aug. 19, 2025, captures the fertile Godavari River Delta in Andhra Pradesh, India. Various vegetation classes (e.g., mangroves, agriculture, arecanut plantations, aquaculture fields) are clearly seen in the image, which highlights the ability of NISAR’s S-band SAR to map river deltas and agricultural landscapes with precision. Credit: ISRO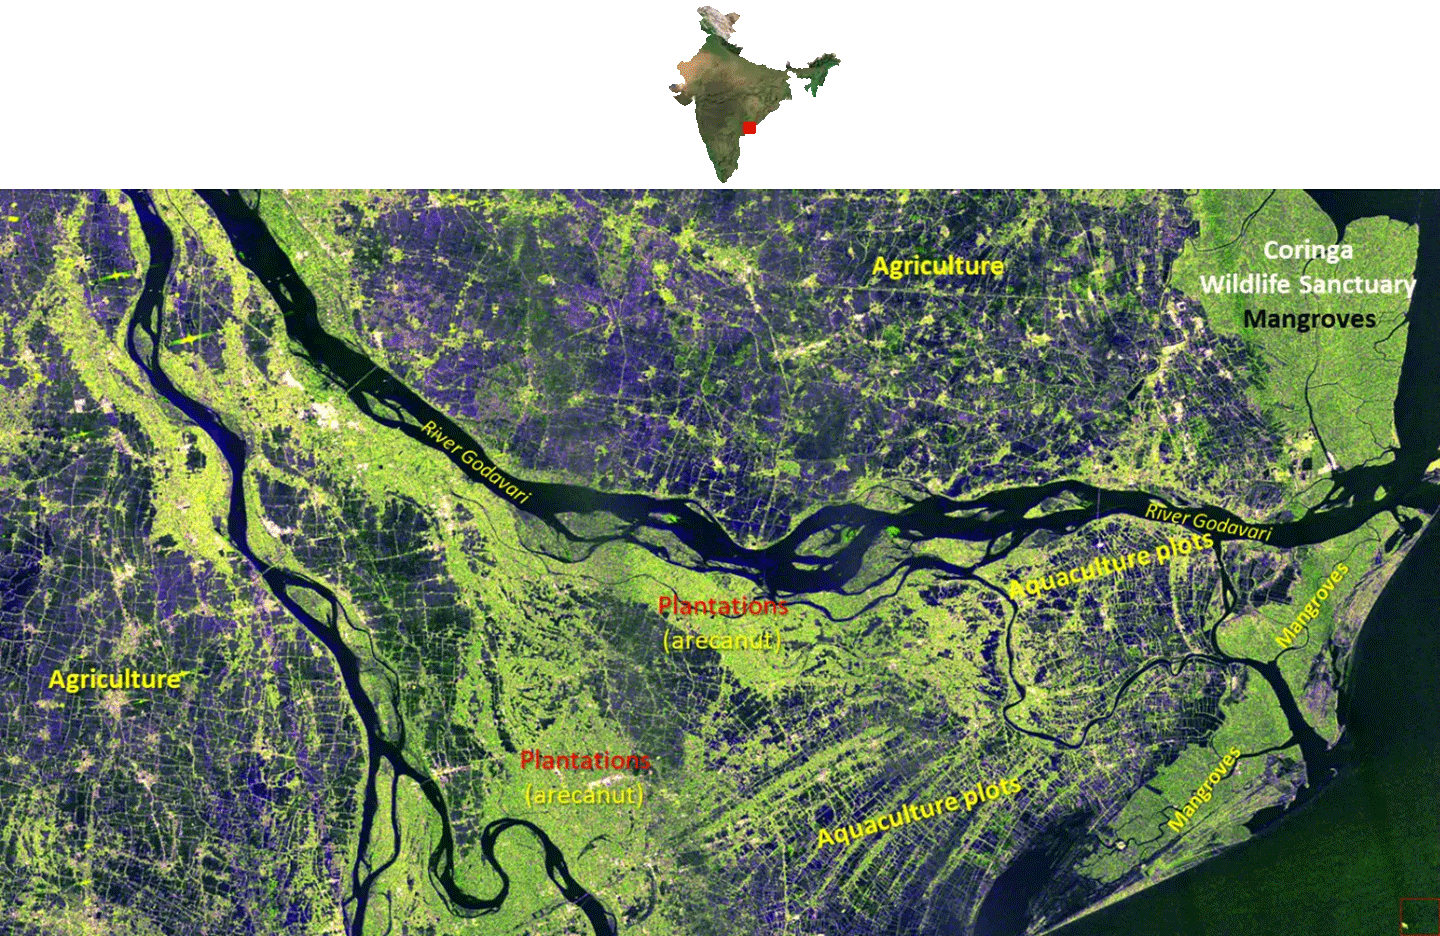
During the Commissioning phase, the S-band Synthetic Aperture Radar (SAR) has been regularly obtaining images over India and over global calibration-validation sites in various payload operating configurations. Reference targets such as Corner reflectors were deployed around Ahmedabad, Gujarat and a few more locations in India for calibration. Data acquired over Amazon rainforests were also used for calibration of spacecraft pointing and images. Based on this, payload data acquisition parameters have been fine-tuned resulting in high-quality images. The initial images have scientists and engineers excited about the potential of using S-band SAR data for various targeted science and application areas like agriculture, forestry, geosciences, hydrology, polar/Himalayan ice/snow, and oceanic studies.
NISAR has not one but two radars onboard. The S-band radar, described above, is India’s contribution to the mission; the L-band radar is NASA’s contribution. The L-band radar has also been active during the first few months of NISAR’s mission acquiring images of targets in the United States. Karen St. Germain [NASA HQ—Director of Earth Science Division] gave the opening presentation on the Hyperwall at NASA’s exhibit during the Fall 2025 meeting of the American Geophysical Union (AGU) in New Orleans, LA on Dec. 15, 2025. Her presentation, which can be viewed on YouTube, has a section on NISAR (beginning at the 5:33 time stamp) and includes several examples of novel applications made possible by NISAR’s L-band SAR imaging capabilities.
During her AGU presentation, St. Germain also showed recent examples of data from the Surface Water Ocean Topography (SWOT) mission [at timestamp 0:03 on the YouTube video], highlighting its surface water mapping capabilities, and from PACE [at timestamp 3:34], highlighting its aerosol and biological monitoring capabilities. These missions not only detect aerosol plumes and phytoplankton blooms but are also able to tell what type they are. She briefly mentioned the Sentinel-6B launch [see timestamp 14:02], teasing her presentation at the Town Hall meeting to be held the next day, where she officially unveiled the Sentinel-6B “first light” image shown as Figure 2 in this editorial.
To conclude, The Earth Observer staff claims a moment of editorial privilege. In a way, we conclude where The Earth Observer began, by sending a “personal message” to all the scientists, engineers, educators, and others – both past and present – who have contributed to EOS and other NASA Earth Science programs that have been covered in this newsletter.
We would like to thank all of the NASA and other leaders, team members, scientists, technicians, students, and staff who have shared your stories over the decades. This publication would not have been the success that it was for so many years without the sustained contributions of the NASA and broader Earth Science community. To all those who volunteered their time to contribute to The Earth Observer over the years, offering your reviews, your subject matter expertise, and your collaboration, we say, “Thank you.” It has been an utmost pleasure to be at the forefront of reporting on the emerging results from your endeavors and bringing this information to the EOS community. We wish you all the best in whatever comes next. While we are saddened to lose the opportunity to continue to share your successes with the Earth Science community via The Earth Observer, we will continue to cheer on your effort and look for future opportunities to publicize your successes however we can.
Alan Ward
Executive Editor of The Earth Observer
Barry Lefer
Associate Director of Research, Earth Science Division
The Final Earth Observer Editor’s Corner: October–December 2025
14 min read
The Final Earth Observer Editor’s Corner: October–December 2025It is with a heavy heart that I announce that NASA Earth Science Communications has directed The Earth Observer to conduct an orderly shutdown of the publication. No new content will be published after Dec. 31, 2025.
While the sunset of The Earth Observer is bittersweet for our team, the good news is that all of the rich historical and descriptive content preserved on The Earth Observer‘s archives page will remain accessible to the world. If you’ve never checked this page out, I highly encourage you to do so. You’ll find all of our archived issues saved in a PDF format, and – if you scroll down the page – you’ll find an annotated bibliography with links to numerous entries about a variety of topics to provide the historic context of the progress and accomplishments of the Earth Observing System (EOS).
–Alan Ward, Executive Editor, The Earth Observer
Almost 37 years ago, in March 1989, the first issue of The Earth Observer newsletter was released – see Figure 1. The three-page document contained one article that explained the rationale for the National Oceanic and Atmospheric Administration (NOAA) forgoing earlier plans to place instruments on NASA’s first EOS polar platform – at that time envisioned as one of several large platforms operated by NASA, NOAA, Europe, and Japan, with numerous instruments on each platform. Along with this article, that first issue featured an EOS launch schedule, a list of publications and acronyms, and a personals section. Yes, personals. It’s hard to believe that a NASA newsletter would feature personals but remember that this first issue was published at a time before the internet was widely available. The newsletter served as a bridge to quickly connect hundreds of newly chosen EOS investigators scattered worldwide with the latest EOS program developments. The content of early issues included the latest reports from Investigators Working Group meetings, payload panel reviews, and instrument Science Team Meetings (STM). In short, before the Web, The Earth Observer was the thread that kept the various EOS teams connected.
The Earth Observer issue covers: March 1989 (first issue) and Nov. 1989.”> The Earth Observer issue covers: March 1989 (first issue) and Nov. 1989. Figure 1. The look of The Earth Observer has evolved over the years. This graphic shows the evolution of the newsletter’s front-page over the past 36 years. Note how our logo evolved and eventually disappeared. After 2004, new NASA communications guidelines required the NASA logo to be shown on the front instead of the individual program logo. Since 2011, online issues of The Earth Observer have been available in color. A redesign in 2019 included the new logo and tagline for the 30th anniversary; the logo was removed and the tagline tweaked in 2020. The final print issue was published in May 2024. The Earth Observer began publishing content online Summer 2024. The last photo in the series shows the home page for The Earth Observer’s website as of December 2025, which will remain accessible after 2025 as a historic archive. Credit: Debbi McLean/NASA’s Goddard Space Flight Center The Earth Observer issue covers:: Jan.–Feb. 1997 and Jan–Feb. 2000.”> The Earth Observer issue covers:: Jan.–Feb. 1997 and Jan–Feb. 2000. Figure 1. The look of The Earth Observer has evolved over the years. This graphic shows the evolution of the newsletter’s front-page over the past 36 years. Note how our logo evolved and eventually disappeared. After 2004, new NASA communications guidelines required the NASA logo to be shown on the front instead of the individual program logo. Since 2011, online issues of The Earth Observer have been available in color. A redesign in 2019 included the new logo and tagline for the 30th anniversary; the logo was removed and the tagline tweaked in 2020. The final print issue was published in May 2024. The Earth Observer began publishing content online Summer 2024 The last photo in the series shows the home page for The Earth Observer’s website as of December 2025, which will remain accessible after 2025 as a historic archives. Credit: Debbi McLean/NASA’s Goddard Space Flight Center The Earth Observer issue covers: Jan.–Feb. 2006 and Jan.–Feb. 2008.”> The Earth Observer issue covers: Jan.–Feb. 2006 and Jan.–Feb. 2008. Figure 1. The look of The Earth Observer has evolved over the years. This graphic shows the evolution of the newsletter’s front-page over the past 36 years. Note how our logo evolved and eventually disappeared. After 2004, new NASA communications guidelines required the NASA logo to be shown on the front instead of the individual program logo. Since 2011, online issues of The Earth Observer have been available in color. A redesign in 2019 included the new logo and tagline for the 30th anniversary; the logo was removed and the tagline tweaked in 2020. The final print issue was published in May 2024. The Earth Observer began publishing content online Summer 2024 The last photo in the series shows the home page for The Earth Observer’s website as of December 2025, which will remain accessible after 2025 as a historic archives. Credit: Debbi McLean/NASA’s Goddard Space Flight Center The Earth Observer issue covers: Jan.–/Feb. 2011 (now in color) and March–April 2014 (25th anniversary).”> The Earth Observer issue covers: Jan.–/Feb. 2011 (now in color) and March–April 2014 (25th anniversary). Figure 1. The look of The Earth Observer has evolved over the years. This graphic shows the evolution of the newsletter’s front-page over the past 36 years. Note how our logo evolved and eventually disappeared. After 2004, new NASA communications guidelines required the NASA logo to be shown on the front instead of the individual program logo. Since 2011, online issues of The Earth Observer have been available in color. A redesign in 2019 included the new logo and tagline for the 30th anniversary; the logo was removed and the tagline tweaked in 2020. The final print issue was published in May 2024. The Earth Observer began publishing content online Summer 2024 The last photo in the series shows the home page for The Earth Observer’s website as of December 2025, which will remain accessible after 2025 as a historic archives. Credit: Debbi McLean/NASA’s Goddard Space Flight Center The Earth Observe issue covers: Jan.–Feb. 2019 (30th anniversary) and Jan.–Feb. 2020.”> The Earth Observe issue covers: Jan.–Feb. 2019 (30th anniversary) and Jan.–Feb. 2020. Figure 1. The look of The Earth Observer has evolved over the years. This graphic shows the evolution of the newsletter’s front-page over the past 36 years. Note how our logo evolved and eventually disappeared. After 2004, new NASA communications guidelines required the NASA logo to be shown on the front instead of the individual program logo. Since 2011, online issues of The Earth Observer have been available in color. A redesign in 2019 included the new logo and tagline for the 30th anniversary; the logo was removed and the tagline tweaked in 2020. The final print issue was published in May 2024. The Earth Observer began publishing content online Summer 2024 The last photo in the series shows the home page for The Earth Observer’s website as of December 2025, which will remain accessible after 2025 as a historic archives. Credit: Debbi McLean/NASA’s Goddard Space Flight Center The Earth Observer‘s final pdf issue cover (May 2024) and website screenshot (Dec.2025).”> The Earth Observer‘s final pdf issue cover (May 2024) and website screenshot (Dec.2025). Figure 1. The look of The Earth Observer has evolved over the years. This graphic shows the evolution of the newsletter’s front-page over the past 36 years. Note how our logo evolved and eventually disappeared. After 2004, new NASA communications guidelines required the NASA logo to be shown on the front instead of the individual program logo. Since 2011, online issues of The Earth Observer have been available in color. A redesign in 2019 included the new logo and tagline for the 30th anniversary; the logo was removed and the tagline tweaked in 2020. The final print issue was published in May 2024. The Earth Observer began publishing content online Summer 2024 The last photo in the series shows the home page for The Earth Observer’s website as of December 2025, which will remain accessible after 2025 as a historic archives. Credit: Mike Marosy/NASA’s Goddard Space Flight CenterThe history of The Earth Observer is intimately intertwined with the development of EOS; it is difficult to speak of one entity without discussing the other. Over the years, as EOS grew from an idea into actual spacecraft and instruments launching and flying in space, the newsletter began chronicling their journey. Early issues of The Earth Observer describe – often in meticulous detail – the meetings and deliberations during which the EOS concept evolved through various revisions and restructuring before the first EOS mission took flight. In the end, NASA launched three mid-sized “flagship” missions (about the size of a small bus) that became known as Terra (1999), Aqua (2002), and Aura (2004) and complemented their measurement capabilities with numerous other small-to-mid-sized missions. The result is the Earth-observing fleet in orbit above us today. Many of these missions fly in polar, low Earth, or geosynchronous orbit, while several others observe the Earth from the perspective of the International Space Station (ISS) – see Figure 2.
EOS missions are known for their longevity; many missions (and their follow-ons) have long outlived their anticipated life cycle. Each of these missions beam back reams of raw data that must be processed and stored so that it can be accessed and used as input to computer models and scientific studies to understand past environmental conditions, place our current situation in the proper context, and make predictions about the future path our planet could follow.
To view this video please enable JavaScript, and consider upgrading to a web browser that
supports HTML5 video
During its nearly 37-year run, The Earth Observer has borne witness to the successes, failures, frustrations, and advancements of EOS, and of the broader Earth Science endeavors of NASA and its domestic and international partners. Given that publication of this final content marks the end of an era, the newsletter team felt it appropriate to offer some perspective on the newsletter’s contribution. The feature that resulted focuses on the relationship between The Earth Observer and EOS – with specific emphasis on our reporting on satellite missions. See the online article, The Earth Observer: Offering Perspectives from Space Through Time, to learn more.
One of the final items published focuses on Terra, the first EOS flagship, which launched into the night sky on Dec. 18, 1999 from Vandenberg Space Force [then Air Force Base (VSFB)] in California on what was designed as a six-year mission of discovery. Terra’s payload included five instruments – Advanced Spaceborne Thermal Emission and Reflection Radiometer (ASTER), Clouds and the Earth’s Radiant Energy System (CERES), Measurement of Pollution in the Troposphere (MOPITT), Multi-angle Imaging SpectroRadiometer (MISR), and Moderate Resolution Imaging Spectroradiometer (MODIS) – intended to collect data that would fill in gaps in our knowledge of the Earth System (as it stood on the cusp of the 21st century). In particular, the satellite gathered information about how land interacts with the atmosphere on a regional and continental scale. The mission also focused on measuring key planetary characteristics needed to understand Earth’s changing environment (e.g., albedo, roughness, evaporation rate, and photosynthesis). The goal was to provide a holistic approach to address larger scientific questions. For more than 26 years, Terra has trained her five instruments toward Earth and gathered data to address wildfires, flooding, hurricanes, and polar ice.
As 2020 drew to a close, in order to conserve enough fuel for the end of the mission, NASA Headquarters decided it was time to for Terra to stop conducting the periodic maneuvers to maintain its 10:30 AM equator crossing. After ceasing maneuvers, the satellite began to drift, which Terra (and the other flagships) have done for the past few years. As Terra’s life draws to a close, it continues to ignite the imagination of the next generation of scientists to catapult the study of our planet for generations to come. Refer to the article, Terra: The End of an Era, to learn more about the feat of engineering that has kept the satellite gathering data two decades past the end of its “Prime Mission” and the key scientific achievements that have resulted.
Since 1997, six CERES instruments have been launched on the EOS and the Joint Polar Satellite System (JPSS) platforms, including the Tropical Rainfall Measuring Mission (TRMM), Terra [2], Aqua [2], the Suomi National Polar-orbiting Platform (Suomi NPP), and the Joint Polar Satellite System–1 (JPSS-1, now named NOAA–20) missions, and used to study Earth’s radiation budget (ERB) – the amount of sunlight absorbed by Earth and the amount of infrared energy emitted back to space – that has a strong influence on climate. Researchers pair measurements from CERES instruments with information gathered from other sources to clarify ERB. While the latency of CERES data prevents it from being used for weather forecasting directly, the information on ERB can be used to verify the radiation parameterization of computer models used to make weather forecasts and predictions about future climate conditions. The ERB data can also be applied to other science research and applications that benefit society. As an example, researchers have used this data to accurately detail changes in the movement of energy from Earth – especially the role that clouds and aerosols play in Earth’s energy budget. The CERES Science Team has a long history of recording proceedings of their meetings in The Earth Observer. It is thus appropriate that a CERES STM summary should be among the last items published this newsletter. Read more about the current status of CERES in space in the article, The State of CERES: Updates and Highlights.
The CERES STM also includes an update on the Polar Radiant Energy in the Far InfraRed Experiment (PREFIRE) mission, which publicly released its data products in June 2025. PREFIRE measurements are being used to quantify the far-infrared spectrum beyond 15 mm – which accounts for over 50% of the outgoing long wave radiation in polar regions. Additionally, the atmospheric greenhouse effect is sensitive to thin clouds and small water vapor concentration that have strong far infrared signatures. PREFIRE consists of two shoebox-sized CubeSats, which launched into near polar orbits on separate Rocket Lab Electron rockets from New Zealand in May and June of 2024. Each CubeSat has a miniaturized infrared spectrometer onboard covering 5 to 53 mm with 0.84 mm sampling and a planned operational life of one year. A complete infrared emission spectrum will provide fingerprints to differentiate between several important feedback processes (e.g., cloudiness and water vapor) that leads to Arctic warming, sea ice loss, ice sheet melt, and sea level rise.
NOAA and NASA have partnered in many endeavors together. The Earth Observer has reported on these collaborations over the years. One well known example is the two agency’s partnership to develop and launch the Geostationary Operational Environmental Satellites (GOES). This mission has become the backbone of short-term forecasts and warnings of severe weather and environmental hazards. The first satellite, GOES-1, launched in 1975; the most recent, GOES-19, launched in 2024. The technology onboard has improved exponentially over the past five decades. The article, Sentinels in the Sky: 50 Years of GOES Satellite Observations, describes this progression, highlights some of the data obtained, and provides insights into each of these incremental advancements over the past 50 years in this satellite series.
Turning now to another recent launch, the Plankton, Aerosol, Cloud, ocean Ecosystem (PACE) satellite continues to operate nominally. The data PACE returns allow the scientific community to explore the Earth’s ocean, atmosphere, and land surfaces. In February 2025 (10 days prior to the first anniversary of the mission’s launch), the PACE community gathered at NASA’s Goddard Institute for Space Studies (GISS) for the PAC3 meeting, which was so named because it combined three PACE-related activities: the PACE Postlaunch Airborne eXperiment (PACE–PAX), the third PACE Science and Applications Team (SAT3), and the PACE Validation Science Team (PVST). The PAC3 meeting included updates on the three instruments on PACE: the Ocean Color Instrument (OCI), the Hyper-Angular Rainbow Polarimeter–2 (HARP2), and the Spectropolarimeter for Planetary Exploration (SPEXone).
In addition to reporting on PACE, participants during the meeting gave updates on the latest news about the Earth Cloud Aerosol and Radiation Explorer (EarthCARE) observatory, including preparation for validation activities as part of the joint efforts of the European Space Agency (ESA) and Japan Aerospace eXploration Agency (JAXA). The article also details operational highlights, including validation and aerosol products and cloud products. Several Science and Applications Team (SAT3) groups presented results from studies using PACE data and PACE validation studies. The PACE Science Team will continue to monitor Earth and have identified strategies to continue the long-term data calibration and algorithm refinement to ensure the ongoing delivery of information to the research community. The article, Keeping Up with PACE: Summary of the 2025 PAC3 Meeting, provides a full summary of this event.
On Nov. 16, 2025, the Sentinel-6B mission launched from VSFB. The newest satellite in NASA’s Earth observing fleet measures sea levels with an accuracy of one inch every second, covering 90 percent of the oceans every 10 days. It will also contribute the record of atmospheric temperature and humidity measurements. These data are beneficial in observing movement of surface currents, monitoring the transfer of heat through the oceans and around the planet, and tracking changes in water temperature. Sentinel-6B will carry several instruments on this mission, including a radar altimeter, an advanced microwave radiometer, and a radio occultation antenna. The satellite’s observations will be paired with information from other spacecraft to provide detailed information about Earth’s atmosphere that will contribute high-resolution data for computer models to improve weather forecasting.
Sentinel-6B is another shining example of successful collaboration between NASA and NOAA, along with several European partners – ESA, the European Organisation for the Exploitation of Meteorological Satellites (EUMETSAT), Centre National d’Études Spatiales (CNES), and the European Commission.
Sentinel-6B has publicly released an image showing some of its first observations since launch. The map shows sea levels across a vast stretch of the eastern seaboard and Atlantic Ocean – see Figure 3. The image combines data from Sentinel–6B and its “twin” Sentinel-6 Michael Freilich, which launched in 2020. The data were obtained on Nov. 26, 2025 – just ten days after Sentinel-6B launched.
Figure 3. Sentinel-6B (S6B) and Sentinel-6 Michael Freilich (S6MF) captured data on Nov. 26, 2025 of sea levels across a vast stretch of the Atlantic Ocean. Within the crisscrossing bands, red indicates higher water height relative to the long-term average; blue indicates lower water height. The tracks are layered atop the combined observations of all available sea-level satellites. S6MF currently serves as the “reference” mission, allowing data from all other altimeters to be accurately combined into maps like this one. Credit: EUMETSATTogether, Sentinel-6B and Sentinel-6 Michael Freilich make up the Copernicus Sentinel-6/Jason- Continuity of Service (CS) mission developed by NASA, ESA, EUMETSAT, and NOAA. Sentinel–6/Jason CS continues a series of ocean surface topography missions that began three decades ago with the NASA/CNES Ocean Topography Experiment (TOPEX)/Poseidon mission. The article, Sentinel-6B Extends Global Ocean Height Record, provides an overview of this latest addition to the NASA and to the international Earth observing fleet.
The July–Sept. 2025 posting of “The Editor’s Corner” reported on the successful launch of the joint NASA–Indian Space Research Organization (ISRO) Synthetic Aperture Radar (NISAR) mission on July 30, 2025 from the Satish Dhawan Space Centre on India’s southeastern coast aboard an ISRO Geosynchronous Satellite Launch Vehicle (GSLV) rocket 5. Soon after launch, NISAR entered its Commissioning phase to test out systems before science operations begin. A key milestone of that phase was the completion of the deployment of the 39-ft (12-m) radar antenna reflector on Aug. 15, 2025. A few days later, on Aug. 19, 2025, NISAR obtained its first image and on Nov. 28, 2025, ISRO made the image (and others) publicly available – see Figure 4.
Figure 4. The first NISAR S-band Synthetic Aperture Radar (SAR) image, acquired on Aug. 19, 2025, captures the fertile Godavari River Delta in Andhra Pradesh, India. Various vegetation classes (e.g., mangroves, agriculture, arecanut plantations, aquaculture fields) are clearly seen in the image, which highlights the ability of NISAR’s S-band SAR to map river deltas and agricultural landscapes with precision. Credit: ISRODuring the Commissioning phase, the S-band Synthetic Aperture Radar (SAR) has been regularly obtaining images over India and over global calibration-validation sites in various payload operating configurations. Reference targets such as Corner reflectors were deployed around Ahmedabad, Gujarat and a few more locations in India for calibration. Data acquired over Amazon rainforests were also used for calibration of spacecraft pointing and images. Based on this, payload data acquisition parameters have been fine-tuned resulting in high-quality images. The initial images have scientists and engineers excited about the potential of using S-band SAR data for various targeted science and application areas like agriculture, forestry, geosciences, hydrology, polar/Himalayan ice/snow, and oceanic studies.
NISAR has not one but two radars onboard. The S-band radar, described above, is India’s contribution to the mission; the L-band radar is NASA’s contribution. The L-band radar has also been active during the first few months of NISAR’s mission acquiring images of targets in the United States. Karen St. Germain [NASA HQ—Director of Earth Science Division] gave the opening presentation on the Hyperwall at NASA’s exhibit during the Fall 2025 meeting of the American Geophysical Union (AGU) in New Orleans, LA on Dec. 15, 2025. Her presentation, which can be viewed on YouTube, has a section on NISAR (beginning at the 5:33 time stamp) and includes several examples of novel applications made possible by NISAR’s L-band SAR imaging capabilities.
During her AGU presentation, St. Germain also showed recent examples of data from the Surface Water Ocean Topography (SWOT) mission [at timestamp 0:03 on the YouTube video], highlighting its surface water mapping capabilities, and from PACE [at timestamp 3:34], highlighting its aerosol and biological monitoring capabilities. These missions not only detect aerosol plumes and phytoplankton blooms but are also able to tell what type they are. She briefly mentioned the Sentinel-6B launch [see timestamp 14:02], teasing her presentation at the Town Hall meeting to be held the next day, where she officially unveiled the Sentinel-6B “first light” image shown as Figure 2 in this editorial.
To conclude, The Earth Observer staff claims a moment of editorial privilege. In a way, we conclude where The Earth Observer began, by sending a “personal message” to all the scientists, engineers, educators, and others – both past and present – who have contributed to EOS and other NASA Earth Science programs that have been covered in this newsletter.
We would like to thank all of the NASA and other leaders, team members, scientists, technicians, students, and staff who have shared your stories over the decades. This publication would not have been the success that it was for so many years without the sustained contributions of the NASA and broader Earth Science community. To all those who volunteered their time to contribute to The Earth Observer over the years, offering your reviews, your subject matter expertise, and your collaboration, we say, “Thank you.” It has been an utmost pleasure to be at the forefront of reporting on the emerging results from your endeavors and bringing this information to the EOS community. We wish you all the best in whatever comes next. While we are saddened to lose the opportunity to continue to share your successes with the Earth Science community via The Earth Observer, we will continue to cheer on your effort and look for future opportunities to publicize your successes however we can.
Alan Ward
Executive Editor of The Earth Observer
Barry Lefer
Associate Director of Research, Earth Science Division
The State of CERES: Updates and Highlights
42 min read
The State of CERES: Updates and HighlightsIntroduction
The Clouds and the Earth’s Radiant Energy System (CERES) was initially designed in the late-1980s and early-1990s as a facility instrument for NASA’s Earth Observing System (EOS). Since its inception, NASA’s Langley Research Center (LaRC) has led this effort. CERES has a long history with seven different instruments flying on five different missions since 1997. As of today, six CERES instruments remain in orbit – two are no longer operational: the Proto-Flight Model (PFM) unit flew on the Tropical Rainfall Measuring Mission (TRMM) and functioned for a brief period, and FM2, which was powered-off in January 2025 due to battery constraints on Terra. The active CERES instruments are found on Terra (FM1), Aqua (FM3 and 4), the Suomi National Polar-orbiting Partnership (Suomi NPP) (FM5), and the first Joint Polar Satellite System (JPSS-1) mission, now known as NOAA-20 (FM6). Suomi NPP and the JPSS mission are partnerships between the National Oceanic and Atmospheric Administration (NOAA), which owns the satellites, and NASA, which operates them.
The CERES Team has maintained a history of its Science Team (ST) Meetings, recorded in The Earth Observer. The first CERES STM to be mentioned in the newsletter was the third meeting [Jan. 1990, 2:1, 7], which was listed on the “EOS Calendar.” The earliest full STM summary captured events from the seventh meeting in Fall 1992, CERES Science Team [Jan.–Feb. 1993, 5:1, 11–16]. Since then, the periodic reports (typically spring and fall) have kept readers up to date on the status of the CERES instruments in orbit and the science results from the data gathered. With such a long history of published meeting summaries, it seems fitting that a report on the state of CERES should be among the last articles published by The Earth Observer.
The most recent CERES contribution to The Earth Observer was the article, Update on the State of CERES and Highlights from Recent Science Team Meetings [Sept.–Oct. 2023, 35:5, 43–53]. Since that time, CERES has held four STMs – bringing the total to 42. Norman Loeb [LaRC—CERES Principal Investigator (PI)] hosted all the meetings.
The four most recent meetings were:
- The 39th CERES STM (Fall 2023) at the NASA Goddard Institute for Space Studies (GISS) in New York, Oct. 17–19, 2023.
- The 40th CERES STM (Spring 2024) at LaRC in Hampton, VA, May 14–16, 2024.
- The 41st CERES STM (Fall 2024) at Lawrence Livermore National Laboratory in Livermore, CA, Oct. 1–3, 2024; and
- The 42nd CERES STM (Spring 2025) at LaRC, May 13–15, 2025.
A Fall 2025 meeting had been scheduled at LaRC from Oct. 28–30, 2025, but was cancelled due to the Federal Government shutdown. Planning is underway for another meeting to be held in Spring 2026.
This article will focus on the Fall 2023 and Spring 2024 meetings – drawing primarily from the State of CERES presentation, programmatic content, and mission and instrument status reports delivered at those meetings. The sections on the State of CERES and Invited Presentations also include content from the Fall 2024 and Spring 2025 meetings. The contributed presentations from these latter meetings are not included in this article. For more details, the reader is directed to the CERES website where agendas and links to individual presentations can be found for all four meetings.
The content in this article includes updates on the status of the platforms that carry CERES instruments, CERES data products and algorithms, and CERES outreach activities. The remainder of this article will consist of summaries of the invited science presentations given at these meetings, followed by selected science presentations. More information on the topics briefly mentioned in the summary from the meetings is contained in the respective presentations, which are available on the CERES website.
State of CERES
The State of CERES message is a long-standing tradition, opening the CERES STMs. At the beginning of each meeting, Norman Loeb outlined the major objectives of this group, which remained consistent from meeting to meeting. These objectives include host satellite health, instrument calibration updates, algorithm and validation status from the various Working Groups, and progress toward the next CERES reprocessing.
Loeb began the Fall 2023 meeting by reviewing the large increase in global mean surface temperature based on the European Centre for Medium-Range Weather Forecasts Reanalysis (ERA5) model Version 5 (V5) in 2023. The highest anomaly was reported in September 2023 for the period from 1979 to 2023. The CERES absorbed solar radiation (ASR) – a measure of the difference between incoming solar energy and the energy reflected back into space – exceeded the 90% confidence interval anomaly for March through September 2023 except for May, which does not quite exceed it. The net radiation also exceeded the 90% confidence interval through May of 2023. Starting in June 2023, the Outgoing Longwave Radiation (OLR) exceeded the negative 90% confidence interval, indicating a release of energy out of the atmosphere; however, the net radiation dropped below the 90% confidence interval for the remainder of the year. The 2023 value even exceeded the 2016 El Niño event. The extremely large ASR and OLR values continued into early 2024.
The CERES Terra FM2 operated in Rotating Azimuth Plane (RAP) mode until it failed in January 2025. After that, Terra FM1 switched to RAP mode during Terra’s drifting period. Aqua FM3 likewise operates in RAP mode as Aqua has drifted. This mode allows for capturing data at a larger range of solar zenith angles. For 48 months, the Suomi NPP FM5 has collected rotating-azimuth data; it returned to Cross-track Mode in October 2023. The team noted a small amount of noise periodically detected on the NOAA-20 FM6 shortwave (SW) channel from November 2023 through February 2024. This noise was only observable during space view when the counts approached zero. Several analyses on Earth-viewing footprints could not identify any impact on the SW radiance.
Loeb highlighted some other efforts that are of interest to the group. The World Climate Research Programme (WCRP) started a lighthouse activity on Explaining and Predicting Earth System Change (EPESC) with a focus on understanding and predicting the Earth Energy Imbalance (EEI). This work exemplifies another effort – CERES Model Intercomparison Project (CERESMIP) experiments – that was championed by GISS. The goal is to provide a larger overlap of model output with CERES observations than the earlier Coupled Model Intercomparison Project Phase 6 (CMIP 6), which only observed forcing through 2014 and projected forcing after 2014. Examples of these forcings are Sea Surface Temperature (SST), sea ice concentrations, aerosol and volcanic emissions, and solar irradiance. Climate variability since 2014 is quite pronounced, including EEI, SST trends, Pacific Decadal Oscillation shift, and El Niño events.
During the Fall 2024 meeting, Loeb discussed the impacts of the shifting Terra Mean Local Equatorial Crossing Time. He explained that the SW Top of Atmosphere (ToA) flux difference between NOAA-20 and Terra are smaller in the Northern Hemisphere than the Southern Hemisphere due to closer observation times. The longwave (LW) flux difference is smaller between hemispheres. The CERES team has been collaborating with the European Space Agency’s Earth Cloud, Aerosol and Radiation Explorer (EarthCARE) project to compare results from its Broadband Radiometer (BBR) with those from CERES. Early results showed that EarthCARE’s BBR SW channel is 8% brighter than CERES, and the LW channel is very consistent with CERES – with the possible exception of very cold scenes being colder than CERES. At the May 2025 meeting, Loeb announced that a 25-year Earth Radiation Budget (ERB) record – from March 2000 to February 2025 – has been established.
Bill Smith, Jr. [LaRC] continued the presentation with a review of the progress of the CERES Edition 5 clouds algorithms. This presentation examined the status of balancing the three goals of this effort. He noted the need for consistency between the derived cloud products from the Moderate Resolution Imaging Spectroradiometer (MODIS) on Terra and Aqua and the Visible Infrared Imaging Radiometer Suite (VIIRS) on Suomi NPP and NOAA-20 – especially given the differences in the bands on each instrument. In addition, he discussed the consistency between three generations of geostationary imagers that cover the 25 years in both timeline and across the globe. CERES uses data from NOAA’s Geostationary Operational Environmental Satellites (GOES 9–18); the European Organisation for the Exploitation of Meteorological Satellites’ (EUMETSAT) Operational Meteorological Satellites (Meteosat 5–11); and the Japanese Meteorological Agency’s (JMA) Geostationary Meteorological Satellite (GMS 5), Multifunction Transport Satellite (MTSAT 1R and 2), and Himawari 8 and 9. Finally, Smith presented the accuracy of this approach compared to observations from Cloud-Aerosol Lidar with Orthogonal Polarization (CALIOP) on the Cloud-Aerosol Lidar and Infrared Pathfinder Satellite Observations (CALIPSO) mission.
In his presentations during the Fall 2024 and Spring 2025 meetings, Smith demonstrated improvements with the Edition 5 algorithm showing consistent cloud fraction between MODIS on Aqua and VIIRS on NOAA-20 – with the ocean values being within 2% for both day and night. He noted that additional work still needs to be done for land and polar night. A comparison with CALIPSO data showed that daytime cloud fraction measurements from VIIRS on NOAA-20 are more consistent than those from MODIS on Terra and Aqua. The Edition 5 nighttime algorithm fixes the overestimates in cloud fraction for high clouds, but still underestimates low clouds [below 3 km (1.9 mi)] by 10%. The geostationary imager-derived clouds common three-channel algorithm has better consistency between satellites and day and night cloud fraction. Smith also added that there are some discrepancies in cloud optical depth and particle size between the European Meteosat imager and the other geostationary satellites. The use of the K-D tree algorithm has improved consistency at night with the day cloud properties.
Wenying Su [LaRC] explored how fluxes may change if the Angular Distribution Models (ADMs) are created in different weather patterns (i.e. during El Niño and La Niña events). Two sets of Terra CERES ADMs were produced – one using 24 El Niño months and the other using 24 La Niña months. The global differences between SW fluxes composed from these two sets of ADMs were 0.5 Wm-2 regardless of the period (e.g., El Niño, La Niña, or neutral phase) and showed the same regional difference patterns. Su also explained how to partition the ToA SW fluxes from CERES into visible and near-infrared (NIR) fluxes. She showed how to use spectral radiances generated using look-up tables (LUT) from the MODerate resolution atmospheric TRANsmission (MODTRAN) code and spectral radiances measured by the VIIRS imager to separate the spectrum – see Figure 1. A ratio between the modeled visible band and CERES SW radiance is derived using the LUT. For water clouds, the visible band has the highest albedo due to cloud absorption being near zero. The NIR albedo is much lower than visible band due to high cloud absorption. For ice clouds, the two albedos are closer because ice clouds are more reflective in NIR than the visible band and there is less water vapor absorption above the cloud.
Figure 1. Using spectral radiance measurements generated using look-up tables (LUT) produced by the MODerate resolution atmospheric TRANsmission (MODTRAN) model and spectral radiances measured directly by the Visible Infrared Imager Radiometer Suite (VIIRS), top of atmosphere shortwave fluxes from CERES can be partitioned into monthly gridded instantaneous visible (VIS) [top left] and near-infrared (NIR) [top right] albedo, CERES derived cloud fraction [bottom left], and cloud optical depth from Suomi NPP VIIRS data for context [bottom right]. Figure credit: Su et al., 2024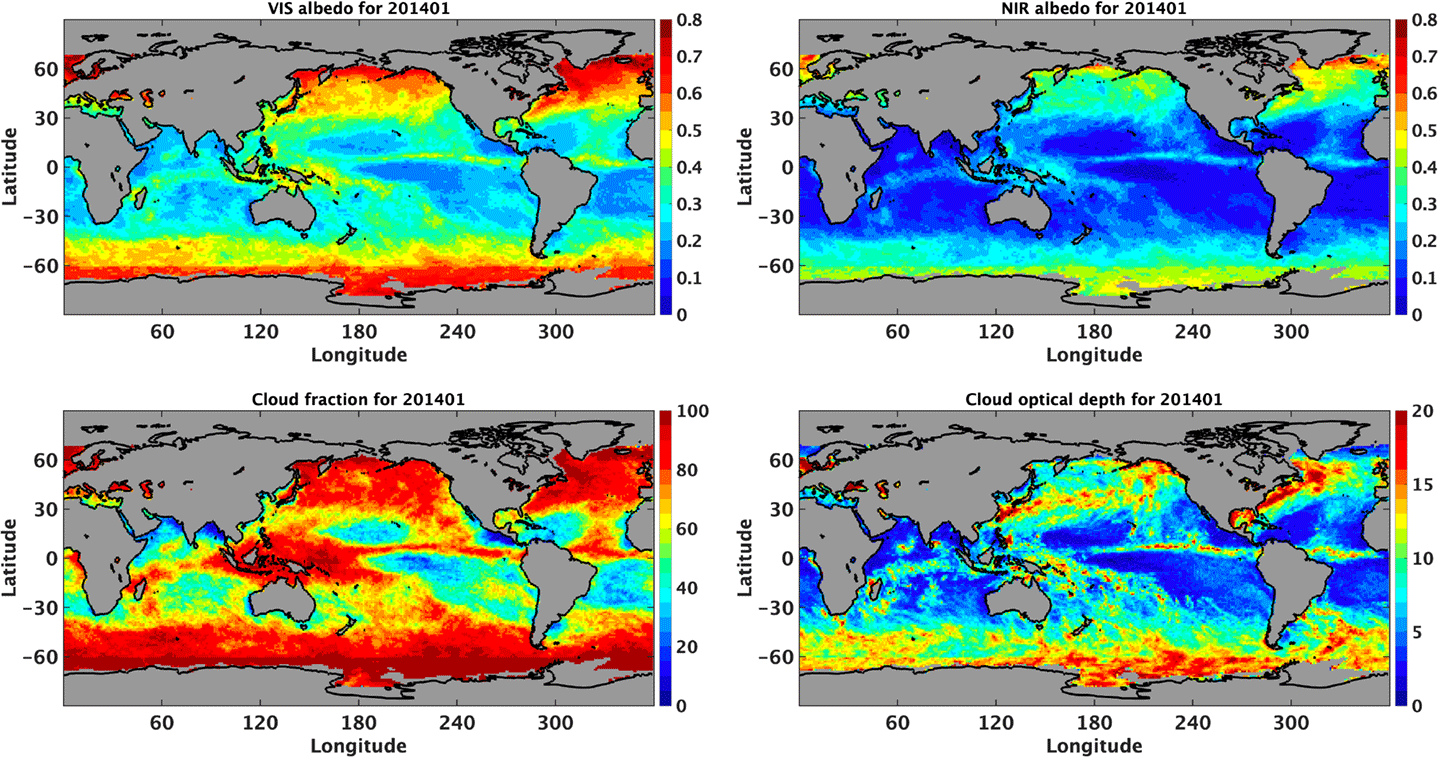
Lusheng Liang [LaRC, Analytical Mechanics Associates (AMA)] discussed the creation of ADMs using additional RAPS data from November 2021 (when Terra started drifting from the Mean Local Time Equatorial crossing of 10:30 AM) to April 2024. This period of observations provided data obtained at a solar zenith angle that is approximately 10° higher in the tropics than was observed during the initial period used for ADM development. New ADMs developed using data from this period have the largest impact for clear sky overland and cloudy sky over ocean versus clear sky over ocean and cloudy sky over land. Liang has also worked to improve the unfiltering coefficients, using the latest version of MODTRAN 5.4, Ping Ying’s cloud properties, two additional view zenith angles, seven additional solar zenith bins, and MODIS BRDF kernels over land and snow. The application of these changes to SW and LW from total minus SW resulted in a -0.30 and 0.30 W/m2 respectively for July 2019. Since NOAA-20’s FM-6 instrument has a LW channel, the team made an effort to reduce the differences between the LW channel from the total channel minus the SW channel. They also created a correction using warmer temperatures for the model over desert areas and cooler temperatures over vegetated land.
Dave Doelling [LaRC] presented a method to compare data from two ERB instruments in the same orbit, such as CERES on NOAA-20 and Libera on JPSS-4. This method is necessary without data from Terra. This approach used the invariant target of Libya-4. He compared the results using CERES instruments on Suomi NPP and NOAA-20. He added a second target to this analysis: Deep Convective Clouds that have cloud tops below 220 K located in the Tropical Western Pacific. Another approach placed the CERES instrument in a scan mode, matching the view zenith of the geostationary orbiting satellites (i.e., Terra FM2, Aqua FM3, and Meteosat-11). The geostationary imager radiances were used to determine the broadband LW flux, which was compared to the CERES-observed LW flux. The regression of these matched pairs of radiances showed that the Terra and Aqua CERES LW regression are within 0.2%. A machine learning approach to determine LW broadband flux from geostationary satellite imager radiance data showed a 75% decrease in bias and a 9% decrease in Root Mean Square Error over the multi-linear regression approach used in Edition 4. Doelling used a similar approach when working with data from the VIIRS imager, using radiance measurements to assign LW and SW fluxes to the cloud layers in the CERES footprint. When normalizing the individual portion of the footprint to the observed CERES data, the global bias is less than 1 W/m2.
In the Spring 2025 meeting, Doelling reported on the small change in monthly global variables from using MERRA-2 instead of GEOS 5.4.1 reanalysis in production of the Single Scanner Footprint (SSF) one degree and Synoptic one degree based on a minimum of a year overlap. He also highlighted the changes in the next version of SYN1deg Edition 4B. These changes included reprocessing of the three two-channel satellites (GMS-5, Met-5, and Met-7), using interpolated cloud retrievals over twilight hours (solar zenith > 60º), and transition to using data from NOAA-20 only and MERRA-2 reanalysis after March 2022.
Seung-Hee Ham [Analytical Mechanics Associates/LaRC] reported the availability of instantaneous Terra and Aqua CERES computed fluxes at the surface and ToA on a 1° equal angle grid [CERES Cloud and Radiative Swath (CRS1deg-Hour)] from January 2018 to December 2022. The algorithm changes to the Edition 5 Fu-Liou radiative transfer calculations reduced the LW ToA flux bias to less than 0.5 W/m2 from around 2 W/m2 with Edition 4.
Ham also discussed plans to increase the number of bands (from 18 to 29) in the Fu-Liou radiative transfer calculations and the corresponding shift in wavelength cut-off used for the bands. Nine gas species will now be used in Edition 5 for each band instead of the maximum of four species used in only one band currently. The line-by-line gas database has also been updated. These changes have less than a 2 W/m2 change in the SW and LW broadband fluxes between Edition 4 and 5, but line-by-line results show better performance.
Seiji Kato [LaRC] evaluated the computed irradiance trends at the ToA, surface, and within the atmosphere. At ToA for all-sky conditions, SW flux has been increasingly adding energy. Conversely, LW flux has been removing the additional energy, but at a smaller rate leading to an overall increase in net energy. At the surface for all-sky conditions, SW flux has been increasing energy, while LW flux has been decreasing at almost the same rate. As a result, there has been a small net increase. Within the atmosphere, the SW flux has increased more than the LW flux, but they are both positive. The global all-sky mean aerosol direct radiative effect from the synoptic one-degree (SYN1deg) was -2.2 W/m2, which was just below the -2.0 W/m2 mean from previous studies.
Paul Stackhouse [LaRC] presented the impact of transitioning the meteorology used in Fast Longwave and SHortwave Flux (FLASHFlux) to the Goddard Earth Observing System–for Instrument Teams (GEOS-IT) product. The global mean difference was less than 0.5 W/m2 in LW daytime surface downward flux, but the zonal bias can reach an absolute value of 5 W/m2 – see Figure 2.
Figure 2. Global annual mean Top of Atmosphere radiative flux changes between 2022 and 2023 for [top], outgoing longwave radiation and [bottom], and reflective shortwave radiation. Figure credit: Stackhouse et al., 2024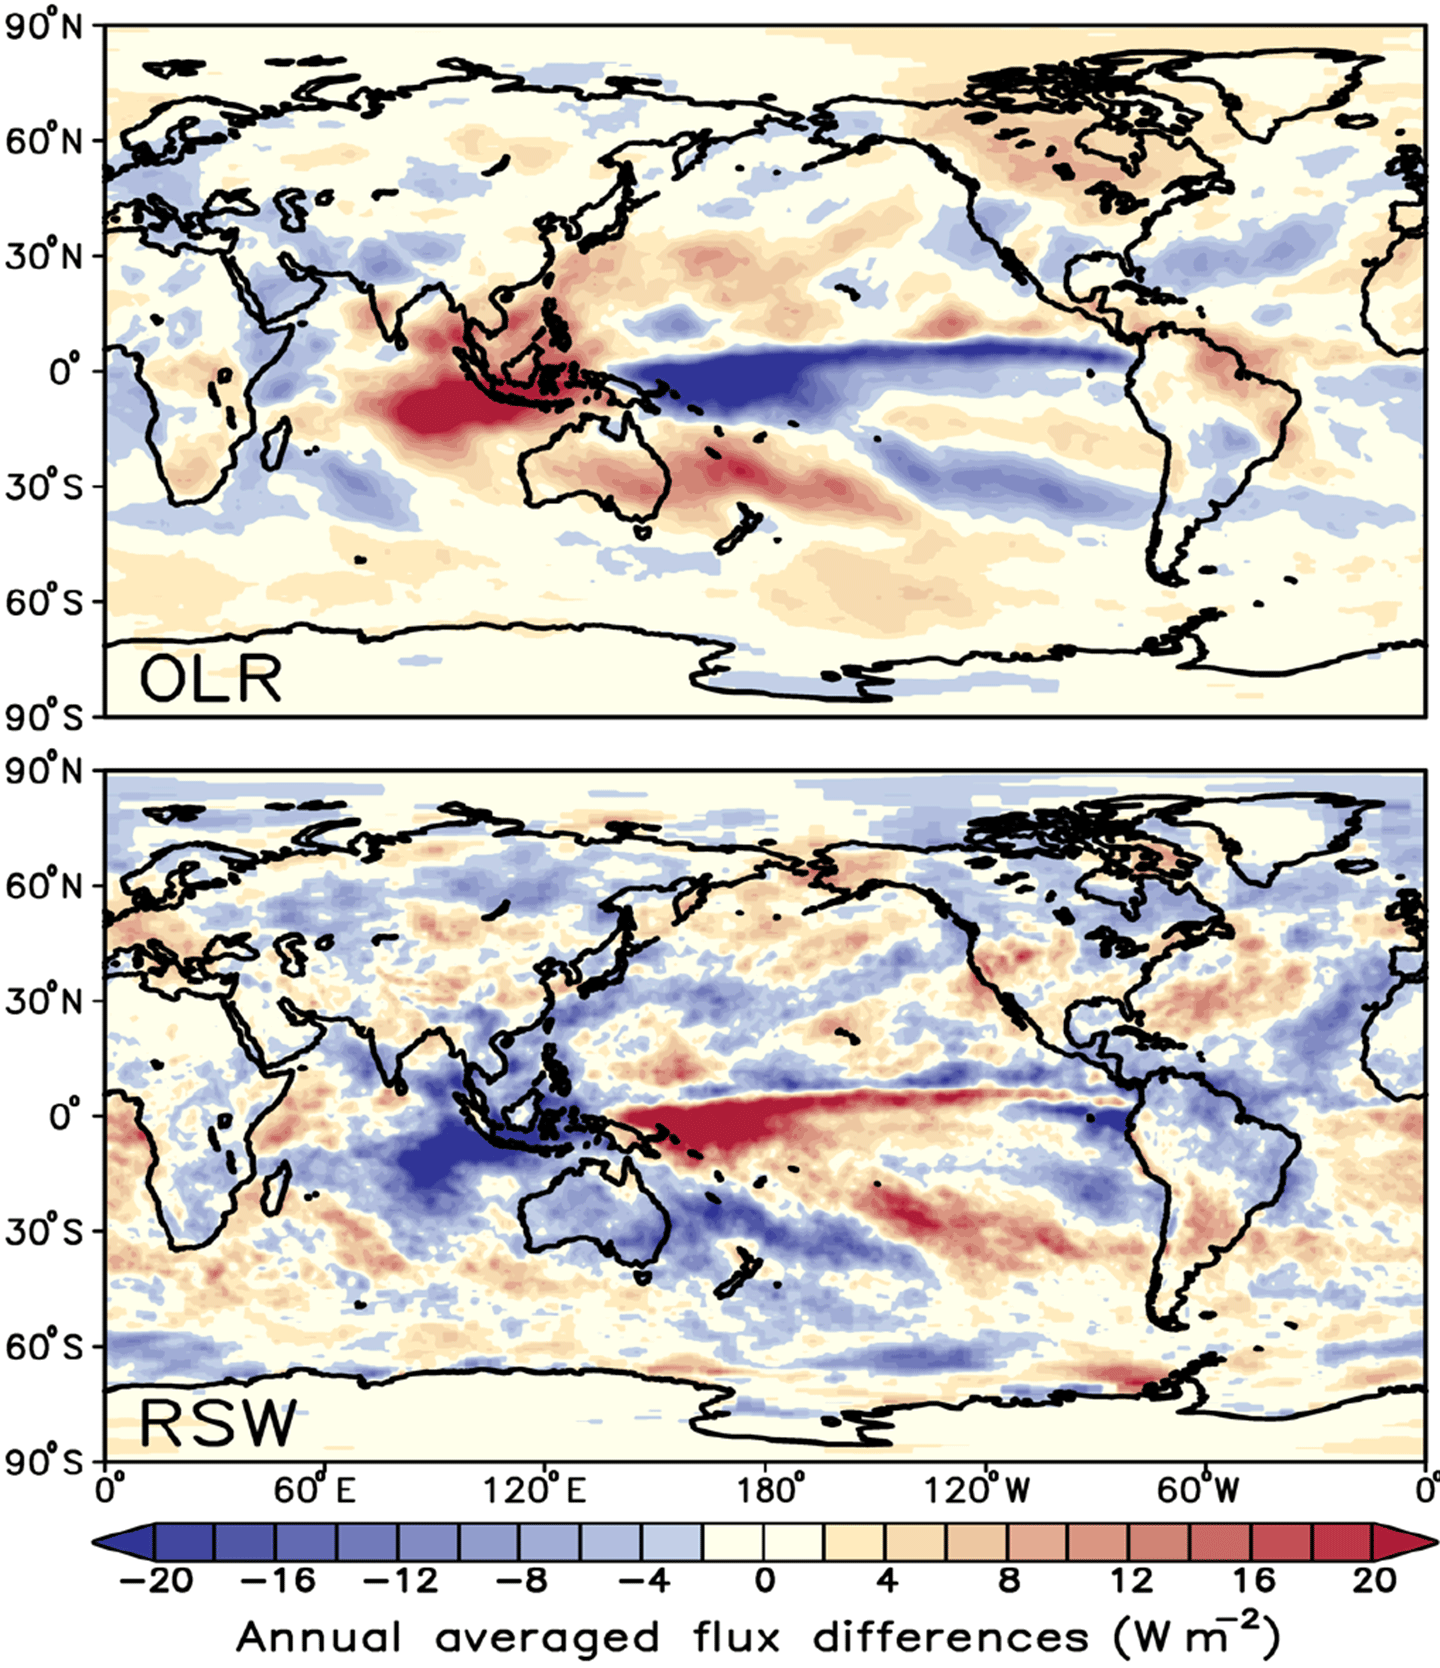
The Global Learning and Observation to benefit the Environment (GLOBE) clouds team ran Eclipse Challenges during the October 2023 annular and April 2024 total solar eclipses. During each event, citizen scientists were encouraged to collect temperature and cloud measurements before and after the eclipse. The participants collected 34,000 air temperature measurements (which is 2.3 times the average number of observations) and 10,000 (13 times average) cloud measurements for both events. The cloud data showed a decrease in cloudiness as the eclipse approached and an increase after, but contrails showed a steady increase. The data also showed a noticeable decrease in air temperature at the local eclipse maximum.
Invited Science Presentations
The CERES STM typically invites two presentations at each meeting. The summaries for these presentations appear here in chronological order. The Fall 2023 presenters looked at responses to greenhouse gas (GHG) radiative forcing. The Spring 2024 presenters explored the Earth’s hemispheric albedo symmetry and the impact of aerosol changes on the cloud radiative effect (CRE). The Fall 2024 presenters discussed preparation of forcing datasets for CMIP 7 and cloud feedback in models. The Spring 2025 presenters explored trends in spectral radiances and the radiative forcing pattern effect.
Ryan Kramer [NOAA, Geophysical Fluid Dynamics Laboratory] explored the decomposition of the EEI as a tool for monitoring climate change. Kramer explained a Making Earth Systems Data Records for Use in Research Environments (MEaSURE) effort to pull together records from multi-instruments needed for decomposition of radiation forcing and radiative feedback from temperature, water vapor, ToA flux, surface albedo, and CRE – see Figure 3. The portion of the total radiative imbalance not attributed to feedback is due to radiative forcing from LW flux, 0.27 W/m2. This result – supported by observations and by results from the Suite of Community Radiative Transfer codes based on Edwards and Slingo (SOCRATES) – used a radiation scheme created by researchers at the United Kingdom Meteorological (UKMet) Office, where the radiative forcing is caused by an increase in GHG. The atmospheric cooling is balanced with sensible and latent heat flux related to precipitation. Latent heating from precipitation is inversely correlated with atmospheric radiative change. Decomposed atmosphere radiative forcing and feedback showed how GHGs radiatively heat the atmosphere but mute the trend in global precipitation. The reduction of aerosol in China since the 2008 Summer Olympics has regionally increased the SW radiative forcing. This result provides an example of the impact of mitigation efforts. GHG forcing is stronger in the tropics due to larger concentrations of water vapor and decreases in extratropical regions.
Figure 3. Linear trends in shortwave radiative forcing from 2003 through 2018, demonstrating the direct radiative effect of changes in aerosols. Positive trends correspond to less shortwave reflection to space (more planetary absorption) over time. Estimated using Clouds and the Earth’s Radiant Energy System (CERES), Atmospheric Infrared Sounder (AIRS), and CloudSat observation. [Right] Linear trends in aerosol optical depth (AOD) from 2003 through 2018 from Moderate Resolution Imaging Spectroradiometer (MODIS). The AOD trends often mirror shortwave radiative forcing trends, as expected. A positive trend in shortwave radiative forcing (less reflection) stems from a negative trend in AOD. Figure credit: Kramer et al., 2021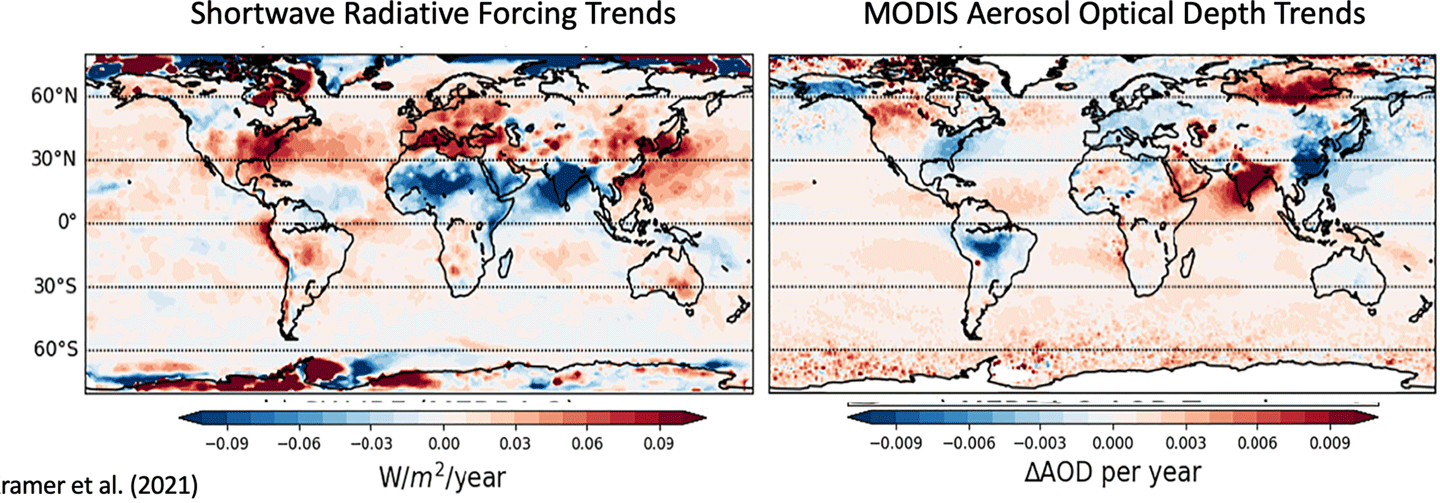
Susanne Bauer [GISS] examined aerosol and cloud forcing in relation to GHG forcing. Early in the twentieth century, data show aerosols counterbalanced 80% of the GHG forcing, but aerosols began to decrease at the start of this century, reducing their impact to 15% today. The direct aerosol forcing follows the mean aerosol optical depth. It reached the maximum impact in 1977 but has decreased slightly since then. The indirect aerosol forcing is four times larger than the direct forcing and reached its peak in 2007. GISS model version E.21 underpredicted the SW ToA trend and overpredicted the LW ToA – see Figure 4. The version E.3 model received a major upgrade in model physics, cloud microphysics, and turbulence scheme, resulting in substantial improvement modeling marine cirrus clouds, total cloud cover, and precipitable water vapor. The trend in LW ToA flux matches CERES in non-polar regions. While the SW all-sky trend shows improvement, it still underpredicts observations. For example, model aerosol is not picking up the biomass burning in Siberia, which seems to be an artifact of using an older emission data base for the study. The improved aerosol data results reveal a larger trend in cloud droplet number concentration compared to the observations gathered by the Terra satellite. These data remain consistent with the Precipitable Water Vapor trend.
Figure 4. The trend in shortwave clear sky radiation change at the top of the atmosphere over the 23-year time series, from 2001 to 2023, of the CERES datasets in units of W/m2 per decade. Clear sky conditions show changes in the energy budget that are not associated with clouds for [left] CERES dataset and [right] model data using the NASA GISS Model E3.1. Notable features include negative trends over China, Europe, and the Eastern United States, and a positive trend around India, in correspondence with cleaner aerosol conditions in the first three regions and still increasing pollution in India. Energy balance changes in the Arctic and Antarctic are associated with land and sea ice changes. Some of the positive and negative trends in Canada, Russia, Central and Southern Africa, and South America are strongly impacted by biomass burning patterns. Figure credit: Susanne Bauer/CERES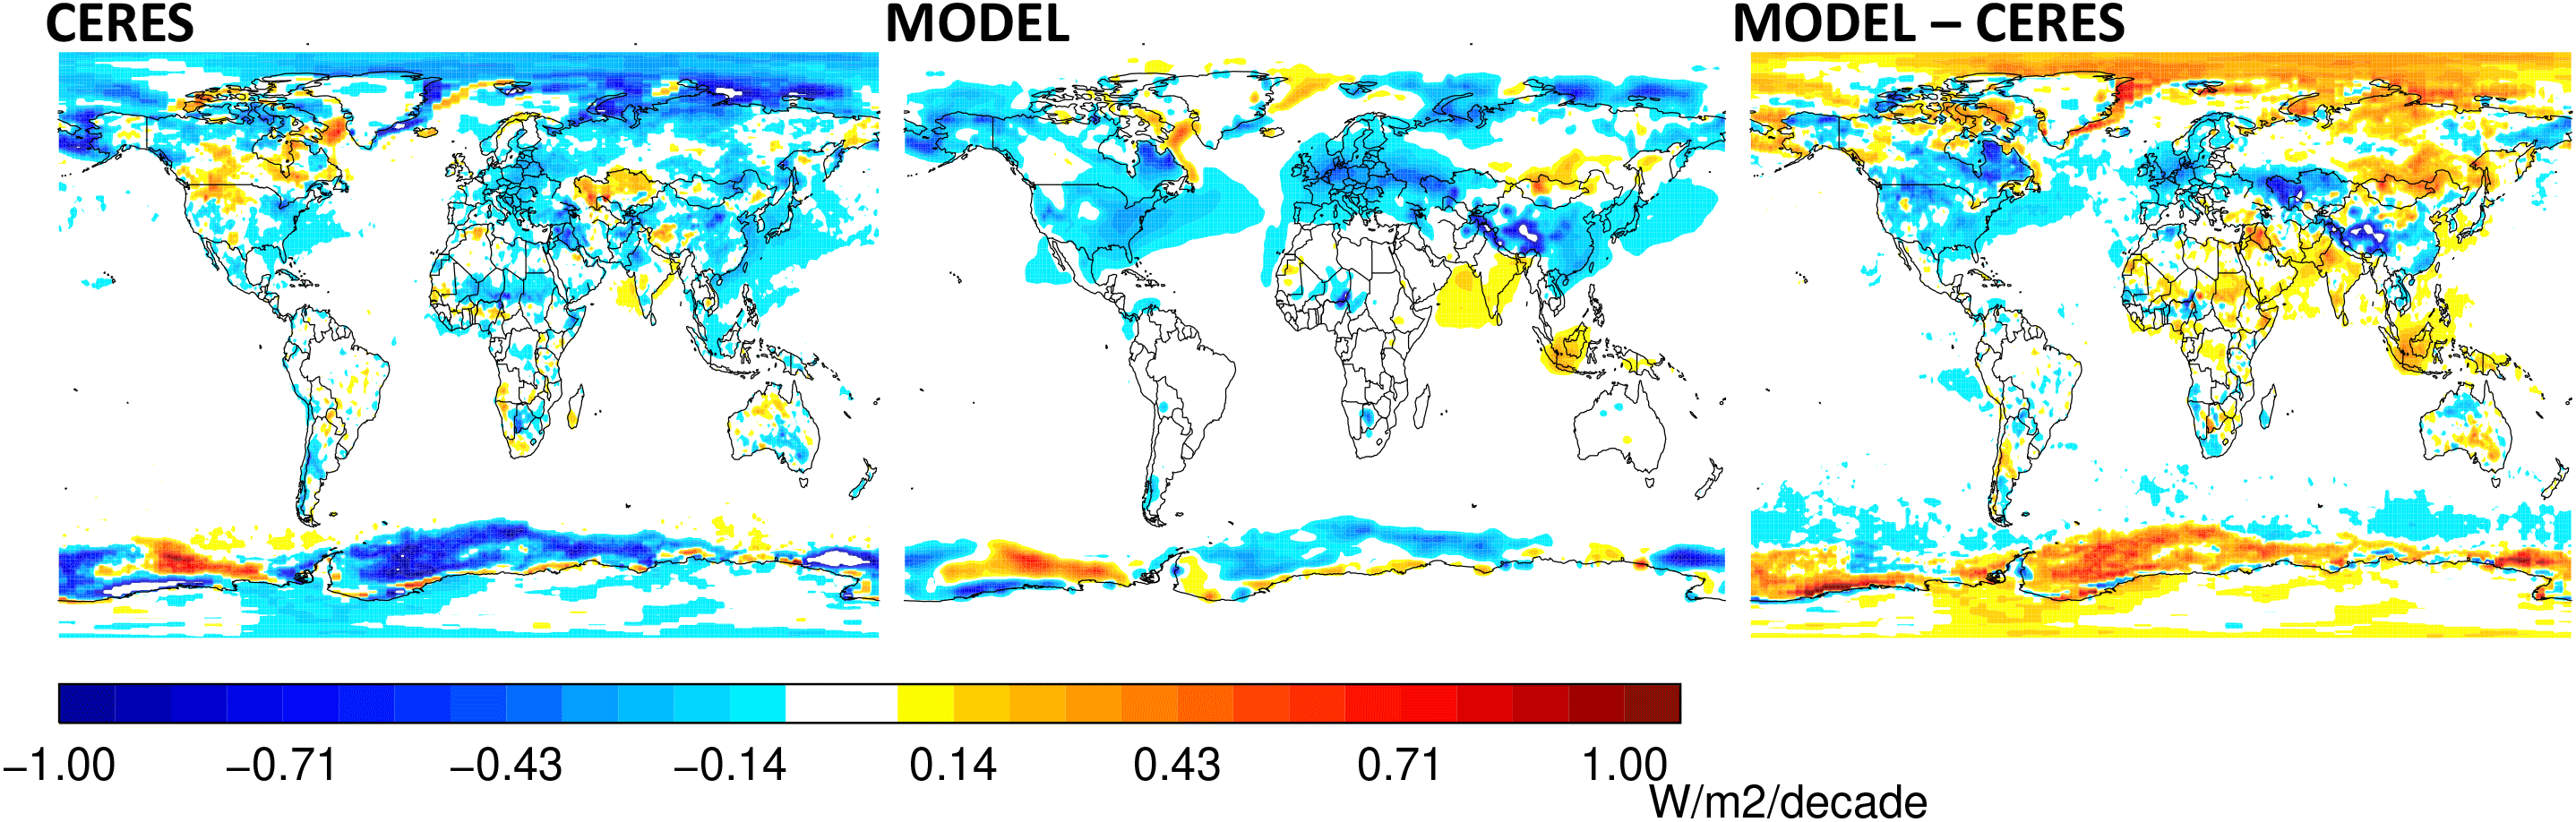
Michael Diamond [Florida State University] discussed a proposed test to evaluate whether Earth’s hemispheric albedo symmetry can be maintained. Currently, the all-sky albedo is nearly equal in both hemispheres, but the ToA clear-sky albedo is much greater in the Northern Hemisphere than the Southern Hemisphere, due to the distribution of landmasses. The Southern Hemisphere is also brighter in the visible wavelength, but darker in near-infrared spectrum. This symmetry is unique.
If the Earth was arbitrarily broken up into hemispheres, less than one-third of these hemispheres would be balanced within 1 W/m2. The solar reflection is symmetric, but outgoing LW radiation is not – with less energy leaving the Southern Hemisphere. This global imbalance is reduced with interhemispheric transport through the ocean and atmosphere.
Diamond discussed potential physical mechanisms that could maintain this symmetry (e.g., cloud feedback, solar climate intervention, or hydrological cycles). He noted that surface aerosols and high clouds increase albedo in the Northern Hemisphere, whereas low and altostratus clouds increase albedo in the Southern Hemisphere. Earth’s strong hemispheric albedo asymmetry is transient, which should allow for “natural experiments” to test the mechanism to maintain the symmetry. He discussed the moderate but long-term test for the loss of Arctic sea ice from 2002 to 2012, as well as the decline in clear-sky atmospheric reflection due to air pollution over China that peaked in 2010 and declined in 2019. He also discussed more abrupt changes, including the post-2016 decline in Antarctic sea ice, the decrease in Northern Hemisphere low cloud reflection caused by sulfur fuel regulation as enacted by the International Maritime Organization in 2020, the decreased Northern Hemisphere aerosol concentration following activity restrictions during the COVID-19 pandemic, the increased Southern Hemisphere aerosol concentration during the bushfires in Australia between 2019 and 2020, and the increased Northern Hemisphere aerosol concentration reflection following the Nabro volcanic eruption in 2011 – see Figure 5. Despite these multiple events, the expected change in clear-sky albedo from the surface or aerosol change seems to be masked in the all-sky albedo through simultaneous changes in cloud reflectivity. Many of these events overlap, which complicates how to interpret the results.
Figure 5. During the extreme 2019–2020 Black Summer bushfires in Australia, pollution levels over the Southern Ocean (as measured by aerosol optical depth, or the amount of light scattered and absorbed by pollution particles in the atmosphere) reached their highest values in approximately 20 years of monitoring by NASA’s Moderate resolution Imaging Spectroradiometer (MODIS). Figure credit: Diamond et al., 2024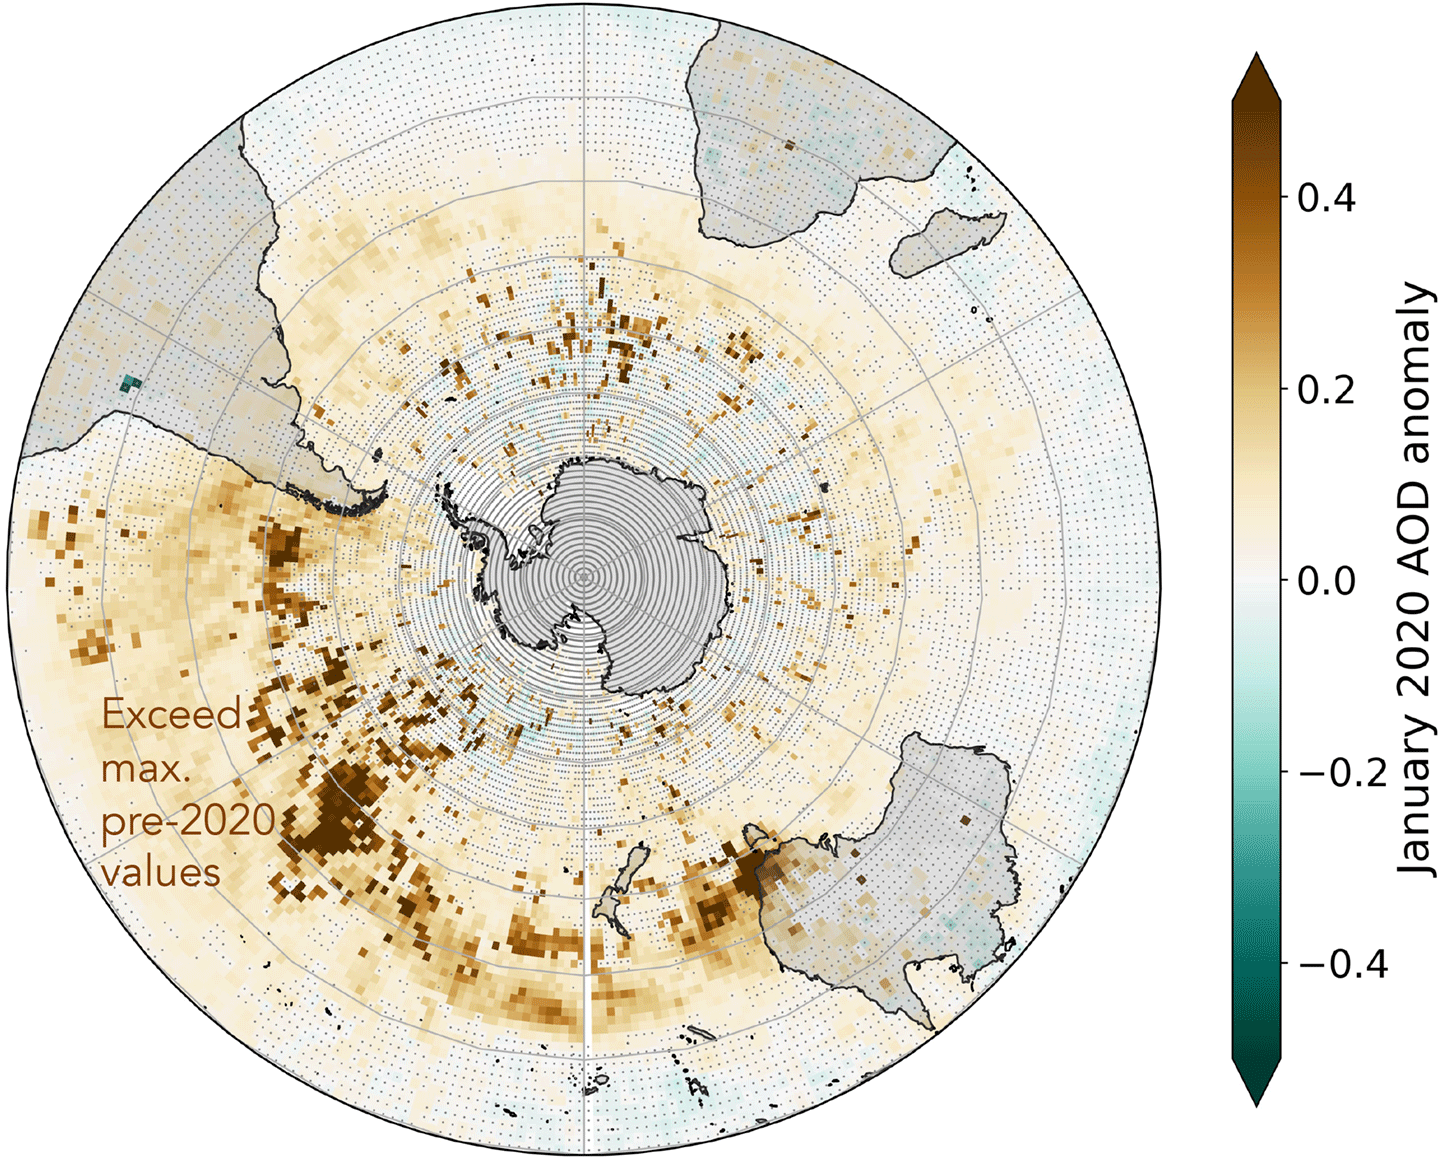
Daniel McCoy [University of Wyoming] discussed his investigation of uncertainty in cloud radiative feedback in climate forcing due to changes in aerosols. At this time, extratropical cloud feedback has an uncertainty of over 2.5 W/m2. Pollution leads to an increase in aerosol concentration, which impacts cloud formation and changes the droplet number concentration. This increase results in changes to the cloud coverage and amount of liquid water content in the clouds – see Figure 6. The work of McCoy and his colleagues has constrained the change in droplet number and liquid water content with the hope of narrowing the effective radiative forcing from aerosol–cloud interaction. Using results from the Community Atmosphere Model (CAM) 6 and observations, they were able to constrain the range of possible droplet number concentration by 27% and liquid water content by 28%. These constraints reduced the effective radiation forcing to 2%. McCoy argued that this small impact is due to the interaction between precipitation efficiency and radiative susceptibility through changes in the Liquid Water Path (LWP), which results in buffering of the radiative effect by reduced radiative sensitivity.
Figure 6. Water vapor path from the Morphed Integrated Microwave Imagery at CIMSS–Total Precipitable Water (MIMIC–TPW) product showing transient eddies moving moisture from the tropics to the extratropics. The relationship between moisture transport, precipitation, and albedo acts to set large-scale Earth system behavior. Figure credit: Development of the MIMIC-TPW2 product is supported by the Joint Polar Satellite System (JPSS) Risk Reduction Program and the Office of Naval Research.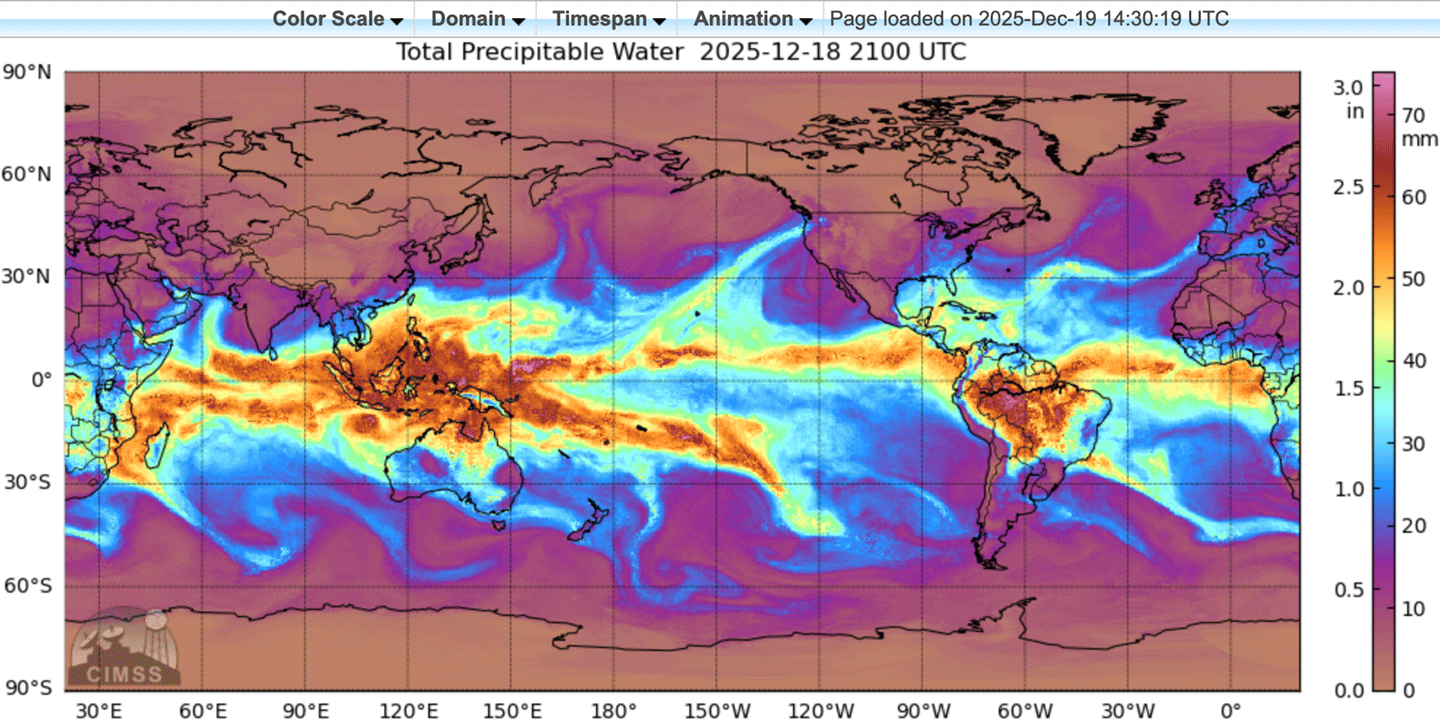
David Paynter [Geophysical Fluid Dynamics Laboratory (GFDL)] explored the spectral dimension of recent changes in ERB. The atmospheric state, temperature, and gas species, from each level in a grid box are used in a line-by-line (LBL) radiative code to calculate the spectra. The two codes used are the NOAA GFDL GPU-enabled Radiative Transfer (GRT) and the Reference Forward Model (RFM) from Oxford University. Paynter and colleagues used a LW radiation solver to get ToA fluxes. They then compared the monthly mean spectrally resolved ToA fluxes using ERA5 inputs for 2003 to 2021 to Atmospheric Infrared Sounder (AIRS) observations. Paynter showed that there is generally good agreement between all-sky AIRS climatology and the LBL calculations, and similar spectral trends; however, some bands have larger differences in the trend. The all-sky OLR between the LBL-ERA5, CERES, and AIRS show consistent positive trends between 0.15 to 0.31 W/(m2/decade); however, the LBL-ERA5 0.11 W/(m2/decade) and the CERES -0.15 W/(m2/decade) show disagreement.
David Thompson [Colorado State University/University of East Anglia] studied the pattern associated with ToA radiative response to changes in surface temperature. Historically, this has been accomplished by looking at the local radiative response due to local change in temperature or to global-mean temperature change. The first reflects a two-way interaction between the local radiative flux and local temperature that identifies areas that are changing. The second results are more difficult to interpret because the local response is multiplied by the same value. Thus, Thompson proposed a third method of evaluating the changes by using the global-mean radiative response to changes due to local changes in temperature. This approach identifies positive values with warm temperatures and downward radiative fluxes. The temperature variability over the Eastern Tropical Pacific contributes to positive values in the global internal feedback parameter. The reverse happens in the Western Tropical Pacific. Another advantage of this method is that the contribution of local feedback to the global feedback is easy to calculate. Using the CERES monthly-mean Energy Balanced and Filled (EBAF) data, the global weighted feedback is -1.1 W/m2 with global oceans contributing -0.2 W/m2 and global land -0.9 W/m2. The Eastern Tropical Pacific contribution is 0.1 W/m2 and the Western Tropical Pacific contribution is -0.1 W/m2. This approach can be applied to models to see which are representative of the observations. Preindustrial runs of the model generally reproduce the negative Western Tropical Pacific anomaly; however, Thompson noted that most models do not capture the positive anomaly in the Eastern Tropical Pacific.
Contributed Science Presentation
The following section provides highlights from the contributed science presentations. The content is grouped by Earth radiation instruments that are in development; new techniques for use in climate models and analysis of their results; applications of machine learning; and observational datasets and their analysis.
Future Earth Radiation Instruments
It should be noted that the information shared below reflects the mission plans at the time of the meeting. The mission goals may have changed as a result of changing budgets, agency priorities, and other factors.
Kory Priestly [LaRC] discussed the Athena Economical Payload Integration (EPIC) pathfinder mission using the NovaWurks Hyper Integrated Satlet small satellite platform that is integrated with a spare CERES LW detector and calibration module flight hardware. This setup was designed to test the novel building block approach to satellites as a potential path for the next ERB instrument at a reduced cost. [UPDATE: The Athena mission launched successfully on July 23, 2025. Unfortunately, after being released from the rocket the spacecraft started tumbling and could not be recovered.]
Tristan L’Ecuyer [University of Wisconsin–Madison] presented the science being answered by the Polar Radiant Energy in the Far InfraRed Experiment (PREFIRE) – see Photo 1. The instrument will quantify the far-infrared spectrum beyond 15 μm, which accounts for over 50% of the OLR in polar regions. Additionally, the atmospheric greenhouse effect is sensitive to thin clouds and small water vapor concentration that have strong far infrared signatures. PREFIRE consists of two CubeSats in near polar orbits. The instrument has a miniaturized infrared spectrometer covering 5 to 53 μm with 0.84 mm sampling and an operational life of one year. A complete infrared emission spectrum will provide fingerprints to differentiate between several important feedback processes (e.g., cloudiness and water vapor) that leads to Arctic warming, sea ice loss, ice sheet melt, and sea level rise. [UPDATE: The two PREFIRE CubeSats launched successfully in May and June of 2024, with first light images following in September 2024; public release of PREFIRE data products occurred in June 2025.]
Photo 1. NASA’s Polar Radiant Energy in the Far-InfraRed Experiment (PREFIRE) mission will measure the amount of heat Earth emits into space from two of the coldest, most remote regions on the planet. Photo credit: NASA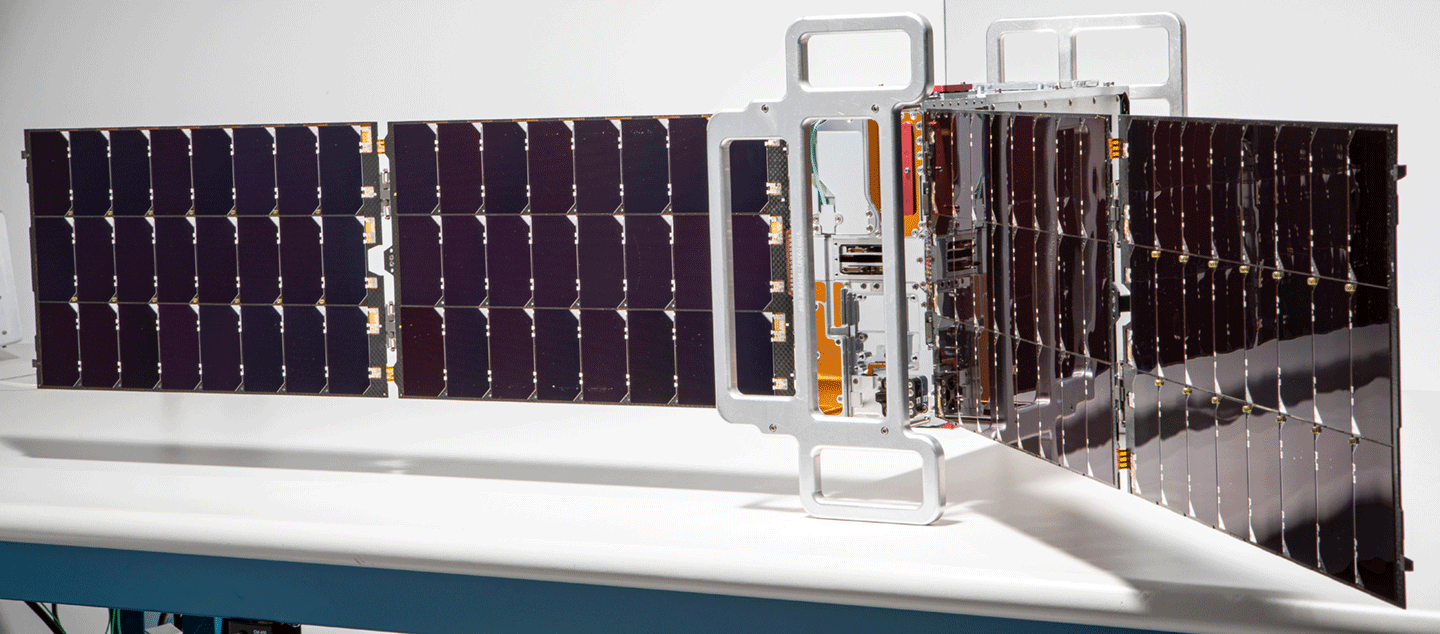
Peter Pilewskie [Laboratory for Atmospheric and Space Physics (LASP)] announced that Libera will be integrated on Joint Polar Satellite System-4 (JPSS-4), which eliminates the need to remove JPSS-3 from storage. This change will affect the launch order. He also presented a comparison between the Compact Total Irradiance Monitor (CTIM) CubeSat and CERES observations. Pilewskie noted that CTIM uses the same Vertically Aligned Carbon Nanotube (VACANT) detectors that Libera will use. Even though CTIM is designed to measure Total Solar Irradiance, the spacecraft has been oriented to get Earth views during spacecraft eclipse with the Sun (nighttime). CTIM provides a ~170-km (105-mi) footprint – which is about eight times larger than that of CERES. The mean relative difference between CERES and CTIM matches are -1.8% varying between -1.5% for FM6 and 2.0% for FM1.
Climate Model Developments and Analysis
Paulina Czarnecki [Columbia University] introduced a method to use a small number of wavelengths to determine broad band radiative fluxes and heating rates as an alternative to the correlated K parameterization approach. It uses a simple optimization algorithm and a linear model to achieve accuracy similar to correlated K-distribution. The approach uses a small set of spectral points – 16 in the study – to predict the vertically resolved net flux within 1 W/m2 under clear-sky conditions.
Sean Cohen [Columbia University] addressed the impact of rising surface temperature on precipitation. This information is required to determine the relationship between hydrological sensitivity and radiative cooling sensitivity, where convective heating is balanced by radiative cooling. When carbon dioxide (CO2) increases, it masks changes in emission from water vapor, resulting in mean rainfall changes when atmospheric transmission changes at a rate of 2%/K. The “symmetry” of the water vapor spectral window causes atmospheric transmission to change at a near constant rate with the surface temperature. This hydrological sensitivity peaks at subtropical surface temperatures – see Figure 7.
Figure 7. A comparison of an ensemble of General Circulation Model results [faded lines] to predictions from the author’s pen-and-paper model under a constant carbon dioxide (CO2) concentration of 400 ppm (orange) and under varied CO2 concentration (black). The gray line shows the prediction from the source scaling. [Inset] The percent change in mean rainfall [hydrological sensitivity (HS)] with surface temperature as predicted by these same analytical models (same color labels). Figure credit: Cohen et al., 2025
George Tselioudis [GISS] explored how shifts in the atmospheric zonal mean circulation changed the CRE. The poleward shift in the location of the Hadley Cell (with corresponding high clouds following it) occurred in both hemispheres; however, it produced SW CRE warming during North Atlantic winter, contrary to SW CRE cooling in both Southern Hemisphere summer and winter. The Southern Hemisphere high cloud shift does not reduce the total cloud amount that occurred in the North Atlantic. The jet stream shift only had an impact during North Atlantic winter. The LW CRE produced a dipole of warming at the previous and new Hadley Circulation positions. The magnitude of LW CRE changes increased with larger upward velocity changes. The SW CRE is dependent on both change in vertical velocity and stability (EIS). Based on these observational findings, Tselioudis evaluated the CMIP 5 and 6 results. Both model results showed lower midlatitude SW CRE warming, but CMIP 5 produced a larger dependence on the climatological Hadley circulation whereas CMIP 6 did not. CMIP 6 models are less dependent on vertical velocity than the earlier set, which allow them to produce Southern Hemisphere SW CRE warming.
Gregory Cesana [GISS] investigated the tropical stratocumulus and shallow cumulus SW feedback, which explains part of the spread in climate sensitivity in the CMIP 5 and 6 models. Observationally, inferred low-cloud feedback is driven by stratocumulus clouds with very little input from cumulus clouds. In the model, cloud type is determined from the mean low cloud fraction in the tropics. When the model cloud fraction is smaller, the cloud is assumed to be cumulus. When it is greater, the cloud is considered to be stratocumulus. CMIP 6 underestimates both low cloud types, but especially in the high stratocumulus regions along the western coasts of continents. Both models favor cumulus over stratocumulus regimes, but the bias for CMIP 6 is less than CMIP 5. The increased model stratocumulus is correlated with increased low-cloud feedback – see Figure 8. If the increased stratocumulus clouds in CMIP 6 matched observations, the mean low cloud feedback would have doubled to 0.7 W/m2 K.
Figure 8. [Left to Right] Maps of stratocumulus (Sc) and shallow cumulus (Cu) cloud feedback for [top to bottom] CALIPSO and CERES observations, the Climate Model Intercomparison Project model (CMIP 6), and CMIP 5 models. The means are given in the upper left corner of each map. The linear correlation coefficients between observations and CMIP 6 and CMIP 5 models are 0.39 and 0.20 for Sc, and 0.30 and 0.22 for Cu, respectively. Collectively, CMIP 6 models substantially improved depiction of Sc cloud feedback both in terms of mean and pattern correlation compared to CMIP 5, and also for Cu clouds to a lesser extent. Both models underestimate the magnitude of the positive feedback – and therefore the warming due to low clouds in response to climate change. Figure credit: Cesana et al., 2023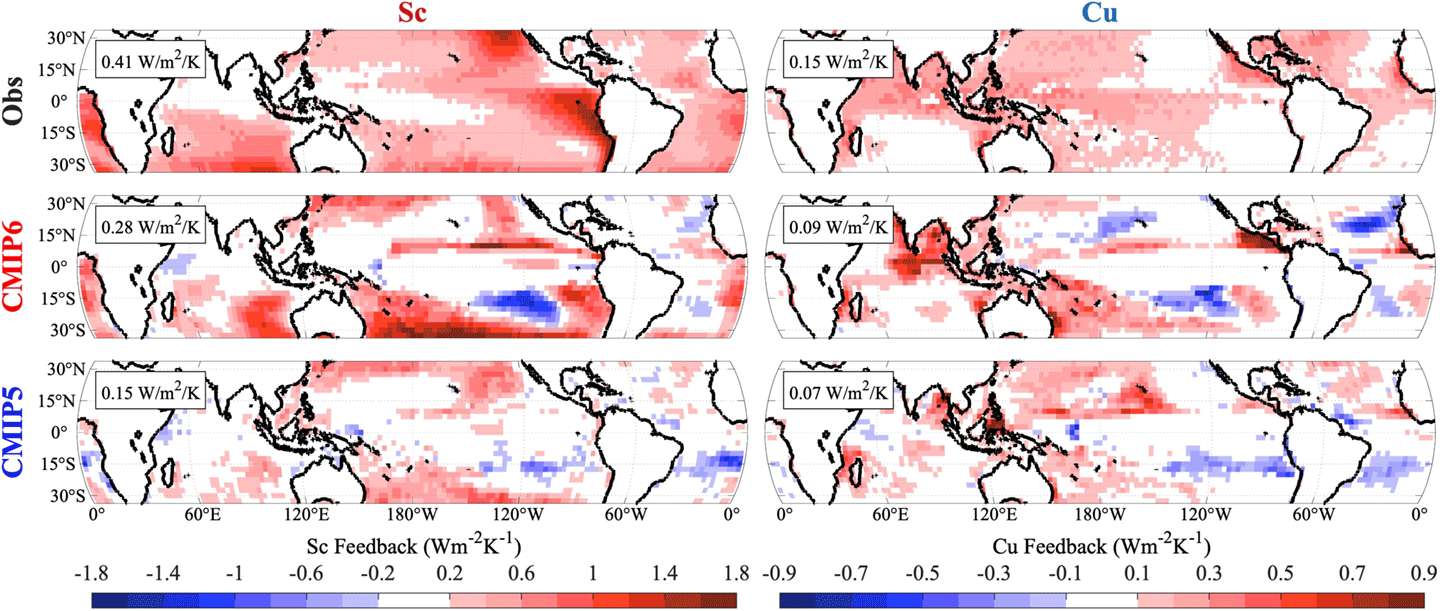
Patrick Taylor [LaRC] explored the cloud–sea ice feedback mechanism – see Photo 2. He explained that results from CMIP 5 and 6 show the largest variation in climate projections in the Arctic – where surface albedo feedback is the biggest contribution to the inter-model differences. He evaluated the difference between ice-free and ice surfaces on either side of the marginal ice zone – a part of the seasonal ice zone ranging from 100- to 200-km (62- to 124-mi) wide that extends from the ice edge into the ice pack. The cloud property differences are strongly tied to the differences in thermodynamic profiles, whereas the ice edge (part that is over open water) has warmer, moister, and weaker lower tropospheric stability than the ice pack, leading to more positive turbulent surface fluxes at the ice edge. The feedback from surface properties and lower tropospheric thermodynamics profile are critical to sea ice loss. This sea ice–cloud feedback is positive in the fall and winter and negative in the spring.
Photo 2. Surface albedo is a measure of reflected sunlight from Earth’s surface. This measurement provides critical information for modeling Earth’s climate, particularly in polar regions; however, computer models struggle to simulate albedo. This photo gives some idea why. The terrain in the Arctic is highly variable, which, along with the heterogeneity in snow and/or ice cover on the surface, make surface albedo one of the most challenging physical variables to represent in climate models. Photo credit: Taylor et al., 2024
Doyeon Kim [LaRC—NASA Postdoctoral Program] discussed factors that explain the current Arctic albedo and possible future changes in this region. She noted that the Arctic undergoes rapid warming during the summer with an accompanying decrease in surface albedo each year until it starts to increase again in the fall – see Figure 9. Researchers use the output from the Atmospheric Model Intercomparison Project (AMIP) and CMIP 6 to infer future changes to albedo. In her analysis, Kim decomposed surface albedo into five terms: sea ice albedo in ice region, sea ice concentration, albedo spatial variation, ice region, and albedo in ocean region. She explained that the ice albedo term drives most changes in AMIP where the ice concentration is held constant. Sea ice concentration and ice region terms become important for the CMIP 6 model where they can change.
Kim went on to look at the monthly averages of albedo, pointing out that March and September show large differences. The multimodal mean exhibits a large spread in the ice albedo. The CMIP 6 spread is significantly influenced by both seasonal and spatial variations. During the early summer months, the ice region term contributes to albedo spread across the Barents, Kara, and Laptev Seas and Greenland Sea. The ice albedo term during the late summer contributes to albedo in the East Siberian, Chukchi, and Beaufort Seas and Central Arctic Sea. A significant inter-model spread may be the primary factor that is contributing to the variability observed in Arctic warming across the different model simulations. Kim discussed the significant difference in surface albedo between CERES and the CMIP 6 models. Both ice fraction and ice albedo have a substantial effect on the model spread of albedo. Time series data indicate that sea ice albedo and concentration remain relatively unchanged in response to global warming while the ice region term decreases significantly.
Figure 9. Present-day Arctic surface albedo from the CMIP 6 multi-model mean (2001–2014) compared with Clouds and the Earth’s Radiant Energy System (CERES) observations. Panels (a–d) show CMIP 6 multi-model mean albedo for March, April–May, June–August, and September, while panels (e–h) show corresponding CERES retrievals. Figure credit: Doyeon Kim/NASA Langley Research Center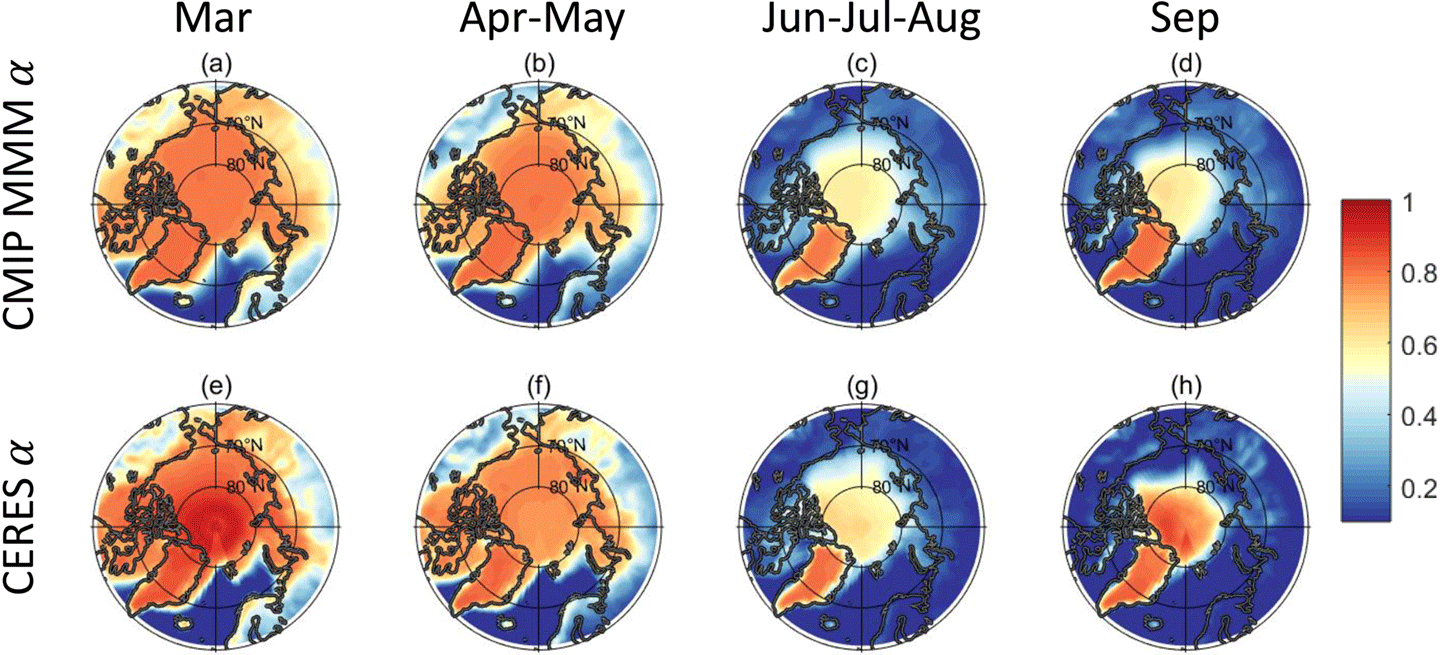
Application of Machine Learning
Ben Scarino [LaRC, Analytical Mechanics Associates (AMA)] explored the consistency of skin temperature (i.e., temperature at the surface) and the temperature 2-m (6.5-ft) above the ground from reanalysis and satellite and ground observations, respectively. He reported that the Global Modeling and Assimilation Office (GMAO) does not assimilate either skin or ground temperature into their reanalysis, producing large biases in those values. Conversely, ERA5 does assimilate 2-m temperature in the reanalysis, which reduce variations by 1 K. The introduction of a Deep Neural Network (DNN) adjusts the reanalysis skin temperature to the observed satellite skin temperature – see Figure 10.
Figure 10. An estimate of clear-sky satellite skin temperature bias for day [left column] and night [right column] between GEOS-IT model and satellite observations [top row] and between satellite predictions – using a deep neural network (DNN) – and satellite observations [bottom row]. Use of the DNN reduced the bias between predicted and observed skin temperatures and lowered the standard deviation. Figure credit: Scarino et al., 2023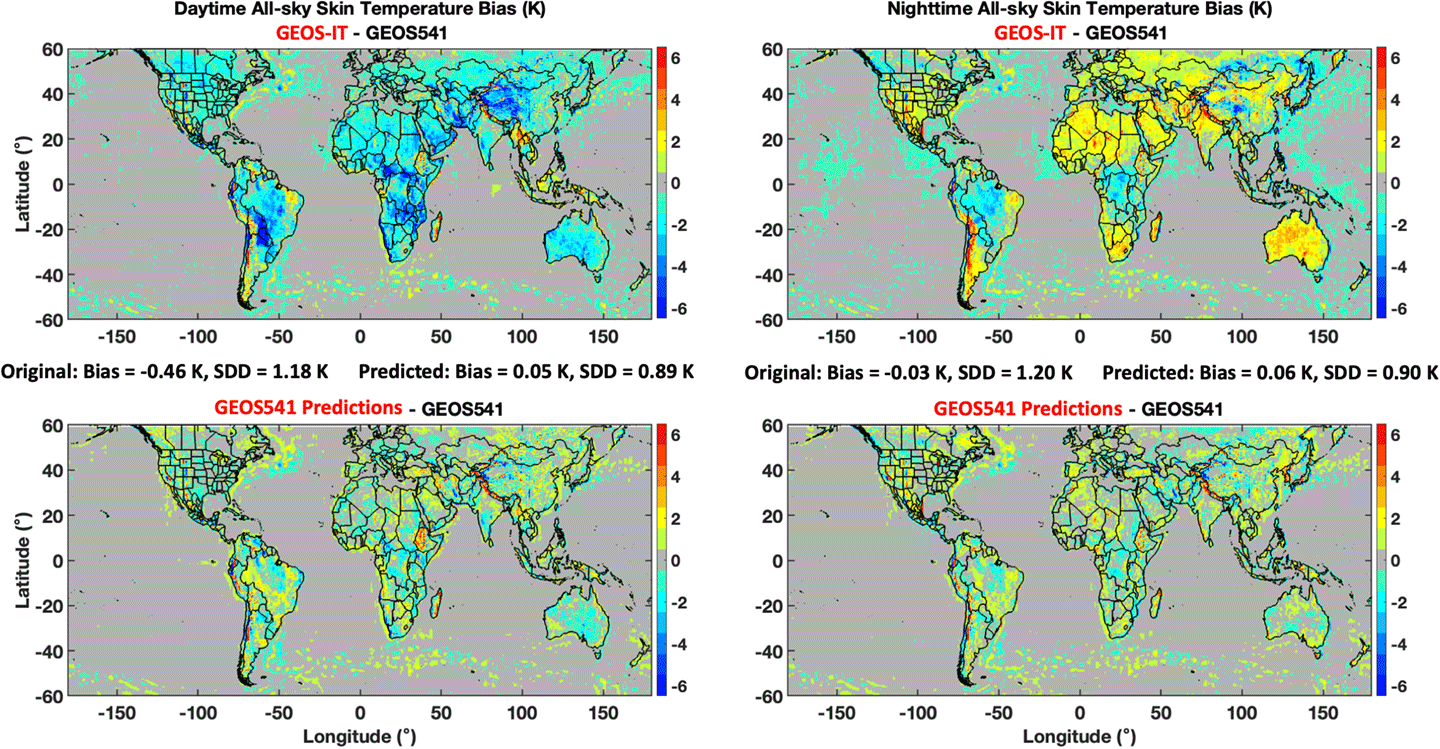
Sunny Sun-Mack [LaRC, AMA] described her efforts to train a Neural Network to identify single and multilayer ice-over-water and cloud top height using the Cloud Aerosol Lidar with Infrared Pathfinder Satellite Observations (CALIPSO), CloudSat, and MODIS [CCCM] pixel-level product from 2008. For single layer cloud top heights, the neural network reduced the standard deviation of difference by nearly half. For the ice cloud top height in multilayer clouds, the standard deviation of difference is one-third. The neural network showed the same “skill” with lower multilayer cloud top heights as it did with single and multilayer upper cloud top heights – (e.g., standard deviation of difference is similar). The single layer cloud base showed similar skill to cloud top height, but the upper cloud base height was slightly worse than the cloud top height. The current algorithm using only imager data cannot differentiate multilayer clouds and creates a single water cloud that does not allow the flux to be calculated properly.
Jay Garg [LaRC/ADNET Systems, Inc] described improvements in SW surface flux using a Machine Learning technique over parameterized instantaneous CERES footprint fluxes. He trained a Neural Network model using the Fu-Liou calculated CERES CRS surface fluxes. This approach reduced the bias from 25 Wm-2 to almost 0 and the Root Mean Square (RMS) Error from nearly 100 to 13 W/m2 for SW surface fluxes. The LW flux statistics showed the bias reduced from 2 Wm-2 to nearly 0 and RMS Error from 12 to 3.5 W/m2 compared to the parameterized flux. These results nearly match the CRS values. Garg explained the plan to implement the Neural Network in the FLASHFlux SSF product – see Figure 11.
Figure 11. Artificial Neural Network differences between the Neural Network LW fluxes and the computed values globally for Jan. 4, 2020. The differences are consistently small across all areas (scale range is -15 to 15 Wm-2). The authors (see Credit below) note the need to improve some areas over continents and areas involving cloud patterns. Figure credit: Garg et al., 2024
Takmeng Wong [LaRC] presented recent progress on an imager independent instantaneous flux product to replace the current Earth Radiation Budget Experiment (ERBE)-like product. Wong described the use of a Random Forest classification technique to determine if the scene is clear (defined as 99.9% cloud free) or cloudy. This approach allowed the CERES radiances to be unfiltered – see Figure 12. Wong and colleagues developed separate models for day and night as well as for surface types (e.g., water, land, desert, and ice and snow). Wong discussed how an Artificial Neural Network was used to convert radiances to a flux. Similar to the radiance models, Wong and colleagues did separate analyses for day and night and for the four surface types for both clear and cloudy conditions. The results from this approach were shown superior to the ERBE-like fluxes but not reaching the accuracy of the SSF using imager-derived clouds.
Figure 12. The number of clear footprints per 1 degree region for [Left] Earth Radiation Budget Experiment algorithm applied to CERES and [right] random forest results from CERES data. The right figure demonstrates a significantly reduced number of falsely identified clear pixels. Figure credit: Wong et al., 2024
Eshkol Eytan [University of Colorado, Boulder] focused his work on the cloud twilight zone, an area of transition between clear and cloudy skies, such as cloud halo, cloud fragment, and thin clouds only seen in forward scatter. The clear sky reflectance increases, which is wavelength dependent the closer it is to the cloud. Eytan looked for this feature in the LW data. The lower bound for low clouds is ~0.75 W/m2. The fraction of what is considered clear is 60% cloudiness. The cloud twilight zone contribution to the CRE is ~0.8 W/m2 for warm clouds and ~8 W/m2 for all clouds. Eytan broke down MODIS data into 200-km2 (77-mi2) regions and applied a cloud mask. The team then looked at how different channels react with distance. Eytan and colleagues analyzed both visible and LW channels on MODIS. This work determined a pure clear sky value based on distance from known clouds and how it differs from the individual pixel radiance squared divided by the standard deviation obtained in the box. When the twilight spectral measure is greater than one, it signifies cloud contamination. The pure clear MODIS pixels within a CERES footprint are averaged to get a true clear-sky radiance. Often a CERES footprint exceeds the pure clear area. Eytan then explained how he used the clear sky measurement to determine a normalized factor for MODIS data to estimate CRE. He used machine learning between CERES radiances and MODIS radiances at different wavelengths to get pure clear-sky fluxes in homogenous areas. After training on CERES footprint, he then applied MODIS data to smaller areas. The shift of CRE to a higher value, from -6 W/m2 to -10 W/m2 with imager pixels, produced a more confident cloud mask – reducing uncertainty by a third. This value is still larger than the estimated aerosol direct radiative field. Applying the same technique to the thermal portion of the CRE is 1 and 1.5 W/m2.
Observational Datasets and Analysis
Lazaros Oreopoulos [GSFC] presented a new approach for classifying cloudiness at monthly time scales that preserves some of the variability of the original MODIS daily pixel observations. Starting from the 12 previously defined MODIS cloud regimes (CRs) that classified cloud mixtures according to how cloud top pressure and optical depth co-vary on daily scales, he grouped mixtures of CRs occurring regionally over a month using k-means clustering. He classified the geographical distribution of mean occurrences of the resulting eight monthly climatological cloud regimes as “Regimes of Regimes” (RORs) – see Figure 13. When examining the CRE of the RORs, he found that ROR5 contained large amounts of shallow convection. CR10 exhibited strong shortwave and longwave CRE trends because of declining CR10 populations.
Figure 13. Geographical distributions of mean population density [expressed as relative frequency of occurrence (RFO)] for the eight climatological cloud regimes, also called “Regimes of Regimes” (RORs), derived from 20 years of MODIS cloud retrievals. Figure credit: Oreopoulos et al., 2023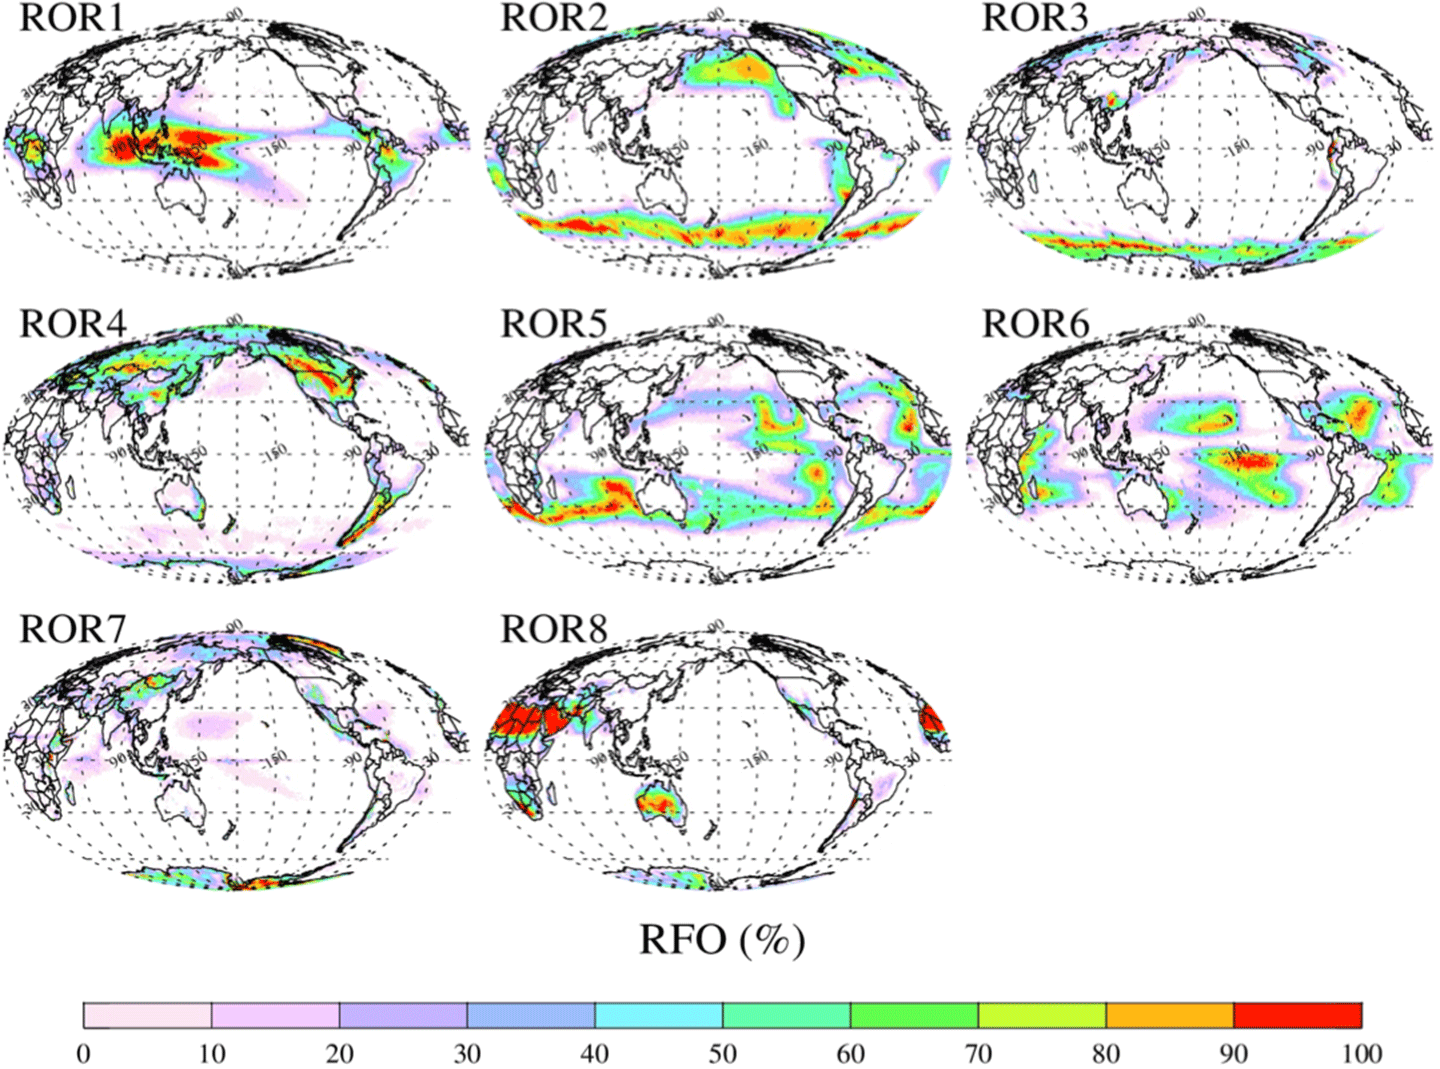
Maria Hakuba [NASA/Jet Propulsion Laboratory (JPL)] provided an update on the WCRP Global Energy and Water Exchanges (GEWEX) Data and Analysis Panel assessment of the EEI. Quality control led to a skew in the Ocean Heat Content estimates, mapping techniques, and mask and coverage. The year-to-year variability did not follow the CERES EEI; however, a combination of in-situ and altimetry data for hybrid estimates resulted in very good agreement. The agreement with the JPL geodetic ocean heat uptake with the correct expansion efficiency was also good. The net all-sky was positive across all zones. The net clear-sky trend matched all-sky. The net-CRE showed negative trends in Northern Hemisphere deep tropics and high latitudes. The SW and LW CRE complement each other both globally and zonally. The positive SW CRE dominated in the tropics with fewer, lower, and thinner clouds.
Jake Gristley [NOAA’s Cooperative Institute for Research in Environmental Science (CIRES)/University of Colorado, Boulder] explored the angular dimension of ERB with the Wide Field of View camera planned for the Libera mission. The camera is a 2048 x 2048-pixel array that samples the entire Earth disk subtended from the satellite. It provides 1-km (0.62-mi) pixel spacing at nadir with a single spectral channel at 555 nm. This technique produces more data than can be downloaded. The ADM sampling methods Gristley used encompass the Libera Point Spread Function and minimize the amount of data that must be transmitted.
Seung-Hee Ham discussed how to evaluate cloud volumes using CALIPSO, CloudSat, and MODIS observations separately and in combination to determine the strengths and weakness of each approach. CloudSat misses thin cirrus and low clouds; CALIPSO misses low and mid clouds as a result of signal attenuation; and MODIS misses high and low clouds and over detects mid clouds. Ham described a trend from 2008 to 2017 that shows an increase in the upper-most clouds and a decrease in underlying clouds. She also looked at the El Niño Southern Oscillation (ENSO) signal that showed varying responses based on latitude bands. The increase in high clouds above 10 km (6.2 mi) represent an increase in clouds with a temperature between 220 and 240 K. The colder cloud emission and smaller OLR provide positive cloud feedback.
Brent Roberts [NASA’s Marshall Space Flight Center (MSFC)] presented applications of CERES surface fluxes in the Regional Visualization and Monitoring System (in French SERVIR). SERVIR is a joint initiative of NASA, United States Agency for International Development (USAID), and leading geospatial organizations in Asia, Africa, and Latin America. SERVIR uses satellite data and geospatial technology in innovative solutions to improve resilience and sustainable resource management. The projects are driven by demand to meet community needs and values. The CERES fluxes are used input into crop and land surface modeling through NASA’s Prediction of Worldwide Energy Resources (POWER) tool. Another example of where CERES data are used as input is for the Regional Hydrologic Extremes and Assessment System (RHEAS), which is a framework for providing nowcast and forecasts of streamflow and crop yields that has been deployed in Eastern Africa and Southeast Asia. The South Asia Land Data Assimilation System (SALDAS) uses the NASA GEOS Subseasonal to Seasonal (S2S) prediction system and long-term observational records or assimilations to evaluate climate anomalies. The GEOS-S2S information is downscaled to 5 km (3 mi) using Land Information System or Land surface Data Toolkit, which is combined with information from POWER and the Integrated Multi-satellitE Retrievals for Global Precipitation Monitoring (IMERG GPM). The value of CERES surface fluxes is more accurate over the model data when compared to Surface Radiation Budget (SURFRAD) network observations. Roberts explained future plans to refine the downscaling approach to take advantage of satellite-based radiative fluxes.
David Rutan, [ADNET Systems] validated the CERES CRS data product at Siple Dome, Antarctica. The CRS is a CERES footprint-based application of the Fu-Liou Radiative Transfer Model. At the high polar latitude, Terra and Aqua provide multiple passes each day allowing the diurnal cycle to be captured. The calculated LW surface downward flux is consistently too low under both clear and cloudy skies. Whereas the SW surface downward flux is low for cloudy conditions but matches well under clear skies. The surface upward flux comparison demonstrates LW is very low for cloudy skies and improves for clear skies. Conversely, SW is low for cloudy conditions and again matches well with clear skies. Despite the bias, the CERES fluxes captured the dynamic changes in observed radiances. The difference between fluxes calculated by the GMAO GEOS 5.4.1 model, MODIS, and AIRS observed fluxes are shown in Figure 14. The model has a low bias for skin and air [2-m (6-ft) off the ground] temperature and a dry bias in the troposphere compared to the observations.
Figure 14. The calculated data fairly well in the shortwave down, particularly when the sky is clear. The longwave down, the calculations are cold, because it is largely influenced by the near surface air temperature. When Rutan and his team compared current input (GEOS-541) to input for the Edition 5 version of the cloud regimes (GEOS-IT), they found that the current surface air temperature is too low in the Antarctic. Figure credit: Rutan et al., 2023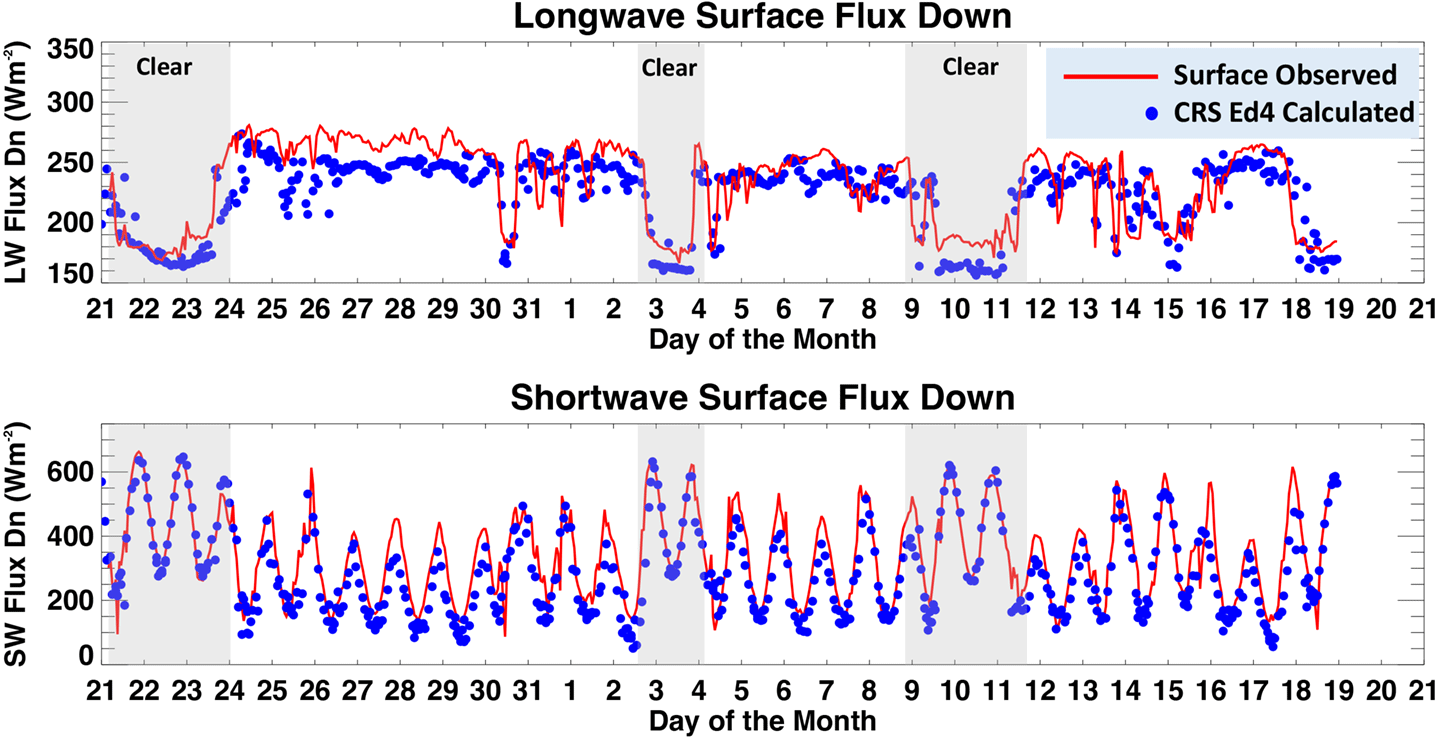
Norman Loeb presented the CERES approach for a seamless climate data record across multiple satellite transitions applied to the EBAF ToA data product. All CERES instruments are anchored to FM1 via intercalibration using coincident measurements. Low Earth Orbiting (LEO) and Geostationary Earth Orbiting (GEO) imager radiances are placed on the same radiometric scale using a combination of ray-matching and invariant targets. Loeb explained the next step that used overlap between successive missions to anchor the level 3 (L3) data product from different satellites to a common reference. He then addressed the question of incorporating a new broadband instrument into the data after a 46-month data gap using computed fluxes from a SYN1deg product or the ERA5. All methods introduced a bias greater than 0.1 W/m2 than currently expressed using EBAF.
Virginia Sawyer [GSFC/Science Systems and Application, Inc.] provided an update on aerosol trends and changes for Dark Target – a satellite algorithm for retrieving aerosol properties from MODIS and other sensors by looking for brightness changes, which is more effective for dark surfaces (e.g., forests and oceans). Sawyer reported that the Collection 6.1 Aerosol Optical Depth (AOD) over land was higher for Terra than for Aqua early in the record. After 2015, however, the two records became more consistent. The Suomi NPP AOD tracks closely to Terra and Aqua, but the NOAA-20 data produce lower aerosol values. This same pattern is seen over the oceans, but the Terra and Aqua do not converge after 2015. Sawyer reported that the preliminary results for MODIS Collection 7 (C7) do not significantly change Aqua results but do increase Terra AOD over land. This finding increases the Terra–Aqua offset. Sawyer indicated that MODIS C7 will include new Dark Target and Deep Blue, a companion algorithm to Dark Target but designed to excel over bright surfaces (e.g., deserts) by using blue/UV bands where aerosols are prominent. Likewise, she reported that the C7 MODIS Deep Blue algorithm will be expanded to retrieve over the ocean, similar to the current version for VIIRS.
Tyler Hanke [University of Illinois] introduced the concept of emergent constraint that combines some current observable climate quantity and its future projections with an observational estimate to constrain future projections. He used ENSO as a potential emergent constraint on the pattern effect. ENSO in both the Eastern Pacific and Central Pacific have associated all-sky radiation patterns that are dominated by low-cloud radiative effect anomalies that are primarily driven by SST. The increase in SST decreases low-clouds and weakens the inversion. These features were identified in both CMIP 6 models and the CERES EBAF product.
Xianglei Huang [University of Michigan] provided OLR trends from CERES, AIRS, and Cross-track Infrared Sounder (CrIS) on Suomi NPP and NOAA-20. The AIRS data showed about half the trend that CERES had over 20 years, but within the uncertainty of both measurements. He reviewed the various sources of differences: ADMs, calibration, and extrapolation. Huang explained that Suomi NPP CrIS data have known issues in the mid-IR channel, so NOAA-20 CrIS must be used for the analysis. A review of the past 10 years shows much closer agreement – around 0.055 W/m2 per year. Huang said that there are enough data to begin to look at spectral trends, which will be a focus of his future endeavors.
Patrick Taylor [LaRC] provided an overview of the Arctic Radiation-Cloud-aerosol-Surface Interaction Experiment (ARCSIX), which is designed to quantify the contributions of surface properties, clouds, aerosols, and precipitation to the Arctic summer surface radiation budget and sea ice melt. Taylor explained how the field experiment will increase the field’s knowledge of the coupling between radiative processes and sea ice surface properties that influence the summer sea ice melt processes that control Arctic cloud regimes and their properties. It also controls the ability to monitor Arctic clouds, radiation, and sea ice processes from space. Even though the thin Arctic clouds can be radiatively important, they are challenging to observe with passive instruments, such as MODIS. The surface albedo is the largest uncertainty in intermodel differences in the Arctic. Two periods of aircraft measurements are available from Greenland between mid-May to mid-June and late-July to mid-August 2024. During the Fall 2024 meeting, Taylor reported that the Wallops Flight Facility (WFF) P-3 completed 19 flights, the LaRC Gulfstream-III had 15 flights, and SPEC Incorporated Learjet had 10 flights out of Pituffik Space Base in northwest Greenland. Altogether the ARCSIX flights accounted for nearly 350 flight hours. Taylor reported that (at the time of the Spring 2025 meeting) these data were still being prepared for public release.
Conclusion
Much like many of the CERES STMs that have preceded them, the last four meetings addressed the current state of CERES instruments, data products and algorithms, and outreach activities. The meetings began with a discussion on global mean surface temperature, progress on cloud algorithms, and changes in SW flux into different components of the electromagnetic spectrum. In addition, the CERES discussions compared ERB instruments, irradiance trends at different levels of the atmosphere, and information shared by citizen scientists during eclipse events in 2023 and 2024. Invited presentations evaluated how to parse radiation forcing and feedback to understand different atmospheric parameters and the use of different models, including Neural Network models, to examine the data gathered by CERES. The presentations also examined the concentration and distribution of aerosols in relation to different cloud types and droplet number and their relationship to climate sensitivity. Several presentations focused on the Arctic, especially with regard to albedo and ice extent. Several projects combined work from CERES and other instruments on the satellite platforms to examine single and multi-layer ice-over-water and cloud top in the atmosphere. The work over the two-year period has brought together a diverse group of experts to clarify atmospheric dynamics to understand changes in radiative flux to improve predictions of future climate conditions.
Walter Miller
NASA’s Langley Research Center/ADNET Systems, Inc.
walter.f.miller@nasa.gov
The State of CERES: Updates and Highlights
42 min read
The State of CERES: Updates and HighlightsIntroduction
The Clouds and the Earth’s Radiant Energy System (CERES) was initially designed in the late-1980s and early-1990s as a facility instrument for NASA’s Earth Observing System (EOS). Since its inception, NASA’s Langley Research Center (LaRC) has led this effort. CERES has a long history with seven different instruments flying on five different missions since 1997. As of today, six CERES instruments remain in orbit – two are no longer operational: the Proto-Flight Model (PFM) unit flew on the Tropical Rainfall Measuring Mission (TRMM) and functioned for a brief period, and FM2, which was powered-off in January 2025 due to battery constraints on Terra. The active CERES instruments are found on Terra (FM1), Aqua (FM3 and 4), the Suomi National Polar-orbiting Partnership (Suomi NPP) (FM5), and the first Joint Polar Satellite System (JPSS-1) mission, now known as NOAA-20 (FM6). Suomi NPP and the JPSS mission are partnerships between the National Oceanic and Atmospheric Administration (NOAA), which owns the satellites, and NASA, which operates them.
The CERES Team has maintained a history of its Science Team (ST) Meetings, recorded in The Earth Observer. The first CERES STM to be mentioned in the newsletter was the third meeting [Jan. 1990, 2:1, 7], which was listed on the “EOS Calendar.” The earliest full STM summary captured events from the seventh meeting in Fall 1992, CERES Science Team [Jan.–Feb. 1993, 5:1, 11–16]. Since then, the periodic reports (typically spring and fall) have kept readers up to date on the status of the CERES instruments in orbit and the science results from the data gathered. With such a long history of published meeting summaries, it seems fitting that a report on the state of CERES should be among the last articles published by The Earth Observer.
The most recent CERES contribution to The Earth Observer was the article, Update on the State of CERES and Highlights from Recent Science Team Meetings [Sept.–Oct. 2023, 35:5, 43–53]. Since that time, CERES has held four STMs – bringing the total to 42. Norman Loeb [LaRC—CERES Principal Investigator (PI)] hosted all the meetings.
The four most recent meetings were:
- The 39th CERES STM (Fall 2023) at the NASA Goddard Institute for Space Studies (GISS) in New York, Oct. 17–19, 2023.
- The 40th CERES STM (Spring 2024) at LaRC in Hampton, VA, May 14–16, 2024.
- The 41st CERES STM (Fall 2024) at Lawrence Livermore National Laboratory in Livermore, CA, Oct. 1–3, 2024; and
- The 42nd CERES STM (Spring 2025) at LaRC, May 13–15, 2025.
A Fall 2025 meeting had been scheduled at LaRC from Oct. 28–30, 2025, but was cancelled due to the Federal Government shutdown. Planning is underway for another meeting to be held in Spring 2026.
This article will focus on the Fall 2023 and Spring 2024 meetings – drawing primarily from the State of CERES presentation, programmatic content, and mission and instrument status reports delivered at those meetings. The sections on the State of CERES and Invited Presentations also include content from the Fall 2024 and Spring 2025 meetings. The contributed presentations from these latter meetings are not included in this article. For more details, the reader is directed to the CERES website where agendas and links to individual presentations can be found for all four meetings.
The content in this article includes updates on the status of the platforms that carry CERES instruments, CERES data products and algorithms, and CERES outreach activities. The remainder of this article will consist of summaries of the invited science presentations given at these meetings, followed by selected science presentations. More information on the topics briefly mentioned in the summary from the meetings is contained in the respective presentations, which are available on the CERES website.
State of CERES
The State of CERES message is a long-standing tradition, opening the CERES STMs. At the beginning of each meeting, Norman Loeb outlined the major objectives of this group, which remained consistent from meeting to meeting. These objectives include host satellite health, instrument calibration updates, algorithm and validation status from the various Working Groups, and progress toward the next CERES reprocessing.
Loeb began the Fall 2023 meeting by reviewing the large increase in global mean surface temperature based on the European Centre for Medium-Range Weather Forecasts Reanalysis (ERA5) model Version 5 (V5) in 2023. The highest anomaly was reported in September 2023 for the period from 1979 to 2023. The CERES absorbed solar radiation (ASR) – a measure of the difference between incoming solar energy and the energy reflected back into space – exceeded the 90% confidence interval anomaly for March through September 2023 except for May, which does not quite exceed it. The net radiation also exceeded the 90% confidence interval through May of 2023. Starting in June 2023, the Outgoing Longwave Radiation (OLR) exceeded the negative 90% confidence interval, indicating a release of energy out of the atmosphere; however, the net radiation dropped below the 90% confidence interval for the remainder of the year. The 2023 value even exceeded the 2016 El Niño event. The extremely large ASR and OLR values continued into early 2024.
The CERES Terra FM2 operated in Rotating Azimuth Plane (RAP) mode until it failed in January 2025. After that, Terra FM1 switched to RAP mode during Terra’s drifting period. Aqua FM3 likewise operates in RAP mode as Aqua has drifted. This mode allows for capturing data at a larger range of solar zenith angles. For 48 months, the Suomi NPP FM5 has collected rotating-azimuth data; it returned to Cross-track Mode in October 2023. The team noted a small amount of noise periodically detected on the NOAA-20 FM6 shortwave (SW) channel from November 2023 through February 2024. This noise was only observable during space view when the counts approached zero. Several analyses on Earth-viewing footprints could not identify any impact on the SW radiance.
Loeb highlighted some other efforts that are of interest to the group. The World Climate Research Programme (WCRP) started a lighthouse activity on Explaining and Predicting Earth System Change (EPESC) with a focus on understanding and predicting the Earth Energy Imbalance (EEI). This work exemplifies another effort – CERES Model Intercomparison Project (CERESMIP) experiments – that was championed by GISS. The goal is to provide a larger overlap of model output with CERES observations than the earlier Coupled Model Intercomparison Project Phase 6 (CMIP 6), which only observed forcing through 2014 and projected forcing after 2014. Examples of these forcings are Sea Surface Temperature (SST), sea ice concentrations, aerosol and volcanic emissions, and solar irradiance. Climate variability since 2014 is quite pronounced, including EEI, SST trends, Pacific Decadal Oscillation shift, and El Niño events.
During the Fall 2024 meeting, Loeb discussed the impacts of the shifting Terra Mean Local Equatorial Crossing Time. He explained that the SW Top of Atmosphere (ToA) flux difference between NOAA-20 and Terra are smaller in the Northern Hemisphere than the Southern Hemisphere due to closer observation times. The longwave (LW) flux difference is smaller between hemispheres. The CERES team has been collaborating with the European Space Agency’s Earth Cloud, Aerosol and Radiation Explorer (EarthCARE) project to compare results from its Broadband Radiometer (BBR) with those from CERES. Early results showed that EarthCARE’s BBR SW channel is 8% brighter than CERES, and the LW channel is very consistent with CERES – with the possible exception of very cold scenes being colder than CERES. At the May 2025 meeting, Loeb announced that a 25-year Earth Radiation Budget (ERB) record – from March 2000 to February 2025 – has been established.
Bill Smith, Jr. [LaRC] continued the presentation with a review of the progress of the CERES Edition 5 clouds algorithms. This presentation examined the status of balancing the three goals of this effort. He noted the need for consistency between the derived cloud products from the Moderate Resolution Imaging Spectroradiometer (MODIS) on Terra and Aqua and the Visible Infrared Imaging Radiometer Suite (VIIRS) on Suomi NPP and NOAA-20 – especially given the differences in the bands on each instrument. In addition, he discussed the consistency between three generations of geostationary imagers that cover the 25 years in both timeline and across the globe. CERES uses data from NOAA’s Geostationary Operational Environmental Satellites (GOES 9–18); the European Organisation for the Exploitation of Meteorological Satellites’ (EUMETSAT) Operational Meteorological Satellites (Meteosat 5–11); and the Japanese Meteorological Agency’s (JMA) Geostationary Meteorological Satellite (GMS 5), Multifunction Transport Satellite (MTSAT 1R and 2), and Himawari 8 and 9. Finally, Smith presented the accuracy of this approach compared to observations from Cloud-Aerosol Lidar with Orthogonal Polarization (CALIOP) on the Cloud-Aerosol Lidar and Infrared Pathfinder Satellite Observations (CALIPSO) mission.
In his presentations during the Fall 2024 and Spring 2025 meetings, Smith demonstrated improvements with the Edition 5 algorithm showing consistent cloud fraction between MODIS on Aqua and VIIRS on NOAA-20 – with the ocean values being within 2% for both day and night. He noted that additional work still needs to be done for land and polar night. A comparison with CALIPSO data showed that daytime cloud fraction measurements from VIIRS on NOAA-20 are more consistent than those from MODIS on Terra and Aqua. The Edition 5 nighttime algorithm fixes the overestimates in cloud fraction for high clouds, but still underestimates low clouds [below 3 km (1.9 mi)] by 10%. The geostationary imager-derived clouds common three-channel algorithm has better consistency between satellites and day and night cloud fraction. Smith also added that there are some discrepancies in cloud optical depth and particle size between the European Meteosat imager and the other geostationary satellites. The use of the K-D tree algorithm has improved consistency at night with the day cloud properties.
Wenying Su [LaRC] explored how fluxes may change if the Angular Distribution Models (ADMs) are created in different weather patterns (i.e. during El Niño and La Niña events). Two sets of Terra CERES ADMs were produced – one using 24 El Niño months and the other using 24 La Niña months. The global differences between SW fluxes composed from these two sets of ADMs were 0.5 Wm-2 regardless of the period (e.g., El Niño, La Niña, or neutral phase) and showed the same regional difference patterns. Su also explained how to partition the ToA SW fluxes from CERES into visible and near-infrared (NIR) fluxes. She showed how to use spectral radiances generated using look-up tables (LUT) from the MODerate resolution atmospheric TRANsmission (MODTRAN) code and spectral radiances measured by the VIIRS imager to separate the spectrum – see Figure 1. A ratio between the modeled visible band and CERES SW radiance is derived using the LUT. For water clouds, the visible band has the highest albedo due to cloud absorption being near zero. The NIR albedo is much lower than visible band due to high cloud absorption. For ice clouds, the two albedos are closer because ice clouds are more reflective in NIR than the visible band and there is less water vapor absorption above the cloud.
Figure 1. Using spectral radiance measurements generated using look-up tables (LUT) produced by the MODerate resolution atmospheric TRANsmission (MODTRAN) model and spectral radiances measured directly by the Visible Infrared Imager Radiometer Suite (VIIRS), top of atmosphere shortwave fluxes from CERES can be partitioned into monthly gridded instantaneous visible (VIS) [top left] and near-infrared (NIR) [top right] albedo, CERES derived cloud fraction [bottom left], and cloud optical depth from Suomi NPP VIIRS data for context [bottom right]. Figure credit: Su et al., 2024Lusheng Liang [LaRC, Analytical Mechanics Associates (AMA)] discussed the creation of ADMs using additional RAPS data from November 2021 (when Terra started drifting from the Mean Local Time Equatorial crossing of 10:30 AM) to April 2024. This period of observations provided data obtained at a solar zenith angle that is approximately 10° higher in the tropics than was observed during the initial period used for ADM development. New ADMs developed using data from this period have the largest impact for clear sky overland and cloudy sky over ocean versus clear sky over ocean and cloudy sky over land. Liang has also worked to improve the unfiltering coefficients, using the latest version of MODTRAN 5.4, Ping Ying’s cloud properties, two additional view zenith angles, seven additional solar zenith bins, and MODIS BRDF kernels over land and snow. The application of these changes to SW and LW from total minus SW resulted in a -0.30 and 0.30 W/m2 respectively for July 2019. Since NOAA-20’s FM-6 instrument has a LW channel, the team made an effort to reduce the differences between the LW channel from the total channel minus the SW channel. They also created a correction using warmer temperatures for the model over desert areas and cooler temperatures over vegetated land.
Dave Doelling [LaRC] presented a method to compare data from two ERB instruments in the same orbit, such as CERES on NOAA-20 and Libera on JPSS-4. This method is necessary without data from Terra. This approach used the invariant target of Libya-4. He compared the results using CERES instruments on Suomi NPP and NOAA-20. He added a second target to this analysis: Deep Convective Clouds that have cloud tops below 220 K located in the Tropical Western Pacific. Another approach placed the CERES instrument in a scan mode, matching the view zenith of the geostationary orbiting satellites (i.e., Terra FM2, Aqua FM3, and Meteosat-11). The geostationary imager radiances were used to determine the broadband LW flux, which was compared to the CERES-observed LW flux. The regression of these matched pairs of radiances showed that the Terra and Aqua CERES LW regression are within 0.2%. A machine learning approach to determine LW broadband flux from geostationary satellite imager radiance data showed a 75% decrease in bias and a 9% decrease in Root Mean Square Error over the multi-linear regression approach used in Edition 4. Doelling used a similar approach when working with data from the VIIRS imager, using radiance measurements to assign LW and SW fluxes to the cloud layers in the CERES footprint. When normalizing the individual portion of the footprint to the observed CERES data, the global bias is less than 1 W/m2.
In the Spring 2025 meeting, Doelling reported on the small change in monthly global variables from using MERRA-2 instead of GEOS 5.4.1 reanalysis in production of the Single Scanner Footprint (SSF) one degree and Synoptic one degree based on a minimum of a year overlap. He also highlighted the changes in the next version of SYN1deg Edition 4B. These changes included reprocessing of the three two-channel satellites (GMS-5, Met-5, and Met-7), using interpolated cloud retrievals over twilight hours (solar zenith > 60º), and transition to using data from NOAA-20 only and MERRA-2 reanalysis after March 2022.
Seung-Hee Ham [Analytical Mechanics Associates/LaRC] reported the availability of instantaneous Terra and Aqua CERES computed fluxes at the surface and ToA on a 1° equal angle grid [CERES Cloud and Radiative Swath (CRS1deg-Hour)] from January 2018 to December 2022. The algorithm changes to the Edition 5 Fu-Liou radiative transfer calculations reduced the LW ToA flux bias to less than 0.5 W/m2 from around 2 W/m2 with Edition 4.
Ham also discussed plans to increase the number of bands (from 18 to 29) in the Fu-Liou radiative transfer calculations and the corresponding shift in wavelength cut-off used for the bands. Nine gas species will now be used in Edition 5 for each band instead of the maximum of four species used in only one band currently. The line-by-line gas database has also been updated. These changes have less than a 2 W/m2 change in the SW and LW broadband fluxes between Edition 4 and 5, but line-by-line results show better performance.
Seiji Kato [LaRC] evaluated the computed irradiance trends at the ToA, surface, and within the atmosphere. At ToA for all-sky conditions, SW flux has been increasingly adding energy. Conversely, LW flux has been removing the additional energy, but at a smaller rate leading to an overall increase in net energy. At the surface for all-sky conditions, SW flux has been increasing energy, while LW flux has been decreasing at almost the same rate. As a result, there has been a small net increase. Within the atmosphere, the SW flux has increased more than the LW flux, but they are both positive. The global all-sky mean aerosol direct radiative effect from the synoptic one-degree (SYN1deg) was -2.2 W/m2, which was just below the -2.0 W/m2 mean from previous studies.
Paul Stackhouse [LaRC] presented the impact of transitioning the meteorology used in Fast Longwave and SHortwave Flux (FLASHFlux) to the Goddard Earth Observing System–for Instrument Teams (GEOS-IT) product. The global mean difference was less than 0.5 W/m2 in LW daytime surface downward flux, but the zonal bias can reach an absolute value of 5 W/m2 – see Figure 2.
Figure 2. Global annual mean Top of Atmosphere radiative flux changes between 2022 and 2023 for [top], outgoing longwave radiation and [bottom], and reflective shortwave radiation. Figure credit: Stackhouse et al., 2024The Global Learning and Observation to benefit the Environment (GLOBE) clouds team ran Eclipse Challenges during the October 2023 annular and April 2024 total solar eclipses. During each event, citizen scientists were encouraged to collect temperature and cloud measurements before and after the eclipse. The participants collected 34,000 air temperature measurements (which is 2.3 times the average number of observations) and 10,000 (13 times average) cloud measurements for both events. The cloud data showed a decrease in cloudiness as the eclipse approached and an increase after, but contrails showed a steady increase. The data also showed a noticeable decrease in air temperature at the local eclipse maximum.
Invited Science Presentations
The CERES STM typically invites two presentations at each meeting. The summaries for these presentations appear here in chronological order. The Fall 2023 presenters looked at responses to greenhouse gas (GHG) radiative forcing. The Spring 2024 presenters explored the Earth’s hemispheric albedo symmetry and the impact of aerosol changes on the cloud radiative effect (CRE). The Fall 2024 presenters discussed preparation of forcing datasets for CMIP 7 and cloud feedback in models. The Spring 2025 presenters explored trends in spectral radiances and the radiative forcing pattern effect.
Ryan Kramer [NOAA, Geophysical Fluid Dynamics Laboratory] explored the decomposition of the EEI as a tool for monitoring climate change. Kramer explained a Making Earth Systems Data Records for Use in Research Environments (MEaSURE) effort to pull together records from multi-instruments needed for decomposition of radiation forcing and radiative feedback from temperature, water vapor, ToA flux, surface albedo, and CRE – see Figure 3. The portion of the total radiative imbalance not attributed to feedback is due to radiative forcing from LW flux, 0.27 W/m2. This result – supported by observations and by results from the Suite of Community Radiative Transfer codes based on Edwards and Slingo (SOCRATES) – used a radiation scheme created by researchers at the United Kingdom Meteorological (UKMet) Office, where the radiative forcing is caused by an increase in GHG. The atmospheric cooling is balanced with sensible and latent heat flux related to precipitation. Latent heating from precipitation is inversely correlated with atmospheric radiative change. Decomposed atmosphere radiative forcing and feedback showed how GHGs radiatively heat the atmosphere but mute the trend in global precipitation. The reduction of aerosol in China since the 2008 Summer Olympics has regionally increased the SW radiative forcing. This result provides an example of the impact of mitigation efforts. GHG forcing is stronger in the tropics due to larger concentrations of water vapor and decreases in extratropical regions.
Figure 3. Linear trends in shortwave radiative forcing from 2003 through 2018, demonstrating the direct radiative effect of changes in aerosols. Positive trends correspond to less shortwave reflection to space (more planetary absorption) over time. Estimated using Clouds and the Earth’s Radiant Energy System (CERES), Atmospheric Infrared Sounder (AIRS), and CloudSat observation. [Right] Linear trends in aerosol optical depth (AOD) from 2003 through 2018 from Moderate Resolution Imaging Spectroradiometer (MODIS). The AOD trends often mirror shortwave radiative forcing trends, as expected. A positive trend in shortwave radiative forcing (less reflection) stems from a negative trend in AOD. Figure credit: Kramer et al., 2021Susanne Bauer [GISS] examined aerosol and cloud forcing in relation to GHG forcing. Early in the twentieth century, data show aerosols counterbalanced 80% of the GHG forcing, but aerosols began to decrease at the start of this century, reducing their impact to 15% today. The direct aerosol forcing follows the mean aerosol optical depth. It reached the maximum impact in 1977 but has decreased slightly since then. The indirect aerosol forcing is four times larger than the direct forcing and reached its peak in 2007. GISS model version E.21 underpredicted the SW ToA trend and overpredicted the LW ToA – see Figure 4. The version E.3 model received a major upgrade in model physics, cloud microphysics, and turbulence scheme, resulting in substantial improvement modeling marine cirrus clouds, total cloud cover, and precipitable water vapor. The trend in LW ToA flux matches CERES in non-polar regions. While the SW all-sky trend shows improvement, it still underpredicts observations. For example, model aerosol is not picking up the biomass burning in Siberia, which seems to be an artifact of using an older emission data base for the study. The improved aerosol data results reveal a larger trend in cloud droplet number concentration compared to the observations gathered by the Terra satellite. These data remain consistent with the Precipitable Water Vapor trend.
Figure 4. The trend in shortwave clear sky radiation change at the top of the atmosphere over the 23-year time series, from 2001 to 2023, of the CERES datasets in units of W/m2 per decade. Clear sky conditions show changes in the energy budget that are not associated with clouds for [left] CERES dataset and [right] model data using the NASA GISS Model E3.1. Notable features include negative trends over China, Europe, and the Eastern United States, and a positive trend around India, in correspondence with cleaner aerosol conditions in the first three regions and still increasing pollution in India. Energy balance changes in the Arctic and Antarctic are associated with land and sea ice changes. Some of the positive and negative trends in Canada, Russia, Central and Southern Africa, and South America are strongly impacted by biomass burning patterns. Figure credit: Susanne Bauer/CERESMichael Diamond [Florida State University] discussed a proposed test to evaluate whether Earth’s hemispheric albedo symmetry can be maintained. Currently, the all-sky albedo is nearly equal in both hemispheres, but the ToA clear-sky albedo is much greater in the Northern Hemisphere than the Southern Hemisphere, due to the distribution of landmasses. The Southern Hemisphere is also brighter in the visible wavelength, but darker in near-infrared spectrum. This symmetry is unique.
If the Earth was arbitrarily broken up into hemispheres, less than one-third of these hemispheres would be balanced within 1 W/m2. The solar reflection is symmetric, but outgoing LW radiation is not – with less energy leaving the Southern Hemisphere. This global imbalance is reduced with interhemispheric transport through the ocean and atmosphere.
Diamond discussed potential physical mechanisms that could maintain this symmetry (e.g., cloud feedback, solar climate intervention, or hydrological cycles). He noted that surface aerosols and high clouds increase albedo in the Northern Hemisphere, whereas low and altostratus clouds increase albedo in the Southern Hemisphere. Earth’s strong hemispheric albedo asymmetry is transient, which should allow for “natural experiments” to test the mechanism to maintain the symmetry. He discussed the moderate but long-term test for the loss of Arctic sea ice from 2002 to 2012, as well as the decline in clear-sky atmospheric reflection due to air pollution over China that peaked in 2010 and declined in 2019. He also discussed more abrupt changes, including the post-2016 decline in Antarctic sea ice, the decrease in Northern Hemisphere low cloud reflection caused by sulfur fuel regulation as enacted by the International Maritime Organization in 2020, the decreased Northern Hemisphere aerosol concentration following activity restrictions during the COVID-19 pandemic, the increased Southern Hemisphere aerosol concentration during the bushfires in Australia between 2019 and 2020, and the increased Northern Hemisphere aerosol concentration reflection following the Nabro volcanic eruption in 2011 – see Figure 5. Despite these multiple events, the expected change in clear-sky albedo from the surface or aerosol change seems to be masked in the all-sky albedo through simultaneous changes in cloud reflectivity. Many of these events overlap, which complicates how to interpret the results.
Figure 5. During the extreme 2019–2020 Black Summer bushfires in Australia, pollution levels over the Southern Ocean (as measured by aerosol optical depth, or the amount of light scattered and absorbed by pollution particles in the atmosphere) reached their highest values in approximately 20 years of monitoring by NASA’s Moderate resolution Imaging Spectroradiometer (MODIS). Figure credit: Diamond et al., 2024Daniel McCoy [University of Wyoming] discussed his investigation of uncertainty in cloud radiative feedback in climate forcing due to changes in aerosols. At this time, extratropical cloud feedback has an uncertainty of over 2.5 W/m2. Pollution leads to an increase in aerosol concentration, which impacts cloud formation and changes the droplet number concentration. This increase results in changes to the cloud coverage and amount of liquid water content in the clouds – see Figure 6. The work of McCoy and his colleagues has constrained the change in droplet number and liquid water content with the hope of narrowing the effective radiative forcing from aerosol–cloud interaction. Using results from the Community Atmosphere Model (CAM) 6 and observations, they were able to constrain the range of possible droplet number concentration by 27% and liquid water content by 28%. These constraints reduced the effective radiation forcing to 2%. McCoy argued that this small impact is due to the interaction between precipitation efficiency and radiative susceptibility through changes in the Liquid Water Path (LWP), which results in buffering of the radiative effect by reduced radiative sensitivity.
Figure 6. Water vapor path from the Morphed Integrated Microwave Imagery at CIMSS–Total Precipitable Water (MIMIC–TPW) product showing transient eddies moving moisture from the tropics to the extratropics. The relationship between moisture transport, precipitation, and albedo acts to set large-scale Earth system behavior. Figure credit: Development of the MIMIC-TPW2 product is supported by the Joint Polar Satellite System (JPSS) Risk Reduction Program and the Office of Naval Research.David Paynter [Geophysical Fluid Dynamics Laboratory (GFDL)] explored the spectral dimension of recent changes in ERB. The atmospheric state, temperature, and gas species, from each level in a grid box are used in a line-by-line (LBL) radiative code to calculate the spectra. The two codes used are the NOAA GFDL GPU-enabled Radiative Transfer (GRT) and the Reference Forward Model (RFM) from Oxford University. Paynter and colleagues used a LW radiation solver to get ToA fluxes. They then compared the monthly mean spectrally resolved ToA fluxes using ERA5 inputs for 2003 to 2021 to Atmospheric Infrared Sounder (AIRS) observations. Paynter showed that there is generally good agreement between all-sky AIRS climatology and the LBL calculations, and similar spectral trends; however, some bands have larger differences in the trend. The all-sky OLR between the LBL-ERA5, CERES, and AIRS show consistent positive trends between 0.15 to 0.31 W/(m2/decade); however, the LBL-ERA5 0.11 W/(m2/decade) and the CERES -0.15 W/(m2/decade) show disagreement.
David Thompson [Colorado State University/University of East Anglia] studied the pattern associated with ToA radiative response to changes in surface temperature. Historically, this has been accomplished by looking at the local radiative response due to local change in temperature or to global-mean temperature change. The first reflects a two-way interaction between the local radiative flux and local temperature that identifies areas that are changing. The second results are more difficult to interpret because the local response is multiplied by the same value. Thus, Thompson proposed a third method of evaluating the changes by using the global-mean radiative response to changes due to local changes in temperature. This approach identifies positive values with warm temperatures and downward radiative fluxes. The temperature variability over the Eastern Tropical Pacific contributes to positive values in the global internal feedback parameter. The reverse happens in the Western Tropical Pacific. Another advantage of this method is that the contribution of local feedback to the global feedback is easy to calculate. Using the CERES monthly-mean Energy Balanced and Filled (EBAF) data, the global weighted feedback is -1.1 W/m2 with global oceans contributing -0.2 W/m2 and global land -0.9 W/m2. The Eastern Tropical Pacific contribution is 0.1 W/m2 and the Western Tropical Pacific contribution is -0.1 W/m2. This approach can be applied to models to see which are representative of the observations. Preindustrial runs of the model generally reproduce the negative Western Tropical Pacific anomaly; however, Thompson noted that most models do not capture the positive anomaly in the Eastern Tropical Pacific.
Contributed Science Presentation
The following section provides highlights from the contributed science presentations. The content is grouped by Earth radiation instruments that are in development; new techniques for use in climate models and analysis of their results; applications of machine learning; and observational datasets and their analysis.
Future Earth Radiation Instruments
It should be noted that the information shared below reflects the mission plans at the time of the meeting. The mission goals may have changed as a result of changing budgets, agency priorities, and other factors.
Kory Priestly [LaRC] discussed the Athena Economical Payload Integration (EPIC) pathfinder mission using the NovaWurks Hyper Integrated Satlet small satellite platform that is integrated with a spare CERES LW detector and calibration module flight hardware. This setup was designed to test the novel building block approach to satellites as a potential path for the next ERB instrument at a reduced cost. [UPDATE: The Athena mission launched successfully on July 23, 2025. Unfortunately, after being released from the rocket the spacecraft started tumbling and could not be recovered.]
Tristan L’Ecuyer [University of Wisconsin–Madison] presented the science being answered by the Polar Radiant Energy in the Far InfraRed Experiment (PREFIRE) – see Photo 1. The instrument will quantify the far-infrared spectrum beyond 15 μm, which accounts for over 50% of the OLR in polar regions. Additionally, the atmospheric greenhouse effect is sensitive to thin clouds and small water vapor concentration that have strong far infrared signatures. PREFIRE consists of two CubeSats in near polar orbits. The instrument has a miniaturized infrared spectrometer covering 5 to 53 μm with 0.84 mm sampling and an operational life of one year. A complete infrared emission spectrum will provide fingerprints to differentiate between several important feedback processes (e.g., cloudiness and water vapor) that leads to Arctic warming, sea ice loss, ice sheet melt, and sea level rise. [UPDATE: The two PREFIRE CubeSats launched successfully in May and June of 2024, with first light images following in September 2024; public release of PREFIRE data products occurred in June 2025.]
Photo 1. NASA’s Polar Radiant Energy in the Far-InfraRed Experiment (PREFIRE) mission will measure the amount of heat Earth emits into space from two of the coldest, most remote regions on the planet. Photo credit: NASAPeter Pilewskie [Laboratory for Atmospheric and Space Physics (LASP)] announced that Libera will be integrated on Joint Polar Satellite System-4 (JPSS-4), which eliminates the need to remove JPSS-3 from storage. This change will affect the launch order. He also presented a comparison between the Compact Total Irradiance Monitor (CTIM) CubeSat and CERES observations. Pilewskie noted that CTIM uses the same Vertically Aligned Carbon Nanotube (VACANT) detectors that Libera will use. Even though CTIM is designed to measure Total Solar Irradiance, the spacecraft has been oriented to get Earth views during spacecraft eclipse with the Sun (nighttime). CTIM provides a ~170-km (105-mi) footprint – which is about eight times larger than that of CERES. The mean relative difference between CERES and CTIM matches are -1.8% varying between -1.5% for FM6 and 2.0% for FM1.
Climate Model Developments and Analysis
Paulina Czarnecki [Columbia University] introduced a method to use a small number of wavelengths to determine broad band radiative fluxes and heating rates as an alternative to the correlated K parameterization approach. It uses a simple optimization algorithm and a linear model to achieve accuracy similar to correlated K-distribution. The approach uses a small set of spectral points – 16 in the study – to predict the vertically resolved net flux within 1 W/m2 under clear-sky conditions.
Sean Cohen [Columbia University] addressed the impact of rising surface temperature on precipitation. This information is required to determine the relationship between hydrological sensitivity and radiative cooling sensitivity, where convective heating is balanced by radiative cooling. When carbon dioxide (CO2) increases, it masks changes in emission from water vapor, resulting in mean rainfall changes when atmospheric transmission changes at a rate of 2%/K. The “symmetry” of the water vapor spectral window causes atmospheric transmission to change at a near constant rate with the surface temperature. This hydrological sensitivity peaks at subtropical surface temperatures – see Figure 7.
Figure 7. A comparison of an ensemble of General Circulation Model results [faded lines] to predictions from the author’s pen-and-paper model under a constant carbon dioxide (CO2) concentration of 400 ppm (orange) and under varied CO2 concentration (black). The gray line shows the prediction from the source scaling. [Inset] The percent change in mean rainfall [hydrological sensitivity (HS)] with surface temperature as predicted by these same analytical models (same color labels). Figure credit: Cohen et al., 2025George Tselioudis [GISS] explored how shifts in the atmospheric zonal mean circulation changed the CRE. The poleward shift in the location of the Hadley Cell (with corresponding high clouds following it) occurred in both hemispheres; however, it produced SW CRE warming during North Atlantic winter, contrary to SW CRE cooling in both Southern Hemisphere summer and winter. The Southern Hemisphere high cloud shift does not reduce the total cloud amount that occurred in the North Atlantic. The jet stream shift only had an impact during North Atlantic winter. The LW CRE produced a dipole of warming at the previous and new Hadley Circulation positions. The magnitude of LW CRE changes increased with larger upward velocity changes. The SW CRE is dependent on both change in vertical velocity and stability (EIS). Based on these observational findings, Tselioudis evaluated the CMIP 5 and 6 results. Both model results showed lower midlatitude SW CRE warming, but CMIP 5 produced a larger dependence on the climatological Hadley circulation whereas CMIP 6 did not. CMIP 6 models are less dependent on vertical velocity than the earlier set, which allow them to produce Southern Hemisphere SW CRE warming.
Gregory Cesana [GISS] investigated the tropical stratocumulus and shallow cumulus SW feedback, which explains part of the spread in climate sensitivity in the CMIP 5 and 6 models. Observationally, inferred low-cloud feedback is driven by stratocumulus clouds with very little input from cumulus clouds. In the model, cloud type is determined from the mean low cloud fraction in the tropics. When the model cloud fraction is smaller, the cloud is assumed to be cumulus. When it is greater, the cloud is considered to be stratocumulus. CMIP 6 underestimates both low cloud types, but especially in the high stratocumulus regions along the western coasts of continents. Both models favor cumulus over stratocumulus regimes, but the bias for CMIP 6 is less than CMIP 5. The increased model stratocumulus is correlated with increased low-cloud feedback – see Figure 8. If the increased stratocumulus clouds in CMIP 6 matched observations, the mean low cloud feedback would have doubled to 0.7 W/m2 K.
Figure 8. [Left to Right] Maps of stratocumulus (Sc) and shallow cumulus (Cu) cloud feedback for [top to bottom] CALIPSO and CERES observations, the Climate Model Intercomparison Project model (CMIP 6), and CMIP 5 models. The means are given in the upper left corner of each map. The linear correlation coefficients between observations and CMIP 6 and CMIP 5 models are 0.39 and 0.20 for Sc, and 0.30 and 0.22 for Cu, respectively. Collectively, CMIP 6 models substantially improved depiction of Sc cloud feedback both in terms of mean and pattern correlation compared to CMIP 5, and also for Cu clouds to a lesser extent. Both models underestimate the magnitude of the positive feedback – and therefore the warming due to low clouds in response to climate change. Figure credit: Cesana et al., 2023Patrick Taylor [LaRC] explored the cloud–sea ice feedback mechanism – see Photo 2. He explained that results from CMIP 5 and 6 show the largest variation in climate projections in the Arctic – where surface albedo feedback is the biggest contribution to the inter-model differences. He evaluated the difference between ice-free and ice surfaces on either side of the marginal ice zone – a part of the seasonal ice zone ranging from 100- to 200-km (62- to 124-mi) wide that extends from the ice edge into the ice pack. The cloud property differences are strongly tied to the differences in thermodynamic profiles, whereas the ice edge (part that is over open water) has warmer, moister, and weaker lower tropospheric stability than the ice pack, leading to more positive turbulent surface fluxes at the ice edge. The feedback from surface properties and lower tropospheric thermodynamics profile are critical to sea ice loss. This sea ice–cloud feedback is positive in the fall and winter and negative in the spring.
Photo 2. Surface albedo is a measure of reflected sunlight from Earth’s surface. This measurement provides critical information for modeling Earth’s climate, particularly in polar regions; however, computer models struggle to simulate albedo. This photo gives some idea why. The terrain in the Arctic is highly variable, which, along with the heterogeneity in snow and/or ice cover on the surface, make surface albedo one of the most challenging physical variables to represent in climate models. Photo credit: Taylor et al., 2024Doyeon Kim [LaRC—NASA Postdoctoral Program] discussed factors that explain the current Arctic albedo and possible future changes in this region. She noted that the Arctic undergoes rapid warming during the summer with an accompanying decrease in surface albedo each year until it starts to increase again in the fall – see Figure 9. Researchers use the output from the Atmospheric Model Intercomparison Project (AMIP) and CMIP 6 to infer future changes to albedo. In her analysis, Kim decomposed surface albedo into five terms: sea ice albedo in ice region, sea ice concentration, albedo spatial variation, ice region, and albedo in ocean region. She explained that the ice albedo term drives most changes in AMIP where the ice concentration is held constant. Sea ice concentration and ice region terms become important for the CMIP 6 model where they can change.
Kim went on to look at the monthly averages of albedo, pointing out that March and September show large differences. The multimodal mean exhibits a large spread in the ice albedo. The CMIP 6 spread is significantly influenced by both seasonal and spatial variations. During the early summer months, the ice region term contributes to albedo spread across the Barents, Kara, and Laptev Seas and Greenland Sea. The ice albedo term during the late summer contributes to albedo in the East Siberian, Chukchi, and Beaufort Seas and Central Arctic Sea. A significant inter-model spread may be the primary factor that is contributing to the variability observed in Arctic warming across the different model simulations. Kim discussed the significant difference in surface albedo between CERES and the CMIP 6 models. Both ice fraction and ice albedo have a substantial effect on the model spread of albedo. Time series data indicate that sea ice albedo and concentration remain relatively unchanged in response to global warming while the ice region term decreases significantly.
Figure 9. Present-day Arctic surface albedo from the CMIP 6 multi-model mean (2001–2014) compared with Clouds and the Earth’s Radiant Energy System (CERES) observations. Panels (a–d) show CMIP 6 multi-model mean albedo for March, April–May, June–August, and September, while panels (e–h) show corresponding CERES retrievals. Figure credit: Doyeon Kim/NASA Langley Research CenterApplication of Machine Learning
Ben Scarino [LaRC, Analytical Mechanics Associates (AMA)] explored the consistency of skin temperature (i.e., temperature at the surface) and the temperature 2-m (6.5-ft) above the ground from reanalysis and satellite and ground observations, respectively. He reported that the Global Modeling and Assimilation Office (GMAO) does not assimilate either skin or ground temperature into their reanalysis, producing large biases in those values. Conversely, ERA5 does assimilate 2-m temperature in the reanalysis, which reduce variations by 1 K. The introduction of a Deep Neural Network (DNN) adjusts the reanalysis skin temperature to the observed satellite skin temperature – see Figure 10.
Figure 10. An estimate of clear-sky satellite skin temperature bias for day [left column] and night [right column] between GEOS-IT model and satellite observations [top row] and between satellite predictions – using a deep neural network (DNN) – and satellite observations [bottom row]. Use of the DNN reduced the bias between predicted and observed skin temperatures and lowered the standard deviation. Figure credit: Scarino et al., 2023Sunny Sun-Mack [LaRC, AMA] described her efforts to train a Neural Network to identify single and multilayer ice-over-water and cloud top height using the Cloud Aerosol Lidar with Infrared Pathfinder Satellite Observations (CALIPSO), CloudSat, and MODIS [CCCM] pixel-level product from 2008. For single layer cloud top heights, the neural network reduced the standard deviation of difference by nearly half. For the ice cloud top height in multilayer clouds, the standard deviation of difference is one-third. The neural network showed the same “skill” with lower multilayer cloud top heights as it did with single and multilayer upper cloud top heights – (e.g., standard deviation of difference is similar). The single layer cloud base showed similar skill to cloud top height, but the upper cloud base height was slightly worse than the cloud top height. The current algorithm using only imager data cannot differentiate multilayer clouds and creates a single water cloud that does not allow the flux to be calculated properly.
Jay Garg [LaRC/ADNET Systems, Inc] described improvements in SW surface flux using a Machine Learning technique over parameterized instantaneous CERES footprint fluxes. He trained a Neural Network model using the Fu-Liou calculated CERES CRS surface fluxes. This approach reduced the bias from 25 Wm-2 to almost 0 and the Root Mean Square (RMS) Error from nearly 100 to 13 W/m2 for SW surface fluxes. The LW flux statistics showed the bias reduced from 2 Wm-2 to nearly 0 and RMS Error from 12 to 3.5 W/m2 compared to the parameterized flux. These results nearly match the CRS values. Garg explained the plan to implement the Neural Network in the FLASHFlux SSF product – see Figure 11.
Figure 11. Artificial Neural Network differences between the Neural Network LW fluxes and the computed values globally for Jan. 4, 2020. The differences are consistently small across all areas (scale range is -15 to 15 Wm-2). The authors (see Credit below) note the need to improve some areas over continents and areas involving cloud patterns. Figure credit: Garg et al., 2024Takmeng Wong [LaRC] presented recent progress on an imager independent instantaneous flux product to replace the current Earth Radiation Budget Experiment (ERBE)-like product. Wong described the use of a Random Forest classification technique to determine if the scene is clear (defined as 99.9% cloud free) or cloudy. This approach allowed the CERES radiances to be unfiltered – see Figure 12. Wong and colleagues developed separate models for day and night as well as for surface types (e.g., water, land, desert, and ice and snow). Wong discussed how an Artificial Neural Network was used to convert radiances to a flux. Similar to the radiance models, Wong and colleagues did separate analyses for day and night and for the four surface types for both clear and cloudy conditions. The results from this approach were shown superior to the ERBE-like fluxes but not reaching the accuracy of the SSF using imager-derived clouds.
Figure 12. The number of clear footprints per 1 degree region for [Left] Earth Radiation Budget Experiment algorithm applied to CERES and [right] random forest results from CERES data. The right figure demonstrates a significantly reduced number of falsely identified clear pixels. Figure credit: Wong et al., 2024Eshkol Eytan [University of Colorado, Boulder] focused his work on the cloud twilight zone, an area of transition between clear and cloudy skies, such as cloud halo, cloud fragment, and thin clouds only seen in forward scatter. The clear sky reflectance increases, which is wavelength dependent the closer it is to the cloud. Eytan looked for this feature in the LW data. The lower bound for low clouds is ~0.75 W/m2. The fraction of what is considered clear is 60% cloudiness. The cloud twilight zone contribution to the CRE is ~0.8 W/m2 for warm clouds and ~8 W/m2 for all clouds. Eytan broke down MODIS data into 200-km2 (77-mi2) regions and applied a cloud mask. The team then looked at how different channels react with distance. Eytan and colleagues analyzed both visible and LW channels on MODIS. This work determined a pure clear sky value based on distance from known clouds and how it differs from the individual pixel radiance squared divided by the standard deviation obtained in the box. When the twilight spectral measure is greater than one, it signifies cloud contamination. The pure clear MODIS pixels within a CERES footprint are averaged to get a true clear-sky radiance. Often a CERES footprint exceeds the pure clear area. Eytan then explained how he used the clear sky measurement to determine a normalized factor for MODIS data to estimate CRE. He used machine learning between CERES radiances and MODIS radiances at different wavelengths to get pure clear-sky fluxes in homogenous areas. After training on CERES footprint, he then applied MODIS data to smaller areas. The shift of CRE to a higher value, from -6 W/m2 to -10 W/m2 with imager pixels, produced a more confident cloud mask – reducing uncertainty by a third. This value is still larger than the estimated aerosol direct radiative field. Applying the same technique to the thermal portion of the CRE is 1 and 1.5 W/m2.
Observational Datasets and Analysis
Lazaros Oreopoulos [GSFC] presented a new approach for classifying cloudiness at monthly time scales that preserves some of the variability of the original MODIS daily pixel observations. Starting from the 12 previously defined MODIS cloud regimes (CRs) that classified cloud mixtures according to how cloud top pressure and optical depth co-vary on daily scales, he grouped mixtures of CRs occurring regionally over a month using k-means clustering. He classified the geographical distribution of mean occurrences of the resulting eight monthly climatological cloud regimes as “Regimes of Regimes” (RORs) – see Figure 13. When examining the CRE of the RORs, he found that ROR5 contained large amounts of shallow convection. CR10 exhibited strong shortwave and longwave CRE trends because of declining CR10 populations.
Figure 13. Geographical distributions of mean population density [expressed as relative frequency of occurrence (RFO)] for the eight climatological cloud regimes, also called “Regimes of Regimes” (RORs), derived from 20 years of MODIS cloud retrievals. Figure credit: Oreopoulos et al., 2023Maria Hakuba [NASA/Jet Propulsion Laboratory (JPL)] provided an update on the WCRP Global Energy and Water Exchanges (GEWEX) Data and Analysis Panel assessment of the EEI. Quality control led to a skew in the Ocean Heat Content estimates, mapping techniques, and mask and coverage. The year-to-year variability did not follow the CERES EEI; however, a combination of in-situ and altimetry data for hybrid estimates resulted in very good agreement. The agreement with the JPL geodetic ocean heat uptake with the correct expansion efficiency was also good. The net all-sky was positive across all zones. The net clear-sky trend matched all-sky. The net-CRE showed negative trends in Northern Hemisphere deep tropics and high latitudes. The SW and LW CRE complement each other both globally and zonally. The positive SW CRE dominated in the tropics with fewer, lower, and thinner clouds.
Jake Gristley [NOAA’s Cooperative Institute for Research in Environmental Science (CIRES)/University of Colorado, Boulder] explored the angular dimension of ERB with the Wide Field of View camera planned for the Libera mission. The camera is a 2048 x 2048-pixel array that samples the entire Earth disk subtended from the satellite. It provides 1-km (0.62-mi) pixel spacing at nadir with a single spectral channel at 555 nm. This technique produces more data than can be downloaded. The ADM sampling methods Gristley used encompass the Libera Point Spread Function and minimize the amount of data that must be transmitted.
Seung-Hee Ham discussed how to evaluate cloud volumes using CALIPSO, CloudSat, and MODIS observations separately and in combination to determine the strengths and weakness of each approach. CloudSat misses thin cirrus and low clouds; CALIPSO misses low and mid clouds as a result of signal attenuation; and MODIS misses high and low clouds and over detects mid clouds. Ham described a trend from 2008 to 2017 that shows an increase in the upper-most clouds and a decrease in underlying clouds. She also looked at the El Niño Southern Oscillation (ENSO) signal that showed varying responses based on latitude bands. The increase in high clouds above 10 km (6.2 mi) represent an increase in clouds with a temperature between 220 and 240 K. The colder cloud emission and smaller OLR provide positive cloud feedback.
Brent Roberts [NASA’s Marshall Space Flight Center (MSFC)] presented applications of CERES surface fluxes in the Regional Visualization and Monitoring System (in French SERVIR). SERVIR is a joint initiative of NASA, United States Agency for International Development (USAID), and leading geospatial organizations in Asia, Africa, and Latin America. SERVIR uses satellite data and geospatial technology in innovative solutions to improve resilience and sustainable resource management. The projects are driven by demand to meet community needs and values. The CERES fluxes are used input into crop and land surface modeling through NASA’s Prediction of Worldwide Energy Resources (POWER) tool. Another example of where CERES data are used as input is for the Regional Hydrologic Extremes and Assessment System (RHEAS), which is a framework for providing nowcast and forecasts of streamflow and crop yields that has been deployed in Eastern Africa and Southeast Asia. The South Asia Land Data Assimilation System (SALDAS) uses the NASA GEOS Subseasonal to Seasonal (S2S) prediction system and long-term observational records or assimilations to evaluate climate anomalies. The GEOS-S2S information is downscaled to 5 km (3 mi) using Land Information System or Land surface Data Toolkit, which is combined with information from POWER and the Integrated Multi-satellitE Retrievals for Global Precipitation Monitoring (IMERG GPM). The value of CERES surface fluxes is more accurate over the model data when compared to Surface Radiation Budget (SURFRAD) network observations. Roberts explained future plans to refine the downscaling approach to take advantage of satellite-based radiative fluxes.
David Rutan, [ADNET Systems] validated the CERES CRS data product at Siple Dome, Antarctica. The CRS is a CERES footprint-based application of the Fu-Liou Radiative Transfer Model. At the high polar latitude, Terra and Aqua provide multiple passes each day allowing the diurnal cycle to be captured. The calculated LW surface downward flux is consistently too low under both clear and cloudy skies. Whereas the SW surface downward flux is low for cloudy conditions but matches well under clear skies. The surface upward flux comparison demonstrates LW is very low for cloudy skies and improves for clear skies. Conversely, SW is low for cloudy conditions and again matches well with clear skies. Despite the bias, the CERES fluxes captured the dynamic changes in observed radiances. The difference between fluxes calculated by the GMAO GEOS 5.4.1 model, MODIS, and AIRS observed fluxes are shown in Figure 14. The model has a low bias for skin and air [2-m (6-ft) off the ground] temperature and a dry bias in the troposphere compared to the observations.
Figure 14. The calculated data fairly well in the shortwave down, particularly when the sky is clear. The longwave down, the calculations are cold, because it is largely influenced by the near surface air temperature. When Rutan and his team compared current input (GEOS-541) to input for the Edition 5 version of the cloud regimes (GEOS-IT), they found that the current surface air temperature is too low in the Antarctic. Figure credit: Rutan et al., 2023Norman Loeb presented the CERES approach for a seamless climate data record across multiple satellite transitions applied to the EBAF ToA data product. All CERES instruments are anchored to FM1 via intercalibration using coincident measurements. Low Earth Orbiting (LEO) and Geostationary Earth Orbiting (GEO) imager radiances are placed on the same radiometric scale using a combination of ray-matching and invariant targets. Loeb explained the next step that used overlap between successive missions to anchor the level 3 (L3) data product from different satellites to a common reference. He then addressed the question of incorporating a new broadband instrument into the data after a 46-month data gap using computed fluxes from a SYN1deg product or the ERA5. All methods introduced a bias greater than 0.1 W/m2 than currently expressed using EBAF.
Virginia Sawyer [GSFC/Science Systems and Application, Inc.] provided an update on aerosol trends and changes for Dark Target – a satellite algorithm for retrieving aerosol properties from MODIS and other sensors by looking for brightness changes, which is more effective for dark surfaces (e.g., forests and oceans). Sawyer reported that the Collection 6.1 Aerosol Optical Depth (AOD) over land was higher for Terra than for Aqua early in the record. After 2015, however, the two records became more consistent. The Suomi NPP AOD tracks closely to Terra and Aqua, but the NOAA-20 data produce lower aerosol values. This same pattern is seen over the oceans, but the Terra and Aqua do not converge after 2015. Sawyer reported that the preliminary results for MODIS Collection 7 (C7) do not significantly change Aqua results but do increase Terra AOD over land. This finding increases the Terra–Aqua offset. Sawyer indicated that MODIS C7 will include new Dark Target and Deep Blue, a companion algorithm to Dark Target but designed to excel over bright surfaces (e.g., deserts) by using blue/UV bands where aerosols are prominent. Likewise, she reported that the C7 MODIS Deep Blue algorithm will be expanded to retrieve over the ocean, similar to the current version for VIIRS.
Tyler Hanke [University of Illinois] introduced the concept of emergent constraint that combines some current observable climate quantity and its future projections with an observational estimate to constrain future projections. He used ENSO as a potential emergent constraint on the pattern effect. ENSO in both the Eastern Pacific and Central Pacific have associated all-sky radiation patterns that are dominated by low-cloud radiative effect anomalies that are primarily driven by SST. The increase in SST decreases low-clouds and weakens the inversion. These features were identified in both CMIP 6 models and the CERES EBAF product.
Xianglei Huang [University of Michigan] provided OLR trends from CERES, AIRS, and Cross-track Infrared Sounder (CrIS) on Suomi NPP and NOAA-20. The AIRS data showed about half the trend that CERES had over 20 years, but within the uncertainty of both measurements. He reviewed the various sources of differences: ADMs, calibration, and extrapolation. Huang explained that Suomi NPP CrIS data have known issues in the mid-IR channel, so NOAA-20 CrIS must be used for the analysis. A review of the past 10 years shows much closer agreement – around 0.055 W/m2 per year. Huang said that there are enough data to begin to look at spectral trends, which will be a focus of his future endeavors.
Patrick Taylor [LaRC] provided an overview of the Arctic Radiation-Cloud-aerosol-Surface Interaction Experiment (ARCSIX), which is designed to quantify the contributions of surface properties, clouds, aerosols, and precipitation to the Arctic summer surface radiation budget and sea ice melt. Taylor explained how the field experiment will increase the field’s knowledge of the coupling between radiative processes and sea ice surface properties that influence the summer sea ice melt processes that control Arctic cloud regimes and their properties. It also controls the ability to monitor Arctic clouds, radiation, and sea ice processes from space. Even though the thin Arctic clouds can be radiatively important, they are challenging to observe with passive instruments, such as MODIS. The surface albedo is the largest uncertainty in intermodel differences in the Arctic. Two periods of aircraft measurements are available from Greenland between mid-May to mid-June and late-July to mid-August 2024. During the Fall 2024 meeting, Taylor reported that the Wallops Flight Facility (WFF) P-3 completed 19 flights, the LaRC Gulfstream-III had 15 flights, and SPEC Incorporated Learjet had 10 flights out of Pituffik Space Base in northwest Greenland. Altogether the ARCSIX flights accounted for nearly 350 flight hours. Taylor reported that (at the time of the Spring 2025 meeting) these data were still being prepared for public release.
Conclusion
Much like many of the CERES STMs that have preceded them, the last four meetings addressed the current state of CERES instruments, data products and algorithms, and outreach activities. The meetings began with a discussion on global mean surface temperature, progress on cloud algorithms, and changes in SW flux into different components of the electromagnetic spectrum. In addition, the CERES discussions compared ERB instruments, irradiance trends at different levels of the atmosphere, and information shared by citizen scientists during eclipse events in 2023 and 2024. Invited presentations evaluated how to parse radiation forcing and feedback to understand different atmospheric parameters and the use of different models, including Neural Network models, to examine the data gathered by CERES. The presentations also examined the concentration and distribution of aerosols in relation to different cloud types and droplet number and their relationship to climate sensitivity. Several presentations focused on the Arctic, especially with regard to albedo and ice extent. Several projects combined work from CERES and other instruments on the satellite platforms to examine single and multi-layer ice-over-water and cloud top in the atmosphere. The work over the two-year period has brought together a diverse group of experts to clarify atmospheric dynamics to understand changes in radiative flux to improve predictions of future climate conditions.
Walter Miller
NASA’s Langley Research Center/ADNET Systems, Inc.
walter.f.miller@nasa.gov
2025 Space Station Science Snapshots
1 min read
Preparations for Next Moonwalk Simulations Underway (and Underwater) NASA astronaut Zena Cardman processes bone cell samples inside the Kibo laboratory module’s Life Science Glovebox. NASA
2025 marks another year pushing the boundaries of scientific research aboard the International Space Station. This past year, over 750 investigations were conducted aboard the space station, supported by crewed missions and resupply vehicles delivering essential cargo and experiments to the orbiting laboratory. This year’s research included testing DNA’s ability to store data, producing vital nutrients on demand, demonstrating technology for space debris removal and satellite maintenance, advancing next-generation medicines, and more. Astronauts visited the space station from across the globe to continue research benefiting humanity on Earth and paving the way for future exploration missions, including NASA’s Artemis program to return humanity to the Moon. On Nov. 2, 2025, NASA and its international partners surpassed 25 years of continuous human presence aboard the space station, showcasing humanity’s dedication to space exploration and scientific discovery.
Over a million images were taken aboard the space station this year, documenting groundbreaking research, observing Earth from space, and even capturing comets and other celestial phenomenon. Rewind and look back at a photo recap of 2025 aboard the space station.
Keep Exploring Discover More Topics From NASALatest News from Space Station Research
Space Station Research and Technology
Space Station Research Results
Space Station Research and Technology Resources
2025 Space Station Science Snapshots
1 min read
Preparations for Next Moonwalk Simulations Underway (and Underwater) NASA astronaut Zena Cardman processes bone cell samples inside the Kibo laboratory module’s Life Science Glovebox. NASA2025 marks another year pushing the boundaries of scientific research aboard the International Space Station. This past year, over 750 investigations were conducted aboard the space station, supported by crewed missions and resupply vehicles delivering essential cargo and experiments to the orbiting laboratory. This year’s research included testing DNA’s ability to store data, producing vital nutrients on demand, demonstrating technology for space debris removal and satellite maintenance, advancing next-generation medicines, and more. Astronauts visited the space station from across the globe to continue research benefiting humanity on Earth and paving the way for future exploration missions, including NASA’s Artemis program to return humanity to the Moon. On Nov. 2, 2025, NASA and its international partners surpassed 25 years of continuous human presence aboard the space station, showcasing humanity’s dedication to space exploration and scientific discovery.
Over a million images were taken aboard the space station this year, documenting groundbreaking research, observing Earth from space, and even capturing comets and other celestial phenomenon. Rewind and look back at a photo recap of 2025 aboard the space station.
Keep Exploring Discover More Topics From NASALatest News from Space Station Research
Space Station Research and Technology
Space Station Research Results
Space Station Research and Technology Resources
15 Million Years before the Megalodon, This Giant Ancient Shark Prowled the Oceans
A humungous shark that lived 115 million years ago surpassed the size of modern-day great whites, paleontologists discovered
NASA to Preview US Spacewalks at Space Station in January
NASA astronauts will conduct a pair of spacewalks in January outside of the International Space Station to prepare for the installation of a roll-out solar array and complete other tasks. Experts from NASA will preview the spacewalks in a briefing at 2 p.m. EST Tuesday, Jan. 6, at NASA’s Johnson Space Center in Houston.
Watch NASA’s live coverage of the news conference on the agency’s YouTube channel. Learn how to stream NASA content through a variety of online platforms, including social media.
Participants include:
- Bill Spetch, operations integration manager, International Space Station Program
- Diana Trujillo, spacewalk flight director, Flight Operations Directorate
- Heidi Brewer, spacewalk flight director, Flight Operations Directorate
Media interested in participating in person or by phone must contact the NASA Johnson newsroom no later than 10 a.m., Monday, Jan. 5, by calling 281-483-5111 or emailing jsccommu@mail.nasa.gov. To ask questions by phone, reporters must dial into the news conference no later than 15 minutes prior to the start of the call. Questions may also be submitted on social media using #AskNASA. NASA’s media accreditation policy is available online.
On Thursday, Jan. 8, NASA astronauts Mike Fincke and Zena Cardman will exit the station’s Quest airlock to prepare the 2A power channel for future installation of International Space Station Roll-Out Solar Arrays. Once installed, the array will provide additional power for the orbital laboratory, including critical support of its safe and controlled deorbit. This spacewalk will be Cardman’s first and Fincke’s 10th, tying him for the most spacewalks by a NASA astronaut.
On Thursday, Jan. 15, two NASA astronauts will replace a high-definition camera on camera port 3, install a new navigational aid for visiting spacecraft, called a planar reflector, on the Harmony module’s forward port, and relocate an early ammonia servicer jumper — a flexible hose assembly that connects parts of a fluid system — along with other jumpers on the station’s S6 and S4 truss.
NASA will announce the astronauts planned for the second spacewalk and start times for both events closer to the operations.
The spacewalks will be the 278th and 279th in support of space station assembly, maintenance and upgrades. They also are the first two International Space Station spacewalks of 2026, and the first by Expedition 74.
Learn more about International Space Station research and operations at:
-end-
Josh Finch / Jimi Russell
Headquarters, Washington
202-358-1100
joshua.a.finch@nasa.gov / james.j.russell@nasa.gov
Sandra Jones / Joseph Zakrzewski
Johnson Space Center, Houston
281-483-5111
sandra.p.jones@nasa.gov / joseph.a.zakrzewski@nasa.gov