
Feed aggregator
I Am Artemis: Dustin Gohmert
Listen to this audio excerpt from Dustin Gohmert, Orion Crew Survival System (OCSS) manager:
0:00 / 0:00
Your browser does not support the audio element.During NASA’s Artemis II mission around the Moon, the astronauts inside the Orion spacecraft will be wearing specialized pressure suits designed to protect them throughout their journey. At NASA’s Johnson Space Center in Houston, Dustin Gohmert leads the team responsible for these suits, known as the Orion Crew Survival System (OCSS).
“We work with the crew to say, ‘Here’s this design concept we have. How does this really work in the spaceflight environment?’” Gohmert said. “As we evolve the design, we take the crew’s input and we adapt the suit over time to take into account not only the desire we have for safety, but the real-world impacts that it has.”
The suits will protect astronauts on launch day, throughout high-risk parts of missions near the Moon, during the high-speed return to Earth, and in emergency situations if such events arise. The OCSS suits are engineered to sustain life for up to six days in the event of an emergency, and can provide the astronauts oxygen, hydration, food, and waste management needed on their way back to Earth.
Dustin Gohmert, Orion Crew Survival System (OCSS) manager, sits in the OCSS Lab at NASA’s Johnson Space Center in Houston.Credits: NASA/Rad Sinyak
“In an emergency, you’re essentially living in a personal spacecraft that’s only an inch bigger than your body,” Gohmert said. “That’s the reality of survival in space.”
Gohmert’s team in the Orion Crew Survival Systems Lab manages every phase of the suits, including processing, designing, qualifying, and testing them for the mission, as well as integrating them with the Orion spacecraft. Their work addresses engineering challenges, such as how much internal pressure the suit can safely maintain and for how long.
The team custom-builds each suit to fit the anatomy of the astronauts. Crew members undergo detailed sizing and multiple fit checks to ensure precision, and their feedback is a key part of the design evolution and refinement of the suit.
Orion Crew Survival System (OCSS) Manager Dustin Gohmert and his team perform a flight suit long duration fit check with Artemis II crew member Christina Koch in the OCSS Lab at NASA’s Johnson Space Center in Houston. Credit: NASA/Josh Valcarcel
After earning his bachelor’s in mechanical engineering from the University of Texas at San Antonio and his master’s in engineering from the University of Texas at Austin, Gohmert joined United Space Alliance before becoming a NASA civil servant. He worked through the end of the Space Shuttle Program and later transitioned to Orion. Working on the suit throughout his career has been both technically challenging and a deeply personal responsibility.
The weight of it is incredible; knowing the ultimate responsibility you and the team share in the safety of the crew and the mission. Every thought we have, every piece of paper we write — crew is the number one priority.dustin Gohmert
Orion Crew Survival Systems (OCSS) Manager
As NASA prepares to explore deep space with Artemis II, Gohmert’s role will play a part in safely sending crew members around the Moon and returning them home.
“I was born after the last Moon landing,” he said. “To actually be a part of the next round is kind of overwhelming. It’s awe-inspiring in every possible way.”
About the AuthorErika Peters Share Details Last Updated Jan 23, 2026 Related Terms Explore More 4 min read NASA Selects Participants to Track Artemis II Mission Article 1 day ago 5 min read NASA’s Artemis II Mission to Fly Legacy Keepsakes with Astronaut Crew Article 3 days ago 11 min read Últimos preparativos para la primera misión tripulada a la Luna con la campaña Artemis de la NASA Article 2 weeks ago Keep Exploring Discover More Topics From NASAMissions
Humans in Space
Climate Change
Solar System
Red, Green Light Show
Red, Green Light Show
A green and red aurora streams across Earth’s horizon above the city lights of Europe in this Jan. 19, 2026, photograph, which looks north across Italy toward Germany. The International Space Station was orbiting 262 miles above the Mediterranean Sea at approximately 10:02 p.m. local time when the image was captured.
Also known as the northern lights (aurora borealis) or southern lights (aurora australis), auroras are colorful, dynamic, and often visually delicate displays of an intricate dance of particles and magnetism between the Sun and Earth called space weather. When energetic particles from space collide with atoms and molecules in the atmosphere, they can cause the colorful glow that we call auroras.
Image credit: NASA/Chris Williams
Bone cancer therapy unexpectedly makes tumours less painful
Bone cancer therapy unexpectedly makes tumours less painful
NASA Finds Lunar Regolith Limits Meteorites as Source of Earth’s Water
4 min read
NASA Finds Lunar Regolith Limits Meteorites as Source of Earth’s Water A close-up view of a portion of a “relatively fresh” crater, looking southeast, as photographed during the third Apollo 15 lunar surface moonwalk. Credit: NASA
A new NASA study of its Apollo lunar soils clarifies the Moon’s record of meteorite impacts and timing of water delivery. These findings place upper bounds on how much water meteorites could have supplied later in Earth’s history.
Research has previously shown that meteorites may have been a significant source of Earth’s water as they bombarded our planet early in the solar system’s development. In a paper published Tuesday in the Proceedings to the National Academy of Sciences, researchers led by Tony Gargano, a postdoctoral fellow at NASA’s Johnson Space Center and the Lunar and Planetary Institute (LPI), both in Houston, used a novel method for analyzing the dusty debris that covers the Moon’s surface called regolith. They learned that even under generous assumptions, meteorite delivery since about four billion years ago could only have supplied a small fraction of Earth’s water.
The Moon serves as an ancient archive of the impact history the Earth-Moon system has experienced over billions of years. Where Earth’s dynamic crust and weather erase such records, lunar samples preserve them. The records don’t come without challenge, though. Traditional methods of studying regolith have relied on analyzing metal-loving elements. These elements can get muddied by repeated impacts on the Moon, making it harder to untangle and reconstruct what the original meteoroids contained.
Enter triple oxygen isotopes, high precision “fingerprints” that take advantage of the fact that oxygen, the dominant element by mass in rocks, is unaffected by impact or other external forces. The isotopes offer a clearer understanding of the composition of meteorites that impacted the Earth-Moon system. The oxygen-isotope measurements revealed that at least ~1% by mass of the regolith contained material from carbon-rich meteorites that were partially vaporized when they hit the Moon. Using the known properties of such meteorites allowed the team to calculate the amount of water that would have been carried within.
“The lunar regolith is one of the rare places we can still interpret a time-integrated record of what was hitting Earth’s neighborhood for billions of years,” said Gargano. “The oxygen-isotope fingerprint lets us pull an impactor signal out of a mixture that’s been melted, vaporized, and reworked countless times.”
The findings have implications for our understanding of water sources on Earth and the Moon. When scaled up by roughly 20 times to account for the substantially higher rate of impacts on Earth, the cumulative water shown in the model made up only a small percent of the water in Earth’s oceans. That makes it difficult to reconcile the hypothesis that late delivery of water-rich meteorites was the dominant source of Earth’s water.
“Our results don’t say meteorites delivered no water,” added co-author Justin Simon, a planetary scientist at NASA Johnson’s Astromaterials Research and Exploration Science Division. “They say the Moon’s long-term record makes it very hard for late meteorite delivery to be the dominant source of Earth’s oceans.”
For the Moon, the implied delivery since about 4 billion years ago is tiny on an Earth-ocean scale but is not insignificant for the Moon. The Moon’s accessible water inventory is concentrated in small, permanently shadowed regions at the North and South Poles. These are some of the coldest spots in the solar system and introduce unique opportunities for scientific discovery and potential resources for lunar exploration when NASA lands astronauts on the Moon through Artemis III and beyond.
The samples analyzed for this study came from parts of the Moon near the equator on the side of the Moon facing Earth, where all six Apollo missions landed. The rocks and dust collected more than 50 years ago continue to reveal new insights but are constrained to a small portion of the Moon. Samples delivered through Artemis will open the door for a new generation of discoveries for decades to come.
“I’m part of the next generation of Apollo scientists —people who didn’t fly the missions, but who were trained on the samples and the questions Apollo made possible,” said Gargano. “The value of the Moon is that it gives us ground truth: real, physical material we can measure in the lab and use to anchor what we infer from orbital data and telescopes. I can’t wait to see what the Artemis samples have to teach us and the next generation about our place in the solar system.”
For more information on NASA’s Astromaterials Research and Exploration Science Division, visit:
https://science.nasa.gov/astromaterials
Karen Fox / Molly Wasser
Headquarters, Washington
240-285-5155 / 240-419-1732
karen.c.fox@nasa.gov / molly.l.wasser@nasa.gov
Victoria Segovia
NASA’s Johnson Space Center
281-483-5111
victoria.segovia@nasa.gov
Read More
Facebook logo @NASASolarSystem @NASASolarSystem Instagram logo @NASASolarSystem Share Details Last Updated Jan 23, 2026 Related Terms Explore More 4 min read NASA Selects 2 Instruments for Artemis IV Lunar Surface Science
Article
2 months ago
2 min read Join NASA on Oct. 4 in Looking Up, Celebrating Moon
Article
4 months ago
1 min read Help Map the Moon’s Molten Flows!
Article
4 months ago
Keep Exploring Discover Related Topics
Missions
Humans in Space
Climate Change
Solar System
NASA Finds Lunar Regolith Limits Meteorites as Source of Earth’s Water
4 min read
NASA Finds Lunar Regolith Limits Meteorites as Source of Earth’s Water A close-up view of a portion of a “relatively fresh” crater, looking southeast, as photographed during the third Apollo 15 lunar surface moonwalk. Credit: NASAA new NASA study of its Apollo lunar soils clarifies the Moon’s record of meteorite impacts and timing of water delivery. These findings place upper bounds on how much water meteorites could have supplied later in Earth’s history.
Research has previously shown that meteorites may have been a significant source of Earth’s water as they bombarded our planet early in the solar system’s development. In a paper published Tuesday in the Proceedings to the National Academy of Sciences, researchers led by Tony Gargano, a postdoctoral fellow at NASA’s Johnson Space Center and the Lunar and Planetary Institute (LPI), both in Houston, used a novel method for analyzing the dusty debris that covers the Moon’s surface called regolith. They learned that even under generous assumptions, meteorite delivery since about four billion years ago could only have supplied a small fraction of Earth’s water.
The Moon serves as an ancient archive of the impact history the Earth-Moon system has experienced over billions of years. Where Earth’s dynamic crust and weather erase such records, lunar samples preserve them. The records don’t come without challenge, though. Traditional methods of studying regolith have relied on analyzing metal-loving elements. These elements can get muddied by repeated impacts on the Moon, making it harder to untangle and reconstruct what the original meteoroids contained.
Enter triple oxygen isotopes, high precision “fingerprints” that take advantage of the fact that oxygen, the dominant element by mass in rocks, is unaffected by impact or other external forces. The isotopes offer a clearer understanding of the composition of meteorites that impacted the Earth-Moon system. The oxygen-isotope measurements revealed that at least ~1% by mass of the regolith contained material from carbon-rich meteorites that were partially vaporized when they hit the Moon. Using the known properties of such meteorites allowed the team to calculate the amount of water that would have been carried within.
“The lunar regolith is one of the rare places we can still interpret a time-integrated record of what was hitting Earth’s neighborhood for billions of years,” said Gargano. “The oxygen-isotope fingerprint lets us pull an impactor signal out of a mixture that’s been melted, vaporized, and reworked countless times.”
The findings have implications for our understanding of water sources on Earth and the Moon. When scaled up by roughly 20 times to account for the substantially higher rate of impacts on Earth, the cumulative water shown in the model made up only a small percent of the water in Earth’s oceans. That makes it difficult to reconcile the hypothesis that late delivery of water-rich meteorites was the dominant source of Earth’s water.
“Our results don’t say meteorites delivered no water,” added co-author Justin Simon, a planetary scientist at NASA Johnson’s Astromaterials Research and Exploration Science Division. “They say the Moon’s long-term record makes it very hard for late meteorite delivery to be the dominant source of Earth’s oceans.”
For the Moon, the implied delivery since about 4 billion years ago is tiny on an Earth-ocean scale but is not insignificant for the Moon. The Moon’s accessible water inventory is concentrated in small, permanently shadowed regions at the North and South Poles. These are some of the coldest spots in the solar system and introduce unique opportunities for scientific discovery and potential resources for lunar exploration when NASA lands astronauts on the Moon through Artemis III and beyond.
The samples analyzed for this study came from parts of the Moon near the equator on the side of the Moon facing Earth, where all six Apollo missions landed. The rocks and dust collected more than 50 years ago continue to reveal new insights but are constrained to a small portion of the Moon. Samples delivered through Artemis will open the door for a new generation of discoveries for decades to come.
“I’m part of the next generation of Apollo scientists —people who didn’t fly the missions, but who were trained on the samples and the questions Apollo made possible,” said Gargano. “The value of the Moon is that it gives us ground truth: real, physical material we can measure in the lab and use to anchor what we infer from orbital data and telescopes. I can’t wait to see what the Artemis samples have to teach us and the next generation about our place in the solar system.”
For more information on NASA’s Astromaterials Research and Exploration Science Division, visit:
https://science.nasa.gov/astromaterials
Karen Fox / Molly Wasser
Headquarters, Washington
240-285-5155 / 240-419-1732
karen.c.fox@nasa.gov / molly.l.wasser@nasa.gov
Victoria Segovia
NASA’s Johnson Space Center
281-483-5111
victoria.segovia@nasa.gov
Read More
Facebook logo @NASASolarSystem @NASASolarSystem Instagram logo @NASASolarSystem Share Details Last Updated Jan 23, 2026 Related Terms Explore More 4 min read NASA Selects 2 Instruments for Artemis IV Lunar Surface Science
Article
2 months ago
2 min read Join NASA on Oct. 4 in Looking Up, Celebrating Moon
Article
4 months ago
1 min read Help Map the Moon’s Molten Flows!
Article
4 months ago
Keep Exploring Discover Related Topics
Missions
Humans in Space
Climate Change
Solar System
NASA’s Chandra Releases Deep Cut From Catalog of Cosmic Recordings
Like a recording artist who has had a long career, NASA’s Chandra X-ray Observatory has a “back catalog” of cosmic recordings that is impossible to replicate. To access these X-ray tracks, or observations, the ultimate compendium has been developed: the Chandra Source Catalog (CSC).
The CSC contains the X-ray data detected up to the end of 2020 by Chandra, the world’s premier X-ray telescope and one of NASA’s “Great Observatories.” The latest version of the CSC, known as CSC 2.1, contains over 400,000 unique compact and extended sources and over 1.3 million individual detections in X-ray light.
before after This image contains lower-, medium-, and higher-energy X-rays in red, green, and blue respectively. NASA/CXC/SAO; Image Processing: NASA/CXC/SAO/N. Wolk This image is the sum of 86 observations added together, representing over three million seconds of Chandra observing time. It spans just about 60 light-years across, which is a veritable pinprick on the entire sky. The underlying image contains lower-, medium-, and higher-energy X-rays in red, green, and blue respectively. The annotations on the image show where Chandra has detected over 3,300 individual sources in this field of view over a 22-year timeframe.NASA/CXC/SAO; Image Processing: NASA/CXC/SAO/N. Wolk beforeafter This image contains lower-, medium-, and higher-energy X-rays in red, green, and blue respectively. NASA/CXC/SAO; Image Processing: NASA/CXC/SAO/N. Wolk This image is the sum of 86 observations added together, representing over three million seconds of Chandra observing time. It spans just about 60 light-years across, which is a veritable pinprick on the entire sky. The underlying image contains lower-, medium-, and higher-energy X-rays in red, green, and blue respectively. The annotations on the image show where Chandra has detected over 3,300 individual sources in this field of view over a 22-year timeframe.NASA/CXC/SAO; Image Processing: NASA/CXC/SAO/N. Wolk before afterBefore and After
X-ray Images of Sagittarius A*1999 – 2021
CurtainToggle2-Up Image Details This image is the sum of 86 observations added together, representing over three million seconds of Chandra observing time. It spans just about 60 light-years across, which is a veritable pinprick on the entire sky. The underlying image contains lower-, medium-, and higher-energy X-rays in red, green, and blue respectively. The annotations on the image show where Chandra has detected over 3,300 individual sources in this field of view over a 22-year timeframe.Within the CSC, there is a wealth of information gleaned from the Chandra observations — from precise positions on the sky to information about the the X-ray energies detected. This allows scientists using other telescopes — both on the ground and in space including NASA’s James Webb and Hubble Space Telescopes — to combine this unique X-ray data with information from other types of light.
The richness of the Chandra Source Catalog is illustrated in a new image of the Galactic Center, the region around the supermassive black hole at the center of the Milky Way galaxy called Sagittarius A*. In this image that spans just about 60 light-years across, a veritable pinprick on the entire sky, Chandra has detected over 3,300 individual sources that emit X-rays. This image is the sum of 86 observations added together, representing over three million seconds of Chandra observing time.
Another new representation of the vast scope of the Chanda Source Catalog is found in a just-released sonification, the translation of astronomical data into sound. This sonification encompasses the new map that includes 22 years of Chandra observations across the sky, beginning from its launch through its observations in 2021. Because many X-ray sources have been observed multiple times over the life of the Chandra mission, this sonification represents those repeat X-ray sightings over time through different notes.
To view this video please enable JavaScript, and consider upgrading to a web browser that supports HTML5 video
Chandra Source Catalog Sonification.NASA/CXC/SAO/K.Arcand, SYSTEM Sounds (M. Russo, A. SantaguidaIn the view of the sky, projected in a similar way to how the Earth is often depicted in world maps, the core of the Milky Way is in the center and the Galactic plane is horizontal across the middle of the image. A circle appears at the position of each detection and the size of the circle is determined by the number of detections in that location over time. A year counter appears at the top of the frame. Since Chandra continues to be fully operational, the text changes to “… and beyond” after 2021 as the telescope continues to collect observations. During the video, a collage of images produced by Chandra fades in as a background. In the final frames of the video, thumbnail images representing the thousands of Chandra observations taken over the lifetime of the mission appear behind the sky map.
The most recent version of the Chandra Source Catalog can be accessed at https://cxc.cfa.harvard.edu/csc/
NASA’s Marshall Space Flight Center in Huntsville, Alabama, manages the Chandra program. The Smithsonian Astrophysical Observatory’s Chandra X-ray Center controls science operations from Cambridge, Massachusetts, and flight operations from Burlington, Massachusetts.
To learn more about Chandra, visit:
https://science.nasa.gov/chandra
Read more from NASA’s Chandra X-ray Observatory
Learn more about the Chandra X-ray Observatory and its mission here:
Visual DescriptionA very deep Chandra X-ray Observatory image around the Sagittarius A* supermassive black hole, located in the center of the Milky Way galaxy, is shown. The image is dominated by burnt orange, deep gold and blue hues, with a sprinkling of rich green. The area looks both intricate and full, with a dense population of tiny dots, along with larger clumps and diffuse areas and nebulous areas peeking through.
At the center of the image, there is a bright, lumpy area in pale gold showing the intense X-ray radiation emanating from the Sagittarius A* black hole. In the surrounding area, there are more smaller lumps layered throughout, feathering out to a large almost butterfly shape filling much of the screen. The image appears textured, like dozens of blue and orange glow worms are paused in their wriggling.
The image offers an unprecedented view of lobes of hot gas extending for a dozen light years on either side of the black hole. These lobes provide evidence for powerful eruptions occurring several times over the last ten thousand years. The image also contains several mysterious X-ray filaments, some of which may be huge magnetic structures interacting with streams of energetic electrons produced by rapidly spinning neutron stars. Such features are known as pulsar wind nebulas. Chandra has detected over 3,300 individual sources that emit X-rays in this field of view. This image is the sum of 86 observations added together, representing over three million seconds of Chandra observing time.
News Media ContactMegan Watzke
Chandra X-ray Center
Cambridge, Mass.
617-496-7998
mwatzke@cfa.harvard.edu
Joel Wallace
Marshall Space Flight Center, Huntsville, Alabama
256-544-0034
joel.w.wallace@nasa.gov
Why are winter storm forecasts all over the place?
A major winter storm will bring frigid cold and to tens of millions this weekend, but why is it so hard to pin down who will get snow, ice or rain?
Sea turtles may be more resilient to global warming than we thought
Sea turtles may be more resilient to global warming than we thought
AMS 2026 Hyperwall Schedule
2 min read
AMS 2026 Hyperwall Schedule106th American Meteorological Society (AMS) Meeting, January 25 – 29, 2026
Join NASA in the Exhibit Hall (Booth #323) for Hyperwall Storytelling by NASA experts. Full Hyperwall Agenda below.
MONDAY, JANUARY 26
6:05 – 6:20 PM Expanding Discovery from Earth Science Missions in SpaceHighlights of NASA Earth Science Missions to Advance Research, Data, Models, and Actionable Science Karen St. Germain 6:20 – 6:35 PM Revolutionizing Exploration of the Sun Kelly Korreck 6:40 – 6:55 PM Space Weather for Astronauts Jamie Favors
Gina DiBraccio 6:55 – 7:10 PM See Global Precipitation Without Writing Code George Huffman
TUESDAY, JANUARY 27
10:00 – 10:15 AM Removing Barriers to Utilizing NASA Research Data Paul Stackhouse 10:15 – 10:30 AM Earth Data to Action — What’s New with Earth Data? Jim O’Sullivan 10:30 – 10:45 AM Connecting Satellite Data to the One Health Approach Helena Chapman 3:00 – 3:15 PM New Solar Observations and Solar Wind Measurements from the SOLAR-1 mission Dimitris Vassiliadis 3:15 – 3:30 PM Aerosols Around the World Robert Levy 3:30 – 3:45 PM NASA’s Mission to the Sun Eric Christian 3:45 – 4:00 PM Expanding Discovery from Earth Science Missions in Space Julie Robinson 4:00 – 4:15 PM Explore Space Weather through the Community Coordinated Modeling Center and OpenSpace Elana Resnick 5:10 – 5:25 PM Think Fast, Think Sun: Exploring NASA’s HelioData for Space-Weather Awareness Alex Young 5:30 – 5:45 PM Early Career Research Program: Empowering Emerging Talent Yaitza Luna-CruzWEDNESDAY, JANUARY 28
10:00 – 10:15 AM NASA Space Weather Year of Launches Kelly Korreck 10:15 – 10:30 AM A Bird’s-Eye View of Air Pollution in Megacities Laura Judd 10:30 – 10:45 AM Next-Gen Operational Microwave Sounding Through 2050 Edward Kim 3:15 – 3:30 PM The Ultimate Collab: NASA and NOAA Space Weather Kelly Korreck & Yaireska (Yari) Collado-Vega 3:30 – 3:45 PM See Global Precipitation Without Writing Code George Huffman 3:45 – 4:00 PM From Investment to Impact: How LEO Innovations Benefit Users Jeremy Goldstein 4:00 – 4:15 PM Early Career Research Program: Empowering Emerging Talent Yaitza Luna-Cruz 4:15 – 4:30 PM Accelerating Health and Air Quality Solutions through Earth Observations John Haynes 5:10 – 5:25 PM The Interstellar Mapping and Acceleration Probe (IMAP) Eric ChristianTHURSDAY, JANUARY 29
10:00 – 10:15 AM Think Fast, Think Sun: Exploring NASA’s HelioData for Space-Weather Awareness Alex Young 10:30 – 10:45 AM From Investment to Impact: How LEO Innovations Benefit Users Jeremy GoldsteinAMS 2026 Hyperwall Schedule
2 min read
AMS 2026 Hyperwall Schedule106th American Meteorological Society (AMS) Meeting, January 25 – 29, 2026
Join NASA in the Exhibit Hall (Booth #323) for Hyperwall Storytelling by NASA experts. Full Hyperwall Agenda below.
MONDAY, JANUARY 26
6:05 – 6:20 PM Expanding Discovery from Earth Science Missions in SpaceHighlights of NASA Earth Science Missions to Advance Research, Data, Models, and Actionable Science Karen St. Germain 6:20 – 6:35 PM Revolutionizing Exploration of the Sun Kelly Korreck 6:40 – 6:55 PM Space Weather for Astronauts Jamie Favors
Gina DiBraccio 6:55 – 7:10 PM See Global Precipitation Without Writing Code George Huffman
TUESDAY, JANUARY 27
10:00 – 10:15 AM Removing Barriers to Utilizing NASA Research Data Paul Stackhouse 10:15 – 10:30 AM Earth Data to Action — What’s New with Earth Data? Jim O’Sullivan 10:30 – 10:45 AM Connecting Satellite Data to the One Health Approach Helena Chapman 3:00 – 3:15 PM New Solar Observations and Solar Wind Measurements from the SOLAR-1 mission Dimitris Vassiliadis 3:15 – 3:30 PM Aerosols Around the World Robert Levy 3:30 – 3:45 PM NASA’s Mission to the Sun Eric Christian 3:45 – 4:00 PM Expanding Discovery from Earth Science Missions in Space Julie Robinson 4:00 – 4:15 PM Explore Space Weather through the Community Coordinated Modeling Center and OpenSpace Elana Resnick 5:10 – 5:25 PM Think Fast, Think Sun: Exploring NASA’s HelioData for Space-Weather Awareness Alex Young 5:30 – 5:45 PM Early Career Research Program: Empowering Emerging Talent Yaitza Luna-CruzWEDNESDAY, JANUARY 28
10:00 – 10:15 AM NASA Space Weather Year of Launches Kelly Korreck 10:15 – 10:30 AM A Bird’s-Eye View of Air Pollution in Megacities Laura Judd 10:30 – 10:45 AM Next-Gen Operational Microwave Sounding Through 2050 Edward Kim 3:15 – 3:30 PM The Ultimate Collab: NASA and NOAA Space Weather Kelly Korreck & Yaireska (Yari) Collado-Vega 3:30 – 3:45 PM See Global Precipitation Without Writing Code George Huffman 3:45 – 4:00 PM From Investment to Impact: How LEO Innovations Benefit Users Jeremy Goldstein 4:00 – 4:15 PM Early Career Research Program: Empowering Emerging Talent Yaitza Luna-Cruz 4:15 – 4:30 PM Accelerating Health and Air Quality Solutions through Earth Observations John Haynes 5:10 – 5:25 PM The Interstellar Mapping and Acceleration Probe (IMAP) Eric ChristianTHURSDAY, JANUARY 29
10:00 – 10:15 AM Think Fast, Think Sun: Exploring NASA’s HelioData for Space-Weather Awareness Alex Young 10:30 – 10:45 AM From Investment to Impact: How LEO Innovations Benefit Users Jeremy GoldsteinWhy mining Greenland’s minerals is so challenging
Greenland’s mineral resources hold massive economic potential, but accessing them isn’t easy
Scientists create exotic new forms of ice never before seen on Earth
Ice has many forms beyond the mundane stuff produced in a standard freezer
Why singing, dancing and engaging with art is good for your health
Why singing, dancing and engaging with art is good for your health
Journey to Center of Milky Way With Upcoming NASA Roman Core Survey
At the heart of our own galaxy, there is a dense thicket of stars with a supermassive black hole at the very center. NASA’s Nancy Grace Roman Space Telescope will provide the deepest-ever view of this zone, revealing stars, planets, and unique objects that resist definition.
Based on the input of astronomers from across the globe, the Roman Space Telescope will spend three-quarters of its five-year primary mission conducting three revolutionary surveys of unprecedented scale. Their combined results will transform all areas of astronomy and answer longstanding questions about dark matter, dark energy, and planets outside of our solar system, called exoplanets.
That last theme will be addressed by the Galactic Bulge Time-Domain Survey, which will peer into the center of our galaxy to study the stars and exoplanets that make up the densely populated region around the center of the Milky Way, known as the galactic bulge.
This infographic describes the Galactic Bulge Time-Domain Survey that will be conducted by NASA’s Nancy Grace Roman Space Telescope. The smallest of Roman’s core surveys, this observation program will consist of repeat visits to six fields covering 1.7 square degrees total. One field will pierce the very center of the galaxy, and the others will be nearby — all in a region of the sky that will be visible to Roman for two 72-day stretches each spring and fall. The survey will mainly consist of six seasons (three early on, and three toward the end of Roman’s primary mission), during which Roman will view each field every 12 minutes. Roman will also view the six fields with less intensity at other times throughout the mission, allowing astronomers to detect microlensing events that can last for years, signaling the presence of isolated, stellar-mass black holes.Credit: NASA’s Goddard Space Flight Center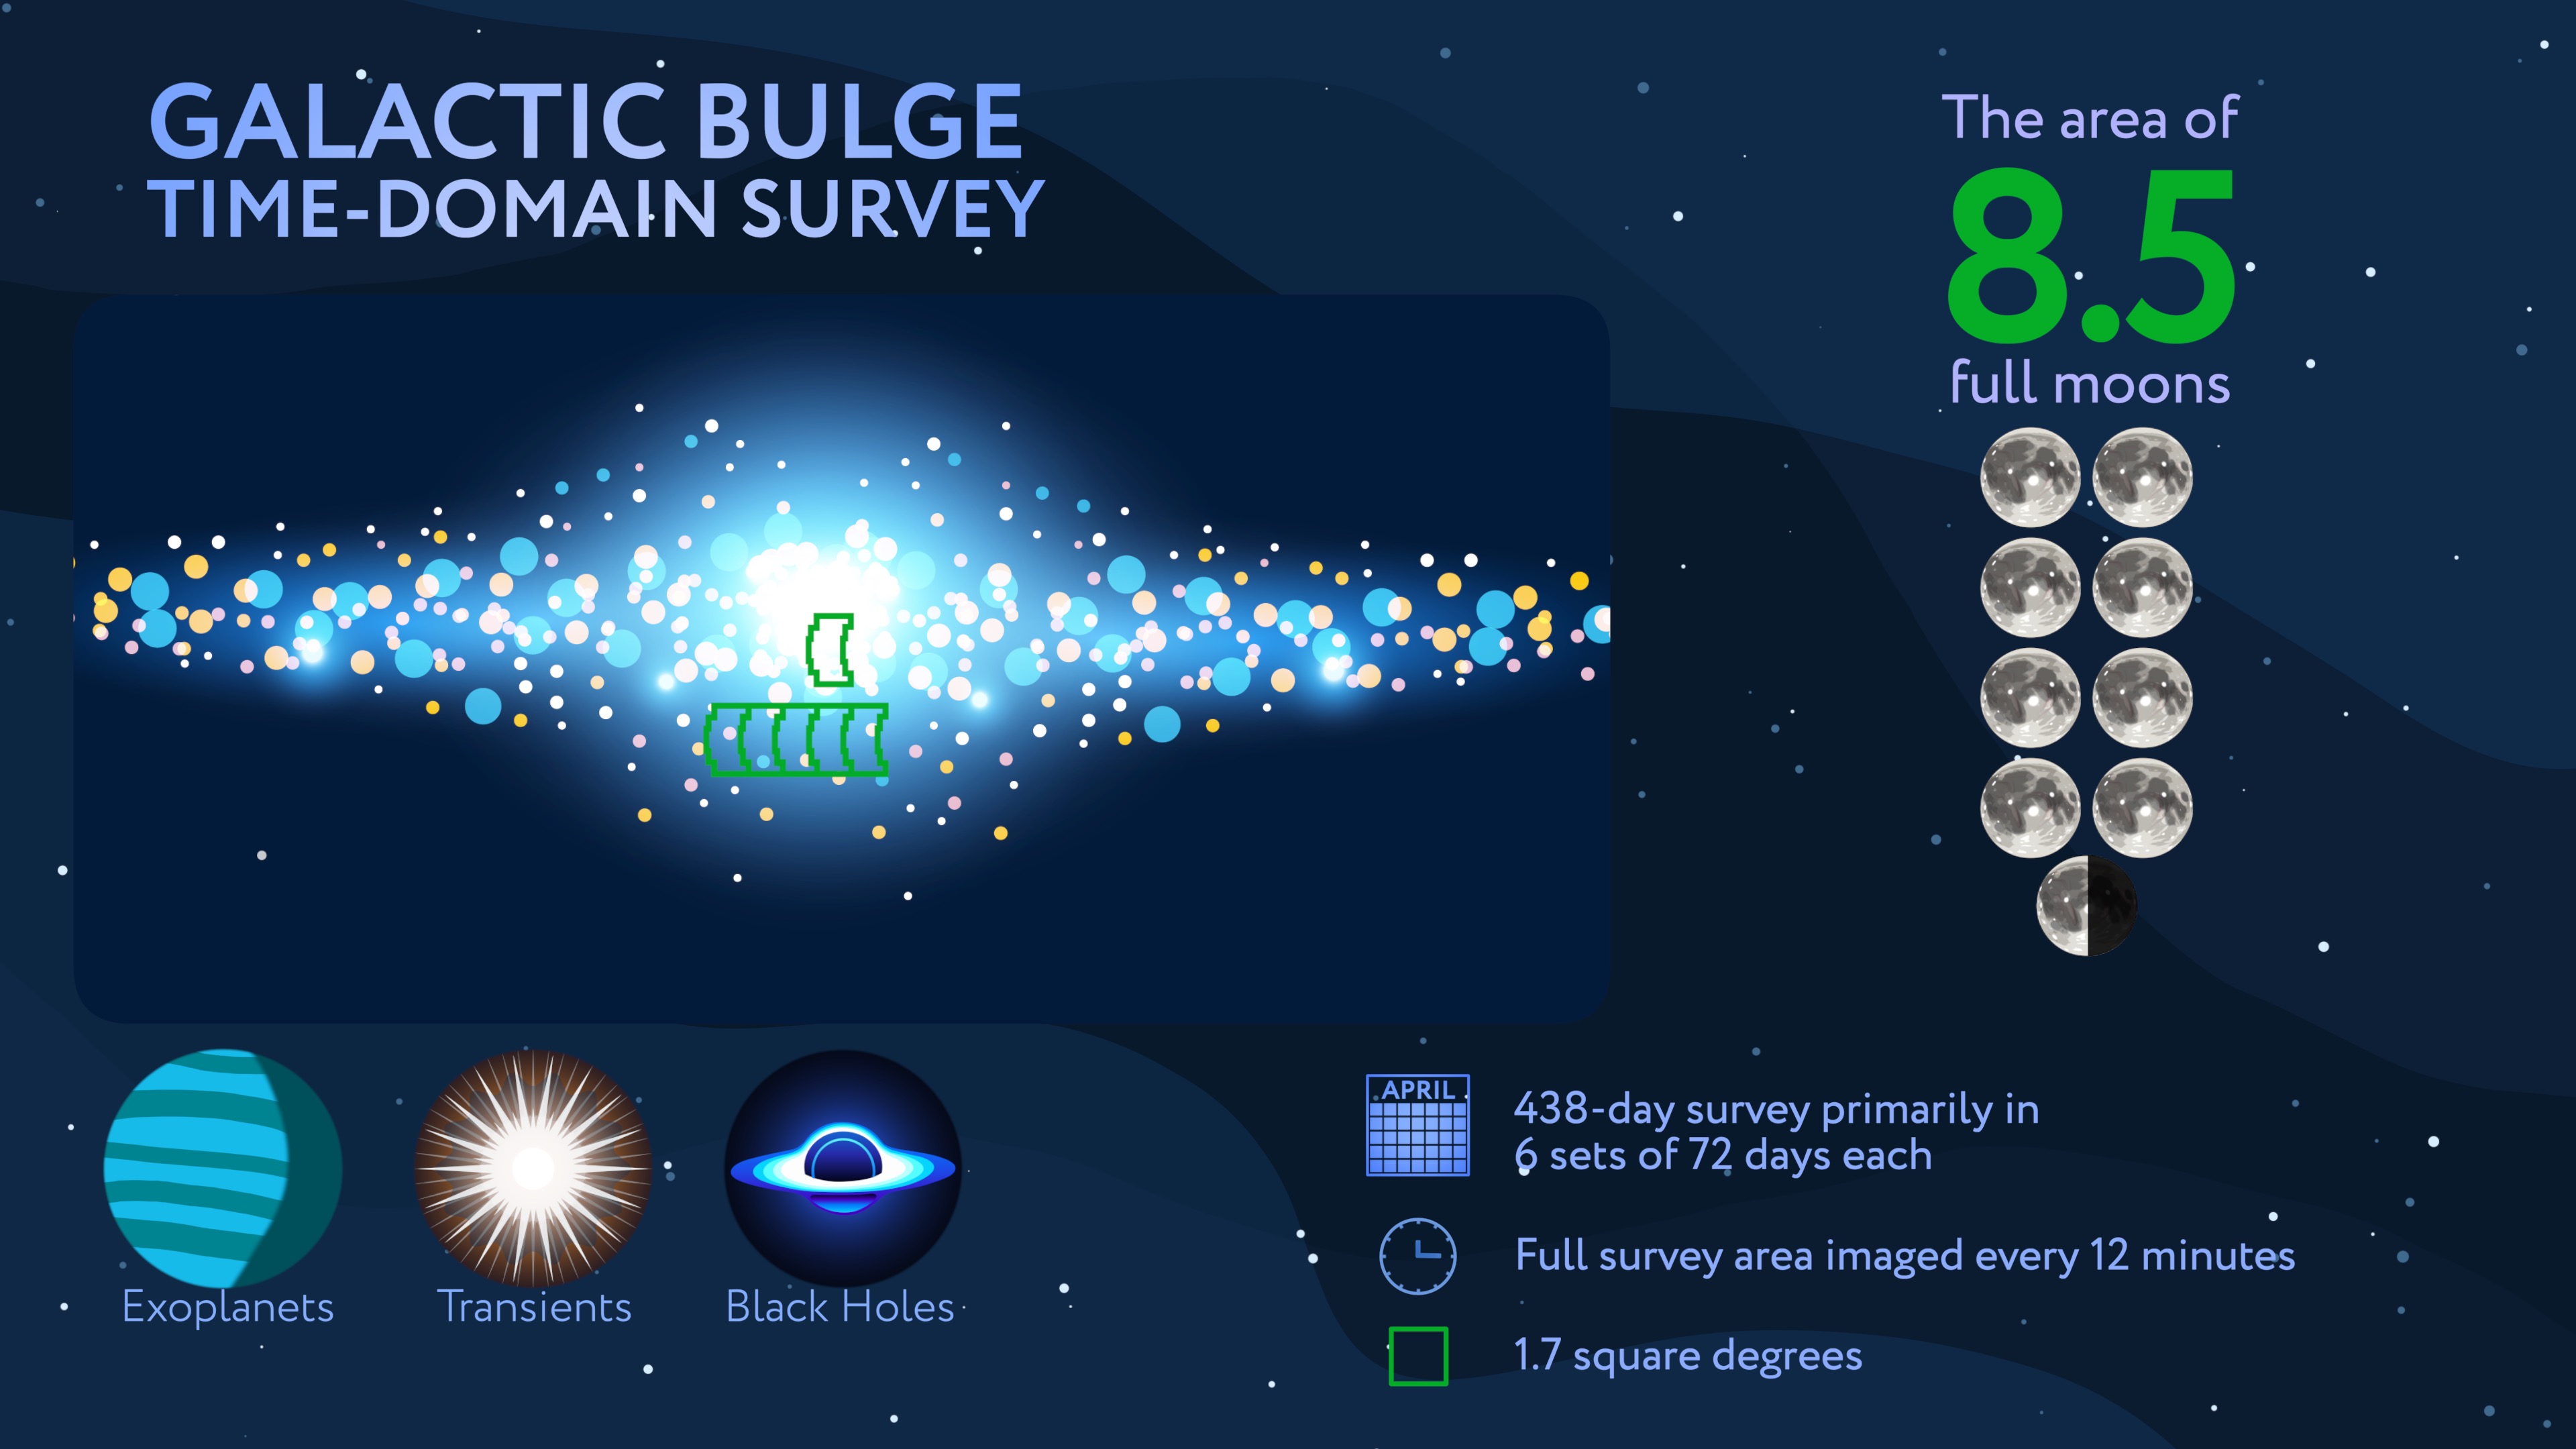
The survey will observe six patches of the galactic bulge, one pinpointing the center and five nearby, every 12 minutes during 438 days of total observing time. The observations will be separated into six “seasons” spread out over five years.
Spending so much time focusing on a relatively small area of the sky, the mission will be able to track changes in the motion and light of hundreds of millions of stars, and any planets that orbit them, over long periods — the “time-domain” aspect of the survey.
“This survey will be the highest precision, highest cadence, longest continuous observing baseline survey of our galactic bulge, where the highest density of stars in our galaxy reside,” said Jessie Christiansen of Caltech/IPAC, who served as co-chair of the committee that defined the Galactic Bulge Time-Domain Survey.
Exoplanet microlensing
Roman will use a method called microlensing to search for exoplanets, a technique that has so far identified just over 200 exoplanets, compared to more than 4,000 discovered with the transit method, out of the greater than 6,000 currently confirmed.
With this survey, scientists expect to see over 1,000 new planets orbiting other stars just using microlensing alone. This would increase the number of exoplanets identified using this method by more than fivefold.
A microlensing event is when light from a distant star in the background is warped slightly by a foreground object, like a star and its planet. This warping of light is called gravitational lensing, with the gravity from the star and planet bending the fabric of space that light is traveling through and focusing it like a magnifying glass.
This animation illustrates the concept of gravitational microlensing. When one star in the sky appears to pass nearly in front of another, the light rays of the background source star become bent due to the warped space-time around the foreground star. This star is then a virtual magnifying glass, amplifying the brightness of the background source star, so we refer to the foreground star as the lens star. If the lens star harbors a planetary system, then those planets can also act as lenses, each one producing a short deviation in the brightness of the source. Thus we discover the presence of exoplanets, and measure its mass and separation from its star.Credit: NASA’s Goddard Space Flight Center/CI Lab
While the transit method is very good at identifying exoplanets that orbit close to their star, the microlensing method can discover exoplanets that orbit farther away from their star, and in planetary systems farther from Earth than ever studied before. Roman will be versatile enough to see exoplanets dwelling from the inner edge of the habitable zone out to great distances from their stars, with a wide range of masses from planets smaller than Mars to the size of gas giants like Jupiter and Saturn. It may even discover “rogue planets” without host stars that either formed alone or were ejected from their host systems long ago.
“For the first time, we will have a big picture understanding of Earth and our solar system within the broader context of the exoplanet population of the Milky Way galaxy,” Christiansen said. “We still don’t know how common Earth-like planets are, and the Roman Galactic Bulge Time-Domain Survey will provide us with this answer.”
This survey will create a census of exoplanets for scientists to draw statistical conclusions from, revealing common patterns found in exoplanets and furthering our understanding of planetary formation and habitability.
One survey; lots of science
Because of the immense amount of observing time and subsequent data produced, the Galactic Bulge Time-Domain Survey will advance not only the field of exoplanet microlensing, but other areas of astronomy, too.
“There is an incredibly rich diversity of science that can be done with a high-precision, high-cadence survey like this one,” said Dan Huber of the University of Hawaii, the other survey co-chair.
The core survey was optimized not only for microlensing, but also to observe changes in brightness from small, fast blips to long-term trends. This property allows astronomers to discover and characterize transiting planets, red giant stars, stellar-mass black holes and other stellar remnants, and eclipsing binaries, and can lead to a deeper understanding about the physics of star formation and evolution.
A simulated image of Roman’s observations toward the center of our galaxy, spanning only less than 1 percent of the total area of Roman’s galactic bulge time-domain survey. The simulated stars were drawn from the Besançon Galactic Model.Credit: Matthew Penny (Louisiana State University)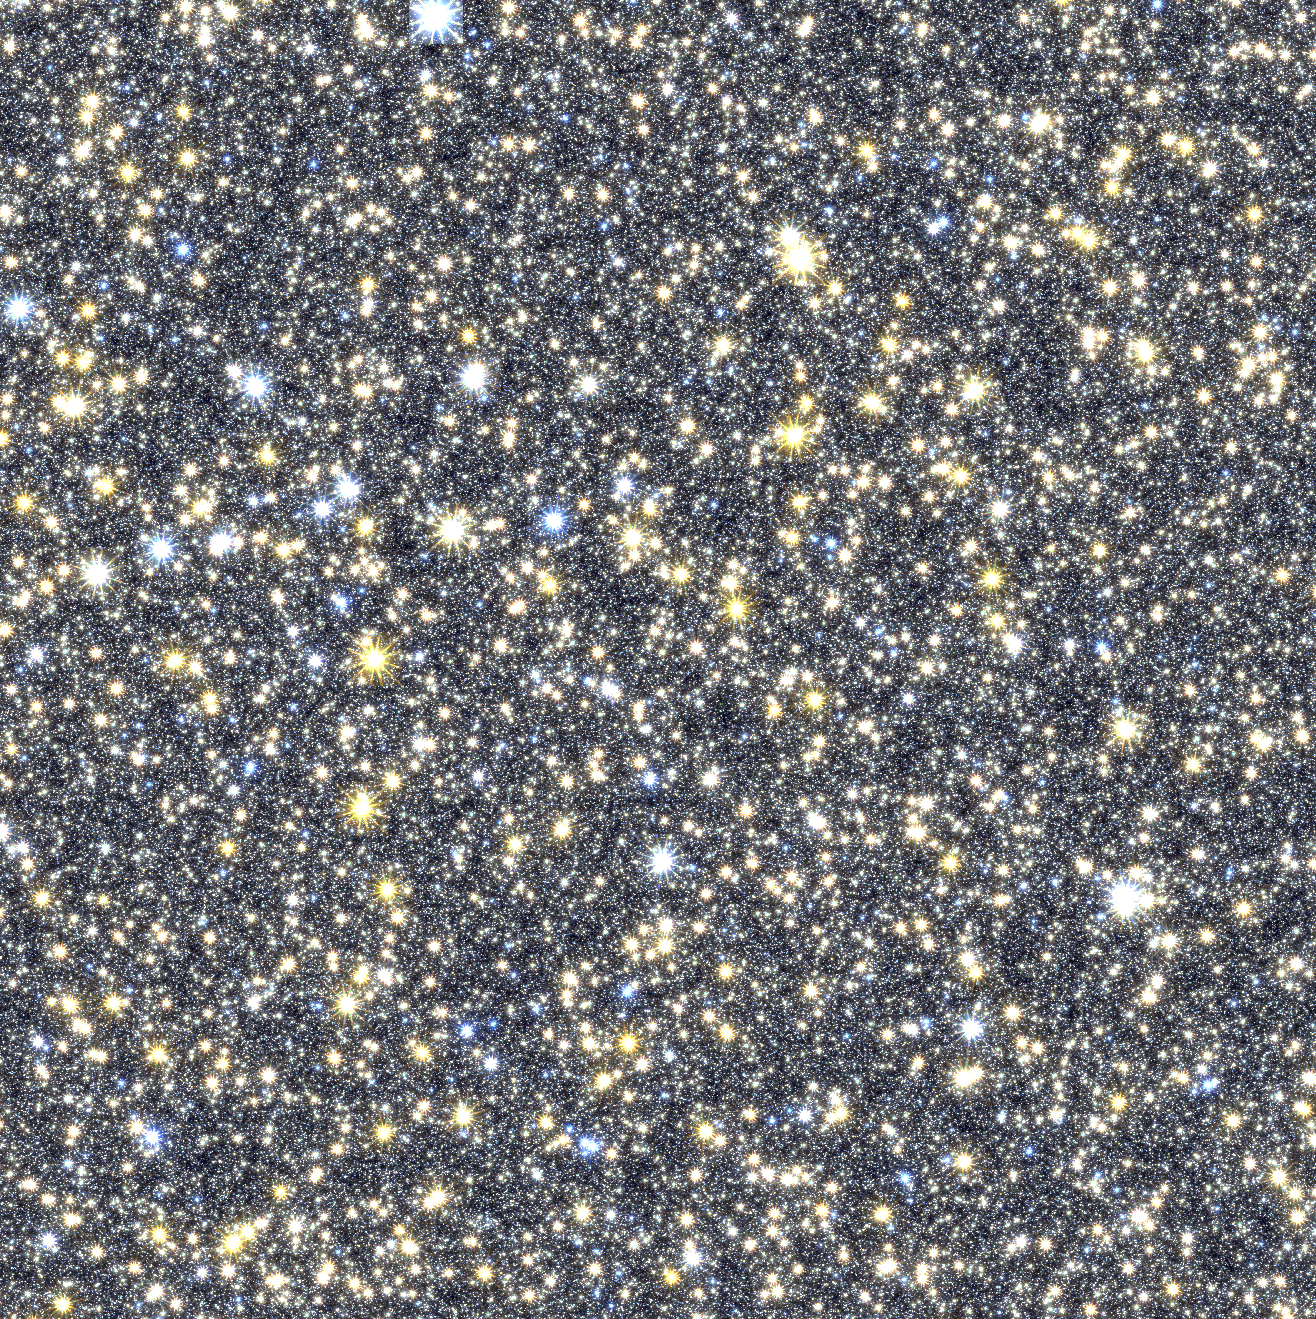
“The stars in the bulge and center of our galaxy are unique and not yet well understood,” Huber said. “The data from this survey will allow us to measure how old these stars are and how they fit into the formation history of our Milky Way galaxy.”
Roman’s observing strategy in the Galactic Bulge Time-Domain Survey, as well as the High-Latitude Time-Domain Survey and the High-Latitude Wide-Area Survey, will allow astronomers to maximize scientific output, all with one telescope.
Abundance of data to explore
Roman will observe hundreds of millions of stars every 12 minutes during the survey period, providing an unprecedented volume of data for astronomers to parse through.
The Roman Science Support Center at Caltech/IPAC in Pasadena, California, will be responsible for the high-level science data processing for the Galactic Bulge Time Domain Survey, including exoplanet microlensing and general community outreach for Roman exoplanet science. The Science Support Center’s monitoring of these stars has been automated to detect microlensing and variable events within the data. This helps scientists understand features like how frequently a star’s brightness is changing, or if there are planets lurking near the lensed stars, or other sources of variability. The number of stars and frequency of the observations make the Roman data an ideal dataset for finding such sources.
All Roman observations will be made publicly available after a short processing period. The mission is scheduled to launch no later than May 2027, with the team on track for launch in fall 2026.
The Nancy Grace Roman Space Telescope is managed at NASA’s Goddard Space Flight Center in Greenbelt, Maryland, with participation by NASA’s Jet Propulsion Laboratory in Southern California; Caltech/IPAC in Pasadena, California; the Space Telescope Science Institute in Baltimore; and a science team comprising scientists from various research institutions. The primary industrial partners are BAE Systems Inc. in Boulder, Colorado; L3Harris Technologies in Rochester, New York; and Teledyne Scientific & Imaging in Thousand Oaks, California.
By Isabel Swafford
Caltech/IPAC, Pasadena, Calif.
Media contact:
Claire Andreoli
NASA’s Goddard Space Flight Center, Greenbelt, Md.
301-286-1940