
NASA - Breaking News
JPL’s ‘Lucky Peanuts’ Before Artemis II Launch
NASA/JPL-Caltech Photojournal Navigation Downloads JPL’s ‘Lucky Peanuts’ Before Artemis II Launch
JPEG (67.09 MB)
Description
A container of “lucky peanuts” sits above workstations within the Space Flight Operations Facility at NASA’s Jet Propulsion Laboratory shortly before the launch of the Artemis II mission to the Moon on April 1, 2026. Eating peanuts before launches and other major mission events is a longstanding tradition at JPL.
The Space Flight Operations Facility operates the DSN, which comprises three complexes in Goldstone, California; Madrid, Spain; and Canberra, Australia. Each complex consists of several radio frequency antennas that communicate with dozens of spacecraft exploring the solar system in addition to the crewed Artemis II mission.
The DSN is managed by JPL for the agency’s Space Communications and Navigation program, which is located at NASA Headquarters within the Space Operations Mission Directorate. The DSN allows missions to track, send commands to, and receive scientific data from faraway spacecraft. JPL is managed by Caltech in Pasadena, California, for NASA.
For more information about Artemis II, visit: https://www.nasa.gov/mission/artemis-ii/
Keep Exploring Discover More Topics From Photojournal
Photojournal
Search Photojournal
Photojournal’s Latest Content
Feedback
Snow in the Shadow of the Andes
- Earth
- Earth Observatory
- Image of the Day
- EO Explorer
- Topics
- More Content
- About
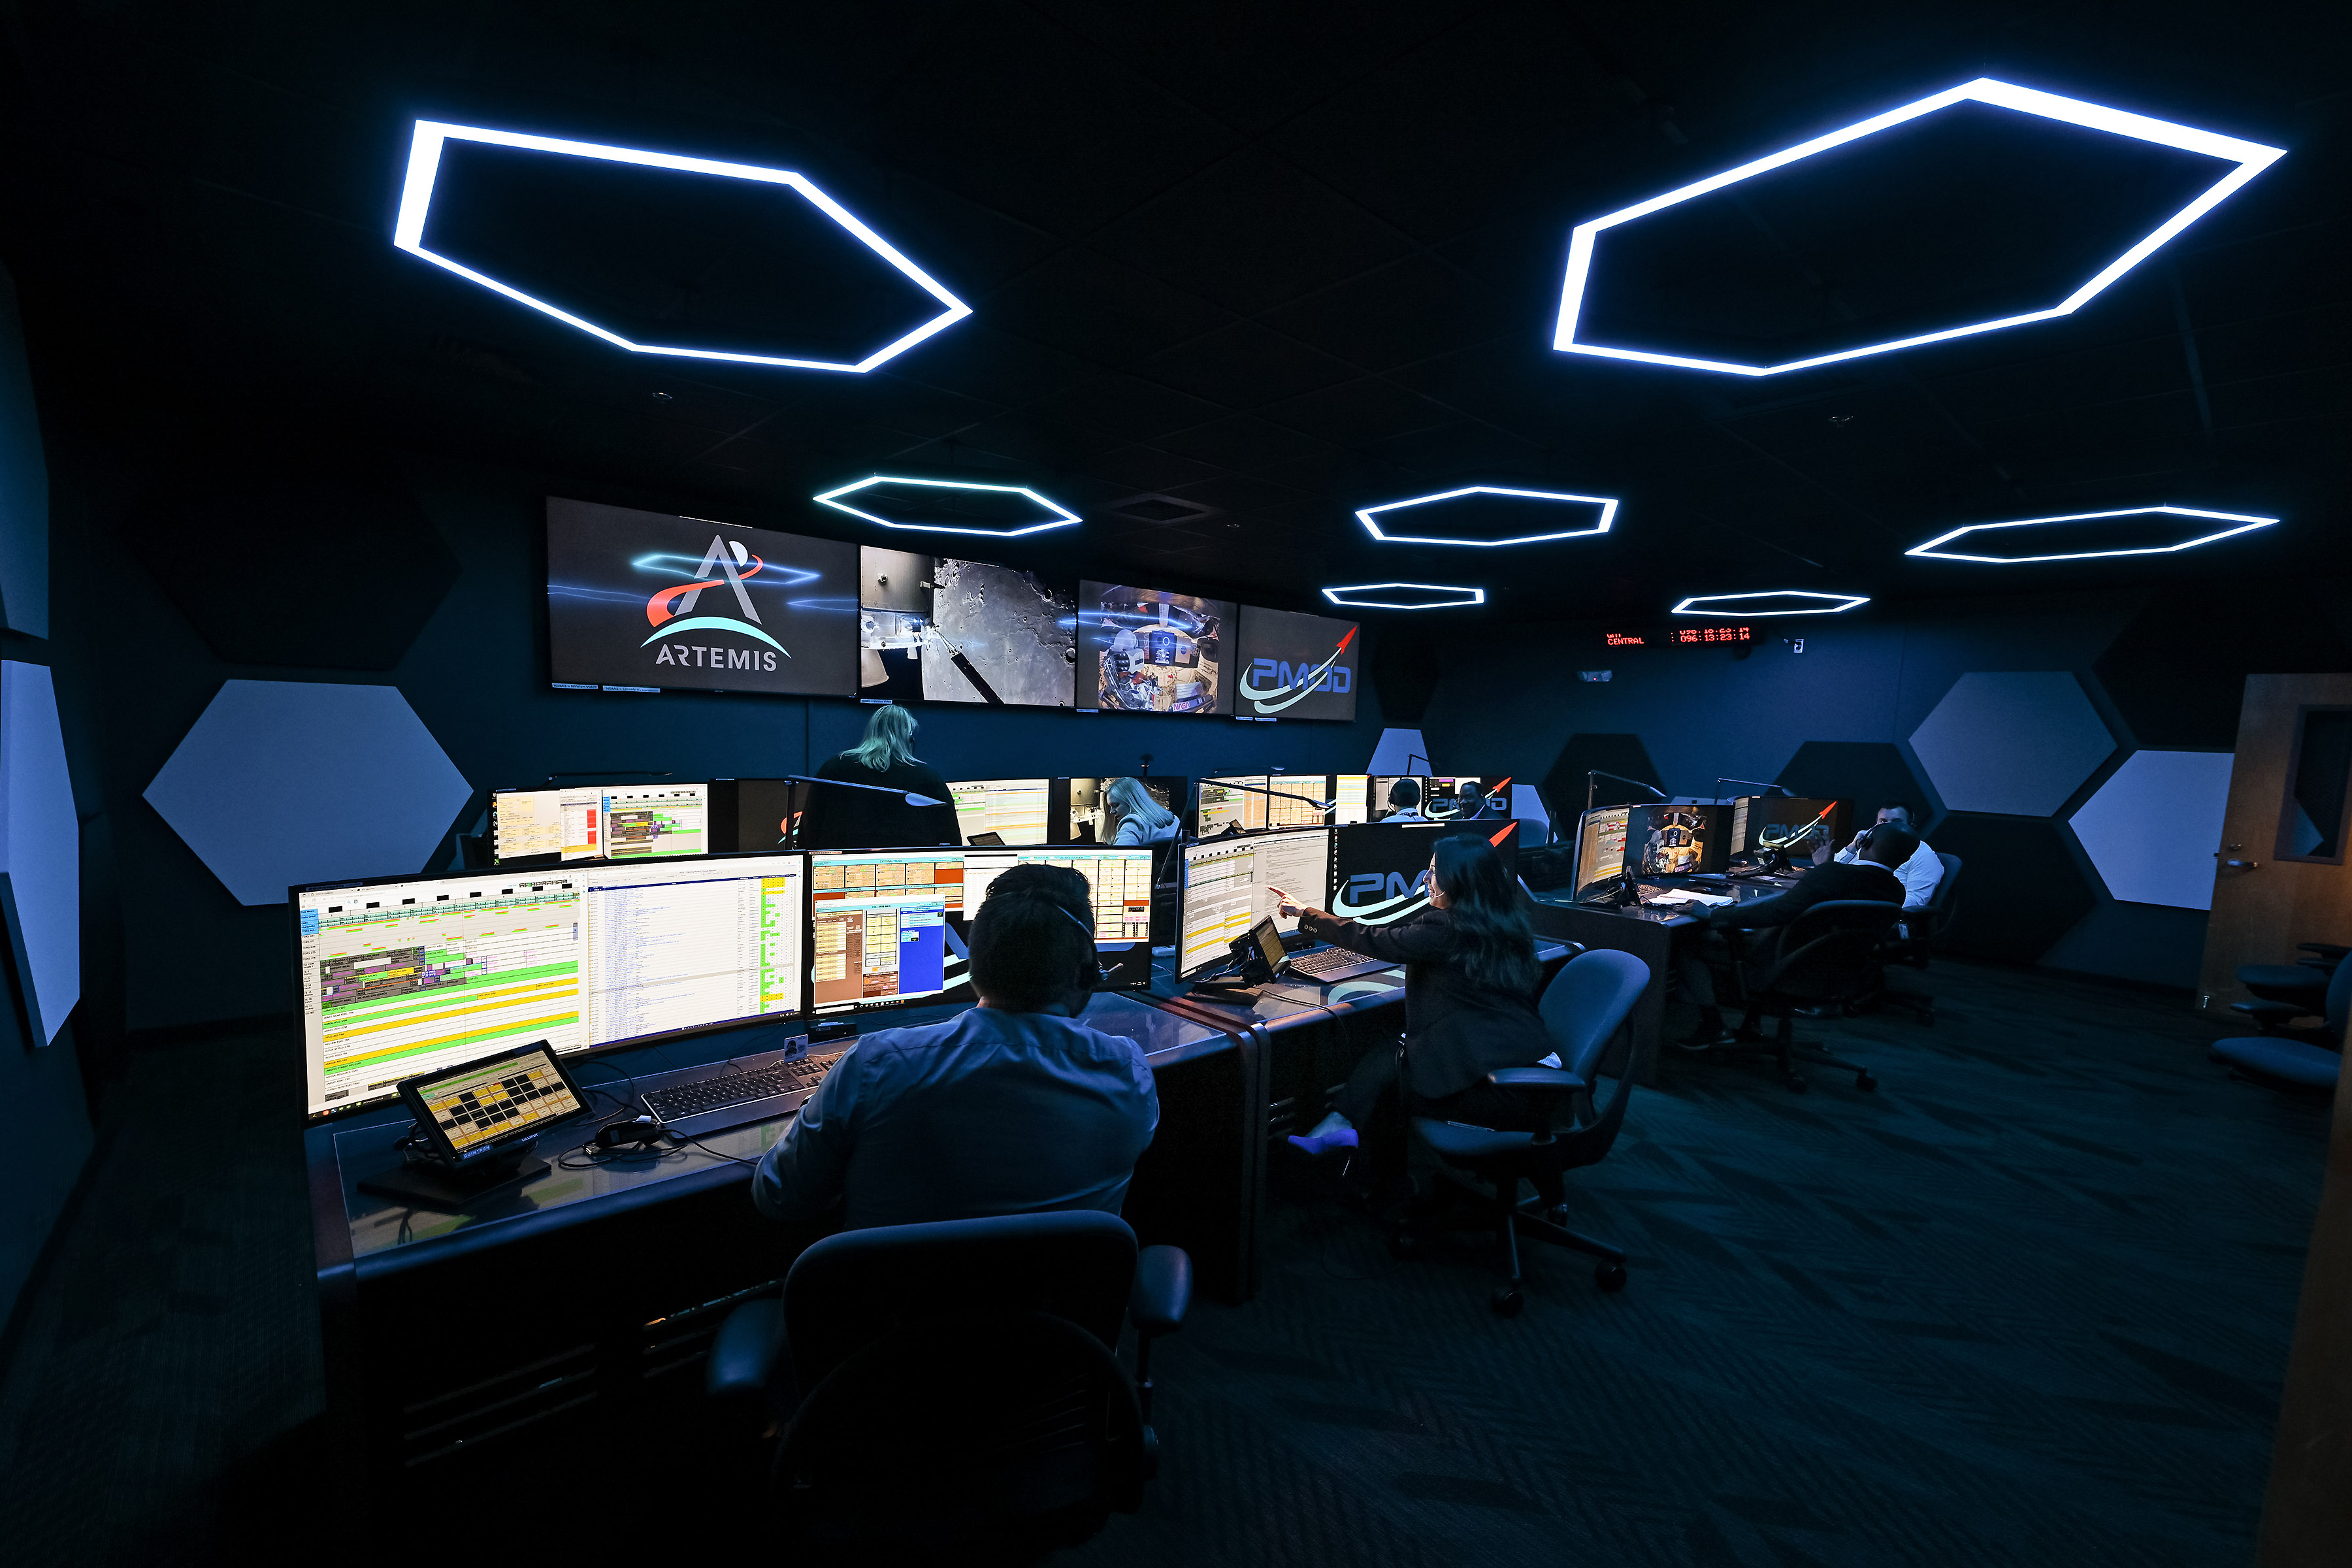
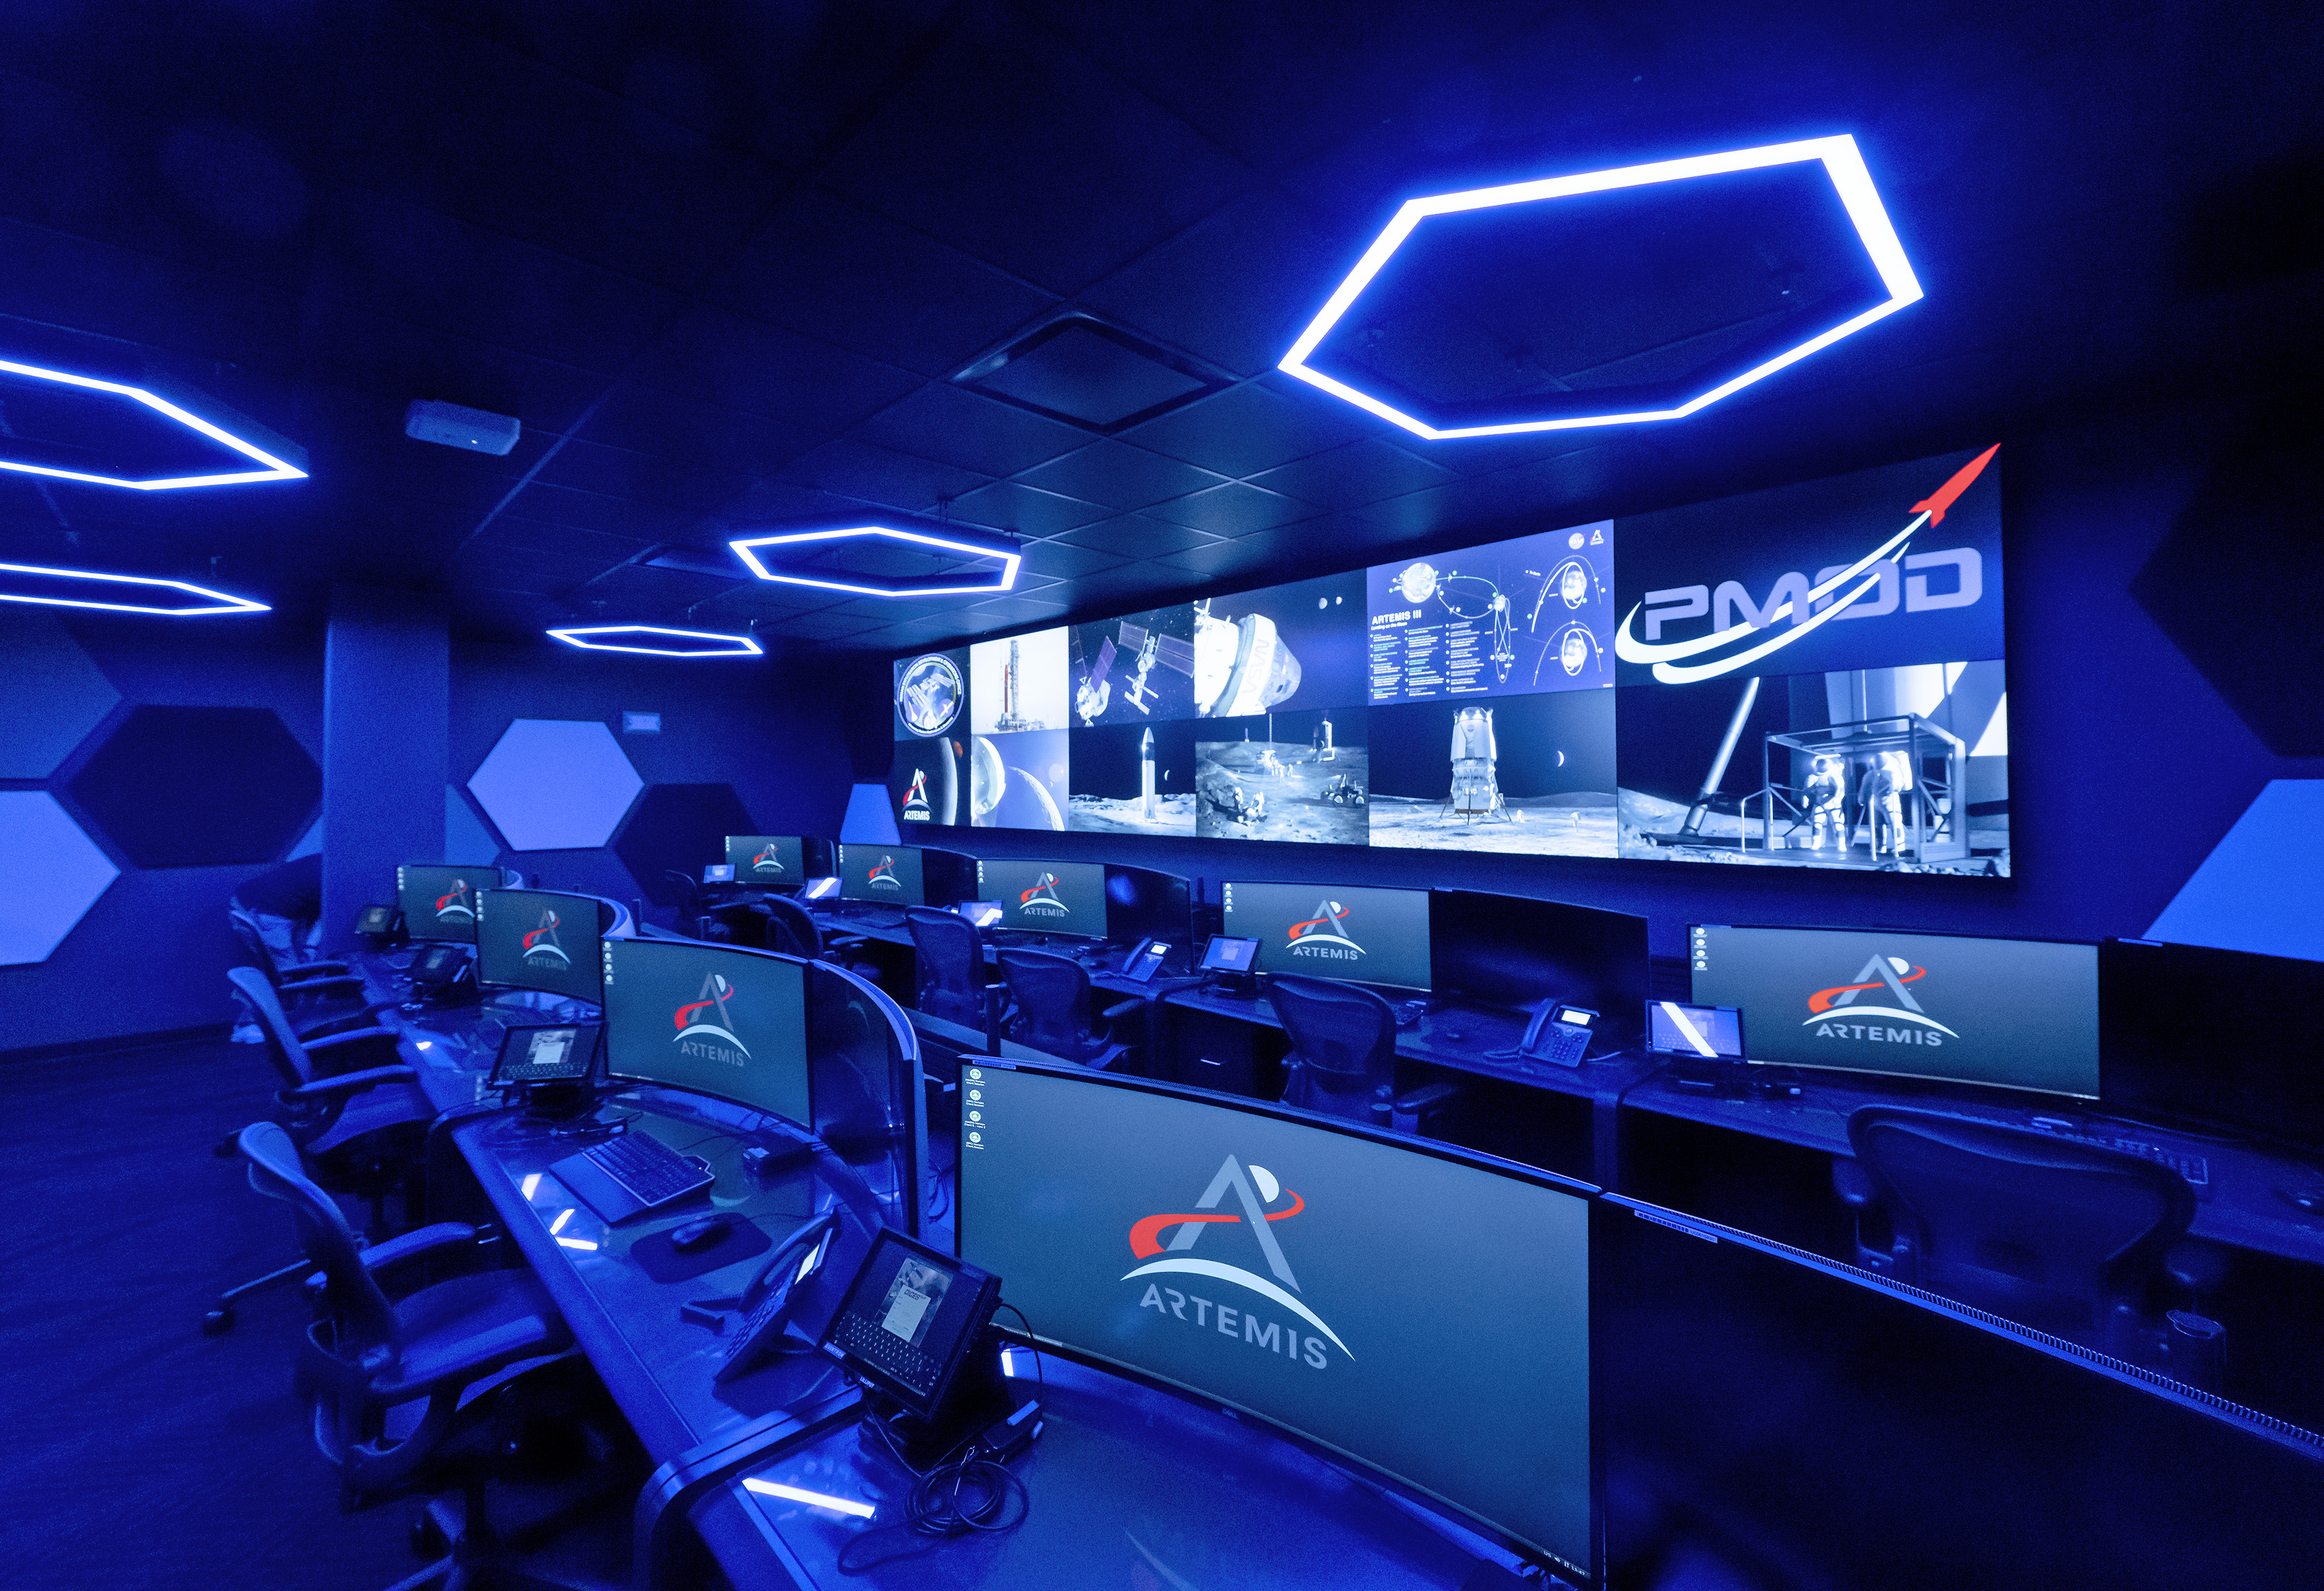
Twin NASA Control Rooms Support Artemis Safety, Success
Twin control rooms at NASA’s Marshall Space Flight Center in Huntsville, Alabama, are actively supporting real-time mission operations in lunar orbit as part of the agency’s Artemis II mission, helping ensure astronaut safety and mission success as the crew prepares to return to Earth Friday, April 10.
The LUCA (Lunar Utilization Control Area) and LESA (Lander Engineering Support Area) rooms are part of the Huntsville Operations Support Center at NASA Marshall. While the spaces look nearly identical, the two are more like fraternal twins in their focus areas: LUCA primarily supports Artemis science operations, while LESA will provide engineering support for landing astronauts on the Moon.
LUCA (Lunar Utilization Control Area) at NASA Marshall is specially designed to support a wide variety of science operations on and around the Moon – and beyond. Engineers in the LUCA monitored operations for the Lunar Node-1 experiment, an autonomous navigation payload that was part of the first NASA Commercial Lunar Payload Services (CLPS) launch on Intuitive Machines’ Nova-C lunar lander in 2024. NASA Marshall flight controllers will use the LUCA again for Artemis II to monitor science operations.NASA/Charles Beason“The Huntsville Operations Support Center at NASA Marshall can be adapted to the needs of the agency’s missions, and LUCA and LESA are some of our newest configurable control rooms for the Artemis campaign,” said Harish Chandranath, Payload and Mission Operations Division Human Landing Systems project lead at Marshall. “In addition to supporting Artemis, our Huntsville Operations Support Center teams also support the Commercial Crew Program, the SLS (Space Launch System) rocket, and International Space Station science operations.”
Support center services include work to manage spacecraft command and telemetry, local and remote voice services for international connections, live and recorded video services, and a telescience resource kit – special software that makes sure two computers far apart can communicate without missing any information and without human help. All Huntsville Operations Support Center services can be tied into both the LUCA and LESA rooms, giving operators the capability to use data and communicate with scientists and experts around the world.
Support engineers will use the LESA (Lander Engineering Support Area) at NASA Marshall to monitor human landing system (HLS) for the first crewed Artemis missions.NASA/Charles BeasonDuring Artemis II, teams in LUCA are supporting first-of-their-kind science operations designed to better understand the effects of deep space – such as microgravity and radiation – on crew physiology, immune response, and performance. The data gathered during the mission will inform future crewed flights to the Moon.
Meanwhile, teams in LESA are observing Artemis II mission operations in real time, which is a critical opportunity to refine processes and prepare for future crewed landings on the Moon’s surface. For Artemis missions, members of NASA’s Human Landing System Mission Insight Support Team – including engineers, safety leads, flight operations experts, and technical authorities – will operate from LESA to monitor lander systems and support key decision-making.
Through the Artemis program, NASA is returning humans to the Moon for scientific discovery, economic opportunity, and to build the foundation for the first crewed missions to Mars – for the benefit of all.
To learn more about the Artemis program, visit:
Share Details Last Updated Apr 08, 2026 EditorLee MohonContactCorinne M. Beckingercorinne.m.beckinger@nasa.gov Related Terms Keep Exploring Discover More Topics From NASAArtemis II
Human Landing System
Marshall Space Flight Center
Artemis
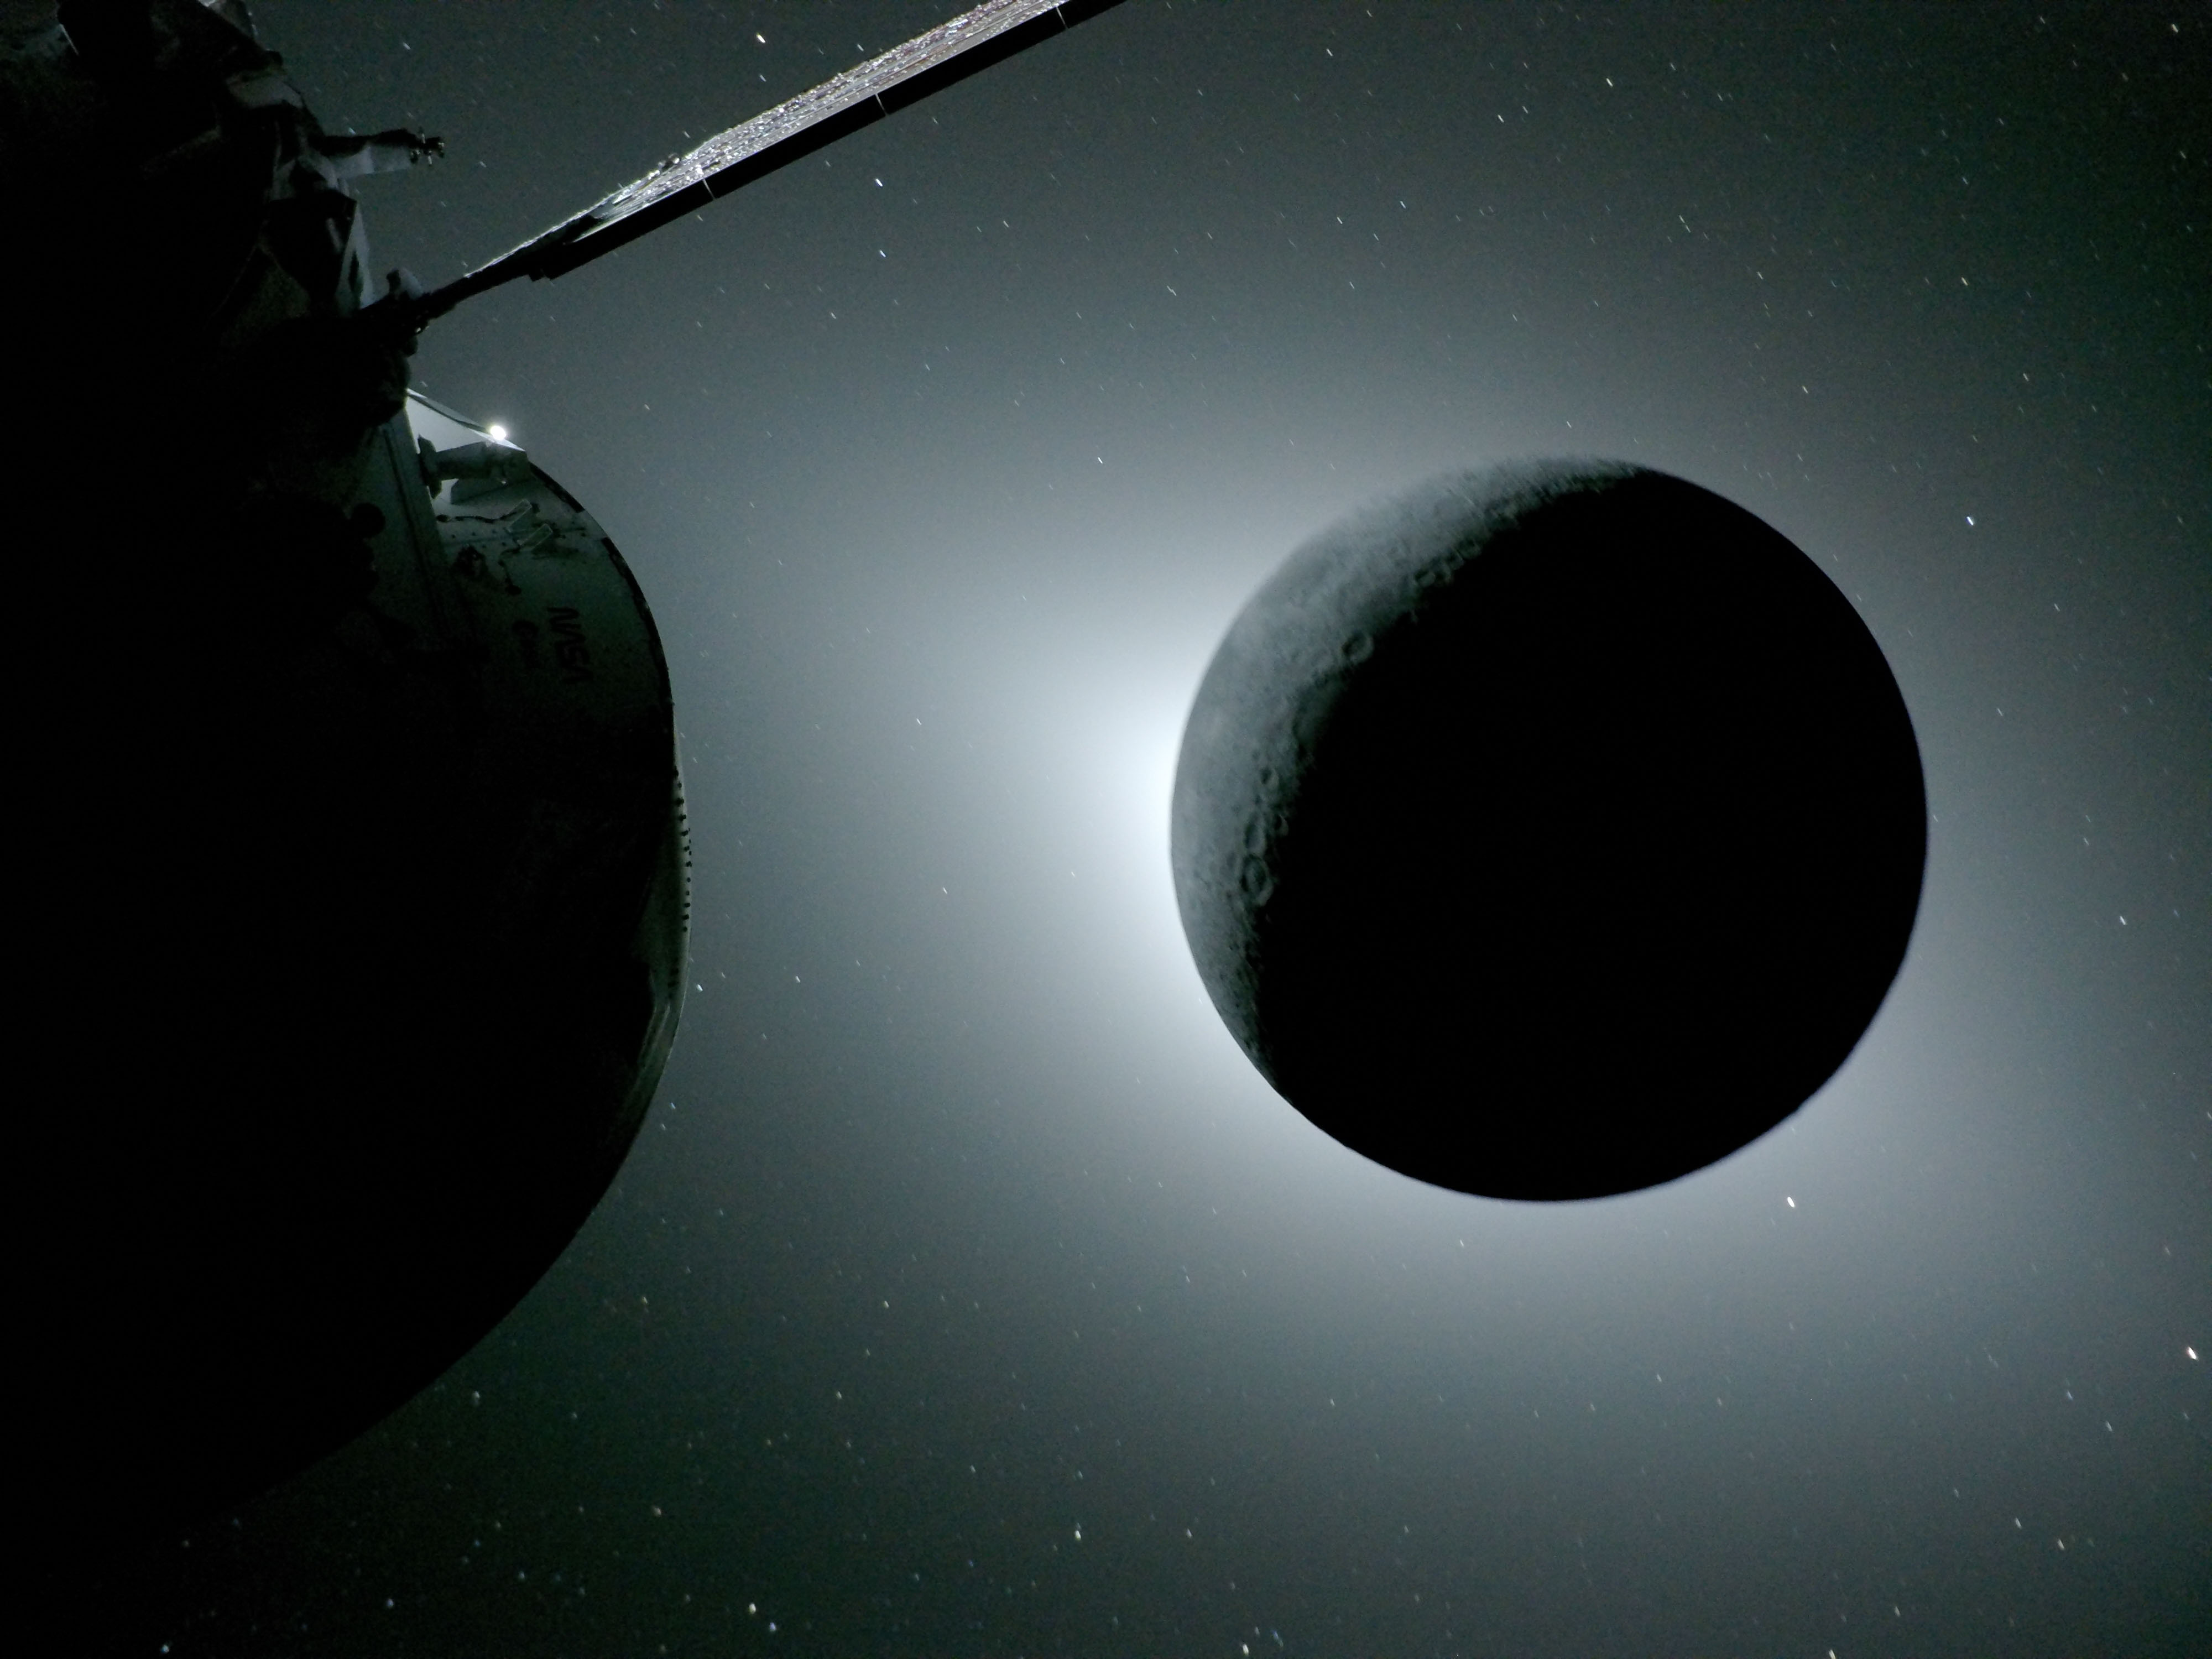
Solar Eclipse of the Heart
The Moon, seen here backlit by the Sun during a solar eclipse on April 6, 2026, is photographed by one of the cameras on the Orion spacecraft’s solar array wings. During lunar flyby, the Artemis II astronauts observed a solar eclipse that only they could see due to their unique position.
See more photos from the Artemis II mission.
Image credit: NASA
A Volcanic Medley Near Mammoth Lakes
- Earth
- Earth Observatory
- Image of the Day
- EO Explorer
- Topics
- More Content
- About
Celestial Wonders in Leo
NASA, ESA and the Hubble Heritage (STScI/AURA)-ESA/Hubble Collaboration; Acknowledgment: Davide De Martin and Robert Gendler
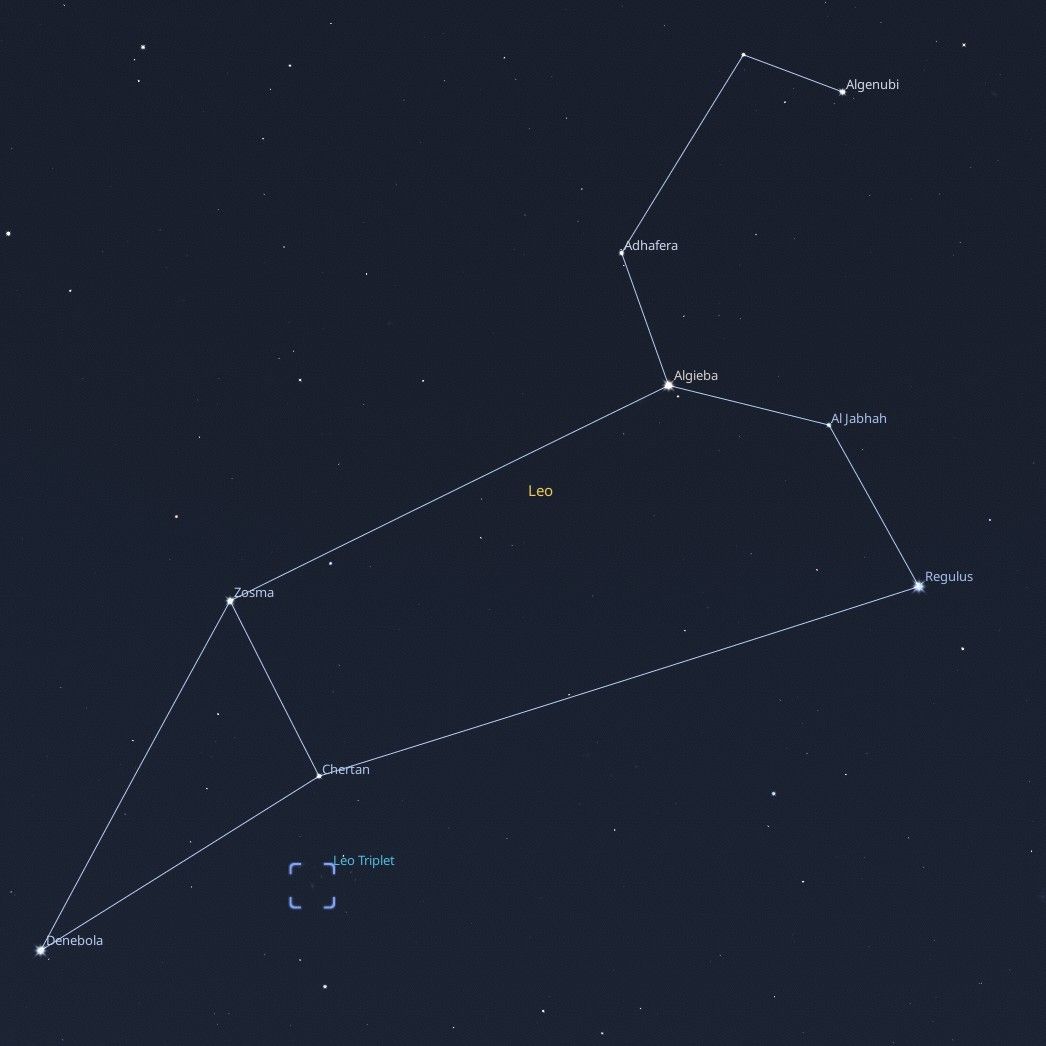
Leo is a prominent sight for stargazers in April. Its famous sickle, punctuated by the bright star Regulus, draws many a beginning stargazer’s eyes, inviting deeper looks into some of Leo’s celestial delights, including a great double star and a famous galactic trio.
The constellation, Leo. You can find this constellation in the springtime skies. StellariumLeo’s distinctive forward sickle, or “reverse question mark,” is easy to spot as it climbs the skies in the southeast after sunset. If you are having a difficult time spotting the sickle, look for bright Sirius and Procyon in Canis Major and Canis Minor. Complete a triangle by drawing two lines to the east, joining at the bright star Regulus, the “period” in the reverse question mark. Trailing them is a trio of bright stars forming an isosceles triangle, the brightest star in that formation named Denebola. Connecting these two patterns together forms the constellation of Leo the Lion, with the forward-facing sickle being the lion’s head and mane, and the rear triangle its hindquarters. Can you see this mighty feline? It might help to imagine Leo proudly sitting up and staring straight ahead, like a celestial Sphinx. To help find these objects, you can use online tools like Stellarium Web.
If you peer deeper into Leo with a small telescope or binoculars, you’ll find a notable double star! Look in the sickle of Leo for its second-brightest star, Algieba, also called Gamma Leonis. This star splits into two bright yellow stars even with a small magnification. You can make this “split” with binoculars, but it’s more apparent with a telescope. Compare the color and intensity of these two stars: do you notice any differences? There are other multiple-star systems in Leo; spend a few minutes scanning with your instrument of choice, and see what you discover.
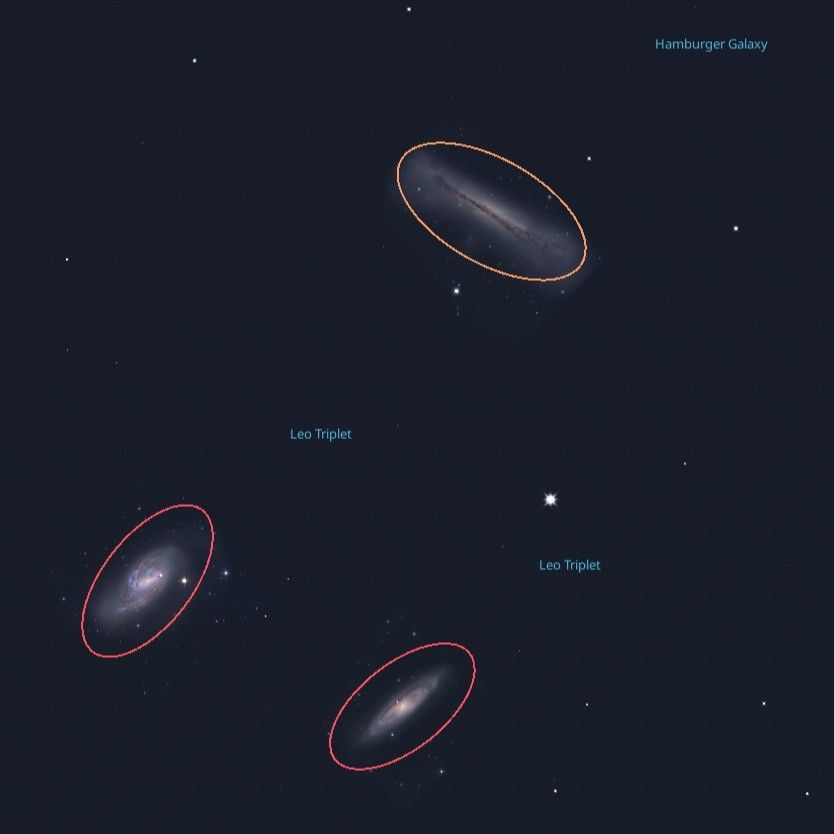
The Leo Triplet – three galaxies that appear to be close together under the star Chertan in the Leo constellation. StellariumOne of the most famous sights in Leo is the “Leo Triplet”: three galaxies that appear to be close together. They are indeed gravitationally bound to one another, around 30 million light-years away! You’ll need a telescope to spot them, and use an eyepiece with a wide field of view to see all three galaxies at once! Look below the star Chertan to find galaxies M65, M66, and NGC 3628 – The Hamburger Galaxy. Compare and contrast the appearance of each galaxy – while they are all spiral galaxies, each one is tilted at different angles to our point of view! Do they all look like spiral galaxies to you?
April is Citizen Science Month, and there are some fun Leo-related activities you can participate in! If you enjoy
comparing the Triplets, the Galaxy Zoo project could use your eyes to help classify different galaxies from sky survey data! Looking at Leo itself can even help measure light pollution: the Globe at Night project uses Leo as their target constellation for sky quality observations from the Northern Hemisphere. Find and participate in many more NASA community science programs at NASA Citizen Science. Happy observing!
Originally posted by Dave Prosper: April 2021
Last Updated by Kat Troche: April 2026
NASA’s Artemis II Crew Beams Official Moon Flyby Photos to Earth
Editor’s note: Some photo captions were updated on April 8, 2026, to reflect ongoing scientific observations and discussion about the images.
The first flyby images of the Moon captured by NASA’s Artemis II astronauts during their historic test flight reveal some regions no human has seen, including a rare in-space solar eclipse. Released Tuesday, astronauts captured the images April 6 during the mission’s seven-hour flyby of the lunar far side, showing humanity’s return to the Moon’s vicinity and opening a trove of scientific data.
NASA astronauts Reid Wiseman, Victor Glover, Christina Koch, and CSA (Canadian Space Agency) astronaut Jeremy Hansen, have used a fleet of cameras to take thousands of photos. The agency released several images, with more expected in the coming days as the crew members are more than halfway through their journey and now headed home toward Earth.
“Our four Artemis II astronauts — Reid, Victor, Christina, and Jeremy — took humanity on an incredible journey around the Moon and brought back images so exquisite and brimming with science, they will inspire generations to come,” said Dr. Nicky Fox, associate administrator, Science Mission Directorate, NASA Headquarters in Washington.
During the lunar flyby, the crew documented impact craters, ancient lava flows, and surface fractures that will help scientists study the Moon’s geologic evolution. They monitored color, brightness, and texture differences across the terrain, observed an earthset and earthrise, and captured solar‑eclipse views of the Sun’s corona. The crew also reported six meteoroid impact flashes on the darkened lunar surface.
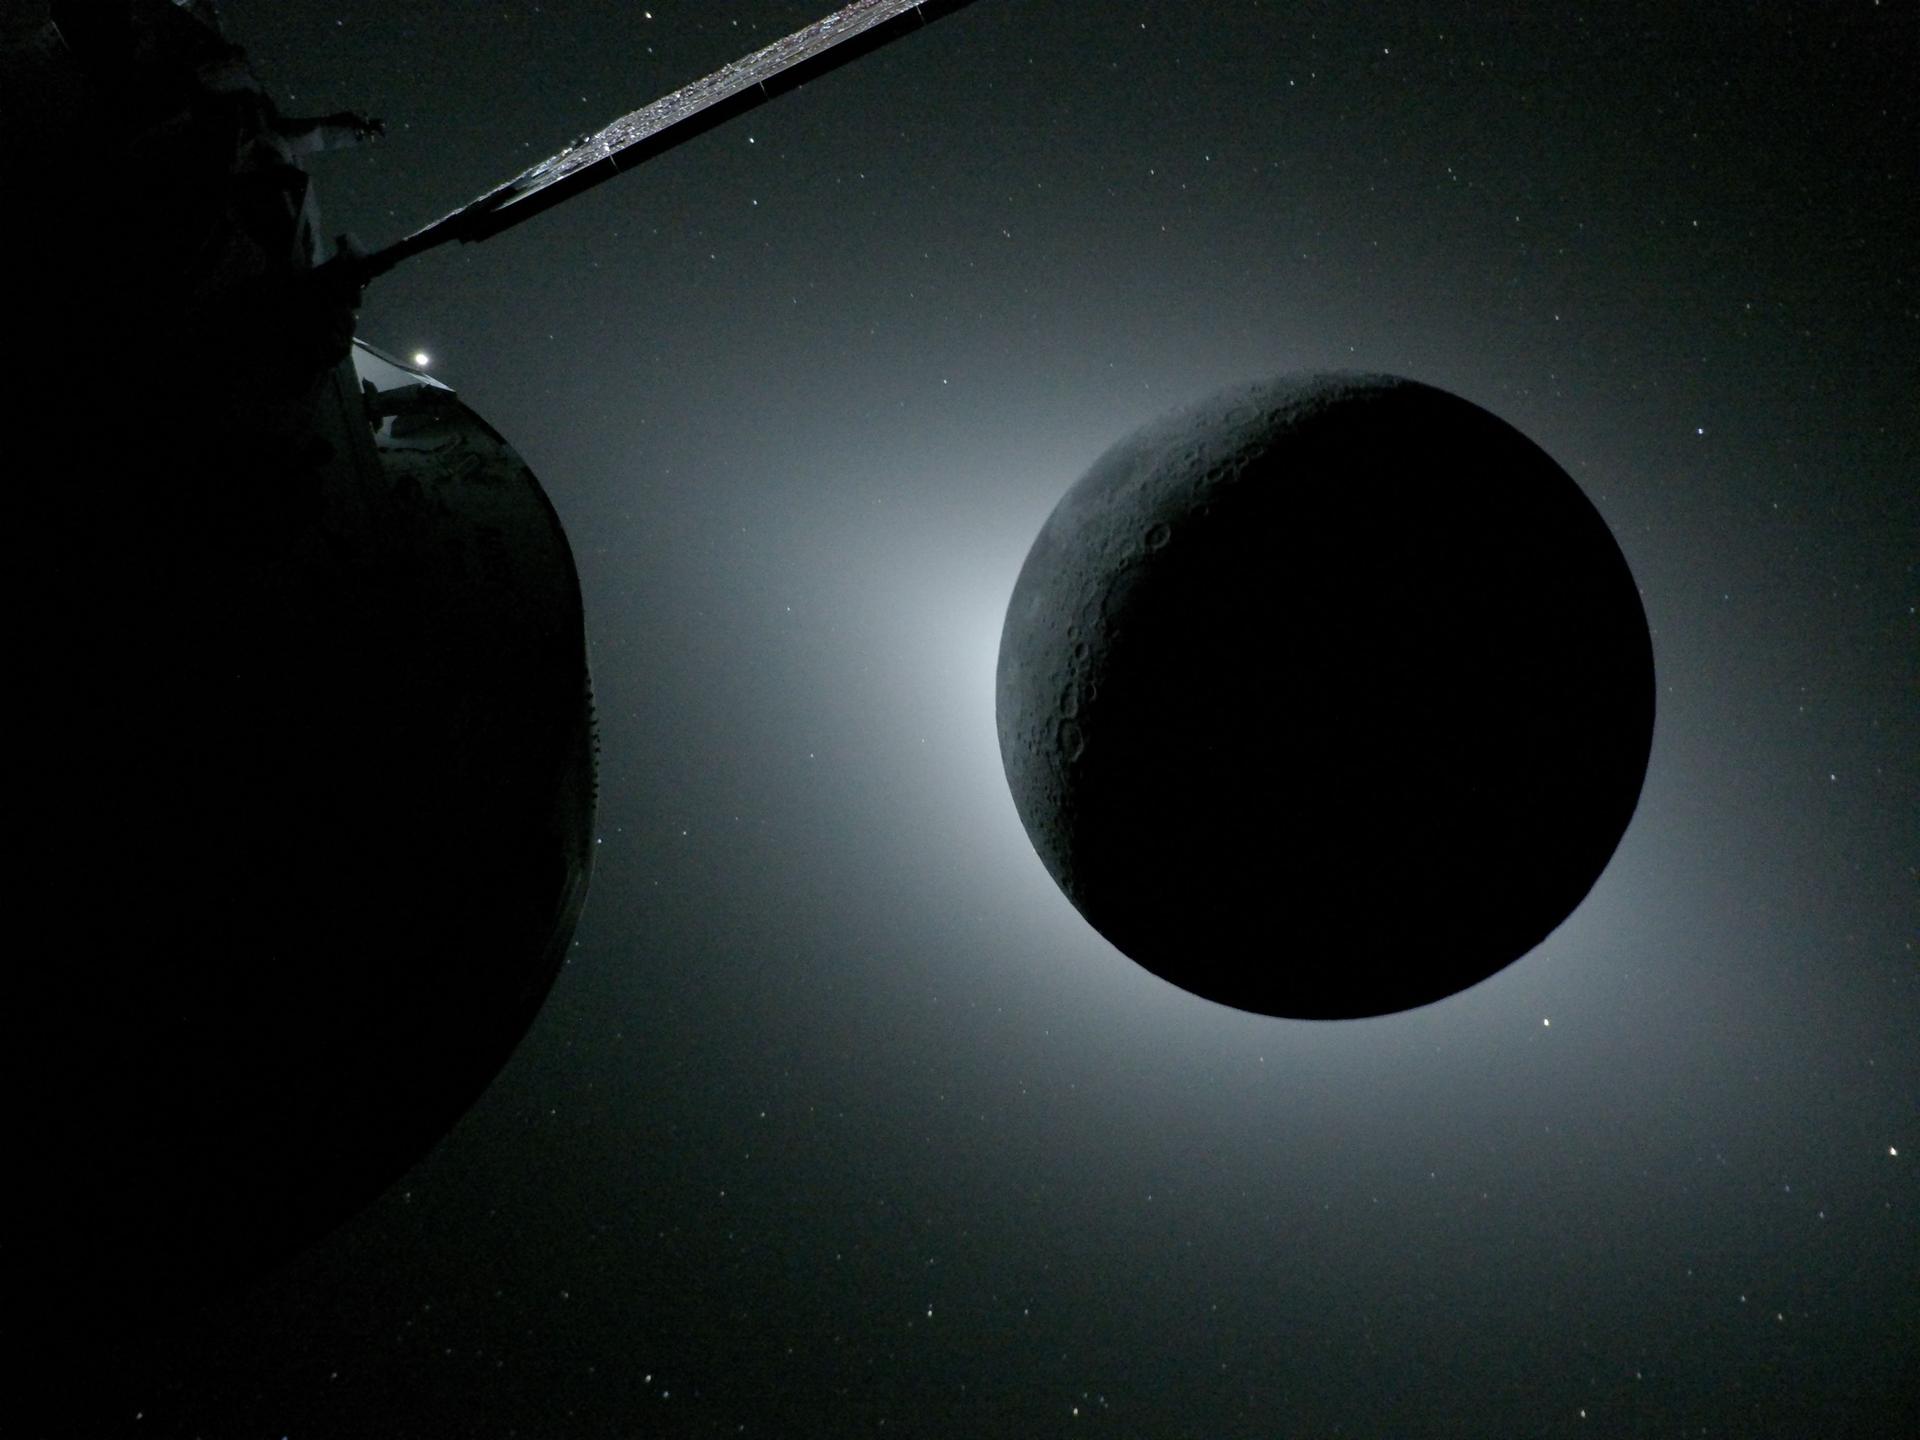
Peeking at EarthAs NASA’s Artemis II crew came close to passing behind the Moon and experiencing a planned loss of signal on Monday, April 6, 2026, they captured this image of a crescent Earth setting on the Moon’s limb. In this photo, the dark portion of Earth is experiencing nighttime, while Australia and Oceania are in the daylight. In the foreground, the Ohm crater is visible, with terraced edges and a flat floor interrupted by central peaks. Peaks such as these form in complex craters when the lunar surface is liquified on impact, and the liquefied surface splashes upward during the crater’s formation.Credit: NASA Setting EarthThe lunar surface fills the frame in sharp detail, as seen during NASA’s Artemis II lunar flyby, while a distant Earth sets in the background. This image was captured at 6:41 p.m. EDT, on April 6, 2026, just three minutes before the Orion spacecraft and its crew went behind the Moon and lost contact with Earth for 40 minutes before emerging on the other side. In this image, the dark portion of Earth is experiencing nighttime, while on its day side, swirling clouds are visible over the Australia and Oceania region. In the foreground, Ohm crater shows terraced edges and a relatively flat floor marked by central peaks — formed when the surface rebounded upward during the impact that created the crater.Credit: NASA Shadows Across Vavilov CraterA close-up view taken by the Artemis II crew of Vavilov Crater on the rim of the older and larger Hertzsprung basin on Monday, April 6, 2026. The right portion of the image shows the transition from smooth material within an inner ring of mountains to more rugged terrain around the rim. Vavilov and other craters and their ejecta are accentuated by long shadows at the terminator, the boundary between lunar day and night. The image was captured with a handheld camera at a focal length of 400 mm, as the crew flew around the far side of the Moon.Credit: NASA Artemis Era EarthriseEarthrise captured through the Orion spacecraft window at 7:22 p.m. EDT on Monday, April 6, 2026, during the Artemis II crew’s flyby of the Moon’s far side. Earth appears as a delicate crescent, with only its upper edge illuminated. The planet’s soft blue hue and scattered white cloud systems stand out against the blackness of space, while the lower portion fades into night. Taken with a 400 mm lens, the image, Earthrise, reveals a striking alignment of Earth and Moon, with the Moon in the top foreground and the Earth below. Along the lunar horizon, rugged terrain is silhouetted against the bright crescent Earth. Both bodies are oriented with their north poles to the left and south poles to the right, offering a unique perspective of our home planet from deep space. This photo was rotated 90 degrees clockwise for standard viewing orientation. Credit: NASA Artemis II in EclipseCaptured by the Artemis II crew during their lunar flyby on Monday, April 6, 2026, this image shows the Moon fully eclipsing the Sun. From the crew’s perspective, the Moon appears large enough to completely block the Sun, creating nearly 54 minutes of totality and extending the view far beyond what is possible from Earth. We see a glowing halo around the dark lunar disk. The science community is investigating whether this effect is due to the corona, zodiacal light, or a combination of the two. Also visible are stars, typically too faint to see when imaging the Moon, but with the Moon in darkness stars are readily imaged. This unique vantage point provides both a striking visual and a valuable opportunity for astronauts to document their observations during humanity’s return to deep space. The faint glow of the nearside of the Moon is visible in this image, having been illuminated by light reflected off the Earth.Credit: NASA Artemis II Total Solar Eclipse, Partial FrameA close-up view from the Orion spacecraft during the Artemis II crew’s lunar flyby on Monday, April 6, 2026, captures a total solar eclipse, with only part of the Moon visible in the frame as it fully obscures the Sun. We see a glowing halo around the dark lunar disk. The science community is investigating whether this effect is due to the corona, zodiacal light, or a combination of the two. From this deep-space vantage point, the Moon appeared large enough to sustain nearly 54 minutes of totality, far longer than total solar eclipses typically seen from Earth. The bright silver glint on the left edge of the image is the planet Venus. The round, dark gray feature visible along the Moon’s horizon between the 9 and 10 o’clock positions is Mare Crisium, a feature visible from Earth. We see faint lunar features because light reflected off of Earth provides a source of illumination.Credit: NASA EarthsetEarthset captured through the Orion spacecraft window at 6:41 p.m. EDT, April 6, 2026, during the Artemis II crew’s flyby of the Moon. A muted blue Earth with bright white clouds sets behind the cratered lunar surface. The dark portion of Earth is experiencing nighttime. On Earth’s day side, swirling clouds are visible over the Australia and Oceania region. In the foreground, Ohm crater has terraced edges and a flat floor interrupted by central peaks. Central peaks form in complex craters when the lunar surface, liquefied on impact, splashes upwards during the crater’s formation.Credit: NASA Final Flyby PreparationsNASA astronauts Victor Glover and Reid Wiseman, and CSA (Canadian Space Agency) astronaut Jeremy Hansen prepare for their journey around the far side of the Moon by configuring their camera equipment shortly before beginning the Artemis II lunar flyby observations.Credit: NASA Ready for Close UpCaptured by the Artemis II crew, the heavily cratered terrain of the eastern edge of the South Pole-Aitken basin is seen with the shadowed terminator – the boundary between lunar day and night – at the top of the image. The South Pole-Aitken basin is the largest and oldest basin on the Moon, providing a glimpse into an ancient geologic history built up over billions of years.Credit: NASAScientists already are analyzing the downlinked images, audio, and data to refine the timing and locations of these events and compare them with observations from amateur astronomers. The new imagery also will help NASA better understand the Moon’s geology and inform future exploration and science missions that will lay the foundation for an enduring presence on the Moon ahead of future astronaut missions to Mars.
“It was remarkable listening to the crew describe the stunning views during the flyby,” said Jacob Bleacher, NASA’s chief exploration scientist at the agency’s headquarters. “At first, their descriptions didn’t quite match what we were seeing on our screens. Now that higher resolution images are coming down, we can finally experience the moments they were trying to share and truly appreciate the scientific return provided by these images and our other research on this mission.”
Official NASA imagery for viewing and download is available on the agency website and digital platforms, including:
Media should follow NASA’s media usage guidelines for all publication and distribution of these images.
NASA is targeting 8:07 p.m. EDT (5:07 p.m. PDT) Friday, April 10, for the return of Artemis II off the coast of San Diego. NASA+ live return coverage begins at 6:30 p.m. and will continue until NASA and Department of War personnel safely assist the crew out of Orion and transport them to the USS John P. Murtha.
Briefings, events, and 24/7 mission coverage are streaming on NASA’s YouTube channel and events will each have their own stream closer to their start time. Learn how to watch NASA content through a variety of online platforms, including social media.
As part of Golden Age of innovation and exploration, NASA will send Artemis astronauts on increasingly difficult missions to explore more of the Moon for scientific discovery, economic benefits, and to build on our foundation for the first crewed missions to Mars.
To learn more about the Artemis program, visit:
-end-
Cheryl Warner / Katherine Rohloff
Headquarters, Washington
202-358-1100
cheryl.m.warner@nasa.gov / katherine.a.rohloff@nasa.gov
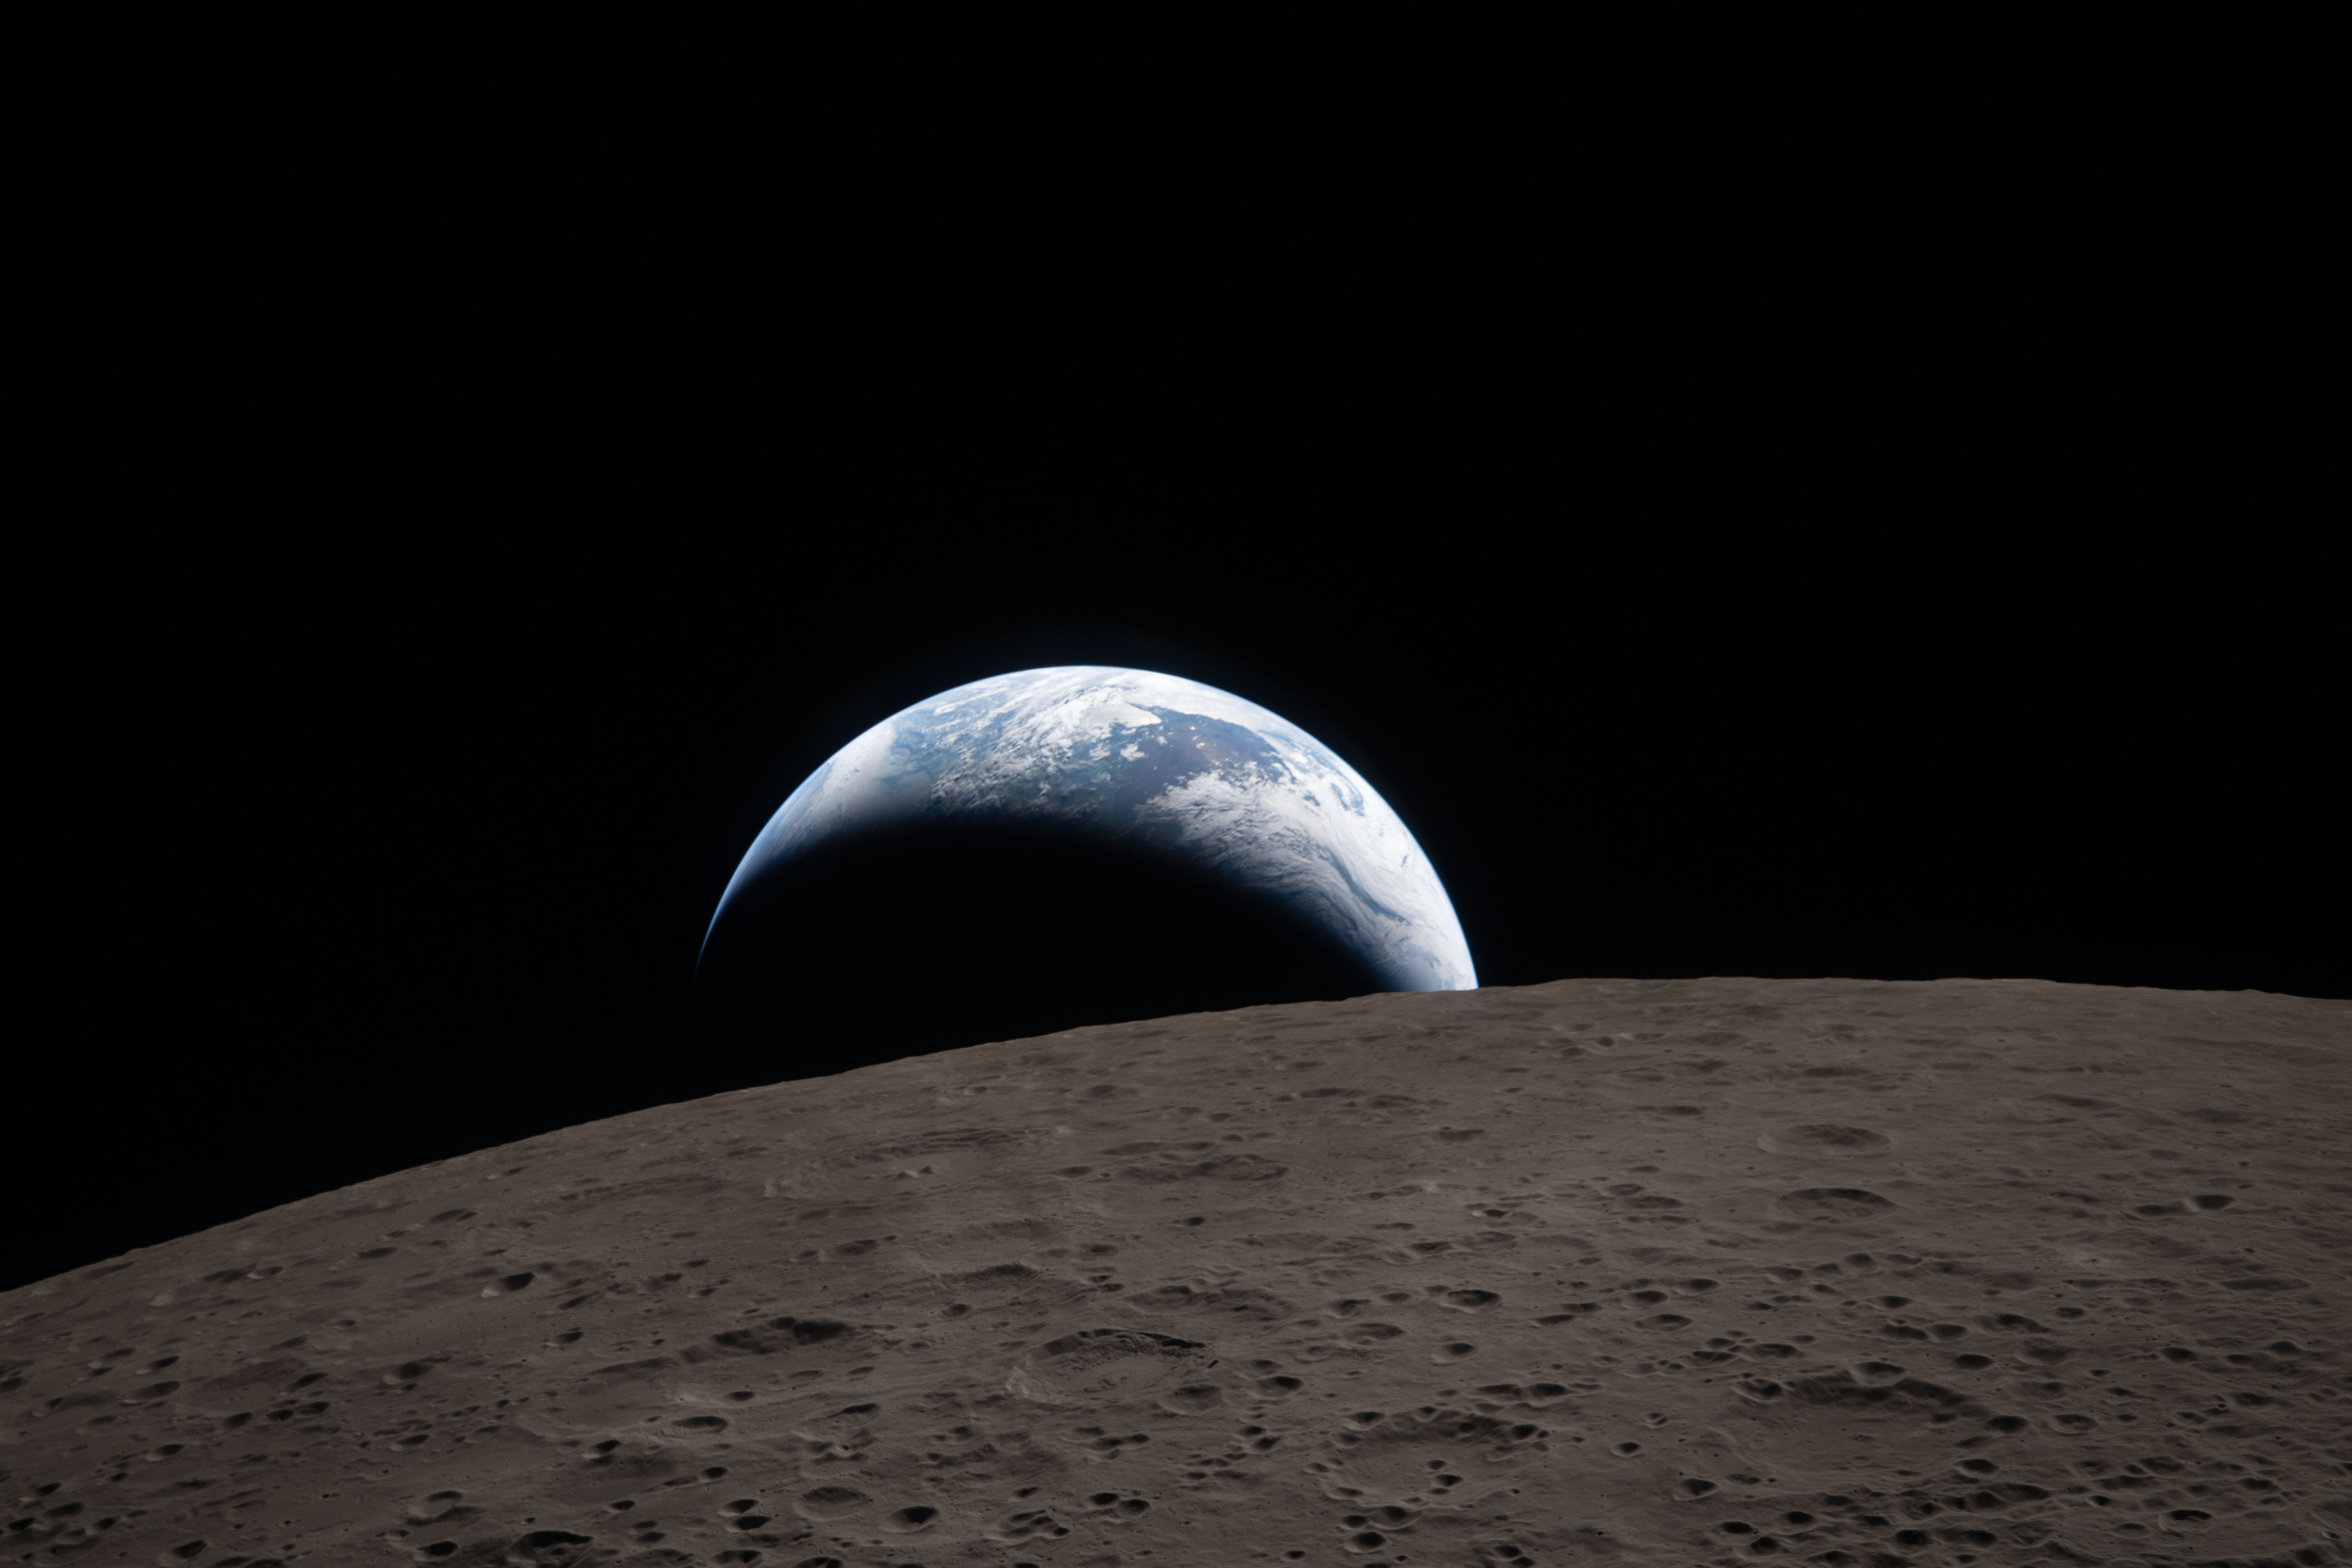
Earthset
The Artemis II crew captured this view of Earth setting on April 6, 2026, as they flew around the Moon. As the astronauts flew over the Moon’s far side, the crew photographed and described terrain features including impact craters, ancient lava flows, and surface cracks and ridges formed as the Moon slowly evolved over time. They also noted differences in color, brightness and texture, which provide clues that help scientists understand the composition and history of the lunar surface.
The image is reminiscent of the iconic Earthrise image taken by astronaut Bill Anders 58 years earlier as the Apollo 8 crew flew around the Moon. The Apollo 8 mission was the first crewed spacecraft to circumnavigate the Moon.
For more imagery from the mission, visit our Artemis II Multimedia Page.
Image credit: NASA
Experience the Rollout of SLS Hardware for Artemis III
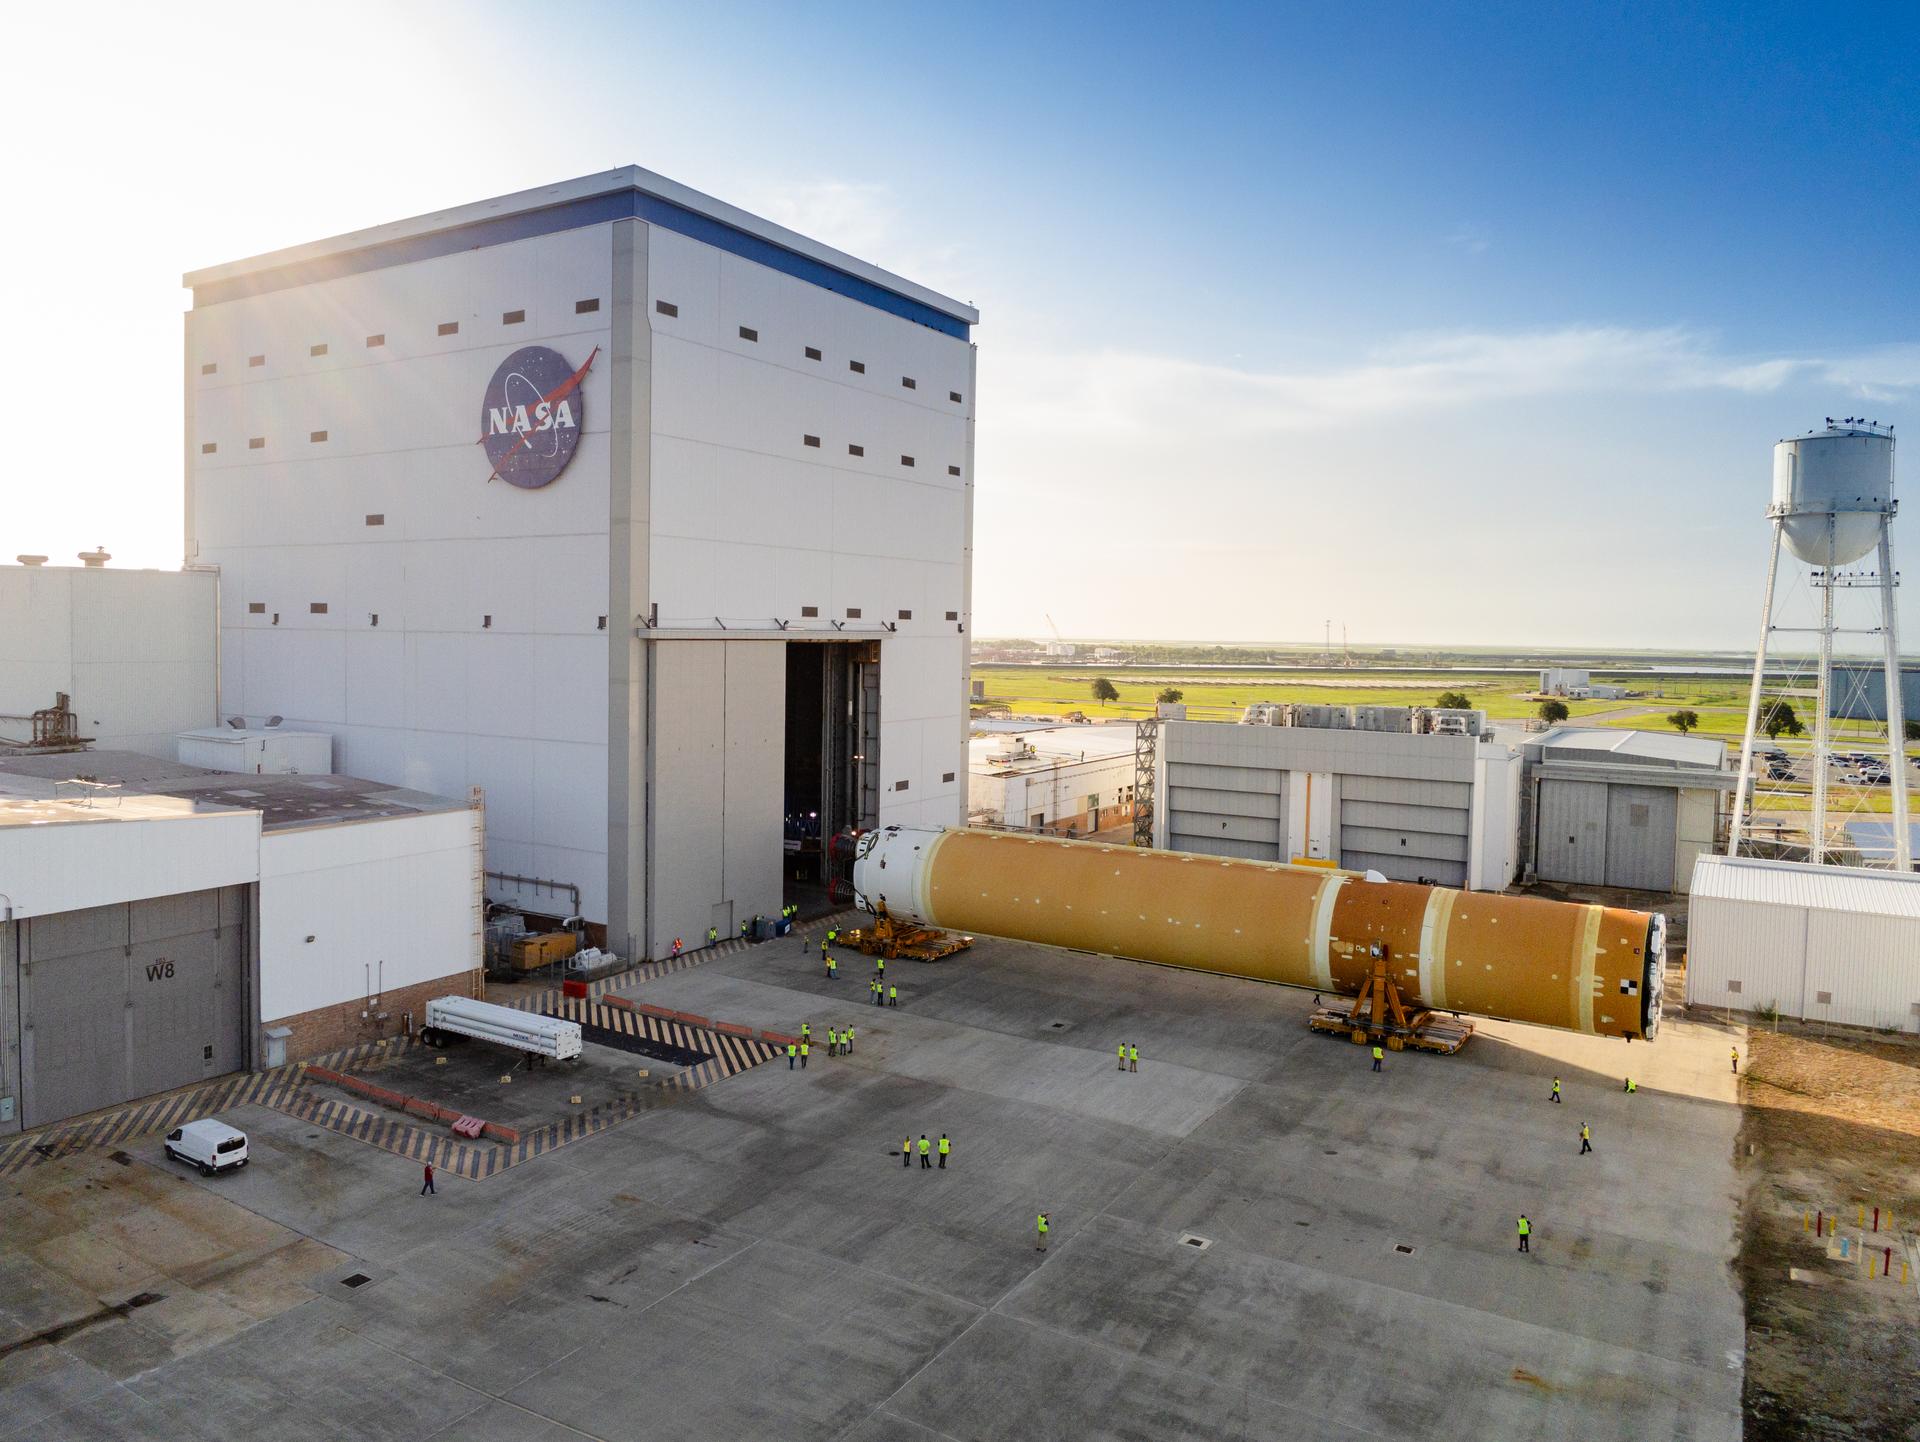
Digital creators and social media users are invited to register to attend the rollout of the third SLS (Space Launch System) core stage as it is prepped to head from NASA’s Michoud Assembly Facility to NASA’s Kennedy Space Center.
Are you passionate about social media and communications? Do you love to create content for an audience? Are you a fan of new, unique experiences? If you said yes, this NASA Social event is for you! This is your opportunity to be on the front lines as NASA continues to lay the groundwork for future deep space exploration.
The NASA Social event will be a one-day event as soon as mid to late April pending the launch of Artemis II. A maximum of 20 digital creators will be selected to attend this event and will be given access similar to news media.
NASA Social participants will have the opportunity to:
- Tour NASA’s Michoud Assembly Facility
- Learn directly from subject matter experts
- Meet fellow digital creators and social media users
- Spend time with members of NASA’s social media team
- View the rollout of the SLS core stage for Artemis III
NASA Social registration for the hardware rollout opens on this page on Tuesday, April 7, and the deadline to apply is noon EDT on Friday, April 10. All applications will be considered on a case-by-case basis.
Do I need to have a social media account to register?
Yes. This event is designed for people who:
- Actively use multiple social networking platforms and tools to disseminate information to a unique audience.
- Regularly produce new content that features multimedia elements.
- Have the potential to reach a large number of people using digital platforms.
- Reach a unique audience, separate and distinctive from traditional news media and/or NASA audiences.
- Must have an established history of posting content on social media platforms.
- Have previous postings that are highly visible, respected, and widely recognized.
Users are encouraged to follow @NASAArtemis for Artemis updates on X, Facebook, and Instagram. Updates and information about the event will be shared on X via @NASA_Events.
How do I register?
Registration for this event opens April 7 and closes at noon EDT on April 10. Registration is for one person only (you) and is non-transferable. Each individual wishing to attend must register separately. Each application will be considered on a case-by-case basis.
Can I register if I am not a U.S. citizen?
No, this event is open to only U.S citizens
When will I know if I am selected?
After registrations have been received and processed, an email with confirmation information and additional instructions will be sent to those selected. We expect to send the first notifications on Monday, April 13.
What are NASA Social credentials?
All NASA social applications will be considered on a case-by-case basis. Those chosen must prove through the registration process they meet specific engagement criteria.
What are the registration requirements?
Registration indicates your intent to travel to NASA Michoud and attend the one-day event in person. You are responsible for your own expenses for travel, accommodation, food, and other amenities.
The schedule of events and special guest appearances are subject to change without notice. NASA is not responsible for loss or damage incurred as a result of attending. NASA, moreover, is not responsible for loss or damage incurred if the event is canceled with limited or no notice. Please plan accordingly.
Michoud is a government facility. Those who are selected may need to complete additional steps to receive clearance to enter the secure areas.
IMPORTANT: Those without proper identification cannot be admitted.
For United States Citizens:
You will be required to present a REAL ID compliant identification or valid U.S. passport PLUS one of the following:
Acceptable documents to accompany federal or state identification:
- U.S. Passport
- Unexpired Employment Authorization Card (Form I-688A)
- Unexpired Employment Authorization Document issued by DHS that contains a photograph (Form I-688B)
- Driver’s license or ID card issued by a state or outlying possession of the United States provided it contains a photograph or information such as name, date of birth, gender, height, eye color, and address
- ID card issued by federal, state or local government agencies or entities, provided it contains a photograph or information such as name, date of birth, gender, height, eye color and address
- School ID card with a photograph
- Voter’s Registration Card
- Military Dependent’s ID Card
- U.S. Military card or draft record
- U.S. Coast Guard Merchant Mariner Card
- Native American Tribal Document
- U.S. Social Security Card issued by the Social Security Administration (other than a card stating it is not valid for employment)
- Original or Certified copy of birth certificate issued by a state, county, municipal authority or outlying possessions of the United States bearing an official seal
- U.S. Citizen ID Card (Form I-197)
- ID Card for use of Resident Citizens of the United States (Form I-179)
- Unexpired employment authorization document issued by DHS (other than those listed previously)
For Legal Resident Aliens:
- Same items required of U. S. Citizens, and:
- Permanent Resident Card or Alien Registration Receipt Card with photograph (Form I-551)
- Unexpired Temporary Resident Card (Form I-688)
- Certification of Birth Abroad issued by the Department of State (Form FS-545 or Form DS-1350)
The REAL ID Act was passed by Congress in 2005 to establish minimum security standards for state-issued driver’s licenses and identification cards.
All registrants must be at least 18 years old.
What if the rollout date changes?
Many different factors can cause a scheduled date change. NASA may adjust the date of the NASA Social accordingly to coincide with a new target rollout date, and will notify registrants of any changes via email.
If the event is postponed, attendees will be invited to attend at a later date. If the rollout is postponed beyond 72 hours, the NASA Social event may be canceled.
NASA Social attendees are responsible for any additional costs they incur related to any launch delay. We strongly encourage participants to make travel arrangements that are refundable and/or flexible.
What if I cannot come to Michoud Assembly Facility?
If you cannot come to NASA Michoud and attend in person, you should not register for the NASA Social. Join the conversation by following @NASAArtemis on X, Facebook, and Instagram,
If you cannot make this NASA Social, don’t worry; NASA is planning many other NASA Social events in the near future at various locations! Check for updates on NASA Socials.
NASA to Host Media Call with Artemis II Crew on Way Home from Moon
Editor’s note: This advisory was updated Wednesday, April 8, 2026, to reflect a time change in the event.
Media will have an opportunity at 10:45 p.m. EDT on Wednesday, April 8, to speak with NASA’s Artemis II crew members as they continue their journey toward Earth during their historic mission around the Moon.
The 20-minute virtual news conference will take place with NASA astronauts Reid Wiseman, Victor Glover, and Christina Koch, and CSA (Canadian Space Agency) astronaut Jeremy Hansen.
Live coverage will stream on NASA’s YouTube channel. An instant replay will be available online. Learn how to watch NASA content on a variety of platforms, including social media.
Members of the media previously credentialed at NASA’s Johnson Space Center in Houston and planning to be onsite must RSVP for consideration to ask a question during the call. NASA will prioritize media outlets that have not yet spoken to the Artemis II astronauts in space.
To participate virtually in the call, media must RSVP no later than 1 p.m. on April 8 by emailing lauren.e.low@nasa.gov. NASA’s media accreditation policy is available online.
With just days until the crew splashes down off the coast of San Diego on Friday, April 10, the Artemis II test flight has reached multiple milestones, including a successful launch, manually piloting the Orion spacecraft, multiple spacecraft moves to propel Orion to the Moon and adjust its course during the flight, surpassing the Apollo 13 record for farthest crewed spaceflight, and a lunar flyby to view the far side of the Moon.
Artemis II is the first crewed mission under the agency’s Artemis program, where NASA is sending astronauts on increasingly difficult missions to explore more of the Moon for scientific discovery, economic benefits, and to build on our foundation for the first crewed missions to Mars.
Learn more about the mission by visiting:
https://www.nasa.gov/artemis-ii
-end-
Lauren Low
Headquarters, Washington
202-358-1600
lauren.e.low@nasa.gov
Drought Parches Florida
Florida is among the wettest U.S. states, but that doesn’t mean it is drought-free. Nearly all of Florida faced at least “moderate” drought, and nearly 80 percent faced “extreme” conditions in April 2026, according to data from the U.S. Drought Monitor. Unusually dry conditions gripped the state for much of 2025, but the intensity and extent of the drought ratcheted up starting in January 2026.
Data from a NASA and German Research Center for Geosciences satellite mission show that the drought has left its imprint on the state’s underground water supplies, which are often tapped for drinking water and farming. The map above combines data from the twin GRACE-FO (Gravity Recovery and Climate Experiment Follow-On) satellites and ground-based measurements to estimate the relative amount of groundwater stored underground as of March 30, 2026. The colors depict the wetness percentile, or how the amount of shallow groundwater compares to long-term records (1948–2010). Blue areas have more water than usual, and orange and red areas have less. Aquifers in the northern and central regions of the state are particularly dry.
The drought is being felt throughout Florida. Some water districts have imposed restrictions on when water can be used for certain activities, such as lawn watering and car washes. News reports suggest that the dry weather poses a threat to crops, many of which already suffered severe damage during hard freezes in February. Large wildland fires have flared up in some areas, and even wetland ecosystems like the Everglades face unusually dry conditions.
The 2025-2026 drought is the most severe to affect Florida since 2012, data from the U.S. Drought Monitor show.NASA Earth Observatory / Lauren DauphinU.S. Drought Monitor records indicate that the current drought is the most widespread and severe to affect the state since 2012. Many areas have received less than half their normal rainfall since September 1, 2025, according to the National Weather Service. St. Petersburg has seen only 7.7 inches (195.6 millimeters) of rain since September 1, compared to the normal 19.0 inches, making this the driest year on record for that period.
However, the current drought does not yet rival the worst drought that has parched the state, according to data from the U.S. Drought Monitor. Their analysis indicates that the 2000–2001 drought was more intense, lasted longer, and affected a larger area. GRACE-FO observations are among the sources of information that the U.S. Drought Monitor considers when mapping drought conditions in its weekly assessments. Forecasters anticipate that a slow-moving rainstorm set to hit Florida this week may offer some relief.
NASA Earth Observatory images by Lauren Dauphin, using GRACE-FO data from The National Drought Mitigation Center at the University of Nebraska-Lincoln. Story by Adam Voiland.
Downloads March 30, 2026JPEG (1.01 MB)
References and Resources- AccuWeather (2026, April 5) Slow-moving rainstorm to douse Florida drought, wildfire risk this week. Accessed April 6, 2026.
- Florida Climate Center (2026, February) Climate Summary for Florida. Accessed April 6, 2026.
- Florida Department of Environmental Protection (2024, December 13) Aquifer Essentials. Accessed April 6, 2026.
- Florida Department of Agriculture and Consumer Services (2026, February 20) Commissioner Wilton Simpson Announces Recent Freezes Caused Over $3 Billion in Estimated Losses to Florida Agriculture. Accessed April 6, 2026.
- FOX Business (2026, March 11) Florida drought deepens strain on citrus industry as growers battle costs, disease. Accessed April 6, 2026.
- FOX Weather (2026, March 25) New Florida water restrictions issued as historic drought intensifies, with little relief expected. Accessed April 6, 2026.
- Main St. Daily News (2026) Floridan aquifer levels hit lowest since 2011 with little March rain. Accessed April 6, 2026.
- National Weather Service (2026, April 2) Drought Information Statement for West Central and Southwest Florida. Accessed April 6, 2026.
- National Weather Service (2026, April 2) Drought Information Statement for Southeast Alabama, Southwest Georgia, and the Florida Panhandle & Big Bend. Accessed April 6, 2026.
- South Florida Water Management District Groundwater Modeling. Accessed April 6, 2026.
- Southwest Florida Water Management District (2026, March 24) District Declares Modified Phase III Water Shortage. Accessed April 6, 2026.
- Tampa Bay Times (2026, March 21) ‘Dry to the bone’: Drought squeezes Everglades airboat operators. Accessed April 6, 2026.
- U.S. Drought Monitor (2026, April 2) Florida. Accessed April 6, 2026.
- WUFT (2026, March 11) North Florida drought strains farmers as dry conditions persist. Accessed April 6, 2026.
- WUSF (2026, March 24) Stricter outdoor watering restrictions are coming due to ongoing drought. Accessed April 6, 2026.
- Earth
- Earth Observatory
- Image of the Day
- EO Explorer
- Topics
- More Content
- About
NASA’s Artemis II Crew Eclipses Record for Farthest Human Spaceflight
Editor’s note: This release was updated at 7:28 p.m. EDT on April 6, 2026, to reflect Orion’s final closest approach to the lunar surface from about 4,070 miles to about 4,067 miles. NASA also updated the farthest distance Orion will travel. Finally, NASA also made changes at 10 p.m. to the statements about crew firsts.
Four astronauts aboard NASA’s Artemis II test flight around the Moon made history at 12:56 p.m. CDT on Monday, traveling 248,655 miles from Earth, surpassing the record for human spaceflight’s farthest distance previously set by the Apollo 13 mission in 1970. At its farthest point, crew inside the Orion spacecraft will have traveled about 252,756 miles, before looping back toward our home planet, setting the new record for human spaceflight.
Six days into the first crewed mission of NASA’s Artemis program, NASA astronauts Reid Wiseman, Victor Glover, and Christina Koch, and CSA (Canadian Space Agency) astronaut Jeremy Hansen continued collecting pictures of the Moon on their voyage away from Earth.
“At NASA, we dare to reach higher, explore farther, and achieve the impossible. That’s embodied perfectly by our Artemis II astronauts – Reid, Victor, Christina, and Jeremy. They are charting new frontiers for all humanity,” said Dr. Lori Glaze, acting associate administrator for Exploration Systems Development Mission Directorate at NASA Headquarters in Washington. “Their dedication is about more than breaking records – it’s fueling our hope for a bold future. Their mission is carrying our promise to return to the Moon’s surface, this time to stay as we establish a Moon Base.”
NASA’s Orion spacecraft began its journey to the Moon following a successful April 1 launch on an SLS (Space Launch System) rocket from the agency’s Kennedy Space Center in Florida. After conducting a series of burns to break free of Earth orbit the following day, the spacecraft set its path toward the Moon.
Following their record achievement, crew provided brief, emotional remarks. The world heard from CSA (Canadian Space Agency) astronaut Jeremy Hansen aboard Orion:
“From the cabin of Integrity here, as we surpass the furthest distance humans have ever traveled from planet Earth, we do so in honoring the extraordinary efforts and feats of our predecessors in human space exploration. We will continue our journey even further into space before Mother Earth succeeds in pulling us back to everything that we hold dear. But we most importantly choose this moment to challenge this generation and the next to make sure this record is not long-lived.”
In addition to their spaceflight record, crew suggested naming two craters on the Moon during their flight. The first is named in honor of their spacecraft, Integrity. The second honors Wiseman’s late wife, Carroll. After this mission is complete, the crater name proposals will be formally submitted to the International Astronomical Union, the organization that governs the naming of celestial bodies and their surface features.
When they fly past the Moon later, crew will come within about 4,067 miles from its surface at the closest approach. The astronauts will be the first to see some parts of the far side of the Moon with human eyes. Finally, they will witness a solar eclipse as the Moon passes in front of the Sun.
NASA is expecting to lose communication with the astronauts for about 40 minutes during a planned blackout period. The break will occur as the Moon blocks signals between the spacecraft and the Earth through the Deep Space Network. When Orion reemerges from behind the Moon, it is expected to quickly reacquire contact with flight controllers in the Mission Control Center at NASA’s Johnson Space Center in Houston.
During their lunar flyby, a fleet of cameras will capture imagery of the Moon, including features humans have never directly seen. The astronauts will use a variety of digital handheld cameras to conduct high-resolution photography of the lunar surface. Artemis II is providing astronauts an opportunity to gather data as one of the most powerful scientific tools for observation are the four pairs of eyes observing lunar features with varying illumination and texture.
Photos, videos, mission telemetry, and communication information are all sources of data from the test flight, which will be used to inform future Artemis missions as the agency embarks on development of its Moon Base.
The Artemis II astronauts are more than halfway through their mission. The crew is scheduled to splash down off the coast of San Diego at approximately 8:07 p.m. EDT (5:07 p.m. PDT) on Friday, April 10. Following splashdown, recovery teams will retrieve the crew members using helicopters and deliver them to the USS John P. Murtha. Once aboard, the astronauts will undergo post-flight medical evaluations in the ship’s medical bay before traveling back to shore to meet with an aircraft bound for NASA Johnson.
Under the Artemis program, NASA will send Artemis astronauts on increasingly challenging missions to explore more of the Moon for scientific discovery, economic benefits, and to build on our foundation for the first crewed missions to Mars.
For the latest mission progress, visit:
https://www.nasa.gov/artemis-ii
-end-
Cheryl Warner / Rachel Kraft
Headquarters, Washington
202-358-1600
cheryl.m.warner@nasa.gov / rachel.h.kraft@nasa.gov
NASA’s Northrop Grumman CRS-24 Mission Overview
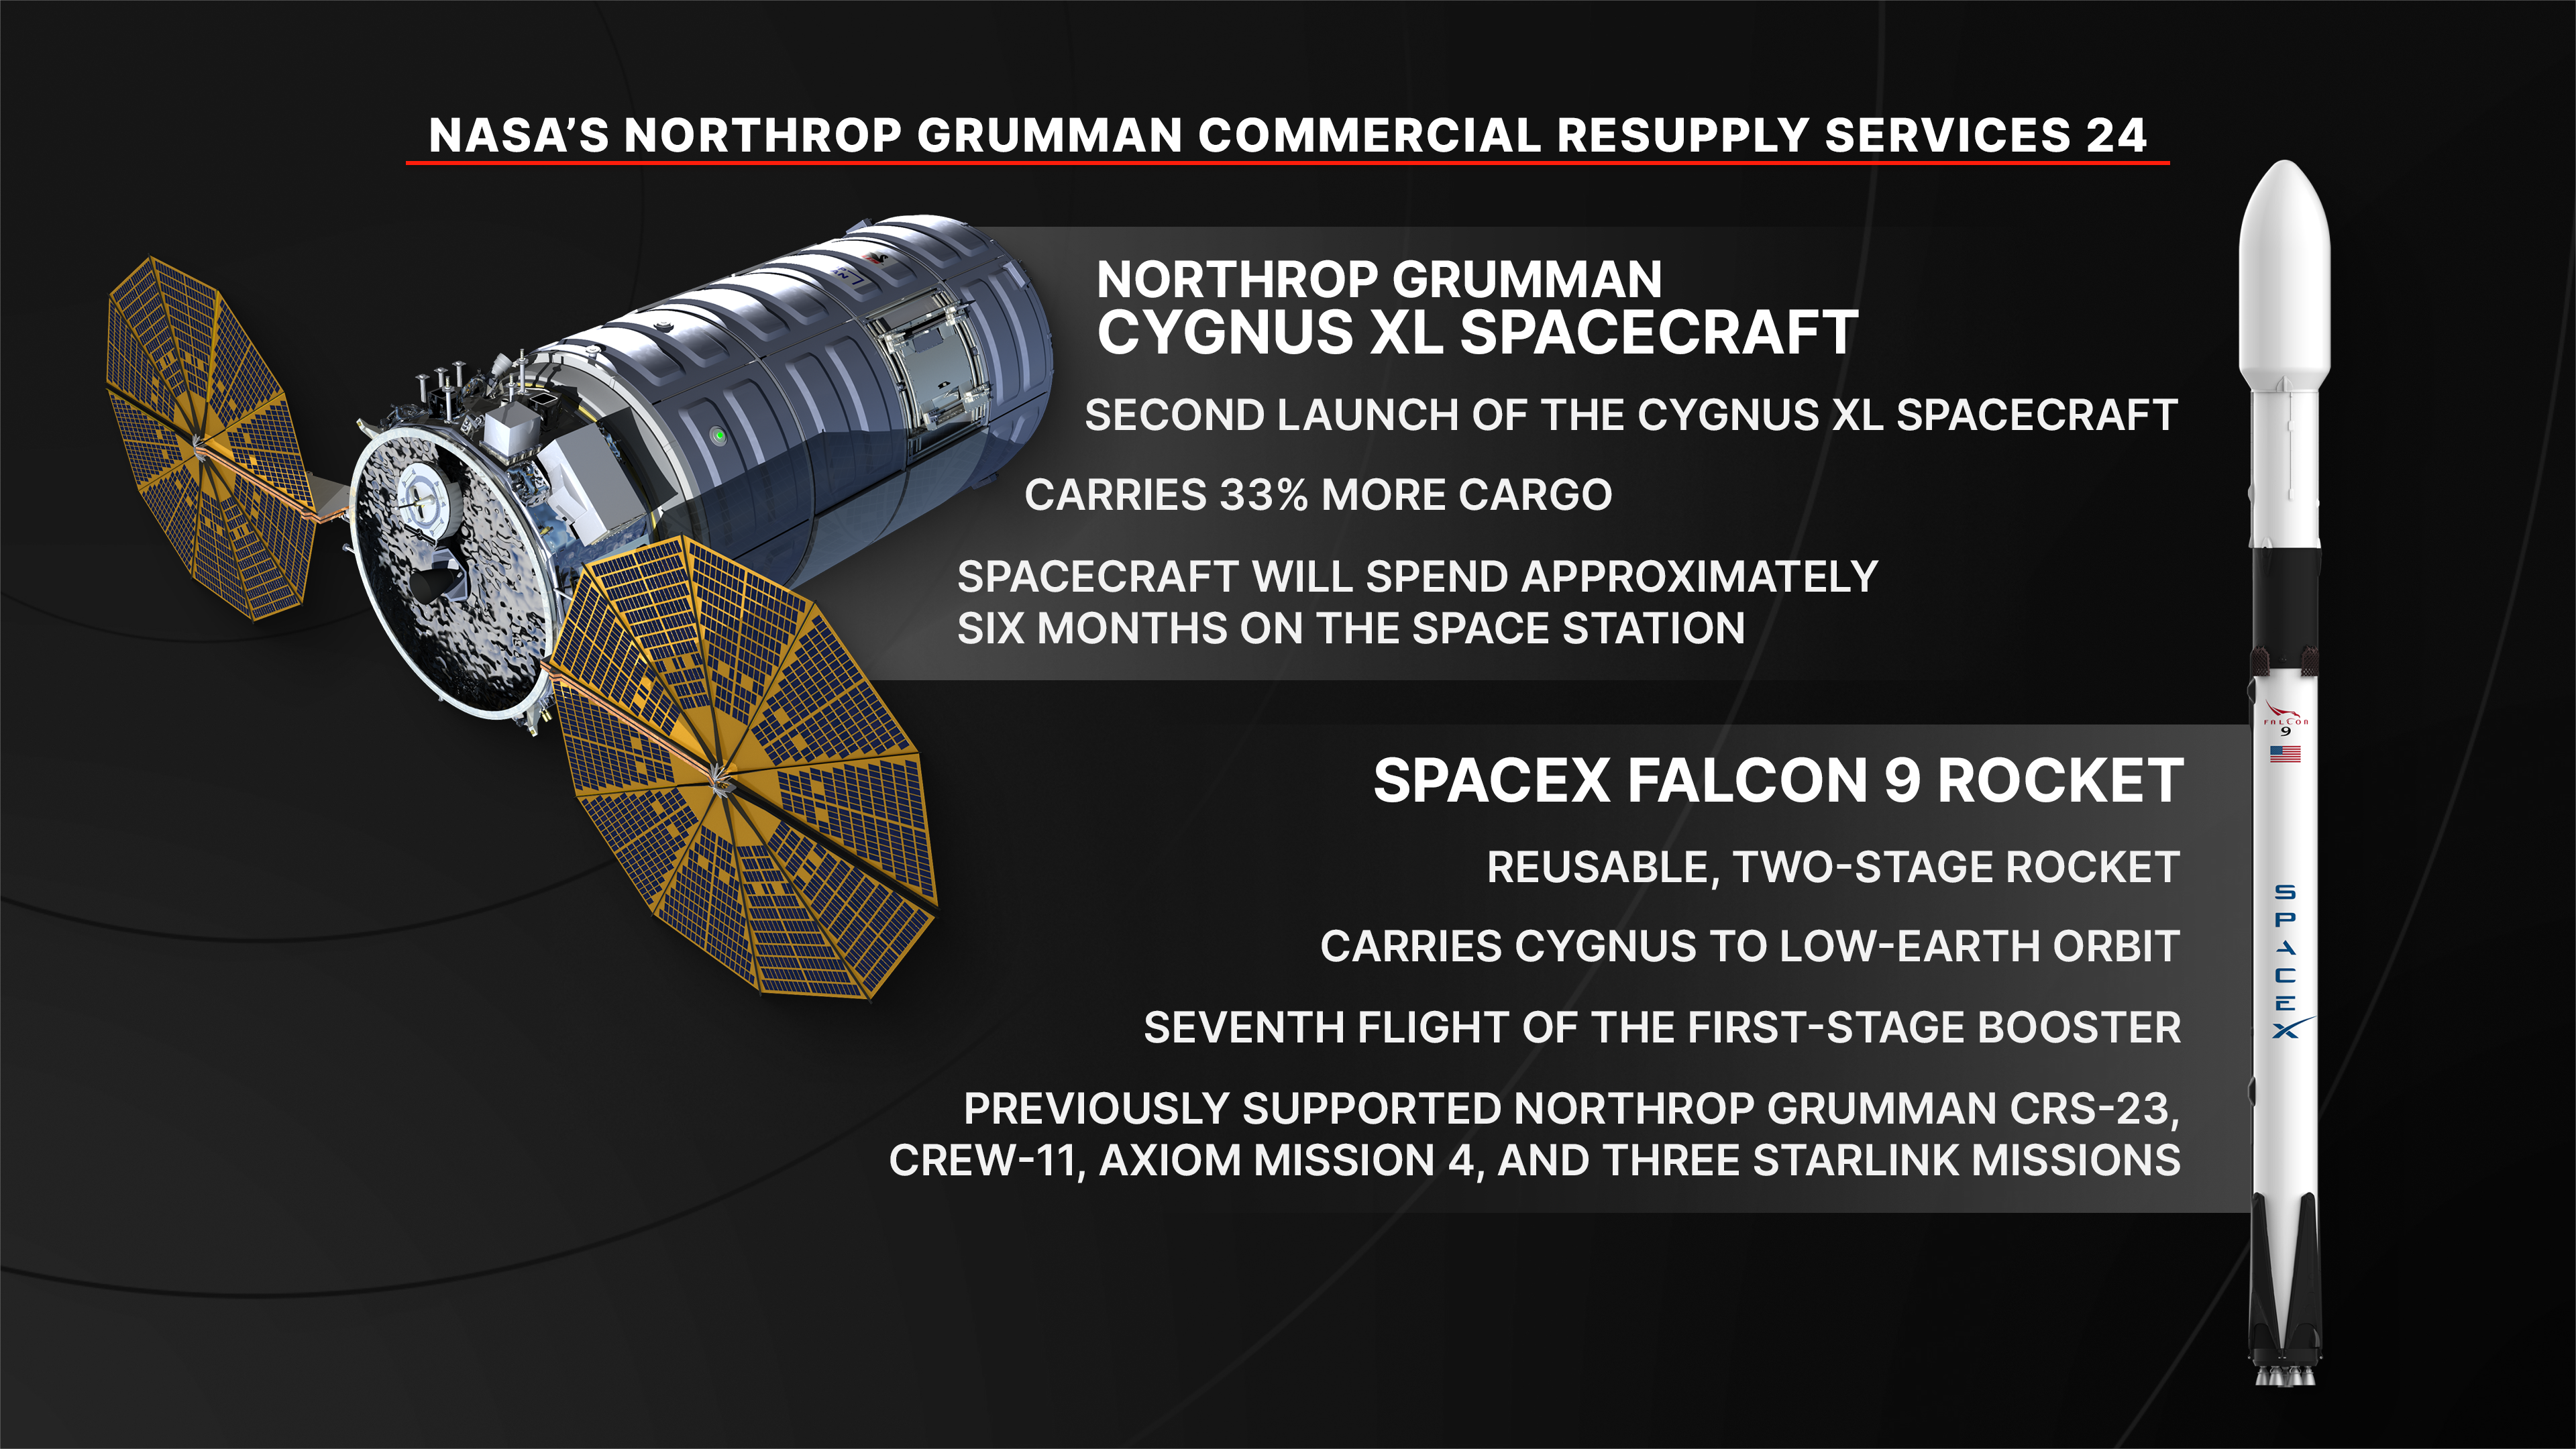
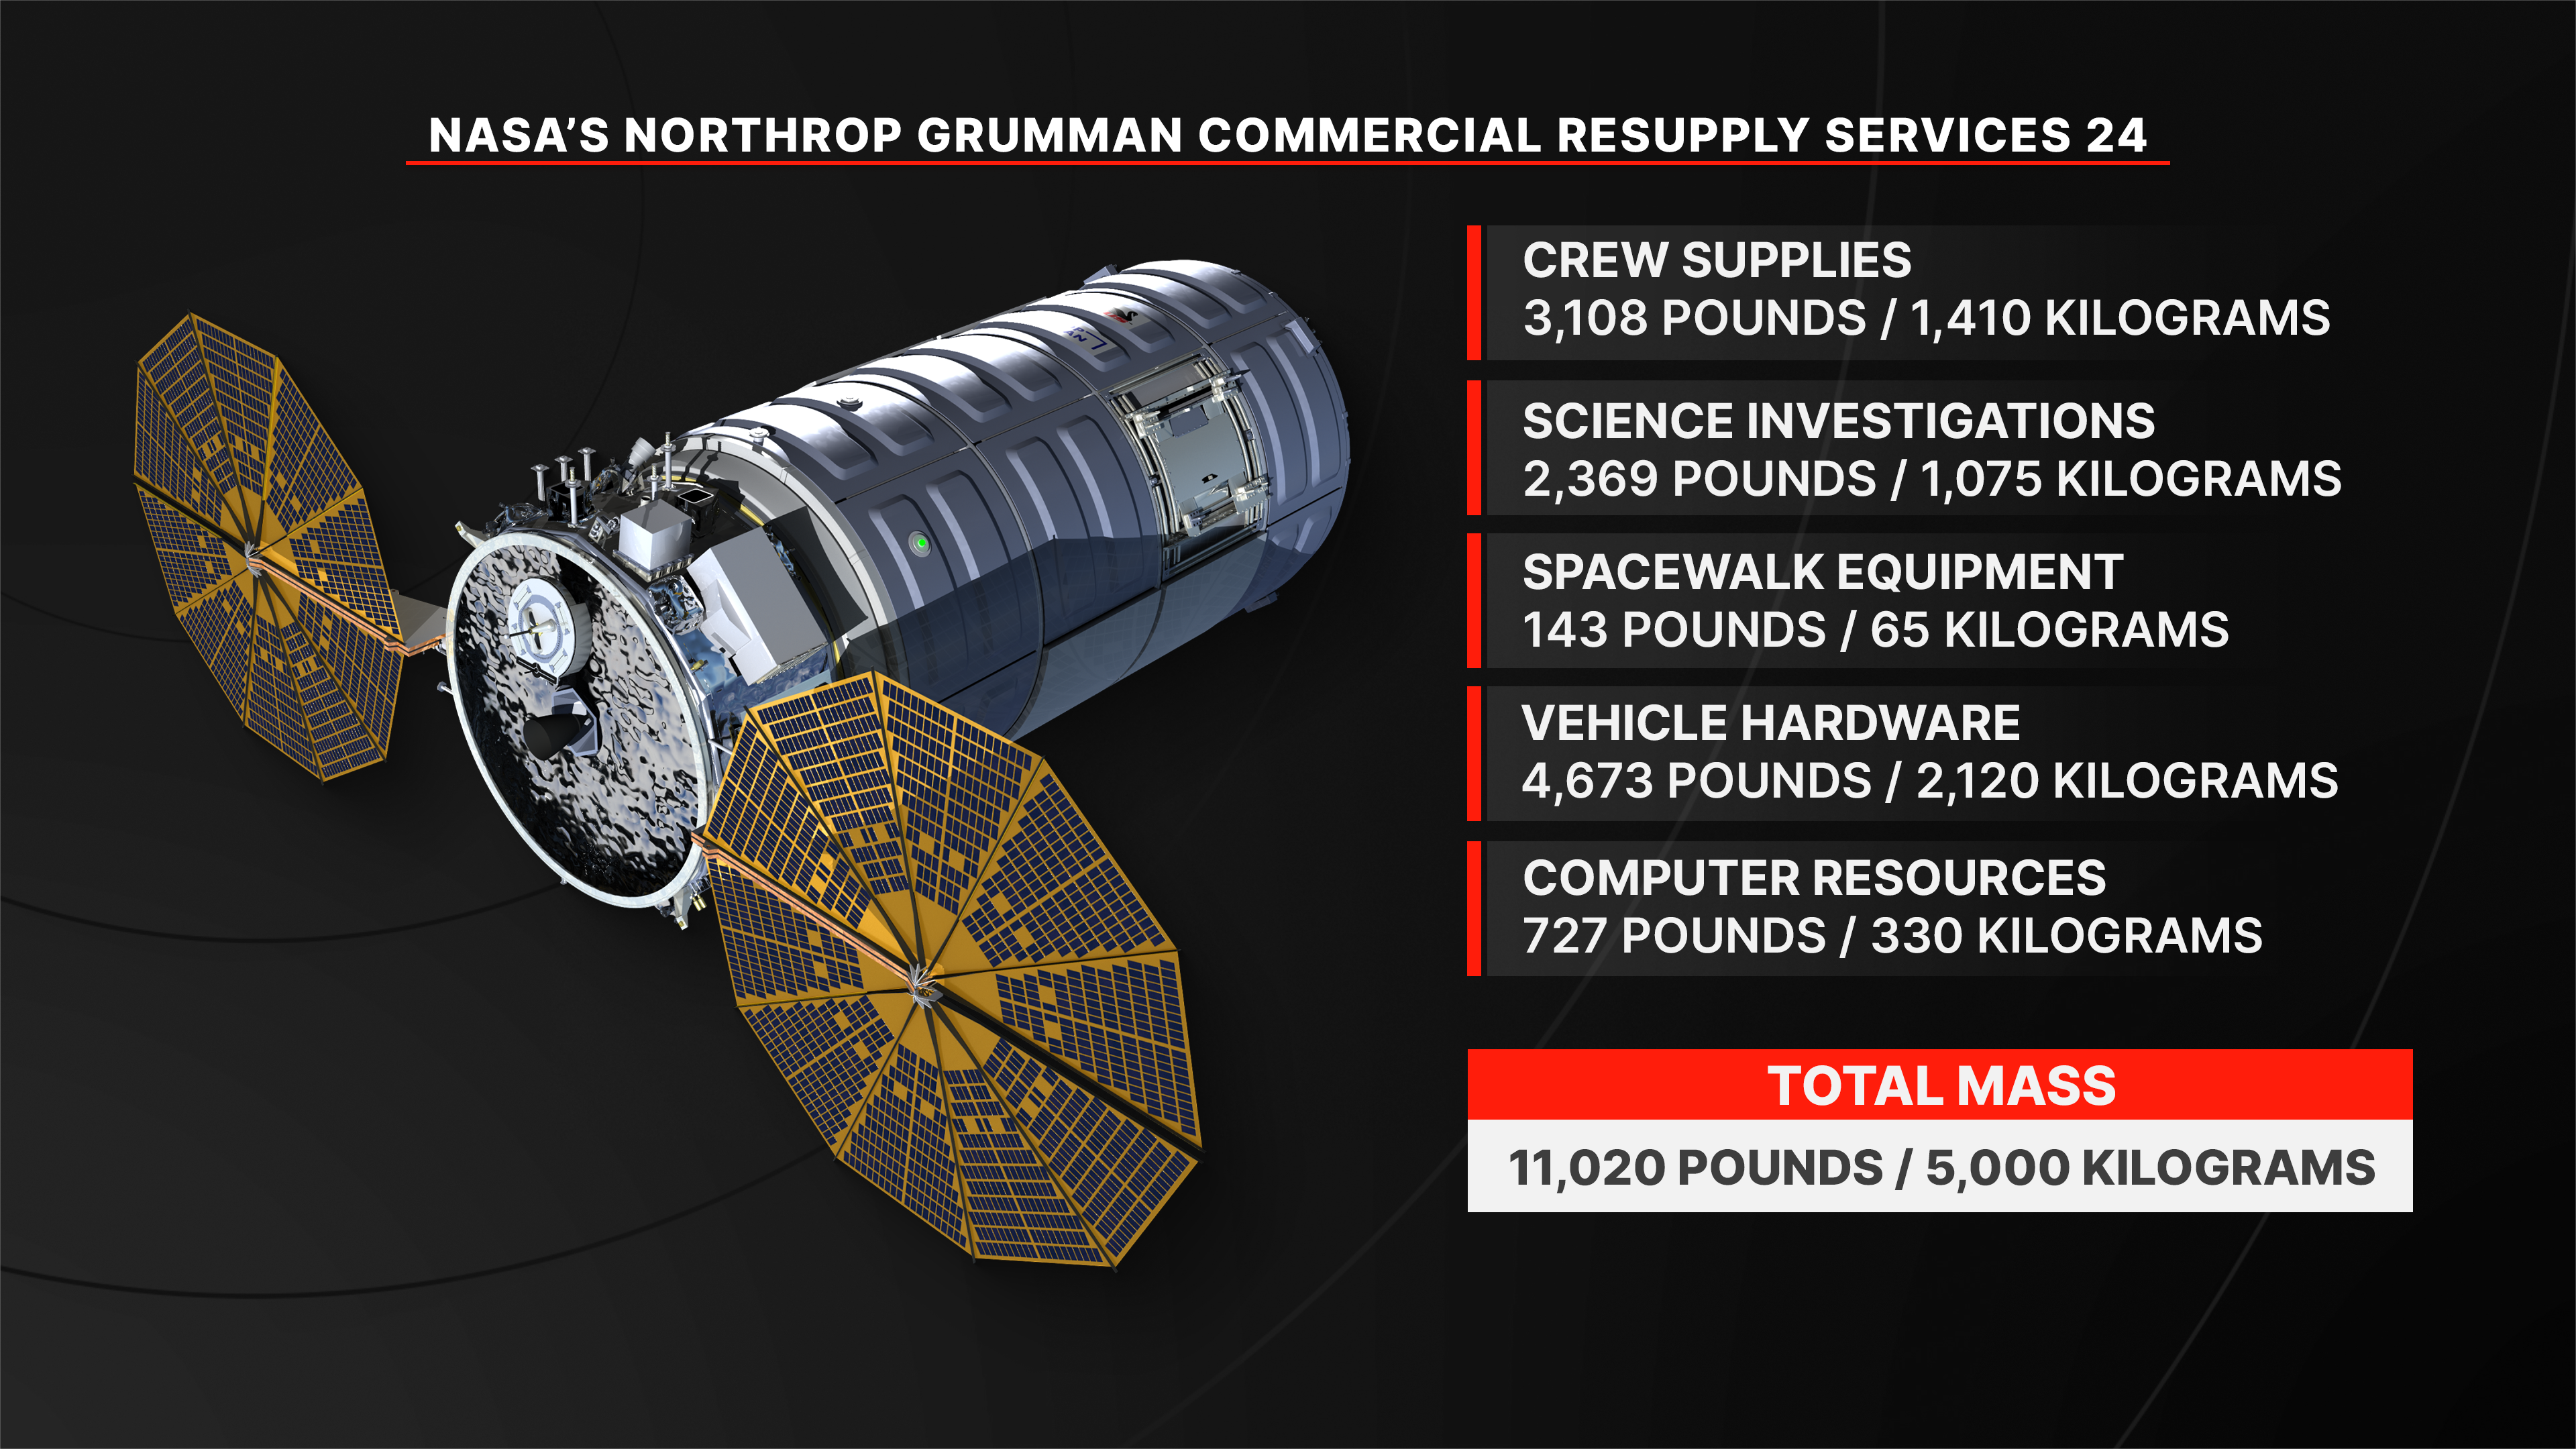
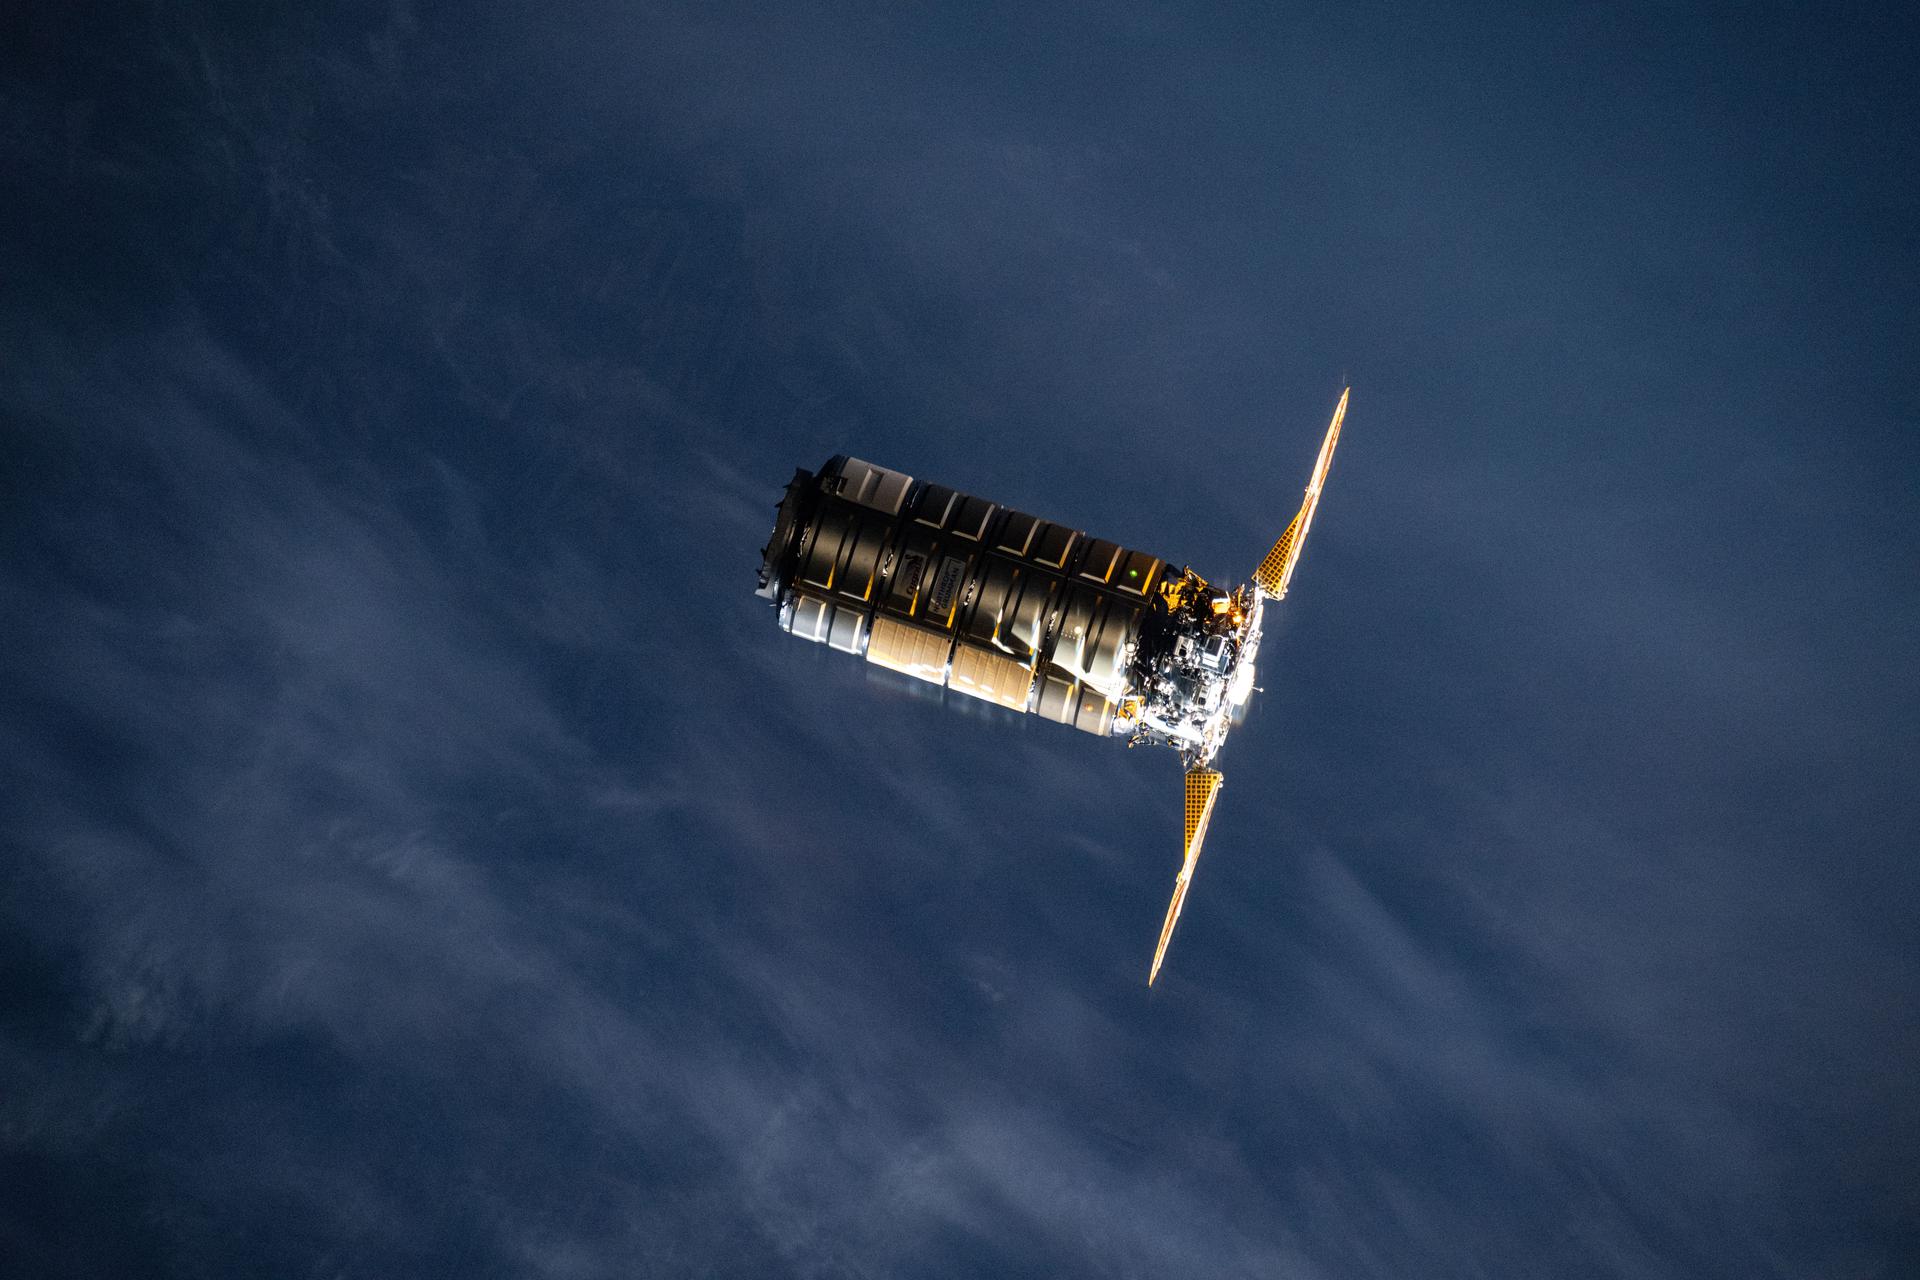
NASA’s Northrop Grumman Commercial Resupply Services 24 mission, or Northrop Grumman CRS-24, will deliver approximately 11,000 pounds of science and supplies to the International Space Station. This mission will be the second flight of the Cygnus XL, the larger, more cargo-capable version of the company’s solar-powered spacecraft.
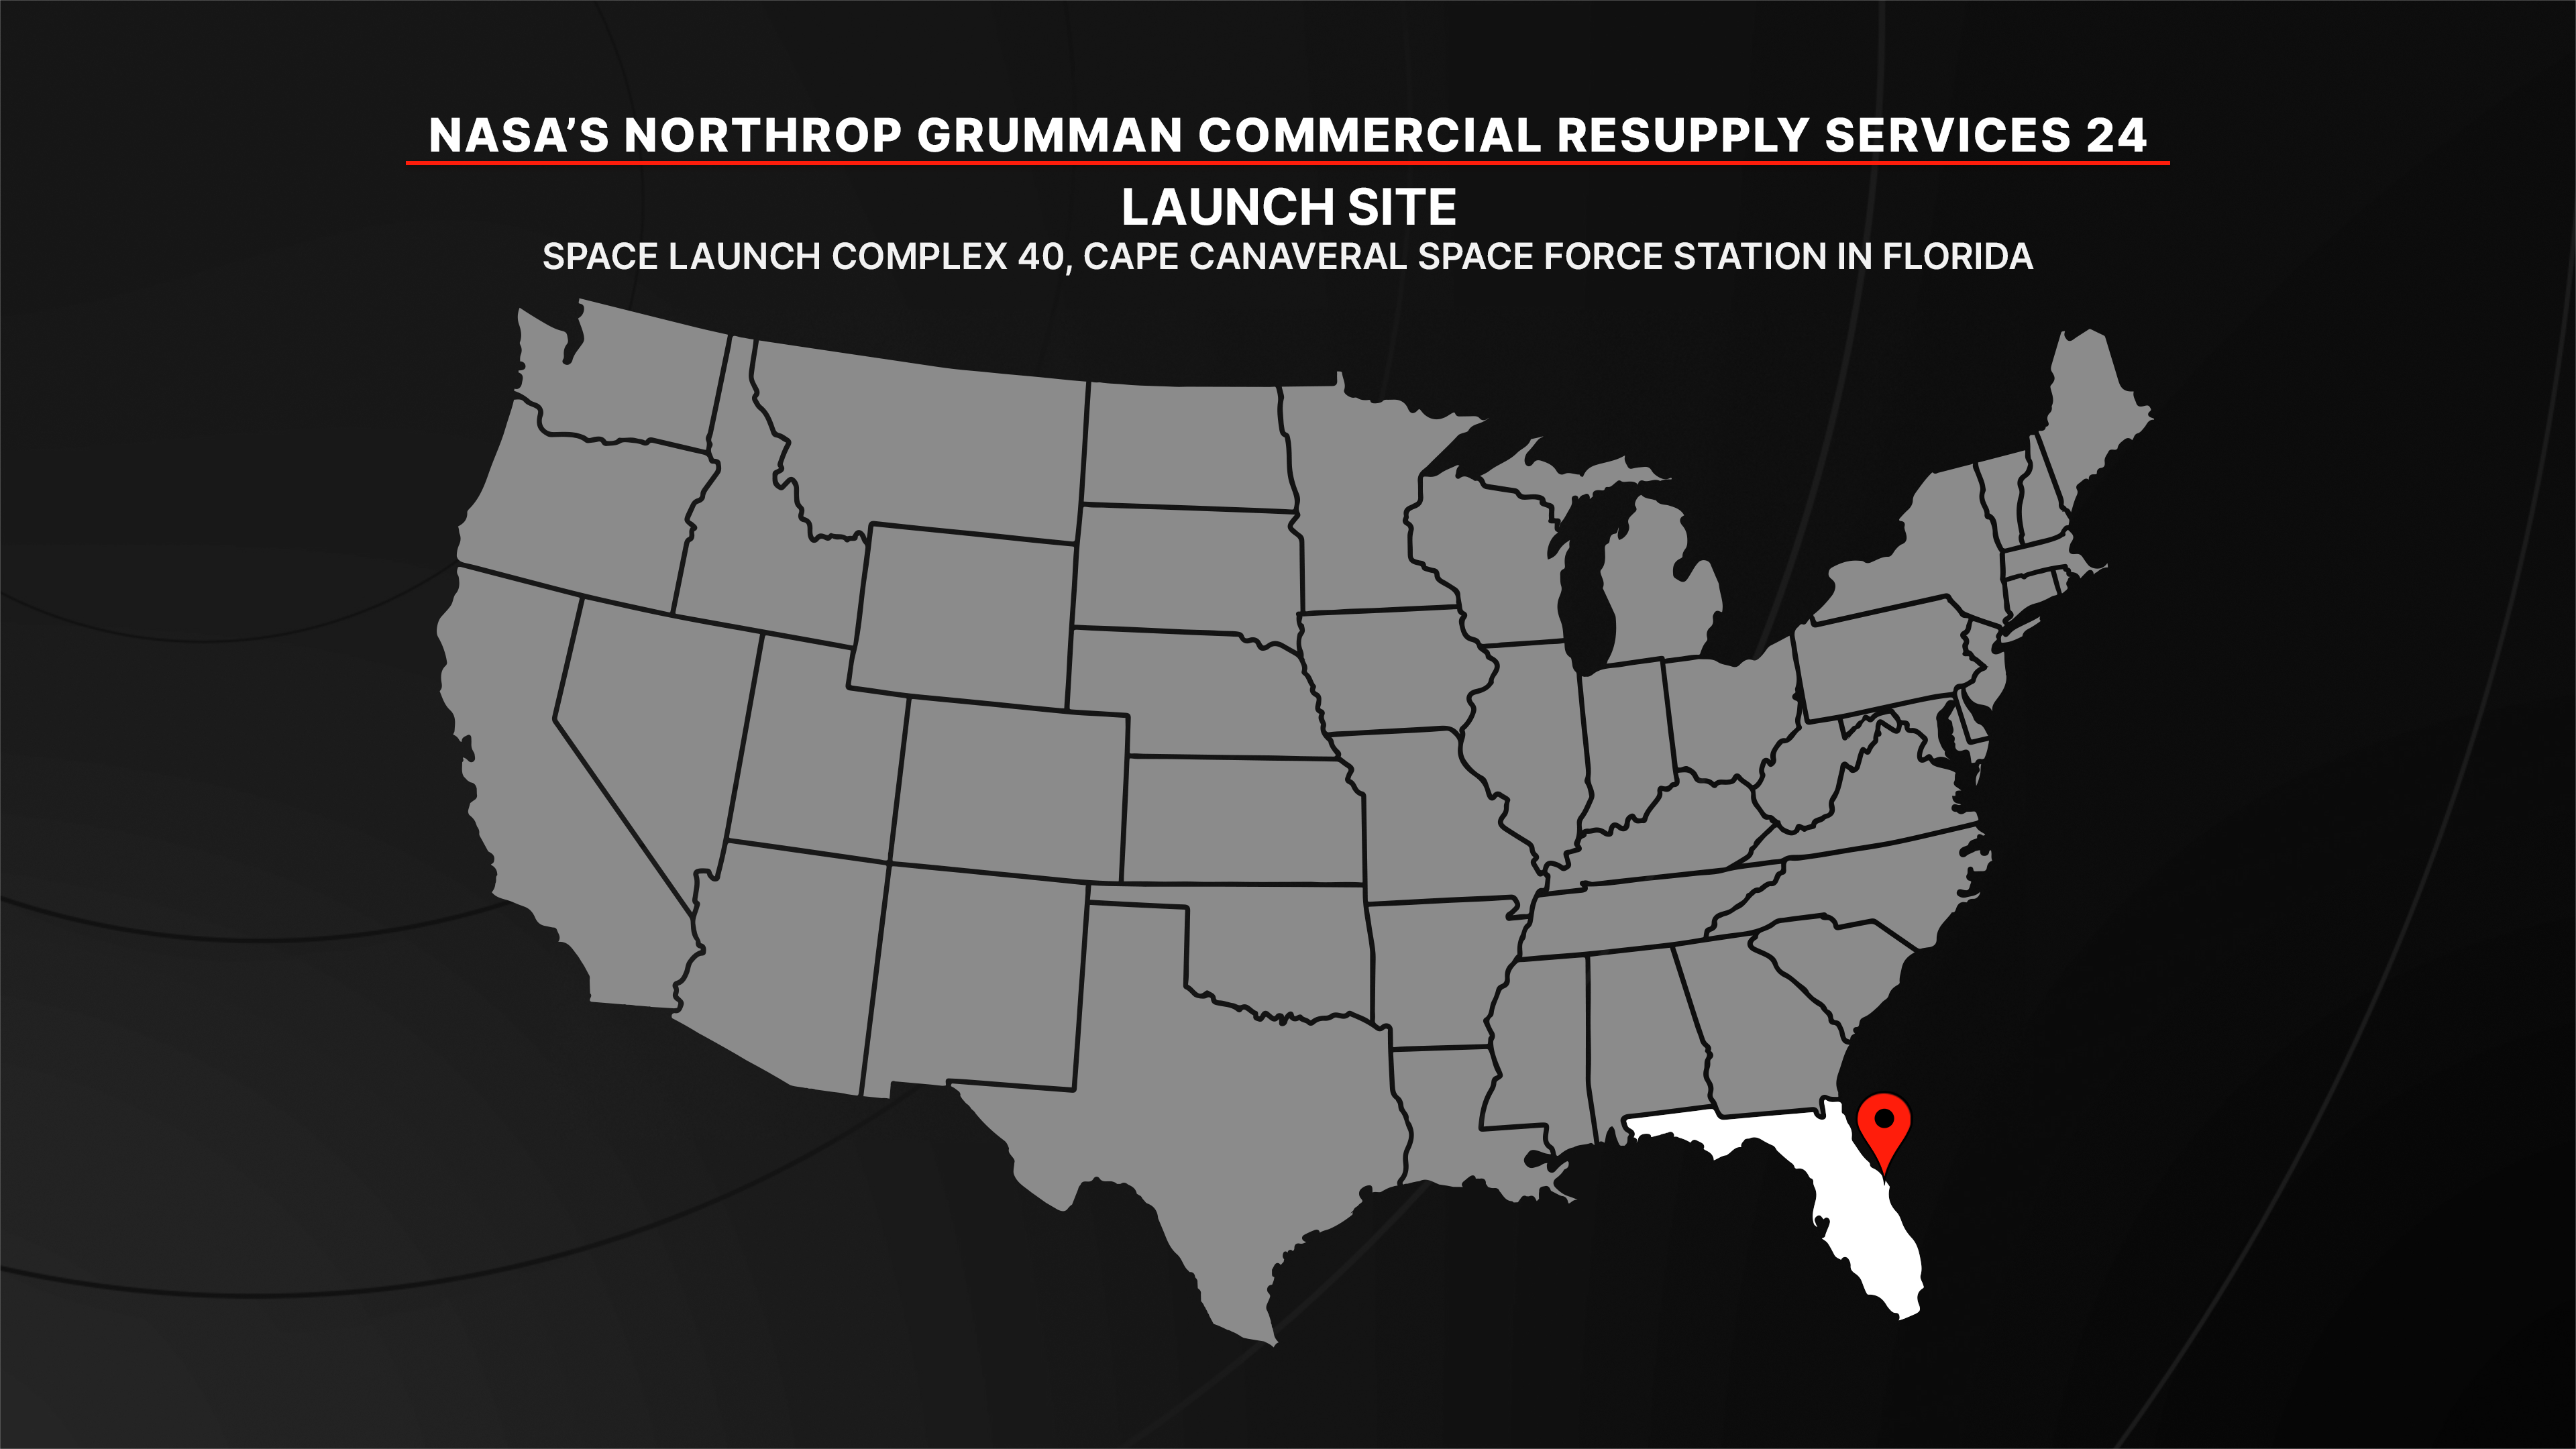
The Cygnus XL will launch on a SpaceX Falcon 9 rocket from the Cape Canaveral Space Force Station in Florida. Following arrival, astronauts aboard the space station will use the Canadarm2 to grapple Cygnus XL before robotically installing the spacecraft to the Unity module’s Earth-facing port for cargo unloading.
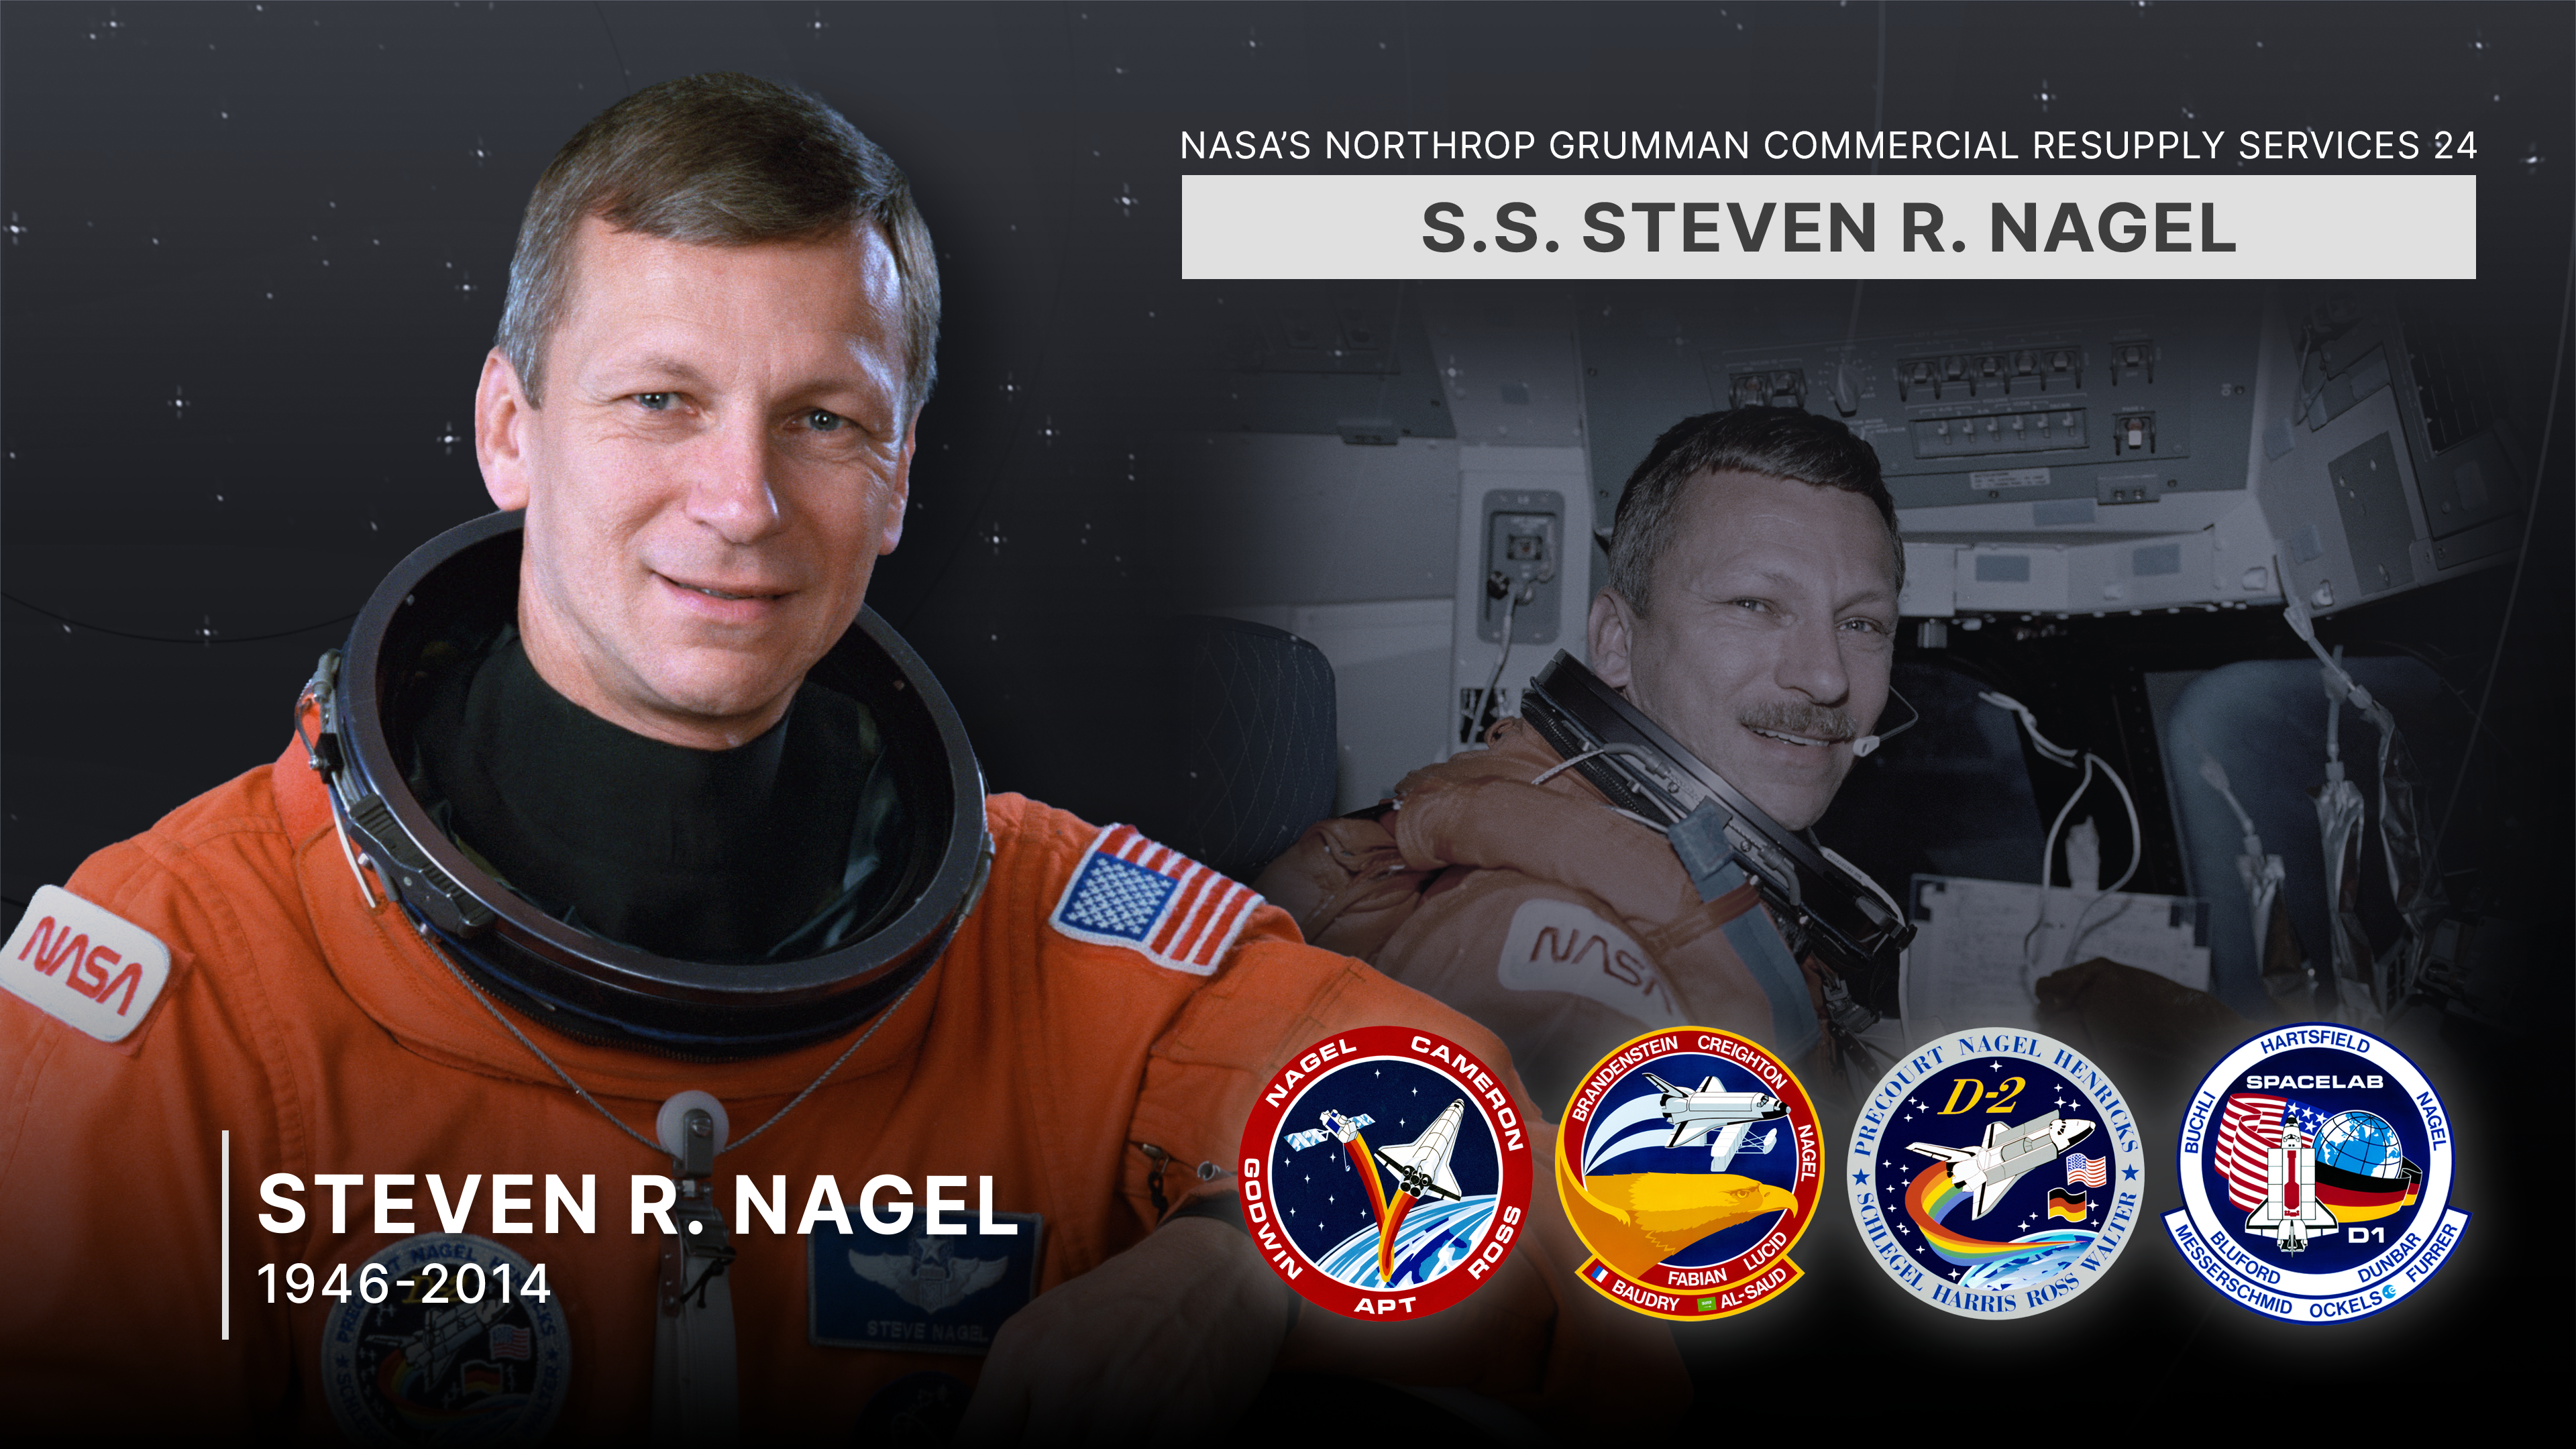
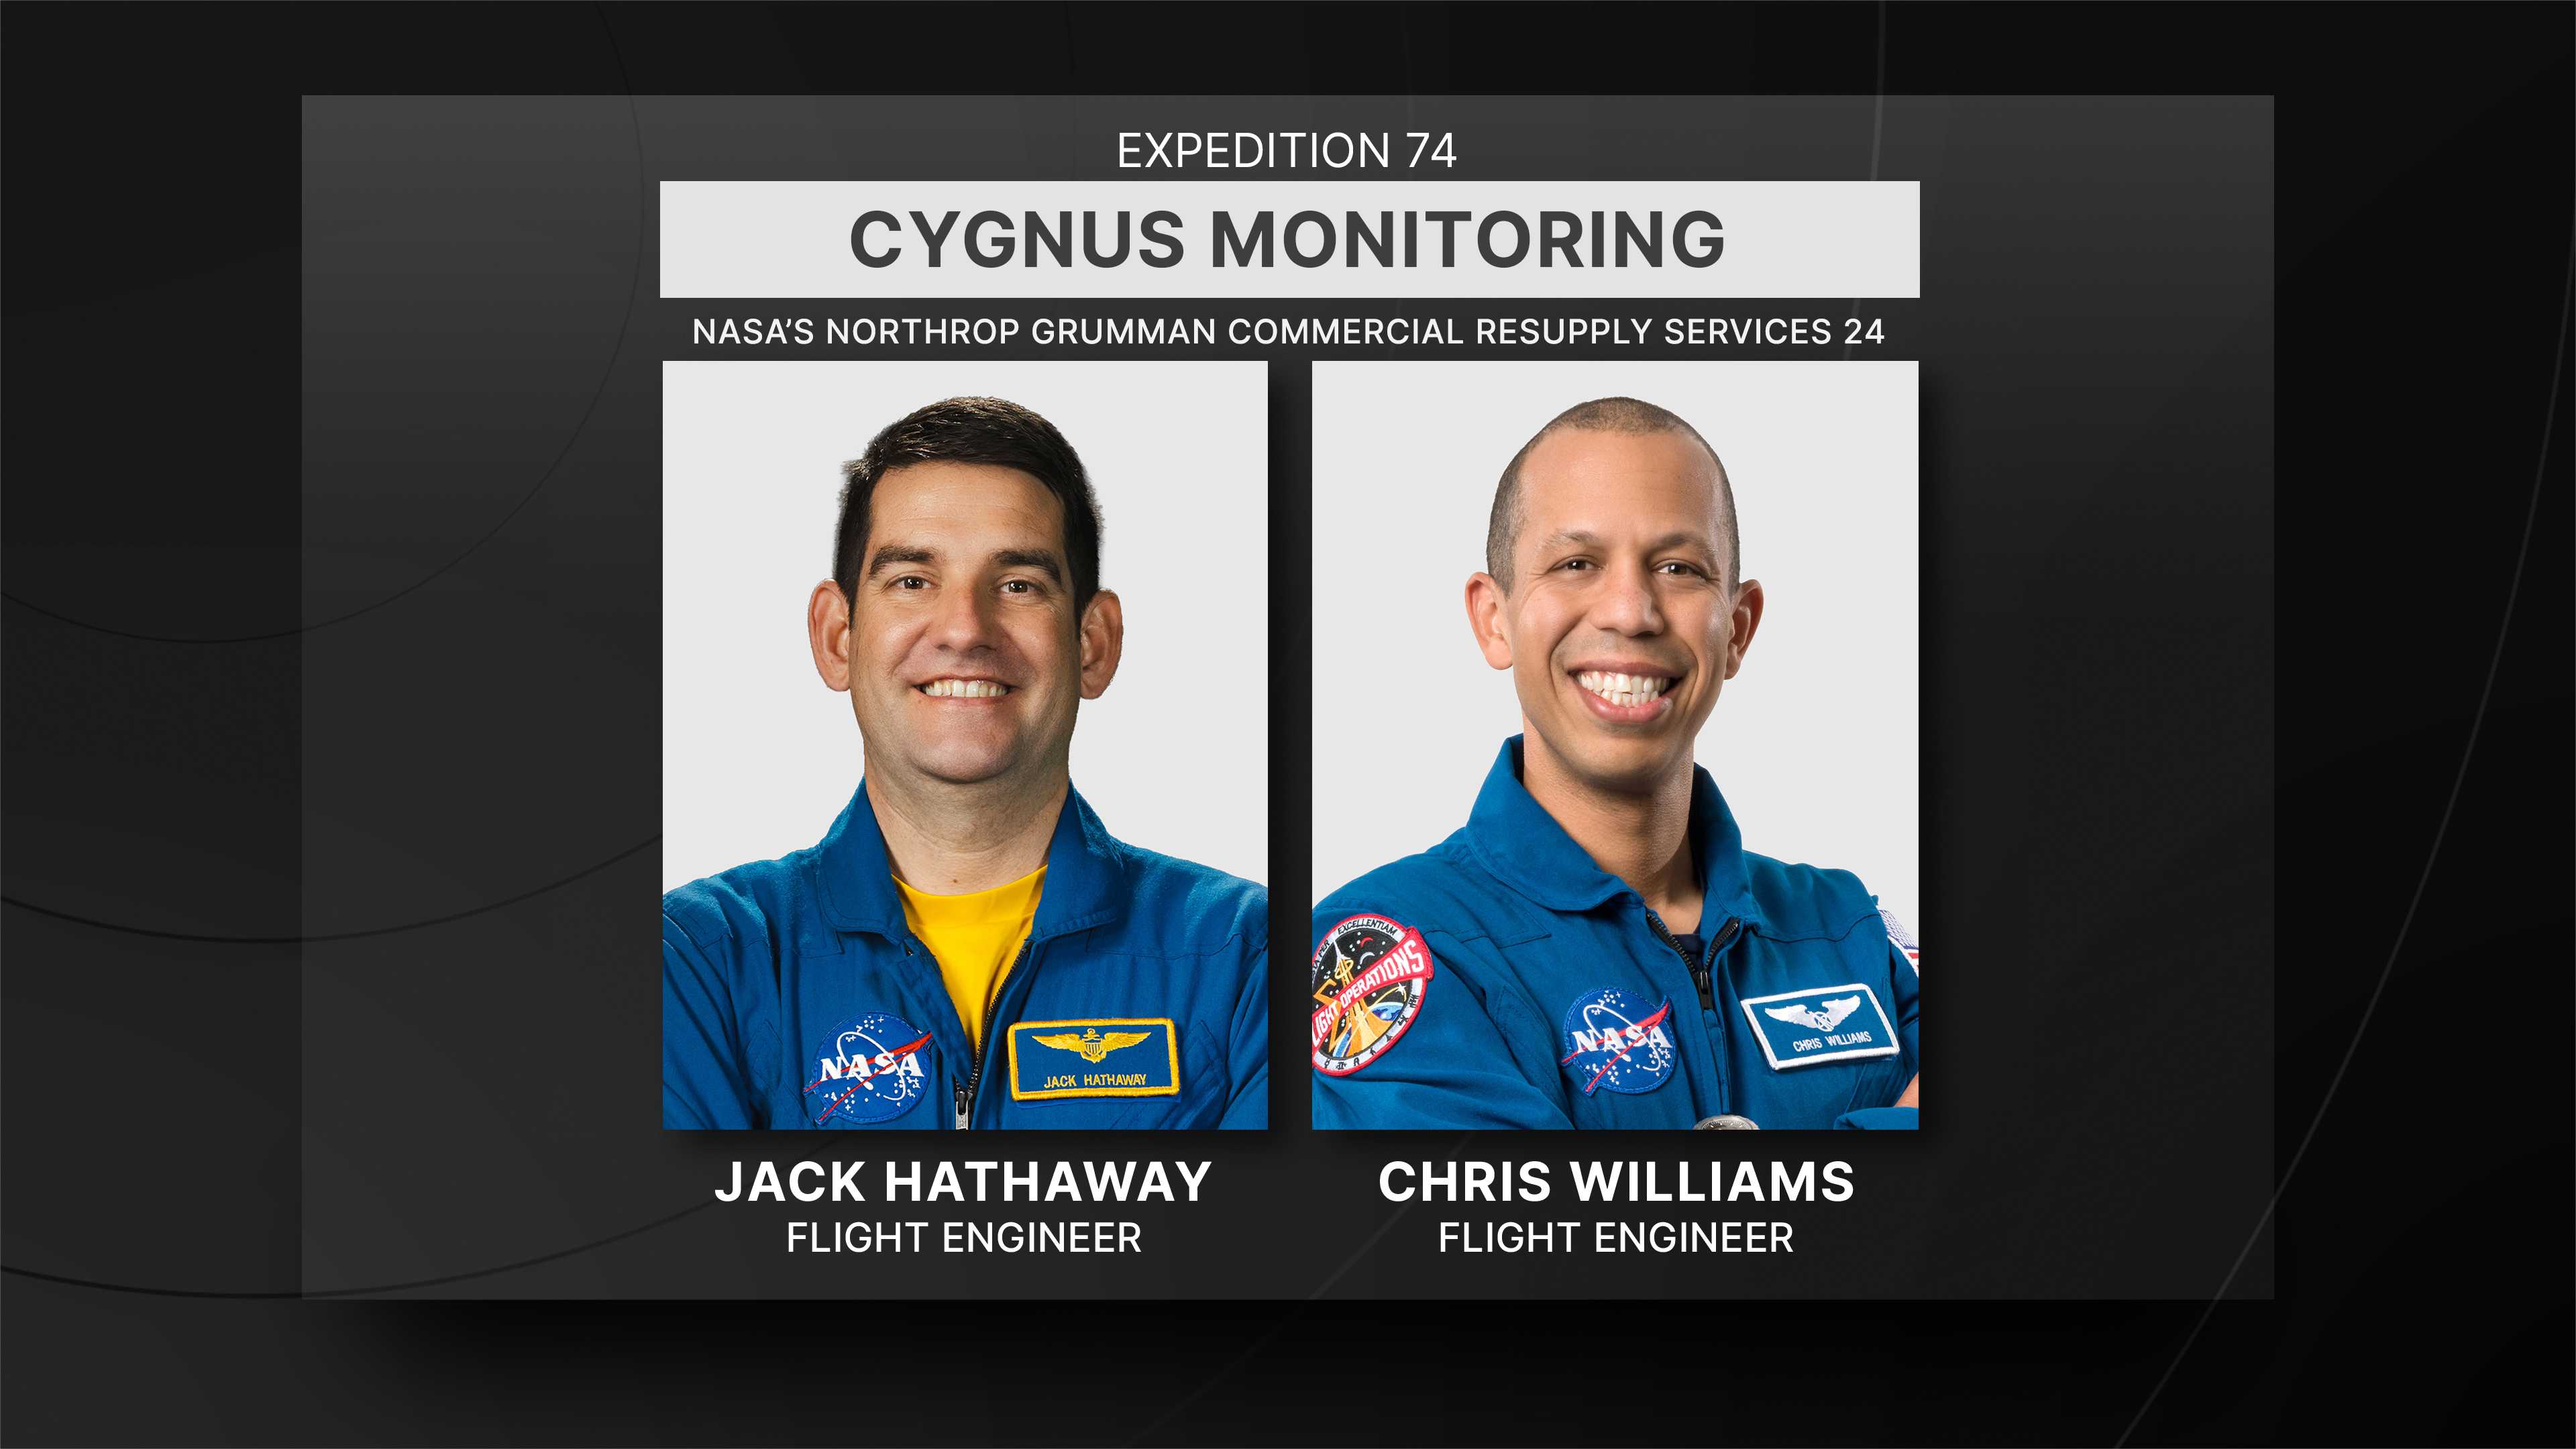
NASA’s Northrop Grumman Commercial Resupply Services 24 mission will launch on a SpaceX Falcon 9 rocket to deliver research and supplies to the International Space Station. NASA NASA’s Northrop Grumman Commercial Resupply Services 24 mission will deliver more than 11,000 pounds of research and supplies to the International Space Station. NASA NASA’s Northrop Grumman Commercial Resupply Mission 24 will launch from Space Launch Complex 40 at Cape Canaveral Space Force Station in Florida. NASA NASA’s Northrop Grumman Commercial Resupply Services 24 spacecraft is named in honor of NASA astronaut Steven Nagel. Selected by NASA in 1979, Nagel is a veteran of four space flights (STS-51G and STS-61AA in 1985, STS37 in 1991, and STS-55 in 1993) and has logged more than 723 hours in space. Nagel died in 2014. NASA astronauts Jack Hathaway and Chris Williams will be on duty during the Cygnus spacecraft’s approach and rendezvous. Hathaway will be at the controls of the Canadarm2 robotic arm ready to capture Cygnus as Williams monitors the spacecraft’s arrival.NASA Science HighlightsAlong with supplies and equipment for the crew, Cygnus XL will deliver a range of scientific investigations to the International Space Station that helps to advance knowledge and technology in support of the Artemis program. This research includes:
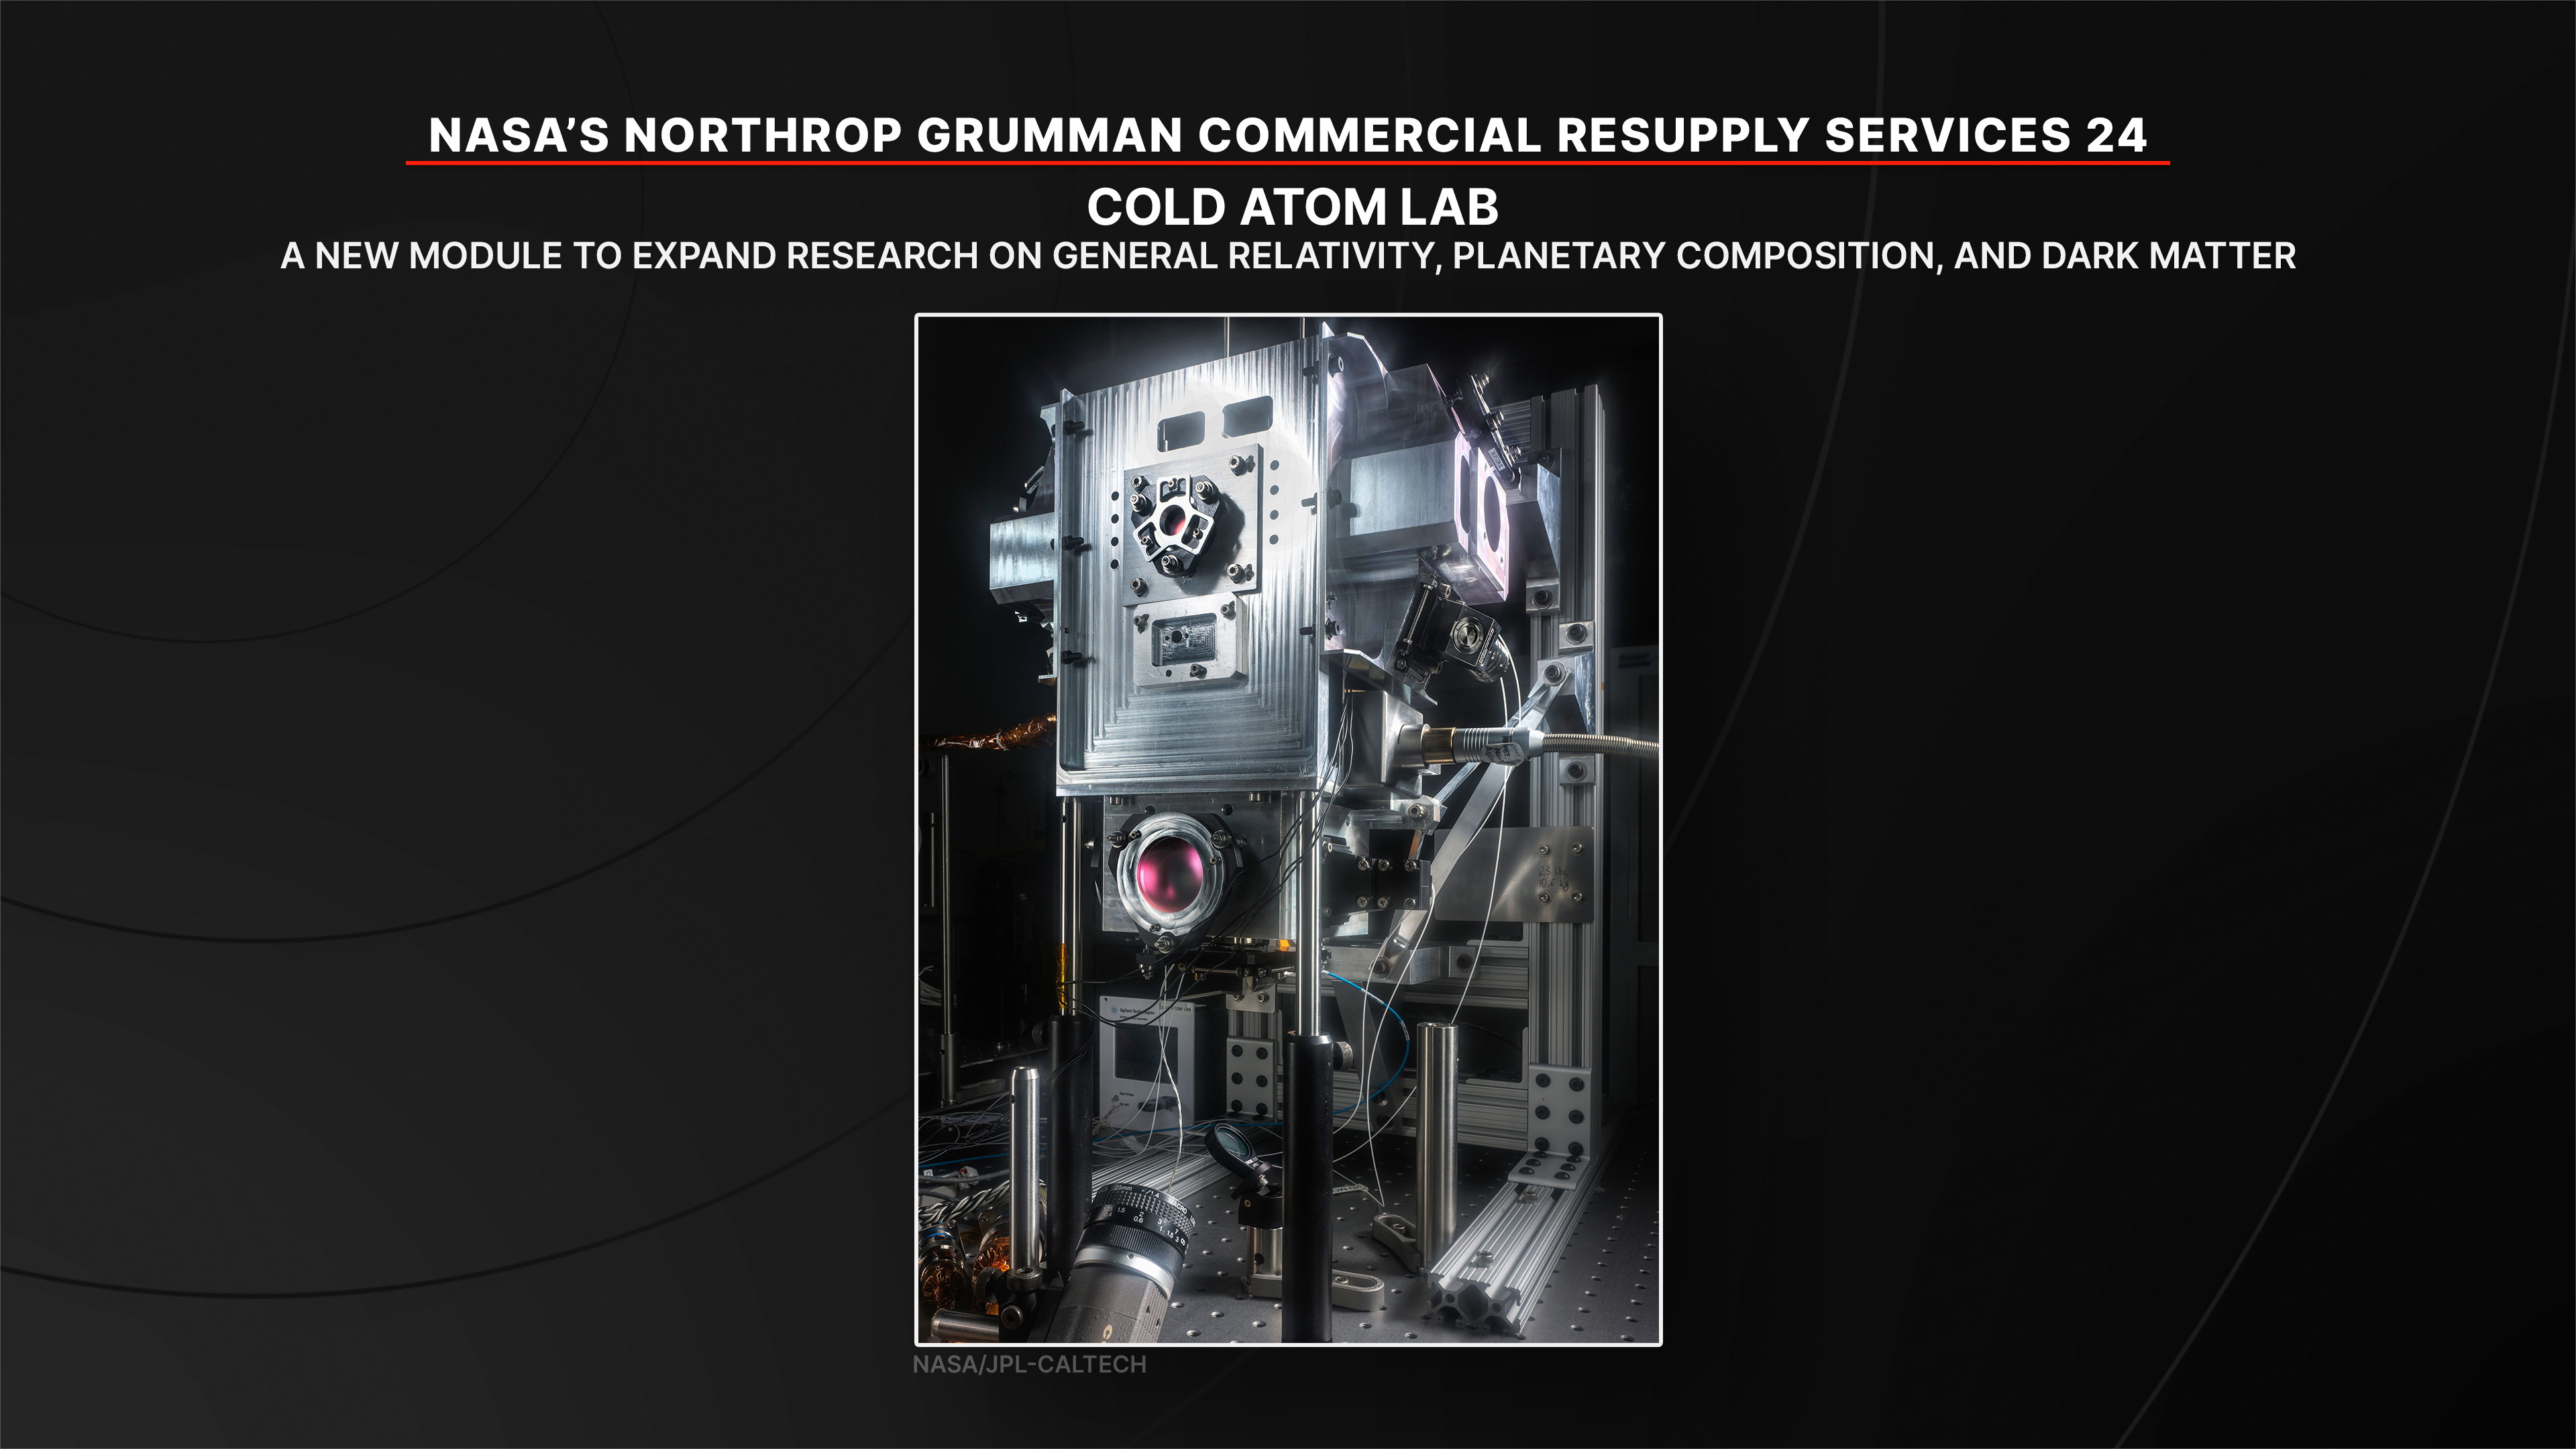
A new module for the Cold Atom Lab to expand its research capabilities and improve our understanding of general relativity, planetary composition, and dark matter. The Cold Atom Lab advances quantum research to improve technologies, such as solar cells, MRI scanners, and components that power phones and computers.
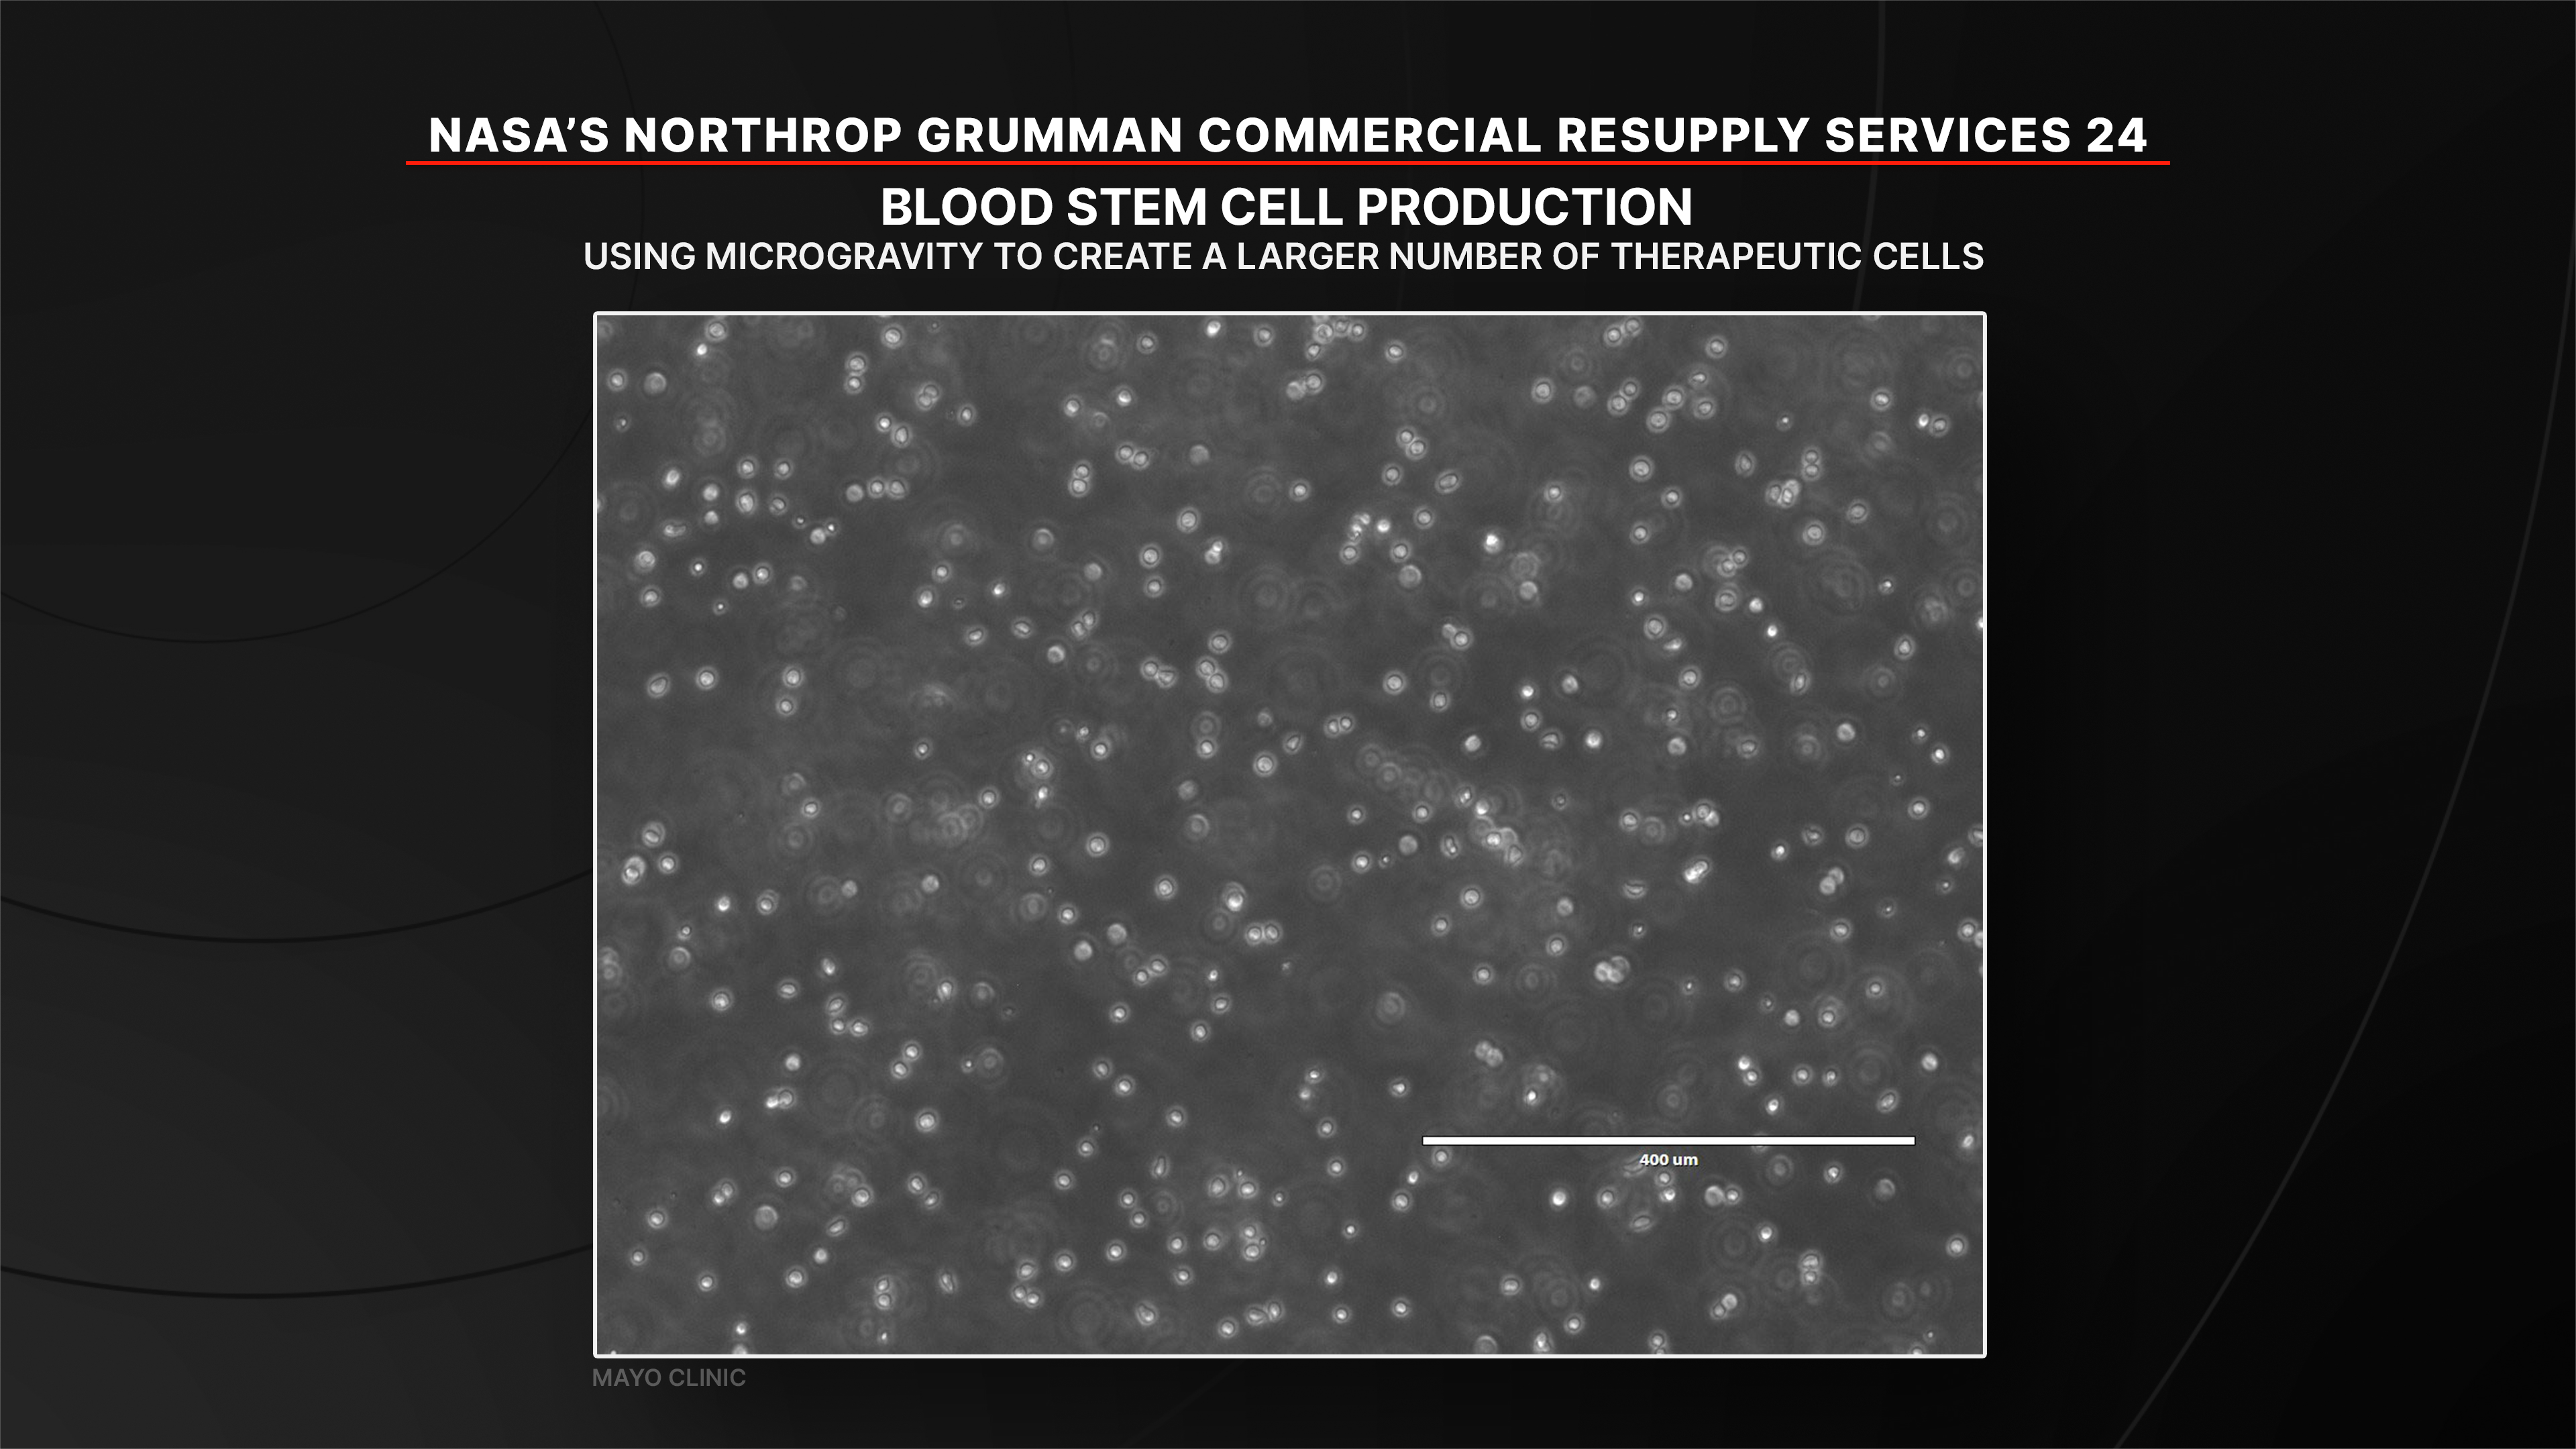
NASAAn investigation (InSPA-StemCellEX-H2) studying blood stem cell production in microgravity to create a larger number of therapeutic cells. Successful stem cell production could advance healthcare on Earth for patients with certain blood diseases and cancers.
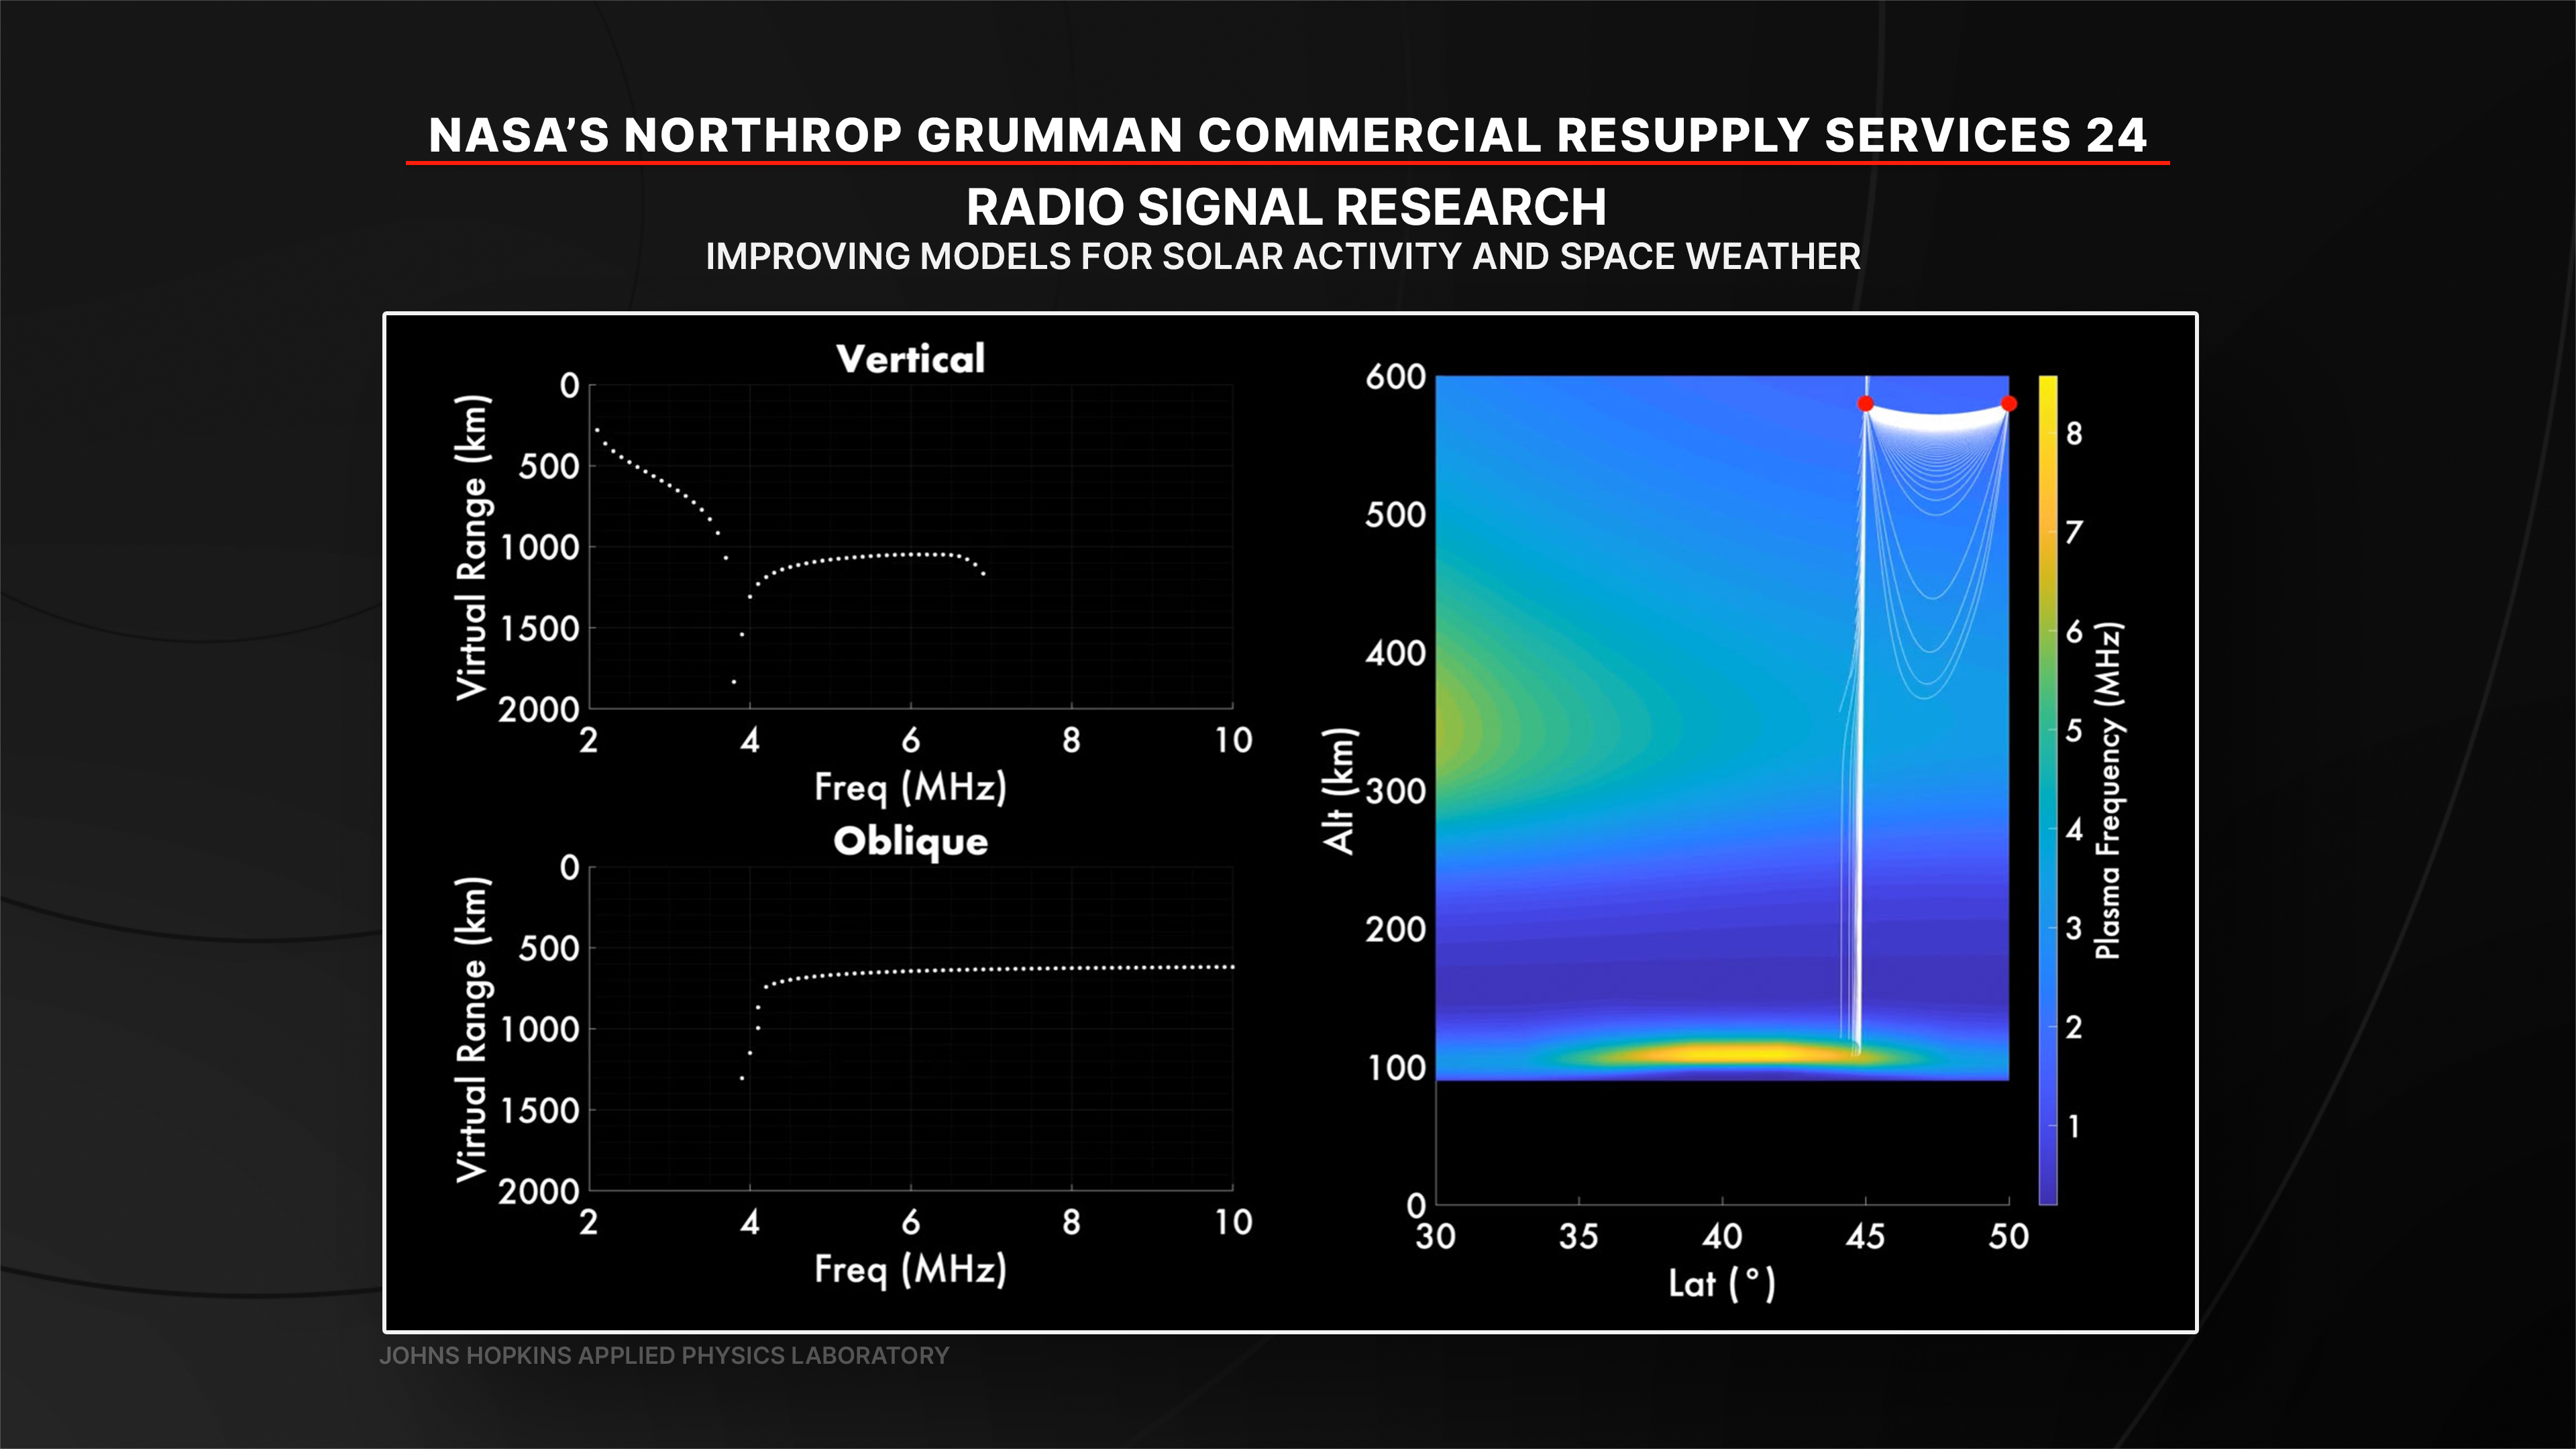
NASAAn investigation (Nanoracks-ITSI) that measures how radio signals sent from Earth change as they pass through the upper atmosphere. These measurements could improve models that predict the impacts of solar activity and space weather, which can disrupt technologies like GPS navigation and radar tracking systems.
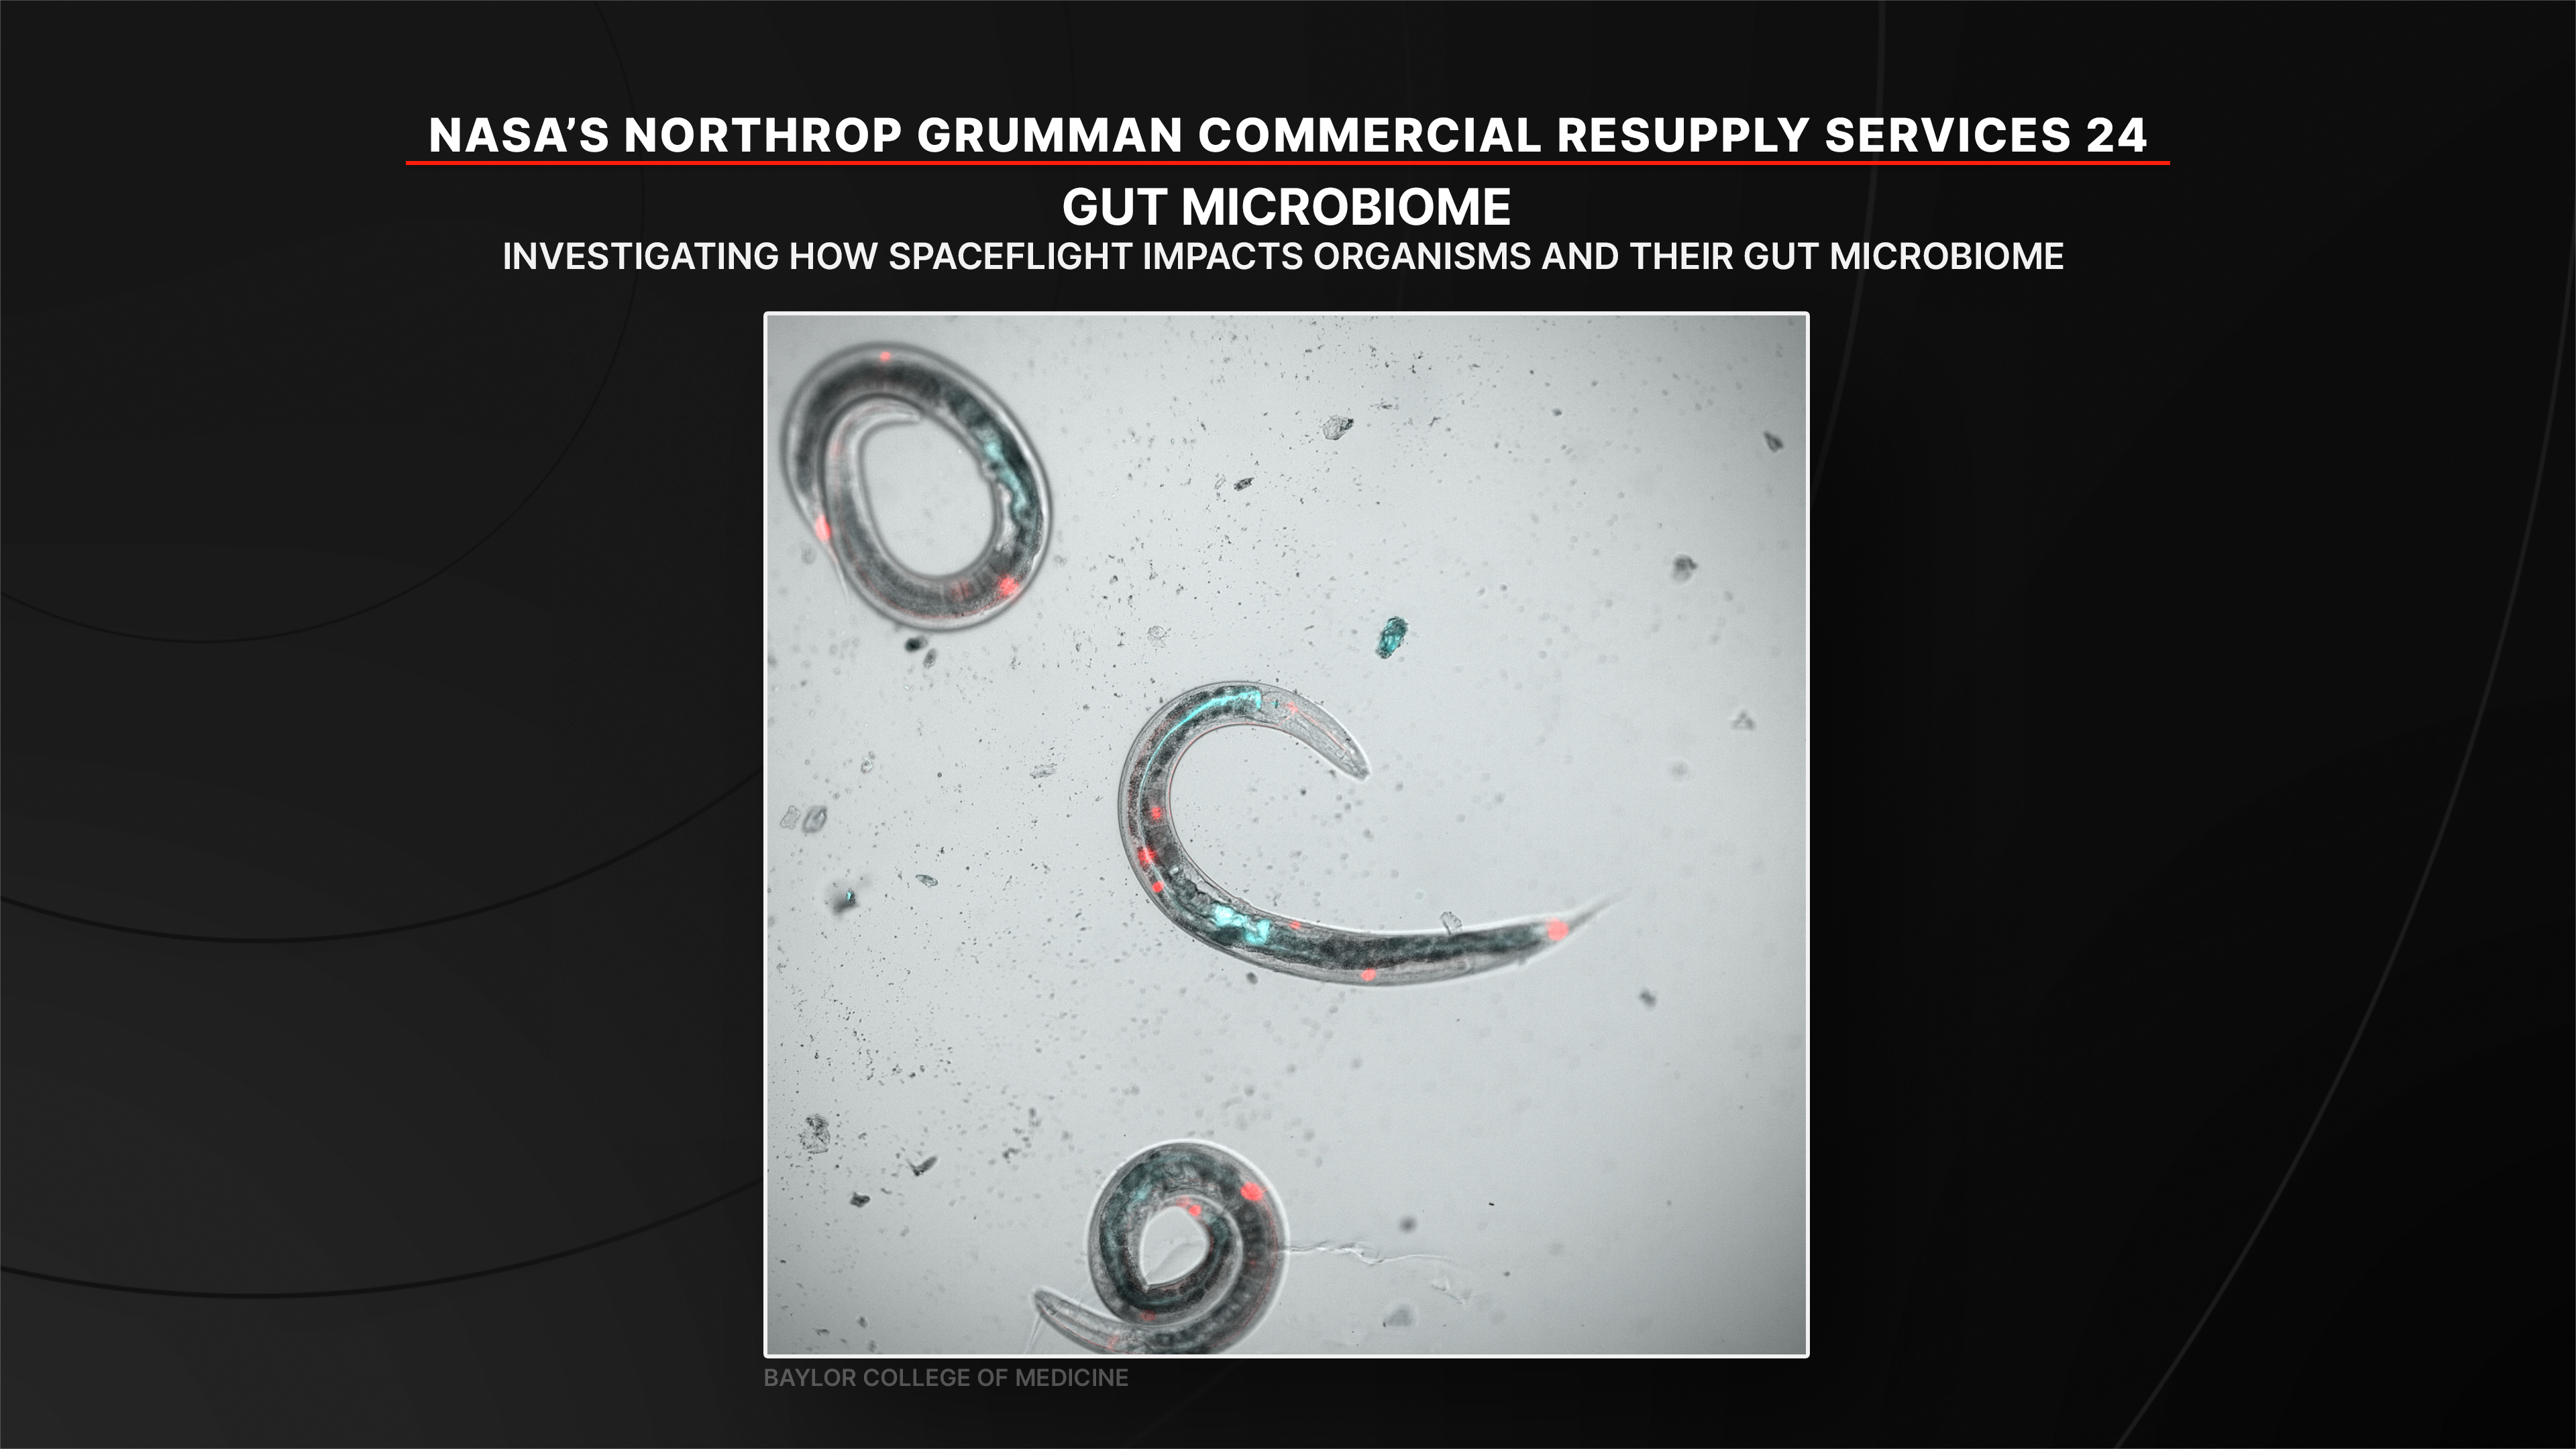
A study (CBIOMES) of how spaceflight impacts the relationship between organisms and their gut microbiome. Researchers will observe changes in roundworms down to the cellular level to identify ways to maintain microbiome stability and help protect astronaut health on future Moon and Mars missions.
Mission HardwareA study (CBIOMES) of how spaceflight impacts the relationship between organisms and their gut microbiome. Researchers will observe changes in roundworms down to the cellular level to identify ways to maintain microbiome stability and help protect astronaut health on future Moon and Mars missions.
- The European Enhanced Exploration Exercise Device is a compact exercise system that help preserve muscle mass and bone health in microgravity. By enabling a broader and more adaptable range of resistance exercises, this device combines cycling, rowing, and resistance training in addition to the ability to perform rope-pulling and climbing movements, even when unpowered. The device was jointly developed by NASA and ESA (European Space Agency).
- The Supplemental Heat Rejection Evaporative Cooler provides heat rejection for the orbiting laboratory in the event of dual thermal control system loop failures. The cooler connects to the vacuum system and multiple onboard water sources to evaporate water through hollow fiber membranes.
- The Ocular Coherence Tomography is a noncontact medical imaging device that uses reflected light to produce detailed cross-sectional and 3D images to actively track the eye during imagery. Tracking eye movement with simultaneous dual-beam imaging minimizes motion artifact, enables noise reduction, and allows the instrument to precisely track changes in crew eye health over time. This unit will replace a degraded unit in orbit
- 8 hatch seal covers, to be installed over current hatch seals
- 2 batteries to support the operations of the Zarya module
- 3 resupply water tanks for the water storage system
- 1 nitrogen tank and 1 oxygen tank, used for recharging spacesuits and maintaining a pressurized environment on space station
- 1 pretreat and water dispenser, a spare unit for the Waste and Hygiene Compartment
Night Sky Network Celebrates Artemis II
1 min read
Night Sky Network Celebrates Artemis IIOn April 6, 2026, the crew of Artemis II reached a milestone, traveling farther than any humans in recorded history, as they orbited the far side of the Moon, roughly 4,000 miles above the lunar surface.
You can rewatch this historic broadcast on NASA’s YouTube channel or on NASA+.
Be sure to celebrate with your communities with the following NSN resources:
- Weird Ways to Observe the Moon
- Why Does the Moon Have Phases?
- Exploring Moon Phases
- Skywatcher’s Guide to the Moon
- Why Doesn’t the Moon Fall to Earth?
- Moon Myths from Around the World
- Apollo at 50 Moon Toolkit
- Can You See The Flag On the Moon?
- Earth Craters and Moon Map
From us here at Night Sky Network, Godspeed Integrity, and the crew of Artemis II!
–Vivian White and Kat Troche
The NASA Night Sky Network Team
Grants
To submit a request, visit NASA General Information Request Form and complete the form. You will receive an automated email with the most commonly requested grant status information.
Important Instructions:
- Ensure you enter a valid email address, as replies will only be sent via email.
- The confirmation email may take a few minutes to arrive in your inbox.
How to Fill Out the Form:
- Category: Select “Procurement including Grants & Cooperative Agreements.”
- Procurement Area: Choose “Grants/Agreements.”
- Grants/Agreements Activity: Select “Grant Status.”
- Required Information: Provide either a Grant Number, Purchase Requisition Number, or both.
Guidance Regarding OMB Memorandum M-25-14 and Recent Temporary Restraining Orders
Update on Diversity, Equity, Inclusion, and Accessibility (DEIA) Executive Orders – January 29, 2025
On January 23, 2025, NASA’s Office of Procurement (OP) released a memorandum for the NASA contractor and grant community regarding Executive Order “Initial Rescission of Harmful Executive Orders and Actions” and the Office of Personnel Management’s (OPM) memorandum “Initial Guidance Regarding DEIA Executive Orders.”
Per OP’s memo, NASA grant and cooperative agreement recipients shall immediately cease and desist all DEIA activities required for their grant. This work may include but is not limited to: DEIA plan requirements, training, workshops, reporting, considerations for staffing, or any other direct or indirect grant activity related to DEIA. All grant recipients shall notify their cognizant Grant Officer if they identify requirements within their grants that are in violation of this guidance. Your Grant Officer’s contact information can be found on your NF 1687, Notice of Award for Grant and Cooperative Agreement (NOA).
Thank you for your work and partnership with NASA.
In FY2025, NASA separated the Terms and Conditions from the GCAM to create a standalone document. This document outlines both the general and specific terms and conditions and applies to all awards issued under 2 CFR 1800 (NASA’s adoption of 2 CFR 200.)
NASA Grant and Cooperative Agreement Terms and Conditions – January 2026
Administrative Supplement Requests Templates :
No Cost Extension (NCE) Request Form
Other Administrative Supplement Request Form
Principal Investigator (PI) Change Request Form
Period of Performance (POP) Change Form
Submit via email to NSSC-ADMIN-SUPPLEMENT REQUEST
PI Transfer Requests:
Submit via email to NSSC-Grants-PI-Transfer
NASA Insignia GuidelinesGrantees are strongly encouraged to use the NASA Insignia Format identified in the guidelines at NASA Insignia Guidelines for NASA Grantees. These guidelines aim to increase awareness of NASA’s mission activities via Grantee partnerships for a broader and more diverse population.
Payment Management SystemNASA uses a service provider, currently the Department of Health and Human Services (HHS) Payment Management System (PMS), to provide Federal funds to recipients. PMS will provide instructions to the recipients for registering and requesting funds through the system.
NASA is responsible for routine post-award monitoring on all awards, regardless of the award’s risk determination. At a minimum, routine monitoring includes reviewing award recipients’ annual performance reports, semi-annual Federal Financial Report (FFR), and Transactions Testing Review.
All NASA award recipients must submit annual performance reports. Annual reports are due to NASA 60 days prior to the annual anniversary of the award’s POP start date (e.g., if the POP of an award is October 1 – September 30, the report would be due 60 days prior to October 1.)
- Final Performance Reports: Submit via email to NSSC-CloseOut@mail.nasa.gov
- Performance Reports: Submit via email to NSSC-Grant-Report@mail.nasa.gov
Recipients will submit their semi-annual FFRs in PMS:
Period 1 (October 1 – March 31): Due by April 30 each year.
Period 2 (April 1 – September 30): Due by October 30 of each year.
Final FFRs are due 120 days after the end of the POP
Additional information and training are available on the Payment Management System website at https://pms.psc.gov/. The PMS help desk number is 1-877-614-5533.
FormsPost-Award Certifications and Representations
Current and Pending Support (CPS) Form
NASA Pre-Award and Post-Award Disclosure Requirements
- Title 2: Grants and Agreements
- 14 CFR 1274: Cooperative Agreements with Commercial Firms (Rescinded January 2021)
- 14 CFR 1275: Research Misconduct
NASA Grant and Cooperative Agreement Manual (GCAM): NASA’s Grant Manual for Proposers and Recipients
The NASA Grant and Cooperative Agreement Manual (GCAM) provides pre and post award policy guidance to NASA proposers and award-managing personnel and award recipients to implement government-wide and NASA-specific regulations for applying for, awarding and administering grants and cooperative agreements with educational and non-profit organizations; State, local, and Indian tribal governments; and for-profit organizations.
NASA Grant and Cooperative Agreement Terms and ConditionsIn FY2025, NASA separated the Terms and Conditions from the GCAM to create a standalone document. This document outlines both the general and specific terms and conditions and applies to all awards issued under 2 CFR 1800 (NASA’s adoption of 2 CFR 200.)
NASA implemented the Federal-wide research terms and conditions for all research and research-related grant and cooperative agreement awards issued under 2 CFR 1800 (NASA’s adoption of 2 CFR 200). The Research Terms and Conditions implement the requirements of the Uniform Guidance and includes three companion documents:
RTC Appendix A: Prior Approval Matrix, RTC Appendix B: Subaward Requirements, and RTC Appendix C: National Policy Requirements).
The Research Terms and Conditions and companion documents are accessible on the NSF website.
NASA Office of Inspector GeneralTo file a complaint regarding denial of equal opportunity or discrimination based on race, color, national origin, sex, disability, or age; go to
https://oig.nasa.gov/hotline.html
1-800-424-9183
300 E Street, S.W. Suite 8V39
Washington, DC 20546-0001
NASA OIG Hotline
http://missionstem.nasa.gov/filing-a-complaint.html
Grants.gov
NSSC Grants Payment Package
NASA Research Opportunities Online (NSPIRES)
System for Award Management (SAM)
The Near Side of the Moon
The astronauts aboard NASA’s Orion spacecraft captured this photo of the Moon’s near side on April 4, 2026. The image features dark patches at center and right; these are ancient lava flows, which are unique to this side of the Moon.
The Artemis II astronauts – astronauts Victor Glover, Reid Wiseman, and Christina Koch of NASA and CSA (Canadian Space Agency) astronaut Jeremy Hansen – are set to fly around the Moon on April 6, 2026. Join us for live coverage of the event, starting at 1 p.m. EDT.
Image credit: NASA
Thinking of You, Earth
On April 4, 2026, NASA astronaut and Artemis II Commander Reid Wiseman peers out of one of the Orion spacecraft’s main cabin windows, looking back at Earth, as the crew travels towards the Moon.
The Artemis II astronauts – Wiseman and fellow NASA astronauts Christina Koch and Victor Glover, and CSA (Canadian Space Agency) astronaut Jeremy Hansen – are now more than two-thirds of the way to the Moon. Follow along on their journey with our photo gallery and 24/7 livestream.
Image credit: NASA
NASA Answers Your Most Pressing Artemis II Questions
Editor’s Note: This article was updated at 5:50 p.m. EDT on Monday, April 6, 2026, to update the times for lunar flyby activities.
Editor’s Note: This article was updated at 1:40 p.m. EDT on Sunday, April 5, 2026, to correct the time for the distance record, and adjust other times for lunar flyby activities.
The first crewed test flight under NASA’s Artemis program is underway. Four Artemis II astronauts are flying aboard NASA’s Orion spacecraft around the Moon and back, as they test how the spacecraft’s systems operate in a deep space environment.
NASA astronauts Reid Wiseman, Victor Glover, and Christina Koch, and CSA (Canadian Space Agency) astronaut Jeremy Hansen lifted off at 6:35 p.m. EDT on April 1 from launch pad 39B at the agency’s Kennedy Space Center in Florida.
Real-time coverage continues throughout the mission on NASA’s YouTube channel. The agency also provides a separate live stream of views from the Orion spacecraft as bandwidth allows, as well as inside the capsule. In addition NASA is providing the latest mission imagery online.
Daily mission status briefings are held live from the agency’s Johnson Space Center in Houston through splashdown, except for Monday, April 6, due to lunar flyby activities. A list of activities is regularly updated online.
The crew are participating in live conversations throughout the mission, which were scheduled prior to their departure from Earth. NASA will provide the exact times of each of these downlink events, as well as the latest mission coverage, on the Artemis blog.
To track Orion in space, visit: nasa.gov/trackartemis
Frequently Asked Questions (all times Eastern):
How long is the Artemis II mission? NASA’s Artemis II mission is an approximately 10-day journey around the Moon including launch, a lunar flyby, and a safe splashdown off the coast of San Diego.
How far will Artemis II travel? Crew is expected to travel a total of 695,081 miles from launch to splashdown. The spacecraft will pass within 4,070 miles of the lunar surface during its closest approach and will reach a maximum distance of 252,760 miles from Earth, about 4,105 miles farther than Apollo 13.
When and where will the Artemis II crew and Orion spacecraft splashdown?
The location and time of our Artemis II splashdown will continue to shift as mission milestones are reached. In the days leading up to splashdown, updates will be available on NASA’s website and in our daily news conferences. Mission media events are available on the agency’s website.
NASA’s Artemis II mission is scheduled to splash down off the coast of San Diego at approximately 8:07 p.m. EDT (5:07 p.m. PDT) on Friday, April 10. Following splashdown, recovery teams will retrieve the crew using helicopters and deliver them to the USS John P. Murtha. Once aboard, the astronauts will undergo post-mission medical evaluations in the ship’s medical bay before traveling back to shore to meet with an aircraft bound for NASA’s Johnson Space Center in Houston.
What is the crew doing on this mission? Artemis II astronauts are putting the Orion spacecraft through a series of planned tests to evaluate systems, procedures, and performance in deep space. They will conduct manual spacecraft operations and monitor automated activities; evaluate Orion’s life-support, propulsion, power, thermal, and navigation systems; perform proximity operations activities; assess habitability and crew interfaces; and participate in science activities, including lunar surface observations and human health studies, that will inform science operations on future Moon missions. They also will practice mission-critical activities, including trajectory adjustments, communications at lunar distances, and piloting Orion during key phases of flight, culminating in a re-entry and splashdown to further validate the spacecraft’s performance with crew aboard.
What can we expect to see during lunar flyby? All times are subject to change. Here’s a rough schedule of activities:
- Live coverage begins at 1 p.m. on Monday, April 6, and continues through 9:45 p.m.
- 1:30 p.m.: NASA hosts a conversation between the crew and the science officer in NASA’s Mission Control Center at the agency’s Johnson Space Center in Houston, to go over the objectives and timeline for the flyby.
- Because the Sun’s angle on the Moon shifts by about one degree every two hours, the crew could not know the exact lighting conditions to expect on the lunar surface until after launch. This briefing provides one final opportunity to review details before the flyby begins.
- 1:56 p.m.: The Artemis II crew is expected surpass the record previously set by the Apollo 13 crew in 1970 for the farthest humans have ever traveled from Earth.
- The Apollo 13 crew traveled 248,655 miles from Earth; Artemis II will reach a maximum distance of 252,760 miles from Earth, surpassing the record by about 4,105 miles. The crew is expected to make remarks on the milestone around 2:10 p.m.
- 2:45 p.m.: The seven-hour lunar observation period begins. Crew will see both the near and far sides of the Moon as the observation period begins.
- Because room at Orion’s windows is limited, the crew will divide into pairs, with two crew members observing for 55 to 85 minutes, while the other pair exercises or works on other tasks.
- 6:44 p.m.: Mission control expects to temporarily lose communication with the crew as Orion passes behind the Moon.
- 7:00 p.m.: Astronauts will make their closest approach to the Moon (4,067 miles), the reach its farthest point from Earth at 7:02 p.m.
- At this distance, the Moon will appear to the astronauts about the size of a basketball held at arm’s length. They also may be the first humans to see some parts of the Moon’s far side with the unaided eye.
- 7:25 p.m.: NASA’s Mission Control Center should re-acquire communication with the astronauts.
- 8:35 p.m.: Orion enters period with Moon eclipsing the Sun and continues until 9:32 p.m.
- 9:20 p.m.: The flyby observation period wraps, and crew will begin transferring some of the imagery to the ground. NASA’s science team will review the images and observations overnight, and then discuss with crew the following day, while the experience is still fresh.
Why do we need astronauts to view the Moon when we have robotic observers? Human eyes and brains are highly sensitive to subtle changes in color, texture, and other surface characteristics. Having astronaut eyes observe the lunar surface directly, in combination with the context of all the advances that scientists have made about the Moon over the last several decades, may uncover new discoveries and a more nuanced appreciation for the features on the surface of the Moon.
Though the crew will not be able to downlink all their imagery before they return to Earth, as much as possible will be made available on the Artemis II Multimedia website. Additional imagery will also be added as it is processed following splashdown.
What do the astronauts eat during the mission? The Artemis II crew has access to 189 unique menu items during their mission, including 10 different beverages like coffee and smoothies. Common food items include tortillas, nuts, barbeque beef brisket, cauliflower, macaroni and cheese, butternut squash, cookies, and chocolate. Food flying aboard Artemis II is designed to support crew health and performance during the mission around the Moon. Menu selections are developed with space food experts and the crew to balance calorie needs, hydration, and nutrient intake while accommodating individual preferences. For more information about their menu, visit here.
What are the goals of the Artemis II Mission? The Artemis II test flight will confirm the systems necessary to support astronauts in deep space exploration and prepare to establish a sustained presence on the Moon. The primary goal of Artemis II is a crewed test flight in lunar space. There are five main additional priorities for Artemis II:
- Crew: Demonstrate the ability of systems and teams to sustain the flight crew in the flight environment, and through their return to Earth.
- Systems: Demonstrate systems and operations essential to a crewed lunar campaign. This ranges from ground systems to hardware in space, and operations spanning from development to launch, flight, and recovery.
- Hardware and Data: Retrieve flight hardware and data, assessing performance for future missions.
- Emergency Operations: Demonstrate emergency system capabilities and validate associated operations to the extent practical, such as abort operations and rescue procedures, as needed.
- Data and Subsystems: Complete additional objectives to verify subsystems and validate data.
Can I talk to the crew aboard Orion during their mission? During their mission, crew will participate in several live and taped downlinks with news outlets, administration officials, and more. These opportunities were allocated prior to their launch. A schedule of these events is available on the agency’s website.
What is the Artemis II zero-gravity indicator and how was it selected? NASA’s Artemis II crew selected Rise as their zero-gravity indicator for the mission. A zero-gravity indicator is a small plush item that flies along with a crew to visually indicate when they are in space. Rise was designed by Lucas Ye from Mountain View, California, as a tribute to the iconic Earthrise moment from the Apollo 8 mission, which deeply resonated with the crew. Rise was fabricated by NASA’s Thermal Blanket Lab at the Goddard Space Flight Center in Greenbelt, Maryland. NASA worked with the company Freelancer to hold a Moon Mascot Design Challenge to design the zero-gravity indicator for Artemis II, which drew more than 2,600 submissions from more than 50 countries, including from K-12 students.
How many cameras are installed on the Orion spacecraft? Orion is carrying 32 cameras and devices, including any instrument with a lens capable of capturing photos or video, inside or on the exterior of the vehicle. The systems support engineering, navigation, crew monitoring, and a range of lunar science and outreach activities. Fifteen cameras are mounted directly to the spacecraft, and 17 are handheld cameras operated by the crew.
Who are the capsule communicators, or capcoms, for the Artemis II mission inside NASA’s Mission Control Center in Florida?
DatePhaseCapcom(s)April 1AscentStanley Love, Jacki Mahaffey Orbit 1Amy Dill, Raja ChariApril 2Orbit 1Chris Birch, Jenni Gibbons Orbit 2Mike Sovinsky, Daniel Surber, Marc Reagan, Sandra Moore Orbit 3Stanley Love, Tracey Caldwell DysonApril 3Orbit 1Chris Birch, Jenni Gibbons Orbit 2Jacki Mahaffey, Tracy Caldwell Dyson Orbit 3Mike Sovinsky, Tess CaswellApril 4Orbit 1Matthew Dunne, Jenni Gibbons Orbit 2Sandra Moore, Jacki Mahaffey Orbit 3Mike SovinskyApril 5Orbit 1Tess Caswell, Jenni Gibbons Orbit 2Marc Reagan, Jacki Mahaffey Orbit 3Mike Sovinsky, Mark BowmanApril 6Orbit 1Stanley Love, Jenni Gibbons Orbit 2Tess Caswell, Andre Douglas Orbit 3Amy Dill, Daniel SurberApril 7Orbit 1Stanley Love Orbit 2Daniel Surber, Tess Caswell Orbit 3Sandra Moore, Amy DillApril 8Orbit 1Akihiko Hoshide, Stanley Love, Tracey Caldwell Dyson Orbit 2Jenni Gibbons, Raja Chari, Randolph Bresnik Orbit 3Marc Reagan, Andre DouglasApril 9Orbit 1Sandra Moore, Jacki Mahaffey, Stanley Love Orbit 2Amy Dill, Nichole Ayers Orbit 3Marc Reagan, Matthew DunneApril 10Orbit 1Stanley Love, Jacki Mahaffey Orbit 2N/A Orbit 3Daniel Surber, Tess CaswellArtemis Program FAQs
Artemis II will travel around the Moon but will not land on its surface. Why is this mission so important? The Artemis II test flight is NASA’s first crewed Artemis mission. Astronauts on their first flight aboard NASA’s Orion spacecraft will confirm the spacecraft’s systems operate as designed with crew aboard in the actual environment of deep space. The unique Artemis II mission profile builds on the uncrewed Artemis I flight test by demonstrating a broad range of SLS (Space Launch System) and Orion capabilities needed on deep space missions. This mission will verify Orion’s life support systems can sustain astronauts on longer-duration missions ahead and allow the crew to practice operations essential to Artemis III and beyond.
What is the next mission for NASA’s Artemis program and the agency? NASA is aligning agencywide initiatives to achieve President Donald J. Trump’s National Space Policy and advance American leadership in space. During an Ignition event on March 24 at the agency’s headquarters in Washington. Among the updates, NASA is prioritizing the Artemis program launch cadence, a robust U.S. presence in low Earth orbit, the creation of a Moon Base, breakthrough science, space nuclear power and propulsion, and investment in the NASA workforce to deliver on the agency’s mission with urgency. Learn more on the agency’s website: https://www.nasa.gov/ignition.
For more information about the Artemis mission, visit:
Illuminated in Orion
NASA astronaut Christina Koch reads on a tablet in the dimly lit Orion crew capsule in this April 3, 2026, photo. To the right of the image’s center, CSA (Canadian Space Agency) astronaut Jeremy Hansen is seen in profile peering out of one of Orion’s windows. Lights are turned off to avoid glare on the windows.
On the third day of the Artemis II mission, the astronauts began preparing Orion’s cabin for lunar flyby. They also exercised, practiced medical response procedures, and tested the spacecraft’s emergency communications system in deep space.
Keep up with the astronauts’ activities by reading the Artemis blog and watching NASA’s 24/7 live feed.
Image credit: NASA
NASA Sets Coverage for Northrop Grumman’s CRS-24 Resupply Launch
NASA, Northrop Grumman, and SpaceX are targeting no earlier than 8:49 a.m. EDT on Wednesday, April 8, for the next launch delivering science investigations, supplies, and equipment to the International Space Station.
Filled with approximately 11,000 pounds of cargo, the Northrop Grumman Cygnus XL spacecraft, aboard a SpaceX Falcon 9 rocket, will launch from Space Launch Complex 40 at Cape Canaveral Space Force Station in Florida. The mission is known as NASA’s Northrop Grumman Commercial Resupply Services 24, or Northrop Grumman CRS-24.
Watch the agency’s launch and arrival coverage on NASA+, Amazon Prime, and the agency’s YouTube channel. Learn how to watch NASA content through a variety of online platforms, including social media.
Following launch, astronauts aboard the space station will use the Canadarm2 robotic arm to capture the Cygnus XL on Friday, April 10, before ground controllers install it to the Unity module’s Earth-facing port for cargo unloading.
Highlights of space station research and technology demonstrations being delivered aboard this Cygnus XL spacecraft include:
- A new module for the Cold Atom Lab to advance quantum science that could improve computing technology and aid in the search for dark matter
- Hardware to produce a greater number of therapeutic stem cells for blood diseases and cancer
- Model organisms to study the gut microbiome
- A receiver that could enhance space weather models that protect critical space infrastructure such as GPS and radar
Media interested in speaking to a science subject matter expert should contact Sandra Jones at sandra.p.jones@nasa.gov.
The spacecraft is scheduled to remain at the orbiting laboratory until October before departing with several thousand pounds of trash and burning up harmlessly during re-entry.
Northrop Grumman named the spacecraft the S.S. Steven R. Nagel in honor of the former NASA astronaut who flew four space shuttle missions, logging more than 720 hours in space.
NASA’s mission coverage is as follows (all times Eastern; subject to change based on real-time operations):
Wednesday, April 8
8:30 a.m.: Launch coverage begins on NASA+, Amazon Prime, and YouTube.
8:49 a.m.: Launch
Friday, April 10
12:30 a.m.: Arrival coverage begins on NASA+, Amazon Prime, and YouTube.
1:10 a.m.: Capture
NASA website launch coverage
Launch day coverage of the mission will be available on the NASA website. Coverage will include live streaming and blog updates beginning no earlier than 8:30 a.m. April 8 as the countdown milestones occur.
On-demand streaming video on NASA+ and photos of the launch will be available shortly after liftoff. For questions about countdown coverage, contact NASA’s Kennedy Space Center in Florida newsroom at 321-867-2468. Follow countdown coverage on our International Space Station blog for updates.
Attend launch virtually
Members of the public can register to attend this launch virtually. NASA’s virtual guest program for this mission also includes curated launch resources, notifications about related opportunities or changes, and a stamp for the NASA virtual guest passport following launch.
Watch, engage on social media
Let people know you’re watching the mission on X, Facebook, and Instagram by following and tagging these accounts:
X: @NASA, @NASASpaceOps, @NASAKennedy, @Space_Station, @ISS_CASIS
Facebook: NASA, NASAKennedy, ISS, ISS National Lab
Instagram: @NASA, @NASAKennedy, @ISS, @ISSNationalLab
Learn more about the mission at:
https://www.nasa.gov/event/nasas-northrop-grumman-crs-24/
-end-
Josh Finch
Headquarters, Washington
202-358-1100
joshua.a.finch@nasa.gov
Amanda Griffin
Kennedy Space Center, Fla.
321-876-2468
amanda.a.griffin@nasa.gov
Sandra Jones
Johnson Space Center, Houston
281-483-5111
sandra.p.jones@nasa.gov