
Feed aggregator
Fewer than half the calories grown on farms now reach our plates
Fewer than half the calories grown on farms now reach our plates
Astronomers Map Stellar ‘Polka Dots’ Using NASA’s TESS, Kepler
5 min read
Astronomers Map Stellar ‘Polka Dots’ Using NASA’s TESS, KeplerScientists have devised a new method for mapping the spottiness of distant stars by using observations from NASA missions of orbiting planets crossing their stars’ faces. The model builds on a technique researchers have used for decades to study star spots.
By improving astronomers’ understanding of spotty stars, the new model — called StarryStarryProcess — can help discover more about planetary atmospheres and potential habitability using data from telescopes like NASA’s upcoming Pandora mission.
“Many of the models researchers use to analyze data from exoplanets, or worlds beyond our solar system, assume that stars are uniformly bright disks,” said Sabina Sagynbayeva, a graduate student at Stony Brook University in New York. “But we know just by looking at our own Sun that stars are more complicated than that. Modeling complexity can be difficult, but our approach gives astronomers an idea of how many spots a star might have, where they are located, and how bright or dark they are.”
A paper describing StarryStarryProcess, led by Sagynbayeva, published Monday, August 25, in The Astrophysical Journal.
Watch to learn how a new tool uses data from exoplanets, worlds beyond our solar system, to tell us about their polka-dotted stars.NASA’s Goddard Space Flight Center Download images and videos through NASA’s Scientific Visualization Studio.
NASA’s TESS (Transiting Exoplanet Survey Satellite) and now-retired Kepler Space Telescope were designed to identify planets using transits, dips in stellar brightness caused when a planet passes in front of its star.
These measurements reveal how the star’s light varies with time during each transit, and astronomers can arrange them in a plot astronomers call a light curve. Typically, a transit light curve traces a smooth sweep down as the planet starts passing in front of the star’s face. It reaches a minimum brightness when the world is fully in front of the star and then rises smoothly as the planet exits and the transit ends.
By measuring the time between transits, scientists can determine how far the planet lies from its star and estimate its surface temperature. The amount of missing light from the star during a transit can reveal the planet’s size, which can hint at its composition.
Every now and then, though, a planet’s light curve appears more complicated, with smaller dips and peaks added to the main arc. Scientists think these represent dark surface features akin to sunspots seen on our own Sun — star spots.
The Sun’s total number of sunspots varies as it goes through its 11-year solar cycle. Scientists use them to determine and predict the progress of that cycle as well as outbreaks of solar activity that could affect us here on Earth.
Similarly, star spots are cool, dark, temporary patches on a stellar surface whose sizes and numbers change over time. Their variability impacts what astronomers can learn about transiting planets.
Scientists have previously analyzed transit light curves from exoplanets and their host stars to look at the smaller dips and peaks. This helps determine the host star’s properties, such as its overall level of spottiness, inclination angle of the planet’s orbit, the tilt of the star’s spin compared to our line of sight, and other factors. Sagynbayeva’s model uses light curves that include not only transit information, but also the rotation of the star itself to provide even more detailed information about these stellar properties.
To view this video please enable JavaScript, and consider upgrading to a web browser that supports HTML5 video
This artist’s concept illustrates the varying brightness of star with a transiting planet and several star spots.NASA’s Goddard Space Flight Center“Knowing more about the star in turn helps us learn even more about the planet, like a feedback loop,” said co-author Brett Morris, a senior software engineer at the Space Telescope Science Institute in Baltimore. “For example, at cool enough temperatures, stars can have water vapor in their atmospheres. If we want to look for water in the atmospheres of planets around those stars — a key indicator of habitability — we better be very sure that we’re not confusing the two.”
To test their model, Sagynbayeva and her team looked at transits from a planet called TOI 3884 b, located around 141 light-years away in the northern constellation Virgo.
Discovered by TESS in 2022, astronomers think the planet is a gas giant about five times bigger than Earth and 32 times its mass.
The StarryStarryProcess analysis suggests that the planet’s cool, dim star — called TOI 3384 — has concentrations of spots at its north pole, which also tips toward Earth so that the planet passes over the pole from our perspective.
Currently, the only available data sets that can be fit by Sagynbayeva’s model are in visible light, which excludes infrared observations taken by NASA’s James Webb Space Telescope. But NASA’s upcoming Pandora mission will benefit from tools like this one. Pandora, a small satellite developed through NASA’s Astrophysics Pioneers Program, will study the atmospheres of exoplanets and the activity of their host stars with long-duration multiwavelength observations. The Pandora mission’s goal is to determine how the properties of a star’s light differs when it passes through a planet’s atmosphere so scientists can better measure those atmospheres using Webb and other missions.
“The TESS satellite has discovered thousands of planets since it launched in 2018,” said Allison Youngblood, TESS project scientist at NASA’s Goddard Space Flight Center in Greenbelt, Maryland. “While Pandora will study about 20 worlds, it will advance our ability to pick out which signals come from stars and which come from planets. The more we understand the individual parts of a planetary system, the better we understand the whole — and our own.”
Facebook logo @NASAUniverse @NASAUniverse Instagram logo @NASAUniverseBy Jeanette Kazmierczak
NASA’s Goddard Space Flight Center, Greenbelt, Md.
Media Contact:
Alise Fisher
202-358-2546
alise.m.fisher@nasa.gov
NASA Headquarters, Washington
Astronomers Map Stellar ‘Polka Dots’ Using NASA’s TESS, Kepler
5 min read
Astronomers Map Stellar ‘Polka Dots’ Using NASA’s TESS, KeplerScientists have devised a new method for mapping the spottiness of distant stars by using observations from NASA missions of orbiting planets crossing their stars’ faces. The model builds on a technique researchers have used for decades to study star spots.
By improving astronomers’ understanding of spotty stars, the new model — called StarryStarryProcess — can help discover more about planetary atmospheres and potential habitability using data from telescopes like NASA’s upcoming Pandora mission.
“Many of the models researchers use to analyze data from exoplanets, or worlds beyond our solar system, assume that stars are uniformly bright disks,” said Sabina Sagynbayeva, a graduate student at Stony Brook University in New York. “But we know just by looking at our own Sun that stars are more complicated than that. Modeling complexity can be difficult, but our approach gives astronomers an idea of how many spots a star might have, where they are located, and how bright or dark they are.”
A paper describing StarryStarryProcess, led by Sagynbayeva, published Monday, August 25, in The Astrophysical Journal.
Watch to learn how a new tool uses data from exoplanets, worlds beyond our solar system, to tell us about their polka-dotted stars.NASA’s Goddard Space Flight Center
Download images and videos through NASA’s Scientific Visualization Studio.
NASA’s TESS (Transiting Exoplanet Survey Satellite) and now-retired Kepler Space Telescope were designed to identify planets using transits, dips in stellar brightness caused when a planet passes in front of its star.
These measurements reveal how the star’s light varies with time during each transit, and astronomers can arrange them in a plot astronomers call a light curve. Typically, a transit light curve traces a smooth sweep down as the planet starts passing in front of the star’s face. It reaches a minimum brightness when the world is fully in front of the star and then rises smoothly as the planet exits and the transit ends.
By measuring the time between transits, scientists can determine how far the planet lies from its star and estimate its surface temperature. The amount of missing light from the star during a transit can reveal the planet’s size, which can hint at its composition.
Every now and then, though, a planet’s light curve appears more complicated, with smaller dips and peaks added to the main arc. Scientists think these represent dark surface features akin to sunspots seen on our own Sun — star spots.
The Sun’s total number of sunspots varies as it goes through its 11-year solar cycle. Scientists use them to determine and predict the progress of that cycle as well as outbreaks of solar activity that could affect us here on Earth.
Similarly, star spots are cool, dark, temporary patches on a stellar surface whose sizes and numbers change over time. Their variability impacts what astronomers can learn about transiting planets.
Scientists have previously analyzed transit light curves from exoplanets and their host stars to look at the smaller dips and peaks. This helps determine the host star’s properties, such as its overall level of spottiness, inclination angle of the planet’s orbit, the tilt of the star’s spin compared to our line of sight, and other factors. Sagynbayeva’s model uses light curves that include not only transit information, but also the rotation of the star itself to provide even more detailed information about these stellar properties.
To view this video please enable JavaScript, and consider upgrading to a web browser that
supports HTML5 video
“Knowing more about the star in turn helps us learn even more about the planet, like a feedback loop,” said co-author Brett Morris, a senior software engineer at the Space Telescope Science Institute in Baltimore. “For example, at cool enough temperatures, stars can have water vapor in their atmospheres. If we want to look for water in the atmospheres of planets around those stars — a key indicator of habitability — we better be very sure that we’re not confusing the two.”
To test their model, Sagynbayeva and her team looked at transits from a planet called TOI 3884 b, located around 141 light-years away in the northern constellation Virgo.
Discovered by TESS in 2022, astronomers think the planet is a gas giant about five times bigger than Earth and 32 times its mass.
The StarryStarryProcess analysis suggests that the planet’s cool, dim star — called TOI 3384 — has concentrations of spots at its north pole, which also tips toward Earth so that the planet passes over the pole from our perspective.
Currently, the only available data sets that can be fit by Sagynbayeva’s model are in visible light, which excludes infrared observations taken by NASA’s James Webb Space Telescope. But NASA’s upcoming Pandora mission will benefit from tools like this one. Pandora, a small satellite developed through NASA’s Astrophysics Pioneers Program, will study the atmospheres of exoplanets and the activity of their host stars with long-duration multiwavelength observations. The Pandora mission’s goal is to determine how the properties of a star’s light differs when it passes through a planet’s atmosphere so scientists can better measure those atmospheres using Webb and other missions.
“The TESS satellite has discovered thousands of planets since it launched in 2018,” said Allison Youngblood, TESS project scientist at NASA’s Goddard Space Flight Center in Greenbelt, Maryland. “While Pandora will study about 20 worlds, it will advance our ability to pick out which signals come from stars and which come from planets. The more we understand the individual parts of a planetary system, the better we understand the whole — and our own.”
Facebook logo @NASAUniverse @NASAUniverse Instagram logo @NASAUniverseBy Jeanette Kazmierczak
NASA’s Goddard Space Flight Center, Greenbelt, Md.
Media Contact:
Alise Fisher
202-358-2546
alise.m.fisher@nasa.gov
NASA Headquarters, Washington
Eclipse experts' best travel tips for the total solar eclipse 2027
NASA Accepts Proposals for 2026 Student Launch Challenge
3 min read
Preparations for Next Moonwalk Simulations Underway (and Underwater)NASA is kicking off the 2026 Student Launch challenge, looking for new student teams to design, build, and launch high-powered rockets with a scientific or engineering payload next April.
The agency is seeking proposals until Monday, Sept. 22. Details about this year’s challenge are in the 2026 handbook, which outlines the requirements for middle school, high school, and college students to participate. After a competitive proposal selection process, selected teams must meet documentation milestones and undergo detailed reviews throughout the activity year.
NASA’s Student Launch, a STEM competition, officially kicks off its 26th anniversary with the 2026 handbook.
“These bright students rise to a nine-month challenge for Student Launch that tests their skills in engineering, design, and teamwork,” said Kevin McGhaw, director of NASA’s Office of STEM Engagement Southeast Region. “They are part of the Golden Age of explorers – the future scientists, engineers, and innovators who will lead us into the future of space exploration.”
Student Launch will culminate with on-site events starting on April 22, 2026. Final launches are scheduled for April 25, at Bragg Farms in Toney, Alabama, near NASA’s Marshall Space Flight Center in Huntsville, Alabama.
Each year, NASA updates the university payload challenge to reflect current scientific and exploration missions. For the 2026 season, the payload challenge will take inspiration from the Artemis missions, which seek to explore the Moon for scientific discovery, technology advancement, and to learn how to live and work on another world as we prepare for human missions to Mars. This year’s payload challenge tasks college and university teams with designing, building, and flying a habitat to safely house four STEMnauts – non-living objects representing astronauts – during extended missions. The habitat must include equipment capable of both collecting and testing soil samples to support agricultural research operations.
Nearly 1,000 students participated in the 2025 Student Launch competition – making up 71 teams from across the United States. Teams launched their rockets to an altitude between 4,000 and 6,000 feet, while attempting to make a successful landing and executing the payload mission.
Former NASA Marshall Director Art Stephenson started Student Launch in 2000 as a student rocket competition at the center. Just two university teams competed in the inaugural challenge – Alabama A&M University and the University of Alabama in Huntsville. The challenge continues to soar with thousands of students participating in the STEM competition each year, and many going on to a career with NASA.
NASA Marshall’s Office of STEM Engagement hosts Student Launch to provide students with real-world experiences that encourage them to pursue degrees and careers in science, technology, engineering, and mathematics. Student Launch is one of several NASA Artemis Student Challenges – a variety of activities that expose students to the knowledge and technology required to achieve the goals of the agency’s Artemis campaign.
In addition to NASA Office of STEM Engagement’s Next Generation STEM project, NASA Space Operations Mission Directorate, Northrop Grumman, National Space Club Huntsville, American Institute of Aeronautics and Astronautics, National Association of Rocketry, Relativity Space and, Bastion Technologies provide funding and leadership for the Student Launch competition.
To learn more about Student Launch, visit:
www.nasa.gov/studentlaunch
While the Artemis II crew will be the first humans to test NASA’s Orion spacecraft…
Article 5 days ago 3 min read Sun at the Center: Teacher Ambassadors Bring Heliophysics to Classrooms NationwideFor the fourth year in a row, the American Association of Physics Teachers, a collaborator…
Article 7 days ago 3 min read Portable Planetarium takes Thousands of Alaskan Students on a Cosmic AdventureExploring the Cosmos and Inspiring Young Minds From January through June 2025, the Education Outreach…
Article 1 week ago Keep Exploring Discover Related TopicsMissions
Humans in Space
Climate Change
Solar System
NASA Accepts Proposals for 2026 Student Launch Challenge
3 min read
Preparations for Next Moonwalk Simulations Underway (and Underwater)NASA is kicking off the 2026 Student Launch challenge, looking for new student teams to design, build, and launch high-powered rockets with a scientific or engineering payload next April.
The agency is seeking proposals until Monday, Sept. 22. Details about this year’s challenge are in the 2026 handbook, which outlines the requirements for middle school, high school, and college students to participate. After a competitive proposal selection process, selected teams must meet documentation milestones and undergo detailed reviews throughout the activity year.
NASA’s Student Launch, a STEM competition, officially kicks off its 26th anniversary with the 2026 handbook.“These bright students rise to a nine-month challenge for Student Launch that tests their skills in engineering, design, and teamwork,” said Kevin McGhaw, director of NASA’s Office of STEM Engagement Southeast Region. “They are part of the Golden Age of explorers – the future scientists, engineers, and innovators who will lead us into the future of space exploration.”
Student Launch will culminate with on-site events starting on April 22, 2026. Final launches are scheduled for April 25, at Bragg Farms in Toney, Alabama, near NASA’s Marshall Space Flight Center in Huntsville, Alabama.
Each year, NASA updates the university payload challenge to reflect current scientific and exploration missions. For the 2026 season, the payload challenge will take inspiration from the Artemis missions, which seek to explore the Moon for scientific discovery, technology advancement, and to learn how to live and work on another world as we prepare for human missions to Mars. This year’s payload challenge tasks college and university teams with designing, building, and flying a habitat to safely house four STEMnauts – non-living objects representing astronauts – during extended missions. The habitat must include equipment capable of both collecting and testing soil samples to support agricultural research operations.
Nearly 1,000 students participated in the 2025 Student Launch competition – making up 71 teams from across the United States. Teams launched their rockets to an altitude between 4,000 and 6,000 feet, while attempting to make a successful landing and executing the payload mission.
Former NASA Marshall Director Art Stephenson started Student Launch in 2000 as a student rocket competition at the center. Just two university teams competed in the inaugural challenge – Alabama A&M University and the University of Alabama in Huntsville. The challenge continues to soar with thousands of students participating in the STEM competition each year, and many going on to a career with NASA.
NASA Marshall’s Office of STEM Engagement hosts Student Launch to provide students with real-world experiences that encourage them to pursue degrees and careers in science, technology, engineering, and mathematics. Student Launch is one of several NASA Artemis Student Challenges – a variety of activities that expose students to the knowledge and technology required to achieve the goals of the agency’s Artemis campaign.
In addition to NASA Office of STEM Engagement’s Next Generation STEM project, NASA Space Operations Mission Directorate, Northrop Grumman, National Space Club Huntsville, American Institute of Aeronautics and Astronautics, National Association of Rocketry, Relativity Space and, Bastion Technologies provide funding and leadership for the Student Launch competition.
To learn more about Student Launch, visit:
www.nasa.gov/studentlaunch
While the Artemis II crew will be the first humans to test NASA’s Orion spacecraft…
Article 5 days ago 3 min read Sun at the Center: Teacher Ambassadors Bring Heliophysics to Classrooms NationwideFor the fourth year in a row, the American Association of Physics Teachers, a collaborator…
Article 7 days ago 3 min read Portable Planetarium takes Thousands of Alaskan Students on a Cosmic AdventureExploring the Cosmos and Inspiring Young Minds From January through June 2025, the Education Outreach…
Article 1 week ago Keep Exploring Discover Related TopicsMissions
Humans in Space
Climate Change
Solar System
Harmonized Landsat and Sentinel-2: Collaboration Drives Innovation
9 min read
Harmonized Landsat and Sentinel-2: Collaboration Drives InnovationIntroduction
Landsat, a joint program of NASA and the U.S. Geological Survey (USGS), has been an invaluable tool for monitoring changes in Earth’s land surface for over 50 years. Researchers use instruments on Landsat satellites to monitor decades-long trends, including urbanization and agricultural expansion, as well as short-term dynamics, including water use and disaster recovery. However, scientists and land managers often encounter one critical limitation of this program: Landsat has a revisit time of eight days (with Landsat 8 and 9 operating), which is too long to capture events and disasters that occur on short timescales. Floods, for example, can quickly inundate a region, and cloud cover from storms can delay Landsat’s ability to get a clear observation on damage.
In 2015, the European Space Agency’s (ESA) Copernicus Sentinel-2A mission joined Landsat 7 and 8 in orbit. It was designed to collect comparable optical land data with the intention of leveraging Landsat’s archive. Two years later, ESA launched Sentinel-2B, a satellite identical to Sentinel-2A.
Led by a science team at NASA’s Goddard Space Flight Center (GSFC), the USGS, NASA, and ESA began to work on combining the capabilities of Sentinel-2 and Landsat satellites. This idea was the impetus behind Harmonized Landsat and Sentinel-2 (HLS) project, a NASA initiative that created a seamless product from the Operational Land Imager (OLI) and Multi-Spectral Instrument (MSI) aboard Landsat and Sentinel-2 satellites, respectively. HLS Version 2.0 (V2.0) is the most recent version of these data and had a global median repeat frequency of 1.6 days in 2022 by combining observations from Landsat 8 and 9 and Sentinel-2A and B. The recent addition of Sentinel-2C data will provide even more frequent observations. With near-global coverage and improved harmonization algorithms, HLS V2.0 paves the way for new applications and improved land monitoring systems – see Animation 1. HLS data are available for download on NASA Earthdata: HLSL30v2.0 and HLSS30v2.0. These data can also be accessed through Google Earth Engine: HLSL30v2.0 and HLSS30v2.0.
Animation 1. This visualization shows the change in vegetation in Maryland from January 1 to December 30, 2016, using Normalized Difference Vegetation Index (NDVI) data from Harmonized Landsat Sentinel-2 (HLS). The visualization shows land on both sides of the Chesapeake Bay, where red represents bare soil and green indicates healthy, growing vegetation.Animation credit: Michael Taylor [Science Systems and Applications Inc. (SSAI)], Matthew Radcliff [USRA], and Jeffrey Masek [GSFC]. Caption adapted from Laura Rocchio [SSAI]The Dawn of HLS
The story of HLS begins before the launch of Sentinel-2A in 2015. Jeffrey Masek [GSFC], who was at that time project scientist for Landsat 8, led a group of researchers who wanted to find a way to harmonize Landsat data with other satellite data. Their aim was to create a “virtual constellation” similar to how weather satellites operate.
“HLS meets a need that people have been asking for for a long time,” said Masek.
What began as a research question with an experimental product evolved into an operational project with the involvement of the Satellite Needs Working Group (SNWG). SNWG is an interagency effort to develop solutions that address Earth observation needs of civilian federal agencies. Every two years, SNWG conducts a survey of federal agencies to see how their work could benefit from satellite data. The answers span the gamut of application areas, from water quality monitoring to disaster recovery to planning how best to protect and use natural resources. SNWG brings these ideas to NASA, USGS, and the National Oceanic and Atmospheric Administration (NOAA) – the three main U.S. government providers of satellite data. These agencies work together to create and implement solutions that serve those needs. NASA plays a critical role in every step of the SNWG process, including leading the assessment of survey responses from over 30 federal agencies, managing and supporting the implementation of identified solutions, and encouraging solution co-design with federal partners to maximize impact.
The HLS surface reflectance product was an outcome of the very first SNWG solution cycle in 2016. This product was expanded, following additional SNWG requests in 2020 and 2022. The 2020 cycle saw the creation of nine HLS-derived vegetation indices, and the 2022 cycle aimed for a six-hour latency product.
The U.S. Department of Agriculture (USDA) now uses HLS to map crop emergence at the field scale in the corn belt, allowing farmers to better plan their growing seasons. Ranchers in Colorado use the dataset to decide where to graze their cattle during periods of drought. HLS also informs the use and termination of cover crops in the Chesapeake Bay area. In 2024, the Federal Emergency Management Agency (FEMA) employed HLS to identify where to focus aid in the aftermath of Hurricane Helene.
A New and Improved HLS
In the July 2025 issue of Remote Sensing of Environment, a team of researchers outlined the HLS V2.0 surface reflectance dataset and algorithms. The team included seven NASA co-authors, members of the 2018–2023 Landsat Science Team, and ESA. The lead author, Junchang Ju [GSFC—Remote Sensing Scientist], has been the technical lead on HLS since its inception. Co-author Christopher Neigh [GSFC—Landsat 8/9 Project Scientist] is the principal investigator on the HLS project. V2.0, which was completed in Summer 2023, incorporates several major improvements over HLS V1.4, the most recent publicly available HLS product. The HLS production team at NASA’s Marshall Space Flight Center (MSFC), led by Madhu Sridhar [University of Alabama in Huntsville—Research Scientist], ensures consistent data access through close collaboration with ESA and the Land Processes Distributed Active Archive Center (LP DAAC). HLS V1.4 covered about 30% of the global land area, providing data on North America and other select locations. HLS V2.0 provides data at a spatial resolution of 30 m (98 ft) with near-global coverage from 2013 onward. The dataset includes all land masses except Antarctica. HLS V2.0 also has key algorithmic improvements in atmospheric correction, cloud masking, and bidirectional reflectance distribution function (BRDF) correction. Together, these algorithms “harmonize” the data, or ensure that the distinct Landsat and Sentinel-2 datasets can effectively be used interchangeably – see Animation 2.
Animation 2: The visualization provides the Normalized Difference Vegetation Index (NDVI) data from Harmonized Landsat Sentinel-2 (HLS) for farm fields south of Columbus, NE. The red represents bare soil and green represents healthy, growing vegetation. The animation runs from January 1 to December 30, 2016.Animation credit: Michael Taylor [SSAI], Matthew Radcliff [USRA], and Jeffrey Masek [GSFC]. Caption adapted from Laura Rocchio [SSAI]HLS V2.0 in Action
The increased frequency of observations improved the ability of the scientific community to track disaster recovery, changes in phenology, agricultural intensification, rapid urban growth, logging, and deforestation. Researchers are already putting these advances to use.
The land disturbance product (DIST-ALERT) is a global land change monitoring system that uses HLS V2.0 data to track vegetation anomalies in near real-time – see Figure 1. DIST-ALERT captures agricultural expansion, urban growth, fire, flooding, logging, drought, landslides, and other forces of change to vegetation. Amy Pickens [University of Maryland, Department of Geographical Sciences—Assistant Research Professor] said that HLS is the perfect dataset for tracking disturbances because of the frequency of observations.
DIST-ALERT was created through Observational Products for End-Users from Remote Sensing Analysis (OPERA), a project at NASA/Jet Propulsion Laboratory (JPL). OPERA products respond to agency needs identified by the SNWG. In 2018, SNWG identified tracking surface disturbance as a key need. OPERA partnered with the Global Land Analysis and Discovery (GLAD) lab at University of Maryland to develop the change detection algorithm.
To track changes in vegetation, the DIST-ALERT system establishes a rolling baseline – meaning that for any given pixel, the vegetation cover is compared against vegetation cover from the same 31-day window in the previous three years. The primary algorithm detects any vegetation loss relative to the established baseline. A secondary algorithm flags any spectral anomaly (i.e., any change in reflectance) compared to that same baseline. This approach ensures that the algorithm catches non-vegetation change (e.g., new building or road projects in unvegetated areas). Used together, these algorithms can identify long-term changes in agricultural expansion, deforestation, and urbanization alongside short-term changes in crop harvest, drought, selective logging, and the impacts of disasters. On average, DIST-ALERT is made available on LP DAAC within six hours of when new HLS data is available. Currently, the dataset does not provide attribution to disturbances.
Figure 1. In March 2025, wildfires burned through South Korea, resulting in heavy vegetation loss. [left] Output of the DIST-ALERT product on NASA Worldview from May 8, 2025, with vegetation loss in percent flagged with varying levels of confidence. Yellow and red represent areas with confirmed vegetation cover losses of <50% and ≥50%, respectively. [right] Natural-color image captured by the Multi-Spectral Instrument (MSI) aboard Sentinel-2C on May 8, 2025. The large brown burn scar in the center of the image corresponds to vegetation loss detected by DIST-ALERT. It stands in contrast to the surrounding green vegetation.Figure credit: NASA Earthdata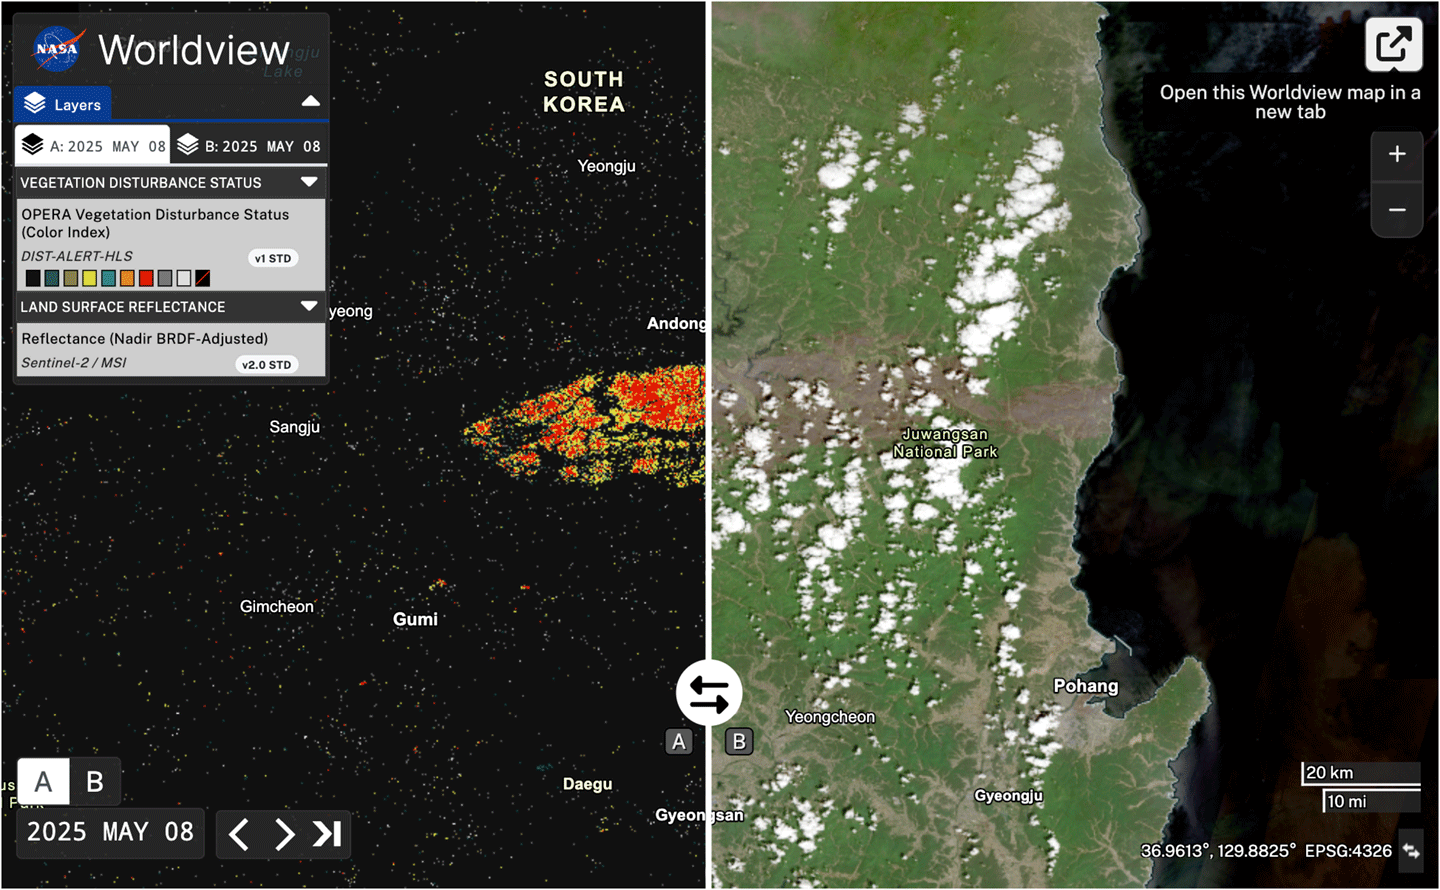
Disturbance alerts already exist in some ecosystems. Brazil’s National Institute for Space Research [Instituto Nacional de Pesquisas Espaciais (INPE)] runs two projects that detect deforestation in the Amazon: Programa de Cálculo do Desflorestamento da Amazônia (PRODES) and Sistema de Detecção de Desmatamento em Tempo Real (DETER). The GLAD lab created its own forest loss alerts – GLAD-L and GLAD-S2 – using Landsat and Sentinel-2 data respectively. Global Forest Watch integrates GLAD-L and GLAD-S2 data with Radar for Detecting Deforestation (RADD) observations – derived from synthetic aperture radar data from Copernicus Sentinel-1 – into an integrated deforestation alert.
The implementation of these alert systems, some of which have been around for decades, have been shown to impact deforestation rates in the tropics. For example, a 2021 study in Nature Climate Change found that deforestation alerts decreased the probability of deforestation in Central Africa by 18% relative to the average 2011–2016 levels.
DIST-ALERT is distinct from other alert systems in a few ways. First, it has global coverage. Second, the rolling baseline allows for tracking changes in seasonality and disturbances to dynamic ecosystems. When HLS V2.0 data are input to DIST-ALERT, the system is also better at identifying disturbances in cloudy ecosystems than other individual alert systems – because it is more likely to obtain clear observations. This also enables it to identify the start and end of the disturbance more precisely.
Pickens said that the DIST-ALERT team is already working with end-users who are implementing their data product. She has spoken to some who use the system to help logging companies prove that they are complying with regulations. The U.S. Census Bureau is also using DIST-ALERT to monitor fast-growing communities so that they can do targeted assessments in the interim between the larger decennial census.
Alongside DIST-ALERT, OPERA has also been developing the Dynamic Surface Water eXtent (DSWx) product suite, which employs HLS to track surface water (e.g., lakes, reservoirs, rivers, and floods) around the globe – see Figure 2. These new products represent the new applications made possible by the HLS interagency and international collaboration.
Figure 2. The map shows flood extent and estimates of flood depth in areas west of Porto Alegre, Brazil on May 6, 2024. The flood extent is from the Observational Products for End-Users from Remote Sensing Analysis (OPERA) Dynamic Surface Water eXtent product, which uses Harmonized Landsat Sentinel-2 data. The flood depth estimate is from the Floodwater Depth Estimation Tool (FwD ET). The darkest blue areas represent floodwater at least 5 m (20 ft) deep. Much of the inundated floodplain is light blue, which equates to depths of between 0.1–1 m (4–40 in).Figure credit: Lauren Dauphin [NASA’s Earth Observatory], Dinuke Munasinghe [JPL], Sagy Cohen [University of Alabama], and Alexander Handwerger [JPL]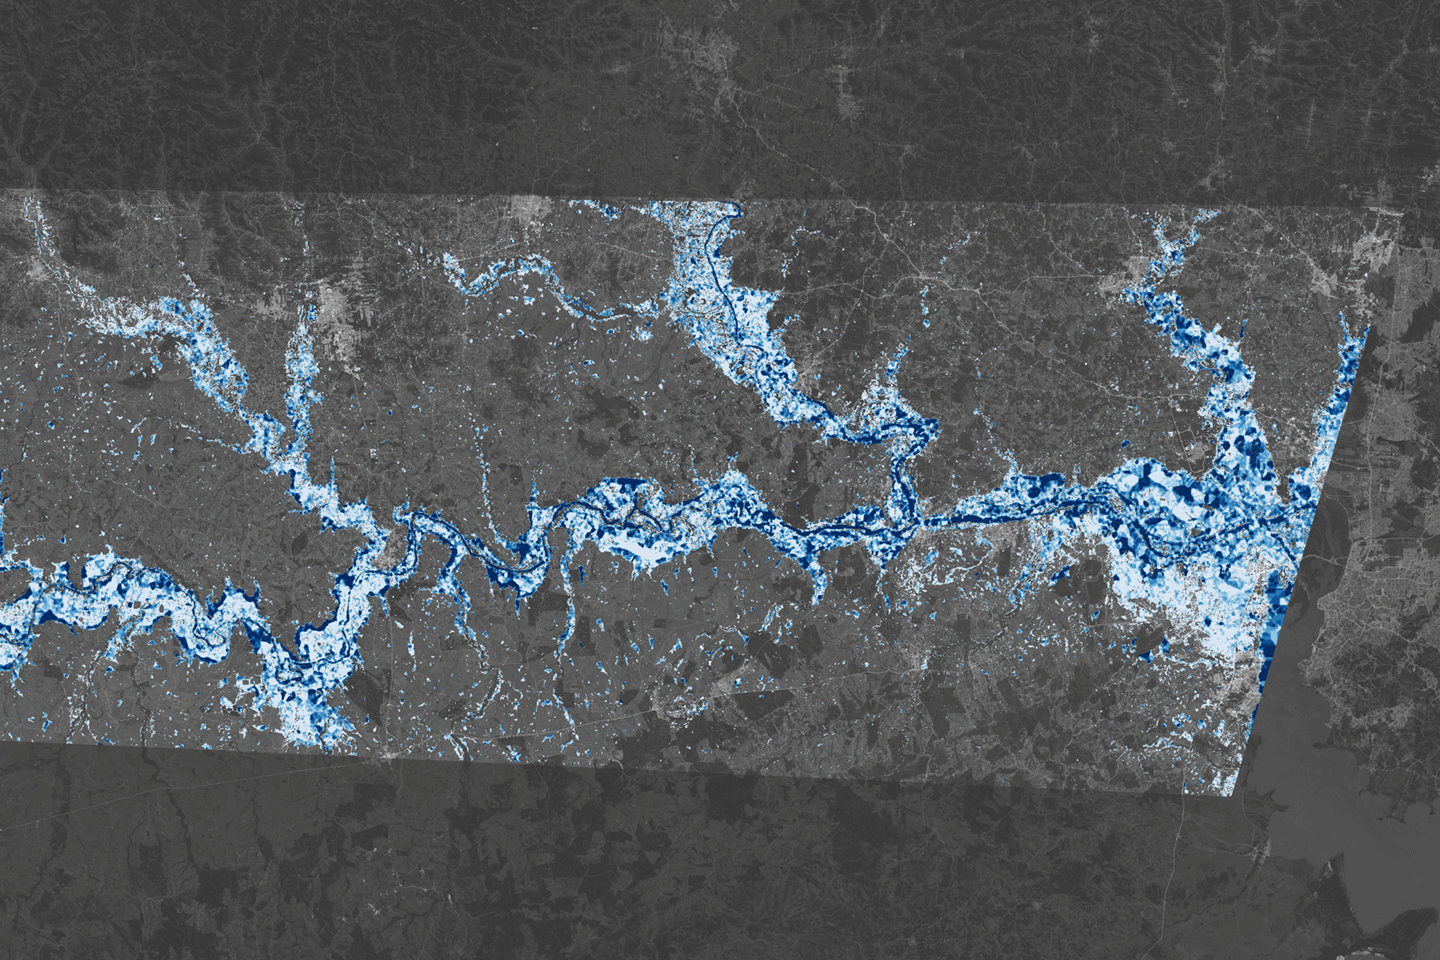
Conclusion
HLS is set to continue improving land monitoring efforts across the globe. Meanwhile, the HLS science team is working to improve the algorithms for a more seamless harmonization of Landsat 8 and 9 and Sentinel-2 data. They are also working to improve the cloud-masking algorithm, have recently released vegetation indices, and are working on developing a low-latency (six-hour) HLS surface reflectance product, all while incorporating user feedback.
Looking ahead, the launch of future Sentinel and Landsat satellites will further the development of HLS. The additional data and unique capabilities will continue to meet researchers’ need for more frequent, high-quality satellite observations of Earth’s land surface.
Madeleine Gregory
NASA’s Goddard Space Flight Center/Science Systems and Applications Inc.
madeleine.s.gregory@nasa.gov
Harmonized Landsat and Sentinel-2: Collaboration Drives Innovation
9 min read
Harmonized Landsat and Sentinel-2: Collaboration Drives InnovationIntroduction
Landsat, a joint program of NASA and the U.S. Geological Survey (USGS), has been an invaluable tool for monitoring changes in Earth’s land surface for over 50 years. Researchers use instruments on Landsat satellites to monitor decades-long trends, including urbanization and agricultural expansion, as well as short-term dynamics, including water use and disaster recovery. However, scientists and land managers often encounter one critical limitation of this program: Landsat has a revisit time of eight days (with Landsat 8 and 9 operating), which is too long to capture events and disasters that occur on short timescales. Floods, for example, can quickly inundate a region, and cloud cover from storms can delay Landsat’s ability to get a clear observation on damage.
In 2015, the European Space Agency’s (ESA) Copernicus Sentinel-2A mission joined Landsat 7 and 8 in orbit. It was designed to collect comparable optical land data with the intention of leveraging Landsat’s archive. Two years later, ESA launched Sentinel-2B, a satellite identical to Sentinel-2A.
Led by a science team at NASA’s Goddard Space Flight Center (GSFC), the USGS, NASA, and ESA began to work on combining the capabilities of Sentinel-2 and Landsat satellites. This idea was the impetus behind Harmonized Landsat and Sentinel-2 (HLS) project, a NASA initiative that created a seamless product from the Operational Land Imager (OLI) and Multi-Spectral Instrument (MSI) aboard Landsat and Sentinel-2 satellites, respectively. HLS Version 2.0 (V2.0) is the most recent version of these data and had a global median repeat frequency of 1.6 days in 2022 by combining observations from Landsat 8 and 9 and Sentinel-2A and B. The recent addition of Sentinel-2C data will provide even more frequent observations. With near-global coverage and improved harmonization algorithms, HLS V2.0 paves the way for new applications and improved land monitoring systems – see Animation 1. HLS data are available for download on NASA Earthdata: HLSL30v2.0 and HLSS30v2.0. These data can also be accessed through Google Earth Engine: HLSL30v2.0 and HLSS30v2.0.
Animation 1. This visualization shows the change in vegetation in Maryland from January 1 to December 30, 2016, using Normalized Difference Vegetation Index (NDVI) data from Harmonized Landsat Sentinel-2 (HLS). The visualization shows land on both sides of the Chesapeake Bay, where red represents bare soil and green indicates healthy, growing vegetation. Animation credit: Michael Taylor [Science Systems and Applications Inc. (SSAI)], Matthew Radcliff [USRA], and Jeffrey Masek [GSFC]. Caption adapted from Laura Rocchio [SSAI]The Dawn of HLS
The story of HLS begins before the launch of Sentinel-2A in 2015. Jeffrey Masek [GSFC], who was at that time project scientist for Landsat 8, led a group of researchers who wanted to find a way to harmonize Landsat data with other satellite data. Their aim was to create a “virtual constellation” similar to how weather satellites operate.
“HLS meets a need that people have been asking for for a long time,” said Masek.
What began as a research question with an experimental product evolved into an operational project with the involvement of the Satellite Needs Working Group (SNWG). SNWG is an interagency effort to develop solutions that address Earth observation needs of civilian federal agencies. Every two years, SNWG conducts a survey of federal agencies to see how their work could benefit from satellite data. The answers span the gamut of application areas, from water quality monitoring to disaster recovery to planning how best to protect and use natural resources. SNWG brings these ideas to NASA, USGS, and the National Oceanic and Atmospheric Administration (NOAA) – the three main U.S. government providers of satellite data. These agencies work together to create and implement solutions that serve those needs. NASA plays a critical role in every step of the SNWG process, including leading the assessment of survey responses from over 30 federal agencies, managing and supporting the implementation of identified solutions, and encouraging solution co-design with federal partners to maximize impact.
The HLS surface reflectance product was an outcome of the very first SNWG solution cycle in 2016. This product was expanded, following additional SNWG requests in 2020 and 2022. The 2020 cycle saw the creation of nine HLS-derived vegetation indices, and the 2022 cycle aimed for a six-hour latency product.
The U.S. Department of Agriculture (USDA) now uses HLS to map crop emergence at the field scale in the corn belt, allowing farmers to better plan their growing seasons. Ranchers in Colorado use the dataset to decide where to graze their cattle during periods of drought. HLS also informs the use and termination of cover crops in the Chesapeake Bay area. In 2024, the Federal Emergency Management Agency (FEMA) employed HLS to identify where to focus aid in the aftermath of Hurricane Helene.
A New and Improved HLS
In the July 2025 issue of Remote Sensing of Environment, a team of researchers outlined the HLS V2.0 surface reflectance dataset and algorithms. The team included seven NASA co-authors, members of the 2018–2023 Landsat Science Team, and ESA. The lead author, Junchang Ju [GSFC—Remote Sensing Scientist], has been the technical lead on HLS since its inception. Co-author Christopher Neigh [GSFC—Landsat 8/9 Project Scientist] is the principal investigator on the HLS project. V2.0, which was completed in Summer 2023, incorporates several major improvements over HLS V1.4, the most recent publicly available HLS product. HLS V1.4 covered about 30% of the global land area, providing data on North America and other select locations. HLS V2.0 provides data at a spatial resolution of 30 m (98 ft) with near-global coverage from 2013 onward. The dataset includes all land masses except Antarctica. HLS V2.0 also has key algorithmic improvements in atmospheric correction, cloud masking, and bidirectional reflectance distribution function (BRDF) correction. Together, these algorithms “harmonize” the data, or ensure that the distinct Landsat and Sentinel-2 datasets can effectively be used interchangeably – see Animation 2.
Animation 2: The visualization provides the Normalized Difference Vegetation Index (NDVI) data from Harmonized Landsat Sentinel-2 (HLS) for farm fields south of Columbus, NE. The red represents bare soil and green represents healthy, growing vegetation. The animation runs from January 1 to December 30, 2016. Animation credit: Michael Taylor [SSAI], Matthew Radcliff [USRA], and Jeffrey Masek [GSFC]. Caption adapted from Laura Rocchio [SSAI]HLS V2.0 in Action
The increased frequency of observations improved the ability of the scientific community to track disaster recovery, changes in phenology, agricultural intensification, rapid urban growth, logging, and deforestation. Researchers are already putting these advances to use.
The land disturbance product (DIST-ALERT) is a global land change monitoring system that uses HLS V2.0 data to track vegetation anomalies in near real-time – see Figure 1. DIST-ALERT captures agricultural expansion, urban growth, fire, flooding, logging, drought, landslides, and other forces of change to vegetation. Amy Pickens [University of Maryland, Department of Geographical Sciences—Assistant Research Professor] said that HLS is the perfect dataset for tracking disturbances because of the frequency of observations.
DIST-ALERT was created through Observational Products for End-Users from Remote Sensing Analysis (OPERA), a project at NASA/Jet Propulsion Laboratory (JPL). OPERA products respond to agency needs identified by the SNWG. In 2018, SNWG identified tracking surface disturbance as a key need. OPERA partnered with the Global Land Analysis and Discovery (GLAD) lab at University of Maryland to develop the change detection algorithm.
To track changes in vegetation, the DIST-ALERT system establishes a rolling baseline – meaning that for any given pixel, the vegetation cover is compared against vegetation cover from the same 31-day window in the previous three years. The primary algorithm detects any vegetation loss relative to the established baseline. A secondary algorithm flags any spectral anomaly (i.e., any change in reflectance) compared to that same baseline. This approach ensures that the algorithm catches non-vegetation change (e.g., new building or road projects in unvegetated areas). Used together, these algorithms can identify long-term changes in agricultural expansion, deforestation, and urbanization alongside short-term changes in crop harvest, drought, selective logging, and the impacts of disasters. On average, DIST-ALERT is made available on LP DAAC within six hours of when new HLS data is available. Currently, the dataset does not provide attribution to disturbances.
Figure 1. In March 2025, wildfires burned through South Korea, resulting in heavy vegetation loss. [left] Output of the DIST-ALERT product on NASA Worldview from May 8, 2025, with vegetation loss in percent flagged with varying levels of confidence. Yellow and red represent areas with confirmed vegetation cover losses of <50% and ≥50%, respectively. [right] Natural-color image captured by the Multi-Spectral Instrument (MSI) aboard Sentinel-2C on May 8, 2025. The large brown burn scar in the center of the image corresponds to vegetation loss detected by DIST-ALERT. It stands in contrast to the surrounding green vegetation. Figure credit: NASA EarthdataDisturbance alerts already exist in some ecosystems. Brazil’s National Institute for Space Research [Instituto Nacional de Pesquisas Espaciais (INPE)] runs two projects that detect deforestation in the Amazon: Programa de Cálculo do Desflorestamento da Amazônia (PRODES) and Sistema de Detecção de Desmatamento em Tempo Real (DETER). The GLAD lab created its own forest loss alerts – GLAD-L and GLAD-S2 – using Landsat and Sentinel-2 data respectively. Global Forest Watch integrates GLAD-L and GLAD-S2 data with Radar for Detecting Deforestation (RADD) observations – derived from synthetic aperture radar data from Copernicus Sentinel-1 – into an integrated deforestation alert.
The implementation of these alert systems, some of which have been around for decades, have been shown to impact deforestation rates in the tropics. For example, a 2021 study in Nature Climate Change found that deforestation alerts decreased the probability of deforestation in Central Africa by 18% relative to the average 2011–2016 levels.
DIST-ALERT is distinct from other alert systems in a few ways. First, it has global coverage. Second, the rolling baseline allows for tracking changes in seasonality and disturbances to dynamic ecosystems. When HLS V2.0 data are input to DIST-ALERT, the system is also better at identifying disturbances in cloudy ecosystems than other individual alert systems – because it is more likely to obtain clear observations. This also enables it to identify the start and end of the disturbance more precisely.
Pickens said that the DIST-ALERT team is already working with end-users who are implementing their data product. She has spoken to some who use the system to help logging companies prove that they are complying with regulations. The U.S. Census Bureau is also using DIST-ALERT to monitor fast-growing communities so that they can do targeted assessments in the interim between the larger decennial census.
Alongside DIST-ALERT, OPERA has also been developing the Dynamic Surface Water eXtent (DSWx) product suite, which employs HLS to track surface water (e.g., lakes, reservoirs, rivers, and floods) around the globe – see Figure 2. These new products represent the new applications made possible by the HLS interagency and international collaboration.
Figure 2. The map shows flood extent and estimates of flood depth in areas west of Porto Alegre, Brazil on May 6, 2024. The flood extent is from the Observational Products for End-Users from Remote Sensing Analysis (OPERA) Dynamic Surface Water eXtent product, which uses Harmonized Landsat Sentinel-2 data. The flood depth estimate is from the Floodwater Depth Estimation Tool (FwD ET). The darkest blue areas represent floodwater at least 5 m (20 ft) deep. Much of the inundated floodplain is light blue, which equates to depths of between 0.1–1 m (4–40 in). Figure credit: Lauren Dauphin [NASA’s Earth Observatory], Dinuke Munasinghe [JPL], Sagy Cohen [University of Alabama], and Alexander Handwerger [JPL]Conclusion
HLS is set to continue improving land monitoring efforts across the globe. Meanwhile, the HLS science team is working to improve the algorithms for a more seamless harmonization of Landsat 8 and 9 and Sentinel-2 data. They are also working to improve the cloud-masking algorithm, have recently released vegetation indices, and are working on developing a low-latency (six-hour) HLS surface reflectance product, all while incorporating user feedback.
Looking ahead, the launch of future Sentinel and Landsat satellites will further the development of HLS. The additional data and unique capabilities will continue to meet researchers’ need for more frequent, high-quality satellite observations of Earth’s land surface.
Madeleine Gregory
NASA’s Goddard Space Flight Center/Science Systems and Applications Inc.
madeleine.s.gregory@nasa.gov
NASA Implementation of Executive Order 14303
Aug 22, 2025
PDF (277.15 KB)
NASA Implementation of Executive Order 14303
Aug 22, 2025
PDF (277.15 KB)
An incredible Denisovan skull is upending the story of human evolution
An incredible Denisovan skull is upending the story of human evolution
Dark matter could create black holes that devour exoplanets from within
Don't miss Mars close to the slender crescent moon at sunset tonight
Radio dish on the move | Space photo of the day for Aug. 25, 2025
ESA data records help underpin climate change report
According to the newly released 35th State of the Climate report, 2024 saw record highs in greenhouse gas concentrations, global land and ocean temperatures, sea levels, and ocean heat content. Glaciers also suffered their largest annual ice loss on record. Data records from ESA’s Climate Change Initiative helped underpin these findings.
A New Model for Early Black Hole Formation Could Revolutionize Cosmologicy
A new theoretical study by University of Virginia astrophysicist Jonathan Tan, a research professor with the College and Graduate School of Arts & Sciences’ Department of Astronomy, proposes a comprehensive framework for the birth of supermassive black holes.
NASA Commanded Psyche To Turn Around And Capture Images Of Earth And The Moon
New images from NASA's Psyche spacecraft show that its cameras are working just fine. By pointing them at Earth and the Moon, NASA was able to test the spacecraft's cameras and science instruments. Since both bodies reflect light like Psyche, and since their spectra are familiar, it's a valuable opportunity to test and calibrate the instruments.
Roman's High-Latitude Time-Domain Survey Will Find Tens of Thousands of Supernovae
For thousands of years, humanity viewed the skies as unchanging, except for a few “wandering stars” (that we now know are planets). As we improved our ability to perceive the cosmos with light-gathering telescopes and electronic detectors, we realized that the universe is full of things that change in brightness, whether it be an exploding star or a matter-gulping black hole. NASA’s Nancy Grace Roman Space Telescope is poised to deliver an avalanche of such transients, including thousands of “standard candle” supernovae that allow us to measure the expansion history of the universe.