
Feed aggregator
Is A Young Exoplanet Warping The Disk Around Fomalhaut?
Fomalhaut is one of the brightest stars in the night sky and has been observed in great detail for decades. Some research suggests it hosts exoplanets, while other research counters that. The latest observations of the star's disk with ALMA favour the existence of a planet.
Exoplanet In A Ring Gap Shows How Protoplanets Can Shape Their Environment
Circumstellar discs are believed to be key components in planetary formation. However, we have very little actual evidence of planets growing in the “rings” that surround young stars. So planet formation theorists were ecstatic to learn that two new papers in Astrophysical Journal Letters describe a planet that is actively forming in the gap it most likely created in the ring system of a young, Sun-like star.
Life on Earth Probably Got Some Help From Space
After the formation of the Solar System, it took a maximum of three million years for primordial Earth's chemical composition to settle. At the time, there was hardly any water, carbon compounds, or other ingredients necessary for life to emerge. Only a planetary collision that came later would have brought water to Earth, according to a new study by researchers from the Institute of Geological Sciences at the University of Bern.
Researchers at SwRI Produced a Mission Concept for Exploring Interstellar Objects Like 3I/ATLAS
A new development study from the Southwestern Research Institute outlines a possible mission that could rendezvous with and explore the interstellar comet 3I/ATLAS.
A Glittering Stellar Nursery Shines In New JWST Image
This sparkling scene of star birth was captured by the NASA/ESA/CSA James Webb Space Telescope. What appears to be a craggy, starlit mountaintop kissed by wispy clouds is actually a cosmic dust-scape being eaten away by the blistering winds and radiation of nearby, massive, infant stars.
The Murchison Widefield Array Just Doubled In Size - What Could It Find Now?
Radio astronomy took another step forward recently, with the completion of Phase III of the Murchison Widefield Array (MWA) in Western Australia. We’ve reported before on how the MWA has investigated everything from SETI signals to the light from the earliest stars. WIth this upgrade, the MWA will continue to operate with much needed improvements while the radio astronomy awaits the completion of the successor it helped enable - the Square Kilometer Array (SKA).
Juno Detects Callisto's "Footprints" in Jupiter's Aurorae
Jupiter hosts the brightest and most spectacular auroras in the Solar System, and its largest moons (the Galileans) create their own auroral signatures known as “satellite footprints” in the planet’s atmosphere. Until now, astronomers had detected the auroral signatures of three Galileans (Io, Europa, and Ganymede), but not Callisto. Thanks to an international team, close-up images of Callisto's footprints have been seen at last.
The JWST's New Contribution To Understanding The Cosmic Dawn: MINERVA
The JWST is performing a new multi-wavelength survey called MINERVA (Medium-band Imaging with NIRCam to Explore ReVolutionary Astrophysics). It'll study four extragalactic fields in greater detail and depth, and will help us understand the Cosmic Dawn.
Clues In A Dusty Disk Point The Way To A Potential Exoplanet
Astronomers struggle to detect small exoplanets directly. One tool they use is to search for the effects these planets have on debris disks around stars. Clues in these disks tell astronomers where they can find sub-Jupiter mass exoplanets.
The Earth Observer Editor’s Corner: July–September 2025
13 min read
The Earth Observer Editor’s Corner: July–September 2025
NOTE TO READERS: After more than three decades associated with or directly employed by NASA, Steve Platnick [GSFC—Deputy Director for Atmospheres, Earth Sciences Division] stepped down effective August 8, 2025. Steve began his civil servant career at GSFC in 2002, but his GSFC association went back to 1993, first as a contractor and then as one of the earliest employees of the Joint Center for Earth Systems Technology (JCET). During his time at NASA, Steve played an integral role in the sustainability and advancement of NASA’s Earth Observing System platforms and data. He was actively involved in the Moderate Resolution Imaging Spectroradiometer (MODIS) Science Team, where he helped advance several key components of the MODIS instrument. He was also the NASA Lead/co-Lead for the Suomi National Polar-orbiting Partnership (Suomi NPP), Atmosphere Discipline from 2012–2020 where he focused on operational cloud optical and microphysical products.
In 2008, Steve became the Earth Observing System (EOS) Senior Project Scientist. In this role, he led the EOS Project Science Office that supported airborne sensors, ground networks, and calibration labs. The Kudos article titled “Steve Platnick Steps Down from NASA After 34 Years of Service” includes a more detailed account of Steve’s career and includes a list of awards he has received.
Steve’s departure leaves a vacancy in the author’s chair for “The Editor’s Corner” – another role Steve filled as EOS Senior Project Scientist. Barry Lefer [NASA Headquarters—Associate Director of Research, Earth Science Division] graciously agreed to serve as guest author of the editorial in the current compilation. I want to thank Steve for all his support for The Earth Observer over the years and thank Barry for stepping in as the author of “The Editor’s Corner” for the time being.
–Alan Ward, Executive Editor, The Earth Observer
I begin this editorial with news of a successful Earth science launch. At 5:40 PM Indian Standard Time (IST), or 8:10 AM Eastern Daylight Time (EDT), on July 30, 2025, the joint NASA–Indian Space Research Organization (ISRO) Synthetic Aperture Radar, or NISAR, mission launched from the Satish Dhawan Space Centre on India’s southeastern coast aboard an ISRO Geosynchronous Satellite Launch Vehicle (GSLV) rocket 5. The ISRO ground controllers began communicating with NISAR about 20 minutes after launch, at just after 8:29 AM EDT, and confirmed it is operating as expected.
NISAR will use two different radar frequencies (L-band SAR and S-band SAR) to penetrate clouds and forest canopies. Including L-band and S-band radars on one satellite is an evolution in SAR airborne and space-based missions that, for NASA, started in 1978 with the launch of Seasat. In 2012, ISRO began launching SAR missions starting with Radar Imaging Satellite (RISAT-1), followed by RISAT-1A in 2022, to support a wide range of applications in India.
Combining the data from these two radars will allow researchers to systematically and globally map Earth – measuring changes of our planet’s surface down to a centimeter (~0.4 inches). With this detailed view, researchers will have an unprecedented ability to observe and measure complex processes from ecosystem disturbances to natural hazards to groundwater issues. All NISAR science data will be freely available and open to the public.
Following the successful launch, NISAR entered an approximately 90-day commissioning phase to test out systems before science operations begin. A key milestone of that phase was the completion of the deployment of the 39-ft (12-m) radar antenna reflector on August 15 – see Video. The process began on August 9, when the satellite’s boom, which had been tucked close to its main body, started unfolding one joint at a time until it was fully extended about four days later. The reflector assembly is mounted at the end of the boom. On August 15, small explosive bolts that held the reflector assembly in place were fired, enabling the antenna to begin a process called the bloom – its unfurling by the release of tension stored in its flexible frame while stowed like an umbrella. Subsequent activation of motors and cables pulled the antenna into its final, locked position.
Video: NISAR mission team members at NASA JPL, working with colleagues in India, executed the deployment of the satellite’s radar antenna reflector on Aug. 15, 2025. About 39 feet (12 meters) in diameter, the reflector directs microwave pulses from NISAR’s two radars toward Earth and receives the return signals. Credit: NASA/JPL-CaltechThe radar reflector will be used to direct and receive microwave signals from the two radars. By interpreting the differences between the L-band and S-band measurements, researchers will be able to discern characteristics about the surface below. As NISAR passes over the same locations twice every 12 days, scientists can evaluate how those characteristics have changed over time to reveal new insights about Earth’s dynamic surfaces.
With the radar reflector now in full bloom, scientists have turned their attention to tuning and testing the radar and preparing NISAR for Science Operations, which are anticipated to start around the beginning of November. Congratulations to the NISAR team on a successful launch and deployment of the radar reflector. Along with the science community, I am excited to see what new discoveries will result from the data collected by the first Earth System Observatory mission.
Turning now to news from active missions, the Soil Moisture Active Passive (SMAP) mission has collected over 10 years of global L-band radiometry observations that have resulted in surface soil moisture, vegetation optical depth (VOD), and freeze/thaw state estimates that outperform past and current products. A decade of SMAP soil moisture observations has led to scientific achievements, including quantifying the linkages of the three main metabolic cycles (e.g., carbon, water, and energy) on land. The data have been widely used by the Earth system science community to improve drought assessments and flood prediction as well as the accuracy of numerical weather prediction models.
SMAP’s Early Adopter program has helped connect SMAP data with people and organizations that need it. The program has increased the awareness of SMAP mission products, broadened the user community, increased collaboration with potential users, improved knowledge of SMAP data product capabilities, and expedited the distribution and uses of mission products for a suite of 16 products available. For example, the L-band VOD, which is related to water content in vegetation, is being used to better understand water exchanges in the soil–vegetation–atmosphere continuum.
The SMAP Active–Passive (AP) algorithm – based on data from SMAP and the European Copernicus Program Sentinel-1 C-band synthetic aperture radar (SAR) – will be adapted to work with L-band data from the newly launched NISAR mission. The result will be estimates of global soil moisture at a spatial resolution of 1 km (0.62 mi) or better approximately once per week.
In addition, the data collected during the SMAP mission would be continued and further enhanced by the European Union’s Copernicus Imaging Microwave Radiometer (CIMR) mission if it launches. This proposed multichannel microwave radiometry observatory includes L-band and four other microwave channels sharing a large mesh reflector – like the one used with SMAP. The plan calls for CIMR to follow a similar approach as SMAP for RFI detection and meet the instrument thermal noise and data latency of SMAP for next-mission desired characteristics.
To learn more about what SMAP has accomplished see “A Decade of Global Water Cycle Monitoring: NASA Soil Moisture Active Passive Mission.”
NASA’s Orbiting Carbon Observatory-2 (OCO-2) has been the “gold standard” for atmospheric carbon dioxide (CO2) observations from space for over a decade. The data returned from OCO-2 provide insights into plant health, forest management, forecasting crop yields, fire-risk models, and anticipating droughts.
OCO-3, constructed from spare parts left after OCO-2, was launched to the International Space Station (ISS) in 2019, where it has operated for over five years. OCO-3 extends the global CO2 measurement record while adding new capabilities made possible by being on ISS (e.g., detailed views of urban and tropical regions).
The overarching OCO mission hasn’t just about been about data and hardware. Although both those elements are parts of the story, the human stories woven through the mission’s successes and setbacks are really what holds the mission together. The feature, “A Tapestry of Tales: 10th Anniversary Reflections from NASA’s OCO-2 Mission,” sheds light on some of these personal stories from the OCO-2 and OCO-3 missions.
The individual tales contained in this article reveal the grit and determination behind the scenes of the success of OCO-2 and OCO-3, from the anxiety and excitement surrounding the launch of OCO-2, to moments of fieldwork in the Nevada desert, to internships where wildfire responders turned to OCO-2 data to improve fire-risk models. Taken together, these stories form a “tapestry” that reveals how the OCO-2 and OCO-3 missions continue to illuminate the dynamics of Earth’s atmosphere – one breath at a time.
These personal perspectives underscore that science is not just numbers; it’s people pushing boundaries, navigating failure, and inspiring ways to make our planet safer and healthier. In a time such as this, this is an important reminder.
The joint NASA–U.S. Geological Survey (USGS) Landsat program has been a cornerstone of Earth observation for over 50 years. On July 13, Landsat 9 collected its millionth image: a stunning shot of the Arctic National Wildlife Refuge in Alaska – see Figure. Landsat 9, the most recent satellite in the Landsat series, orbits Earth alongside Landsat 8. Together, these satellites collect invaluable data about Earth’s changing land surface every eight days.
Figure: This Landsat 9 image showing the Beaufort Sea shoreline off Alaska and Canada is just one of the scenes captured and processed on July 13, 2025— the same day the USGS EROS archive reached a milestone of one million Landsat 9 Level-1 products. This false color image was made with bands 6, 5, and 4 from the Operational Land Imager. This remote area allows the pristine wilderness environment to support a diverse wildlife and unique ecosystem that includes various species of mammals, birds, and fish. Landsat Level-1 products from Landsat 1 through Landsat 9 can be downloaded at no charge from a number of systems – visit the Landsat Data Access webpage to learn more. Credit: Public Domain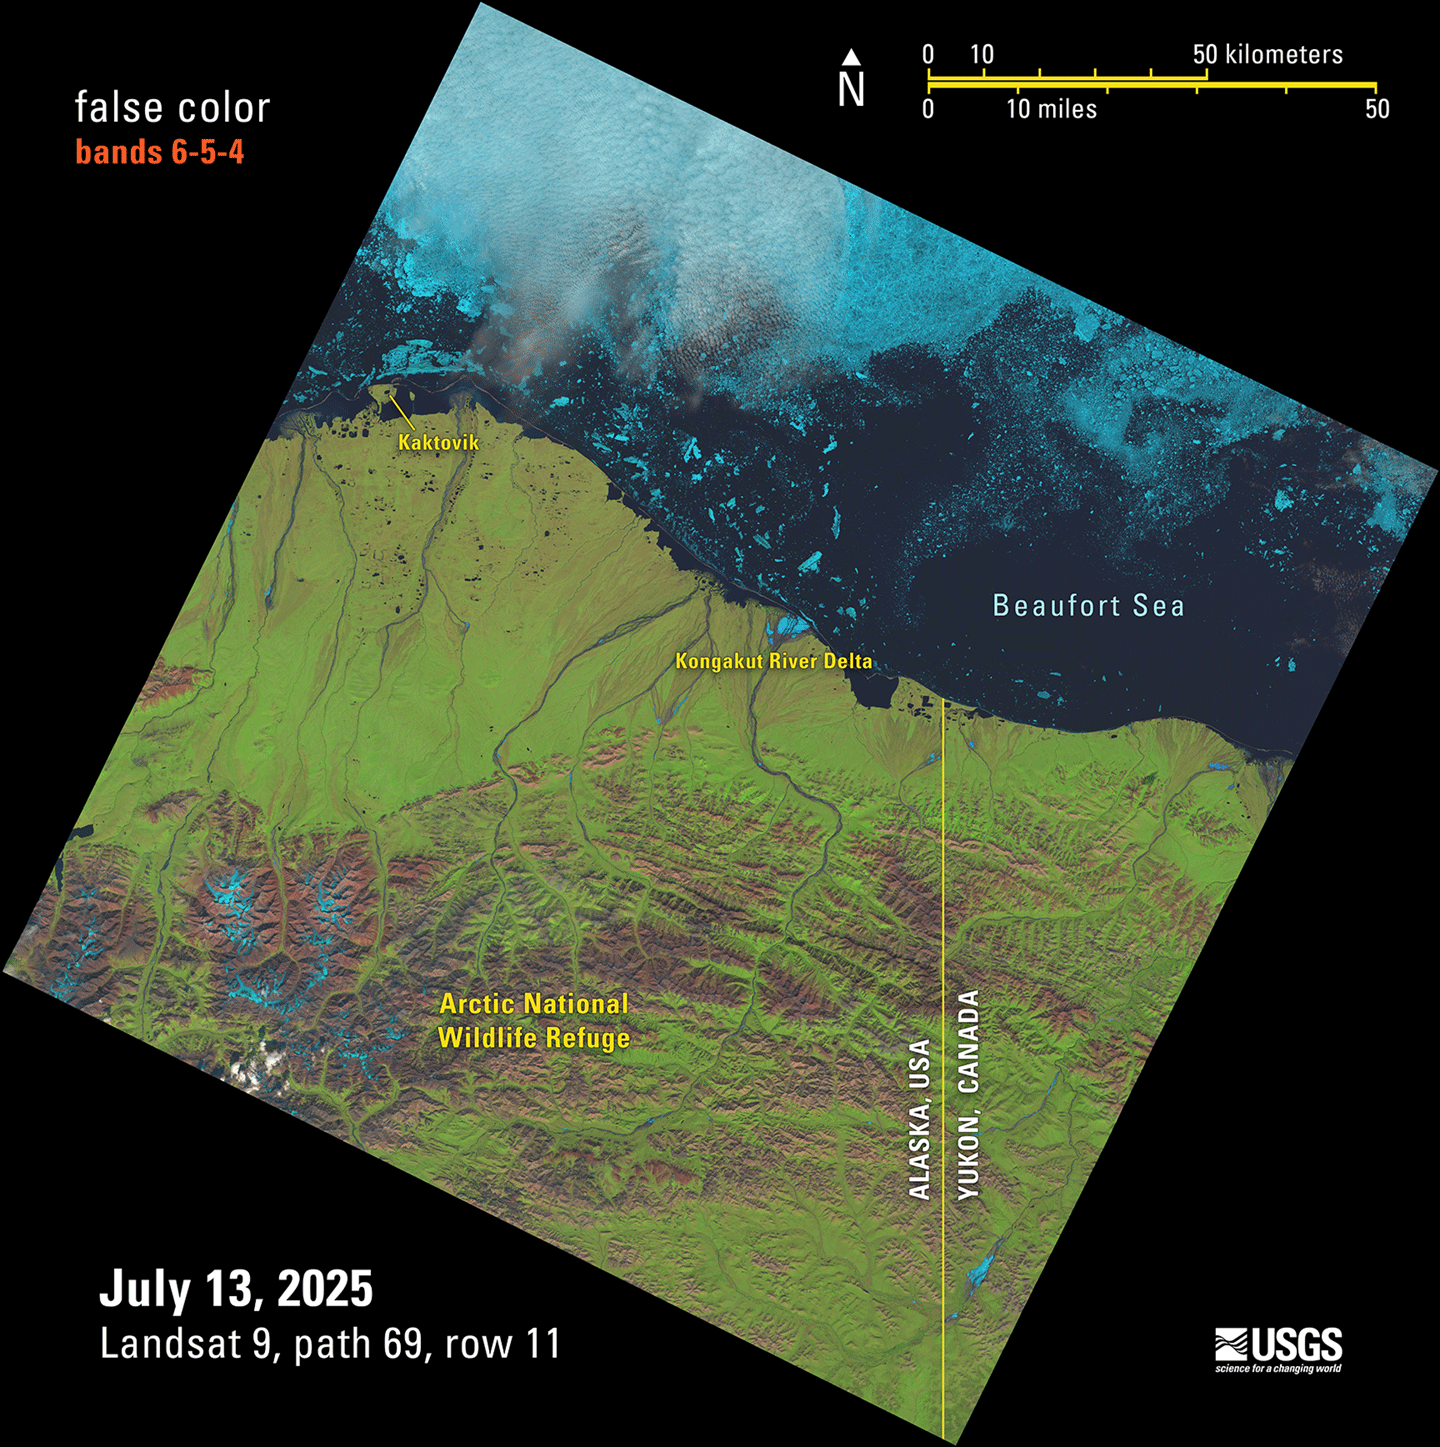
After collecting more than 3.3 million images over the course of more than 26 years in orbit, Landsat 7 was decommissioned on June 4, 2025. A YouTube video released at the time of decommissioning provides a concise visual summary of the Landsat 7 mission’s achievements – and the technical challenges overcome. In addition, The Earth Observer did a feature for the 20th anniversary of Landsat 7 in the July–August 2019 issue, called “The Living Legacy of Landsat 7: Still Going Strong After 20 Years in Orbit” [Volume 31, Issue 4, pp. 4–14] that is a useful resource to learn more about the history and achievements (through 20 years) of the mission.
One of the strengths of the Landsat program is its potential for data integration with other satellites. The Harmonized Landsat and Sentinel-2 (HLS) product exemplifies this collaborative approach by combining data from Landsat 8 and 9 with data from the European Space Agency’s Copernicus Sentinel-2 A, B, and C missions. Whereas Landsat alone has a repeat time of eight days (i.e., combining Landsat 8 and 9 data); the combined HLS dataset provides imagery for the same location on Earth every 1.6 days – enabling researchers to monitor short-term changes in Earth’s land surface much more effectively than using Landsat or Sentinel-2 data alone.
HLS became one of the most-downloaded NASA data products in fiscal year 2024, with continued growth on the horizon. In February 2025, the program expanded with nine new vegetation indices based on HLS data, with historical processing back to 2013 scheduled for completion by early 2026. Low-latency HLS products will also be available in late 2026. For the full story of how HLS came to be – see the feature: “Harmonized Landsat and Sentinel-2: Collaboration Drives Innovation.”
Following a 13-month hibernation, the Global Ecosystem Dynamics Investigation (GEDI) mission was reinstalled to its original location aboard the ISS and resumed operations on April 22, 2024. Since this storage period, GEDI’s lasers have been operating nominally and the mission has continued to produce high-quality observations of the Earth’s three-dimensional structure, amassing 33 billion land surface returns as of November 27, 2024.
The mission team has been actively processing and releasing post-storage data to the public, with Version 2.1 – GEDI L1B, L2A, L2B, and L4A data products, which include data through November 2024, all available for download. The new L4C footprint-level Waveform Structural Complexity Index (WSCI) product using pre-storage data has also been released. Looking ahead, the team is preparing Version 3.0 (V3) of all data products, which will incorporate post-storage data while improving quality filtering, geolocation accuracy, and algorithm performance.
The 2025 GEDI Science Team Meeting (STM) brought together the mission science team, competed science team, representatives from the distributed active archive centers (DAACs), collaborators, stakeholders, and data users. Notably, it marked the first in-person gathering of the second competed science team, who shared updates on their research projects. The STM held an important space for brainstorming, knowledge-sharing, and discussion as the GEDI mission continues to flourish in its second epoch. To learn more, see “Summary of the 2025 GEDI Science Team Meeting.”
Shifting focus to the boreal forests of North America, the NASA Arctic–Boreal Vulnerability Experiment (ABoVE) is now in its final year, marking the end of a decade-long scientific endeavor that has transformed our understanding of environmental change in Alaska and western Canada. This ambitious campaign, funded primarily by NASA’s Terrestrial Ecology Program, has successfully progressed through three distinct phases: ecosystem dynamics (2015–2018), ecosystem services (2017–2022), and the current analysis and synthesis phase (2023–present).
As ABoVE approaches its conclusion, the program has grown to encompass 67 NASA-funded projects with over 1000 participating researchers – a testament to the collaborative scale required to address complex Arctic–boreal ecosystem questions. The program’s integrated approach, combining field research, airborne campaigns, and satellite remote sensing, has generated unprecedented insights into how environmental changes in these northern regions affect both vulnerable ecosystems and society.
The recent 11th – and final – ABoVE Science Team Meeting was an opportunity to showcase the program’s evolution from data collection to synthesis, highlighting successful community engagement initiatives, cutting-edge research on carbon dynamics and ecosystem responses, and innovative science communication strategies that have made this complex research accessible to diverse audiences. With synthesis activities now underway, ABoVE is positioned to deliver comprehensive insights that will inform Arctic and boreal research for years to come. To learn more, see “Summary of the 11th and Final ABoVE Science Team Meeting.”
Last but certainly not least, I want to both recognize and congratulate Compton J. Tucker [GSFC—Senior Researcher]. Compton retired from NASA in March 2025 after 48 years of public service, and then in April, was among 149 newly elected members to the National Academy of Sciences (NAS) – which is one of the highest honors in American science. This recognition from NAS brings Compton’s career full circle. He came to GSFC as a NAS postdoc before joining NASA as a civil servant. Compton is a pioneer in the field of satellite-based environmental analysis, using data from various Landsat missions and from the National Oceanographic and Atmospheric Administration’s (NOAA) Advanced Very High Resolution Radiometer (AVHRR) instrument. His research has focused on global photosynthesis on land, determining land cover, monitoring droughts and food security, and evaluating ecologically coupled disease outbreaks. The Kudos, “Compton J. Tucker Retires from NASA and is Named NAS Fellow,” provides more details about Compton’s research achievements and all of the other scientific awards and honors received throughout his career.
Barry Lefer
Associate Director of Research, Earth Science Division
DNA cassette tape can store every song ever recorded
Antibody cocktail could work as a universal flu treatment
Summary of the 11th ABoVE Science Team Meeting
21 min read
Summary of the 11th ABoVE Science Team MeetingIntroduction
The NASA Arctic–Boreal Vulnerability Experiment (ABoVE) is a large-scale ecological study in the northern regions of North America (Alaska and western Canada) that was developed to understand environmental changes in the region and the implications of those changes for society. Funded primarily by the NASA Terrestrial Ecology Program, this 10-year campaign has included field, airborne, and satellite remote sensing research to address its overarching scientific question of how environmental change in the Arctic and boreal region of western North America will affect vulnerable ecosystems and society.
ABoVE deployed in three phases: 1) ecosystem dynamics (2015–2018); 2) ecosystem services (2017–2022); and 3) analysis and synthesis (2023–present). Now in the last year of the third phase, the Science Team (ST) consists of 67 active NASA-funded projects with more than 1000 individuals participating. The ABoVE ST has met yearly to discuss the progress of individual teams, plan joint field work, and discuss synthesis activities. ABoVE was featured in a 2019 The Earth Observer article, titled “Summary of the 2019 ABoVE Science Team Meeting” [July–August 2019, Volume 31, Issue 4, pp. 19–22], as well as a 2022 The Earth Observer article, titled “Summary of the Eighth ABoVE Science Team Meeting” [September–October 2022, Volume 34, Issue 5, pp. 28–33].
Meeting Overview
The 11th – and final – ABoVE Science Team Meeting (ASTM11) was held May 12–15, 2025, with 96 registered in-person attendees meeting at the University of Alaska, Fairbanks (UAF) and 67 registered virtual attendees – see Photo 1. The meeting included presentations from Phase 3 projects and synthesis reports from thematic working groups (WGs). ABoVE partners, including collaborators [e.g., the Department of Energy’s Next Generation Ecosystem Experiment-Arctic (NGEE-Arctic), Polar Knowledge Canada (POLAR), the Canadian Forest Service (CFS), and the Government of the Northwest Territories (GNWT)] and representatives from upcoming NASA campaigns focusing on the Arctic, shared updates on their activities. Additionally, the meeting featured sessions highlighting cross-project activities, e.g., ABoVE’s participation in regional fire workshops. The meeting also focused on collaborations with the Scotty Creek Research Station in Canada, the many types of science communication activities during ABoVE, and projects conducting collaborative research with community or regional partners.
Photo 1. The 11th Arctic–Boreal Vulnerability Experiment Science Team (ABoVE) meeting group photo of in-person and virtual participants.Photo credit: Peter Griffith, Leane Kending, and David Stroud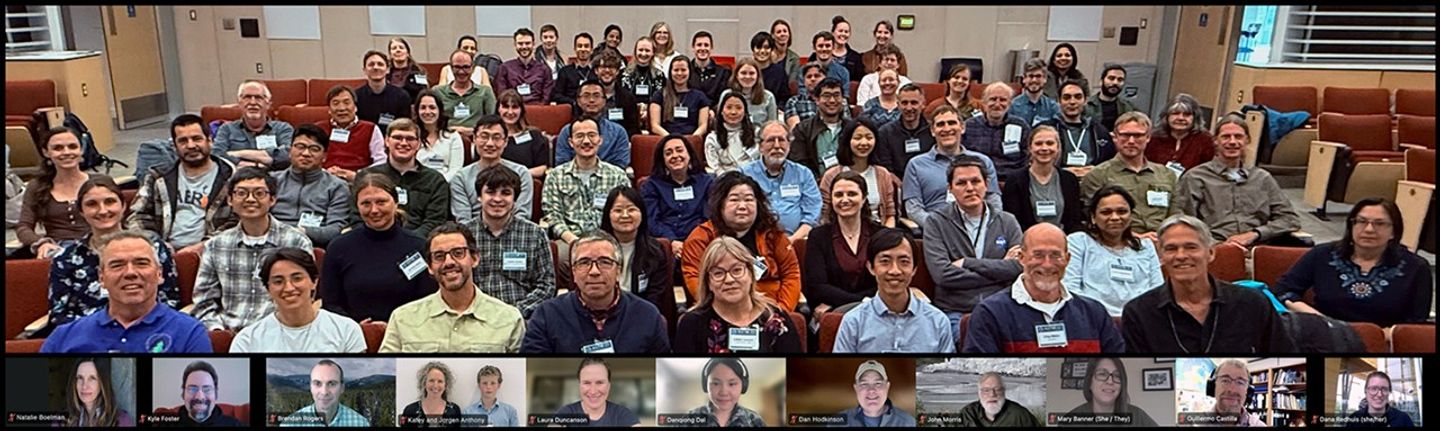
The meeting included additional team activities designed to encourage collaboration and understanding between team members. There were opportunities for multiple field trips for in-person attendees, including visits to the Alaska Satellite Facility (ASF) at the Geophysical Institute, the Permafrost Tunnel operated by the Cold Regions Research and Engineering Laboratory (CRREL), the Yankovich Road Fire Interpretive Trail, and the Arctic Research Open House at UAF – see ABove Field Trips section to learn more. The meeting offered early career researchers a chance to receive feedback on their posters and participate in an Early Career lunch event. The meeting even hosted an ABoVE bingo competition, which encouraged attendees to make new scientific and social connections – see Photo 2.
Photo 2. Scott Goetz [University of Northern Arizona—ABoVE Science Team Lead] poses with ABoVE BINGO winner Wanwan Liang [University of Utah].Photo credit: Wanwan Liang
Meeting Opening
The first day of the meeting began with a series of opening remarks from the ABoVE leadership team. Peter Griffith [NASA’s Goddard Space Flight Center (GSFC)/Science Systems and Applications, Inc. (SSAI)—Chief Scientist, Carbon Cycle and Ecosystems Office (CCEO)], Scott Goetz [Northern Arizona University (NAU)—ABoVE ST Lead], and Ryan Pavlick [NASA Headquarters (HQ)—ABoVE Program Manager] all noted the significance of this final meeting and discussed the major scientific advances of ABoVE made possible through the dedication of ST members, WG leads, planning committees, and contributors who have made ABoVE a success. Goetz reviewed the meeting goals and objectives:
- receive updates about currently funded projects;
- receive reports on Thematic WG advances with an emphasis on multiple WG and cross-phase synthesis activities;
- receive updates on research connections with partners and collaborators;
- discuss, reflect, and document the history of ABoVE, including major advances, lessons learned, and items to accomplish in the time remaining; and
- celebrate ABoVE success stories, with advice for potential future NASA large-scale coordinated campaigns.
Working Group Presentations and Breakouts
Throughout the first few days of the meeting, leads for the thematic working groups (WG) presented synthetic overviews of the research efforts of their group members, identified current gaps in planned or completed research, and discussed potential future work. Following these presentations, breakout groups convened to discuss future activities of the WGs. Short summaries of each presentation are available below. Together, these presentations demonstrate the highly interconnected nature of carbon cycles, hydrology, permafrost dynamics, and disturbance regimes in Arctic–boreal ecosystems. The presentations also showcase the substantial ongoing WG efforts to synthesize findings and identify critical knowledge gaps for future research priorities.
Vegetation Dynamics Working Group
WG Leads: Matthew Macander [Alaska Biological Research, Inc. (ABR)] and Paul Montesano [GSFC/ADNET Systems Inc.]
The Vegetation Dynamics WG discussed new advances in understanding Arctic–boreal vegetation structure and function that have been made over the past 10 years through comprehensive biomass maps and multidecadal trend analyses. ABoVE research revealed a critical boreal forest biome shift with greening in nitrogen-rich northern forests and browning in drought-stressed southern forests. The group has identified key knowledge gaps in predicting post-fire vegetation recovery and detecting pervasive declines in vegetation resilience across southern boreal forests. The results suggest higher vulnerability to abrupt forest loss that could dampen the expected increase in carbon sequestration under future climate scenarios.
Spectral Imaging Working Group
WG Leads: Fred Huemmrich [GSFC/University of Maryland Baltimore County] and Peter Nelson [Laboratory of Ecological Spectroscopy (LECOSPEC)]
Over the past year, the Spectral Imaging WG focused on the fundamental scale problem in Arctic ecology, which refers to the mismatch between observation scales and ecological process scales, which span spatial scales from leaf level to larger study areas and temporal scales from minutes to decades. The Airborne Visible/Infrared Imaging Spectrometer – Next Generation (AVIRIS-NG) and AVIRIS-3 datasets provide the first broad-area and high-spatial and spectral resolution coverage of high-latitude terrestrial ecosystems. The WG is now completing a scaling synthesis paper and preparing for the new era of data-rich spectral imaging with improved capabilities in data management, machine learning, and modeling applications for high-latitude research.
Modeling Working Group
WG Lead: Josh Fisher [Chapman University]
The Modeling WG aims to reduce model uncertainties in simulations and projections in the Arctic–boreal region across all ABoVE ecosystem indicators. The WG had polled the ST to determine the variables most needed for their Earth system models and is now using the field, airborne, and satellite datasets to better constrain these models. This WG discussed the benefits to the modeling community of transforming the more than 100 ABoVE datasets into a common grid and projection format used by modelers.
Carbon Dynamics Working Group
WG Leads: Jonathan Wang [University of Utah] and Jennifer Watts [Woodwell Climate Research Center (WCRC)]
The Carbon Dynamics WG has focused its recent work on three areas: decadal syntheses of carbon dioxide (CO2) fluxes from eddy covariance towers, machine learning approaches to upscaling wetland and lake methane (CH4) emissions, and carbon flux modeling across the Arctic–boreal zone. The research integrated atmospheric CO2 observations to improve carbon flux estimates and examined wildfire impacts on both carbon emissions and albedo changes. A significant component of the work involved comparing top-down versus bottom-up carbon flux models, with particular attention to permafrost and peatland regions.
Hydrology-Permafrost-Wetlands Working Group
WG Leads: Laura Bourgeau-Chavez [Michigan Technological University], David Butman [University of Washington], John Kimball [University of Montana], and Melissa Schwab [University of California, Irvine]
The Hydrology–Permafrost–Wetlands WG focused on the processes controlling changes in permafrost distribution and properties and their impacts. There was discussion about the nature, causes, and consequences of hydrologic change (e.g. water storage, mobility, and distribution) and about ecosystem water, energy, and carbon cycle linkages. The presenters mentioned integration of ABoVE datasets with NASA satellite missions [e.g., NASA–Indian Space Research Organisation (ISRO) Synthetic Aperture Radar (NISAR) and Surface Water and Ocean Topography (SWOT)]. WG members discussed the connections between ABoVE research and several crosscutting initiatives, including two NASA Arctic coastlines efforts [e.g., Frontlines Of Rapidly Transforming Ecosystems Earth Venture Suborbital (FORTE EVS) campaign and NASA’s Arctic-COastal Land Ocean inteRactionS (COLORS)] and the WCRC’s Permafrost Pathways.
Disturbance Working Group
WG Leads: Dong Chen [University of Maryland, College Park] and Jinhyuk Kim [University of California, Irvine]
The Disturbance WG leads presented their decade-long perspective on disturbance-related research in the ABoVE domain. The presentation incorporated artificial intelligence (AI)-generated summaries of ABoVE-affiliated research across multiple disturbance types, including boreal wildfires, tundra wildfires, and thermokarst/permafrost degradation processes. Chen and Kim acknowledged the extensive contributions from researchers and WG members while outlining future directions for disturbance research.
Success Stories
Four “Success Story” presentations and panels took place during ASTM11, which showcased efforts of ABoVE ST members and the leadership team to create and coordinate engagement efforts that spanned individual projects.
Success Story 1: ABoVE Participation in Regional Fire Workshops
A substantial portion of ABoVE research has focused on wildfire, and many members of the ST have participated in domestic and international wildfire efforts, connecting researchers with land managers across Alaska and Canada. Randi Jandt [UAF] discussed the Alaska Fire Science Consortium workshops (held in 2017 and 2022). Jenn Baltzer [Wilfred Laurier University (WLU), Canada] discussed Northwest Territories workshops (held in 2014 and 2025), both of which occurred in response to extreme fire seasons in the region. Laura Bourgeau-Chavez outlined ABoVE’s participation in all of these workshops. The workshops facilitated knowledge exchange and collaboration on critical wildfire management priorities, including fire risk assessment, real-time modeling, post-fire effects, and climate change impacts on fire regimes. Key features included small focus groups, field trips to command centers and fire-affected areas, and integration of Indigenous knowledge with new technologies to inform management practices and climate preparedness strategies.
Success Story 2: Collaborations with Scotty Creek Research Station (SCRS)
ASTM11 participants watched the film, “Scotty Creek Research Community – The Spirit of Collaboration,” about the SCRS, Canada’s first and only Indigenous-led research station. Following the film, station team members participated in a panel discussion. Ramona Pearson [Ramona Pearson Consulting, Canada], Maude Auclair [WLU], Mason Dominico [WLU], Michael McPhee [Sambaa K’e First Nation, Canada], and William “Bill” Quinton [WLU] discussed their decade-long collaboration with ABoVE. The partnership involved ABoVE collecting airborne hyperspectral, lidar, and radar imagery, while SCRS researchers provided field data for calibration and validation. In 2022, management of the station transitioned to Łı́ı́dlı̨ı̨ Kų́ę́ First Nation (LKFN, Canada), and ABoVE continued collaborating through knowledge exchange, including with early-career researchers and interns. When a 2022 fire destroyed the field station and surrounding area, ABoVE flew additional flights to capture airborne imagery observations to allow comparison of pre- and post-fire conditions.
Success Story 3: Science Communication
During the ABoVE field campaign, ST members and CCEO staff engaged in multiple strategies to communicate research results to the public. The activities included interactive engagement through airborne open houses and guest flights, ST member narratives in the “Notes from the Field” blog posts on the NASA Earth Observatory website, and professional multimedia production, including Earth Observatory content and award-winning videos. This multifaceted strategy demonstrates effective scientific communication through direct public engagement and high-quality, multimedia storytelling, making complex research accessible to diverse audiences.
Success Story 4: Engagement Activities
This session highlighted several examples of community engagement across the ABoVE domain. Gerald “J.J.” Frost [ABR] discussed synthesizing ecosystem responses and elder observations in western Alaska for his ABoVE project. In another example, ABoVE researchers from Michigan Tech Research Institute (MTRI) partnered with Ducks Unlimited Canada (DUC) and local organizations. Dana Redhuis [MTRI] and Rebecca Edwards [DUC] described their on-the-land camps that provide hands-on training for Northwest Territories youth in wetlands education and ecological monitoring. Kevin Turner [Brock University, Canada] showcased his work with members of the Vuntut Gwitchin First Nation in Old Crow Flats, Yukon, evaluating how climate and land cover change influence water dynamics and carbon balance. These activities demonstrate collaborative research that integrates Indigenous and Western knowledge approaches to address climate change impacts.
ABoVE Phase 3 Project Presentations
Project leads of the 20 NASA-funded ABoVE Phase 3 projects presented updates that were organized by scientific theme. The presentations spanned multiple days of the meeting. Table 1 below provides all the project titles, presenter names, and links to each project and presentation. Science results from four of the presentations are shown in Figures 1–4 below as indicated in the table.
Table 1. An overview ofABoVE Phase 3 projects and presenters. The Project name includes the last name of the Principal Investigator, NASA funding program (TE for Terrestrial Ecology), the year of the NASA solicitation funding the research, and provides a hyperlink to the Project Profile. A hyperlink to each presentation is provided as either PowerPoint (PPT) file or PDF.
Project CarbonPresenter(s)Bloom (TE 2021): Using CO2, CH4 and land-surface constraints to resolve sign and magnitude of northern high latitude carbon-climate feedbacks [PDF]Eren Bilir [NASA/Jet Propulsion Laboratory (JPL)]; Principal Investigator (PI): Alexis (Anthony) Bloom [NASA/Jet Propulsion Laboratory (JPL)]Butman (TE 2021): Do changing terrestrial-aquatic interfaces in Arctic-boreal landscapes control the form, processing, and fluxes of carbon? [PPT]David Butman [University of Washington] – see Figure 1 Watts (TE 2021): Contributions of tundra and boreal systems to radiative forcing in North America and Russia under contemporary and future conditions [PPT]Jennifer Watts [Woodwell Climate Research Center]Miller-S (TE 2021): A synthesis and reconciliation of greenhouse gas flux estimates across the ABoVE domain [PDF]Scot Miller [Johns Hopkins University]Michalak (TE 2021): Quantifying climate sensitivities of photosynthesis and respiration in Arctic and boreal ecosystems from top-down observational constraints [PDF]Wu Sun and Jiaming Wen [both Carnegie Institution for Science, CI]; PI: Anna Michalak, [Carnegie Institution for Science]FirePresenter(s)Bourgeau-Chavez (TE 2021): Integrating remote sensing and modeling to better understand the vulnerability of boreal-taiga ecosystems to wildfire [PPT]Laura Bourgeau-Chavez [Michigan Technological University (MTU)]Walker (TE 2021): Drivers and Impacts of Reburning in boreal forest Ecosystems (DIRE) [PDF]Jeremy Forsythe [Northern Arizona University (NAU)]; PI: Xanthe Walker [NAU]Wang (TE 2021): Quantifying disturbance and global change impacts on multi-decadal trends in aboveground biomass and land cover across Arctic-boreal North America [PPT]Jonathan Wang [University of Utah]– see Figure 2 WildlifePresenter(s)Boelman (TE 2021): The future of the Forest-Tundra Ecotone: A synthesis that adds interactions among snow, vegetation, and wildlife to the equation [PPT]Natalie Boelman [Lamont-Doherty Earth Observatory, Columbia University]French (TE 2021): Informing wetland policy and management for waterfowl habitat and other ecosystem services using multi-frequency synthetic aperture radar [PPT]Nancy French [MTU] – see Figure 3Hydrology / PermafrostPresenter(s)Du (TE 2021): High resolution mapping of surface soil freeze thaw status and active layer thickness for improving the understanding of permafrost dynamics and vulnerability [PPT]Jinyang Du [University of Montana]Miller (TE 2021): Enhanced methane emissions in transitional permafrost environments: An ABoVE phase 3 synthesis investigation [PPT]Charles “Chip” Miller [NASA/JPL]Tape (TE 2021): Characterizing a widespread disturbance regime in the ABoVE domain: Beaver engineering [PPT]Kenneth Tape [University of Alaska, Fairbanks]Zhuang (TE 2021): Role of linked hydrological, permafrost, ground ice, and land cover changes in regional carbon balance across boreal and Arctic landscapes [PDF]Qianlai Zhuang [Purdue University] Vegetation StructurePresenter(s)Duncanson (TE 2021): Mapping boreal forest biomass recovery rates across gradients of vegetation structure and environmental change [PPT]Paul Montesano [GSFC/ADNET Systems Inc]; PI: Laura Duncanson [University of Maryland]—see Figure 4Lara (TE 2021): ABoVE-Ground characterization of plant species succession in retrogressive thaw slumps using imaging spectroscopy [PPT]Mark Lara [University of Illinois, Urbana-Champaign] Vegetation Dynamics Presenter(s)Frost (TE 2021): Towards a warmer, less frozen future Arctic: Synthesis of drivers, ecosystem responses, and elder observations along bioclimatic gradients in western Alaska [PPT]Gerald “J.J.” Frost [ABR]Goetz (TE 2021): Mapping and modeling attributes of an Arctic-boreal biome shift: Phase-3 applications within the ABoVE domain [PPT]Scott Goetz [NAU]Liu (TE 2021): Characterizing Arctic-boreal vegetation resilience under climate change and disturbances [PPT]Yanlan Liu [The Ohio State University]Townsend (TE 2021): Functional diversity as a driver of gross primary productivity variation across the ABoVE domain [PPT]Philip Townsend [University of Wisconsin]
Determining Aboveground Biomass Density Using ICESat-2 Data and Modeling
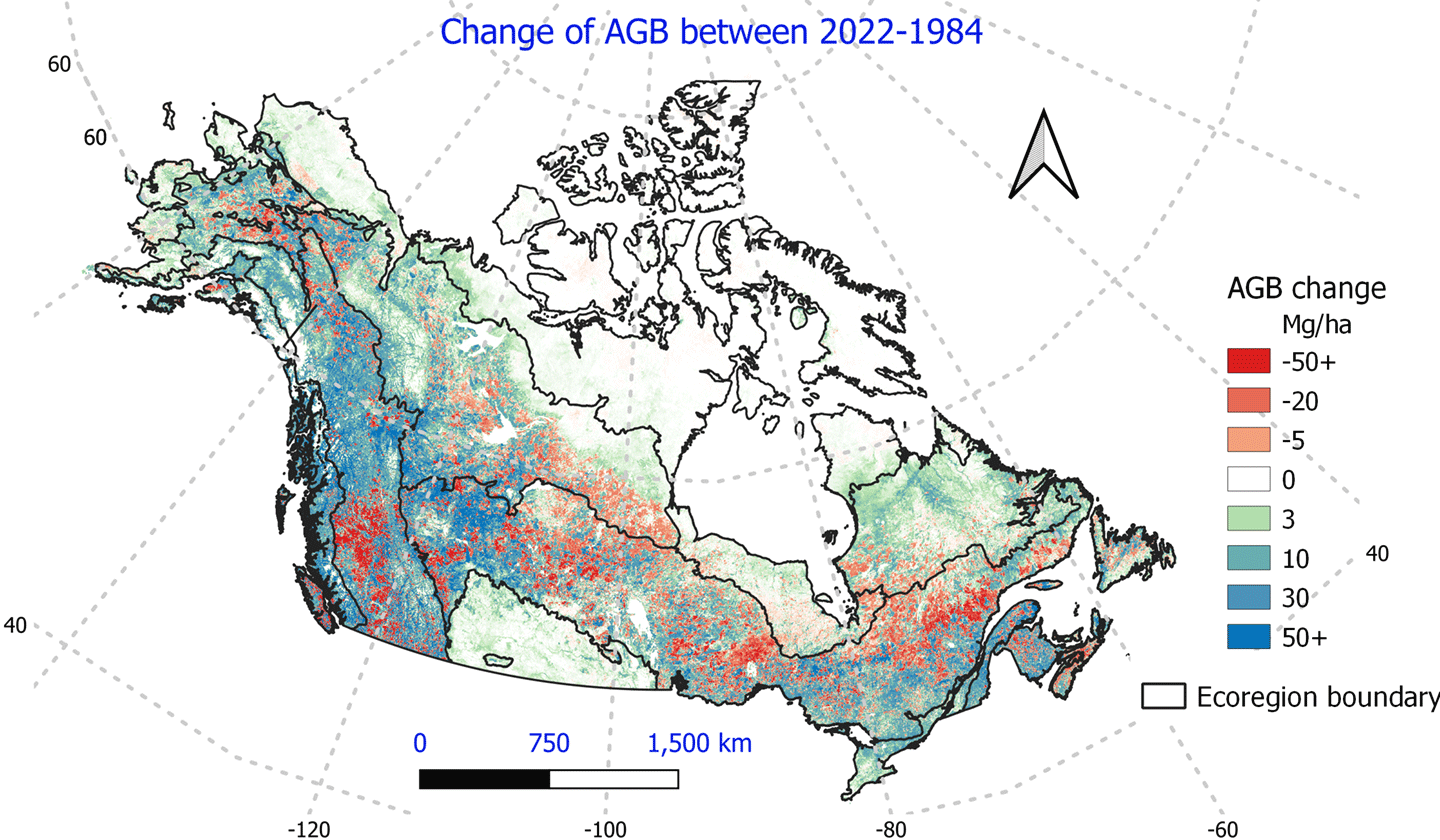
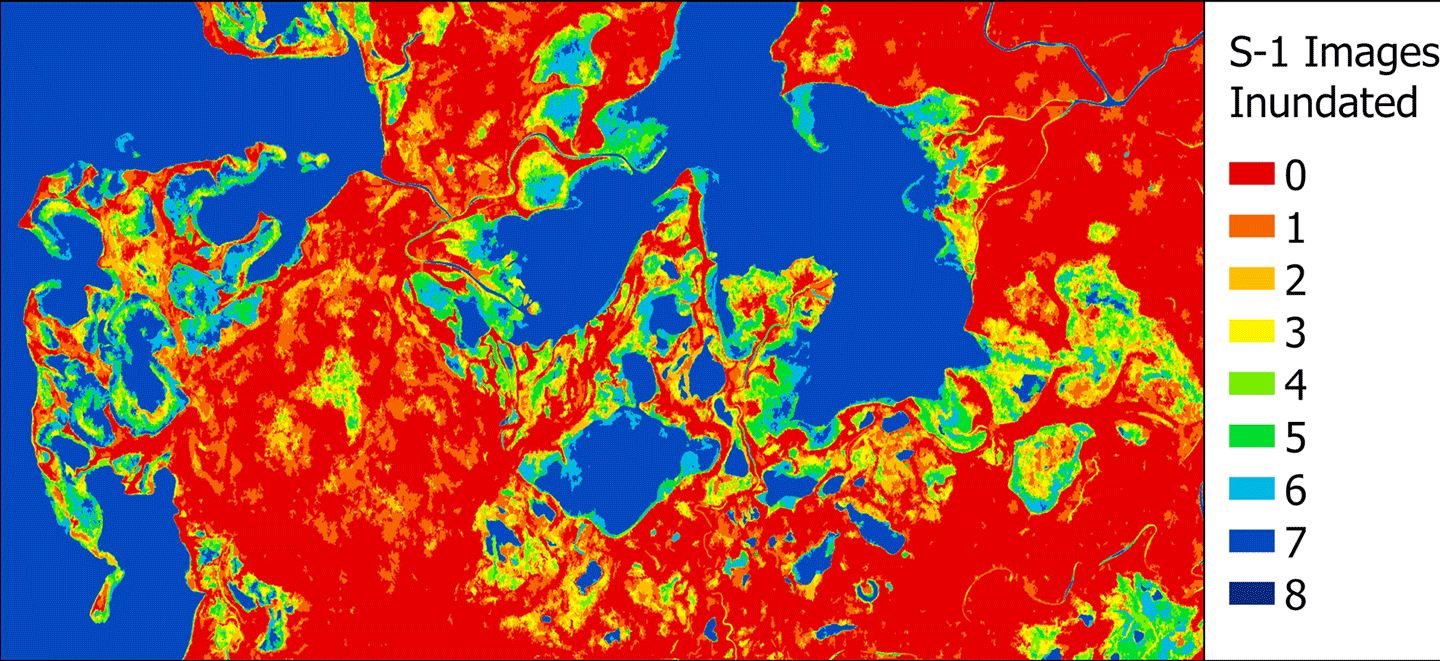
Figure 1. Despite their relatively small coverage, surface water extent across boreal and arctic lowlands significantly impacts landscape-scale estimates of carbon emissions. The red points on the map in the figure indicates locations of available lake chemistry data derived from ABoVE-supported research, from collaborators, and from a preliminary literature search.Figure credit. David Butman Figure 2. The Arctic-boreal carbon cycle is inextricably linked to vegetation composition and demography, both of which are being altered by climate change, rising levels of atmospheric carbon dioxide, and climate-induced changes in disturbance regimes. The map in the figure shows above-ground biomass (AGB) change across Arctic-boreal North America (2022–1984) created using a machine learning model of AGB trained on from more than 45,000 field plots and 200,000 km2 of airborne lidar data.Figure credit: Wanwan Liang Figure 3. Wetlands provide many ecosystem services, including waterfowl habitat, carbon sequestration, and water quality. Northern wetlands in the ABovE study area are threatened from both land use expansion and climate change disruptions, prompting the need for informed management strategies. Copernicus Sentinel 1 synthetic aperture radar (SAR) data have been used to create this map of flooding (hydroperiod) in wetland areas around the Great Slave Lake in Canada. The color code on the map corresponds to the number of times the SAR imagery indicated a place was flooded (inundated). Such information is helpful for predicting within-season changes in wetland extent.Figure credit: Nancy French Figure 4. Advances have been made in mapping aboveground biomass density (AGBD). Shown here as an example is an AGBD map created using stata from the ICESat-2 pan-Boreal 30-m (98-ft) tree height and biomass data product [left] and the ensemble mean of the standard deviation of AGBD, aggregated to modeling tiles [right]. Current research aims to expand these maps and understand regional vegetation changes. Figure credit. Laura Duncanson/data from ORNL DAAC
ASTM11 Poster Sessions
ASTM11 featured 41 research posters across three sessions, organized by thematic area – see Table 3 and Photo 3. The Poster Session agenda details the range of topics that spanned from airborne synthetic aperture radar (SAR) and satellite imagery to northern ecosystem fieldwork. Key research topics that emerged included CO2 and CH4 emissions from terrestrial and aquatic systems, ongoing permafrost thaw, fire impacts on carbon cycling, vegetation mapping and biomass estimation, and the impacts of wildlife on the landscape.
Table 2. A breakdown of ASTM11 poster presentations by science theme.
Poster ThemePoster CountCarbon Dynamics5Crosscutting, Modeling, or Other6Fire Disturbance5Permafrost, Hydrology, and Wetlands13Vegetation Dynamics and Distribution7Vegetation Structure and Function4Wildlife and Ecosystem Services1 Photo 3. Poster presentations and sessions during ASTM11 offered opportunities for presenters to share their latest research findings with meeting participants.Photo credit: Elizabeth Hoy
ABoVE Field Trips
ASTM11 offered multiple field trip options across the Fairbanks region of Alaska. The field trips provided ST members an opportunity to interact with the research community – see Photo 4.
Trip to Alaska Satellite Facility (ASF) and Geophysical Institute
ASF is a data archive for many SAR datasets from a variety of sensors and has multiple ground station facilities. During the tour, participants visited the ASF operations room and ASF rooftop antenna. The Geophysical Institute tour also featured the Alaska Earthquake Center, Wilson Alaska Technical Center, and Alaska Center for Unmanned Aircraft Systems Integration.
Trip to Cold Regions Research and Engineering Laboratory (CRREL) Permafrost Tunnel
The U.S. Army Core of Engineers CRREL Permafrost Tunnel is located in Fox, AK – about 15 km (9 mi) north of Fairbanks. Over 300 m (984 ft) of tunnel have been excavated, exposing Pleistocene ice and carbon-rich yedoma permafrost that ranges in age from 18,000 to 43,000 years old. The tunnel exposes mammoth and bison bones and a variety of permafrost soils. Ongoing projects in the tunnel cover a range of topics, including engineering and geophysical work, Mars analog studies, and biogeochemistry and microbiology of permafrost soils.
Wildfire Walk: Yankovich Road Fire Interpretive Trail
On July 11, 2021, a wildfire burned 3.5 acres (14,164 m2) of UAF land. In 2024, the UAF Alaska Fire Science Consortium, Bureau of Land Management Alaska Fire Service, and local artist Klara Maisch collaborated with others to develop the Wildfire Walk at the site. The interpretive trail is an outdoor learning experience with interpretive wayside markers that describe the fire incident, the relationship between wildfire and the boreal forest, fire science and environmental change, and wildfire prevention – see Figure 1.
UAF Arctic Research Open House
The UAF Arctic Research Open House was an opportunity for ST members and the public to explore the wide range of research happening at UAF and meet other scientists. ABoVE hosted an information table at the event.
Research Connections
The success of ABoVE as a large-scale research study over the Arctic and boreal regions within and outside the United States depended on collaboration with multiple organizations. Many of the ABoVE collaborators were able to present at ASTM11.
Andrew Applejohn [Polar Knowledge Canada (POLAR)] provided details about the scope, mandate, and facilities available through POLAR, a Canadian government agency that has partnered with the ABoVE ST for the duration of the campaign.
Ryan Connon [Government of the Northwest Territories (GNWT)] discussed the decade-long collaboration between ABoVE and the GNWT, including knowledge sharing of wildlife collar data, field-data ground measurements, and remote sensing analyses.
Gabrielle Gascon [Canadian Forest Service (CFS), Natural Resources Canada] explained the scope of Canada’s National Forest Inventory and the current CFS focus on wildfire and the CFS’s other areas of research related to the northern regions. Another presentation featured information about various vegetation mapping initiatives where Matthew Macander discussed an Alaska-based effort called AKVEG Map, a vegetation plot database, and Logan Berner [NAU] detailed a pan-Arctic plant aboveground biomass synthesis dataset.
Brendan Rogers [WCRC] showcased research from Permafrost Pathways, designed to bring together permafrost-related science experts with local communities to inform Arctic policy and develop adaptation and mitigation strategies to address permafrost thaw. NGEE-Arctic is another U.S. government effort that partnered specifically with ABoVE for the duration of the two efforts, and Bob Bolton [Oak Ridge National Laboratory (ORNL)] provided updates on the project.
Tomoko Tanabe [Japan’s National Institute of Polar Research (JNIPR)] gave a presentation about NIPR to better inform ABoVE scientists about other international Arctic efforts, including a new Japanese Arctic research initiative called the Arctic Challenge for Sustainability III (ArCS III), designed to address social issues related to environmental and social changes in the Arctic.
Additional Presentations
An additional presentation aimed to keep the ABoVE ST informed of future NASA Arctic research efforts. Kelsey Bisson [NASA HQ—Program Scientist for the Ocean Biology and Biogeochemistry Program] discussed NASA Arctic-COLORS and Maria Tzortziou [City University of New York/Columbia University, LDEO] discussed the FORTE EVS campaign. The proposed Arctic-COLORS field campaign would quantify the biogeochemical and ecological response of Arctic nearshore systems to rapid changes in terrestrial fluxes and ice conditions. The NASA FORTE EVS campaign will fill a critical gap in understanding Alaska’s northernmost ecosystems by investigating eroding coastlines, rivers, deltas, and estuaries that connect land and sea systems, using airborne platforms.
Scott Goetz continued with a presentation on U.S. efforts to plan the International Polar Year, scheduled for 2032–2033. Ryan Pavlick provided details on the NISAR mission, which launched after the meeting on July 30, 2025, and discussed other possible future NASA missions.
A Career Trajectory panel featured Jennifer Watts, Jonathan Wang, Brendan Rogers, and Xiaoran “Seamore” Zhu [Boston University]. The panelists discussed opportunities for researchers from different academic backgrounds and at different career stages, and they provided details about how ABoVE has impacted their careers. They also discussed how NASA campaigns offer opportunities for early career scientists to join a team of peers to grow their abilities throughout the duration of the decade-long research.
Klara Maisch, a local artist, discussed her work creating science-informed artwork through interdisciplinary collaborations with scientists and other creators – see Figure 5. Maisch described the benefits of partnering with artists to share science with a broad audience and showcased artwork she has created.
Figure 5. Lower Tanana Homelands – 2022 Yankovich Fire – Plot Painting [left], with original plot reference photograph [right].Image Credit: Klara Maisch
Overarching Presentations
A series of presentations on the overall structure and outcomes of ABoVE were held during ASTM11. Charles “Chip” Miller [NASA/JPL—Deputy ABoVE ST Lead, ABoVE Airborne Lead] provided details about SAR, hyperspectral, and lidar airborne measurements collected between 2017 and 2024 for the ABoVE Airborne Campaign.
ABoVE Logistics Office members Daniel Hodkinson [GSFC/SSAI], Sarah Dutton [GSFC/SSAI], and Leanne Kendig [GSFC/Global Science & Technology, Inc. (GST, Inc.)] discussed the many field teams and activities supported during ABoVE. Overall, more than 50 teams were trained in field safety topics, with more than 1,200 training certificates awarded. Elizabeth Hoy [NASA GSFC/GST, Inc.] and Debjani Singh [ORNL] discussed the more than 250 data products developed during the ABoVE program and how to access them through NASA Earthdata. Example visualizations of ABoVE data products can be found in Figure 6.
Figure 6. ABoVE logo created with different data products from the campaign used to compose each letter. A: Active Layer Thickness from Remote Sensing Permafrost Model, Alaska, 2001-2015; Tree (inside A): Normalized Difference Vegetation Index (NDVI) Trends across Alaska and Canada from Landsat, 1984-2012; B: Landsat-derived Annual Dominant Land Cover Across ABoVE Core Domain, 1984-2014; O: Wildfire Carbon Emissions and Burned Plot Characteristics, NWT, CA, 2014-2016; V: AVHRR-Derived Forest Fire Burned Area-Hot Spots, Alaska and Canada, 1989-2000; E: Lake Bathymetry Maps derived from Landsat and Random Forest Modeling, North Slope, AK; and Underline (under O): Plot lines from the ABoVE Planning Tool visualizer.Figure credit: Caitlin LaNeve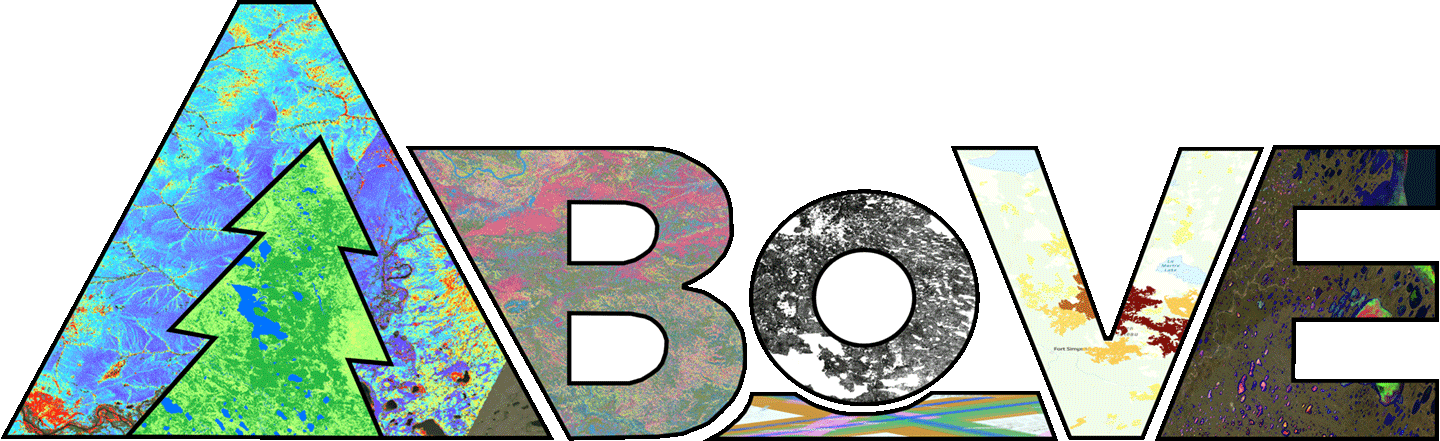
The Collaborations and Engagement WG held a plenary discussion to highlight the many activities that ABoVE researchers have been involved in over the past decade. The discussion highlighted the need for individual projects and campaign leadership to work together to ensure participation and understanding of planned research at local and regional levels.
A highlight of the meeting was the “Legacy of ABoVE” panel discussion moderated by Nancy French [MTU]. Panelists included Eric Kasischke [MTU], Scott Goetz, Chip Miller, Peter Griffith, Libby Larson [NASA GSFC/SSAI], and Elizabeth Hoy. Each panelist reflected on their journey to develop ABoVE, which included an initial scoping study developed more than 15 years ago. Members of the panel – all a part of the ABoVE leadership team – joined the campaign at different stages of their career. Each panelist arrived with different backgrounds, bringing their unique perspective to the group that helped to frame the overall campaign development. Following the panel, all ST members who have been a part of ABoVE since its start over a decade ago came to the front for a group photo – see Photo 5.
Following the panel, the ABoVE ST leads presented their overall thoughts on the meeting and facilitated a discussion with all participants at the meeting. Participants noted the important scientific discoveries made during ABoVE and enjoyed the collegial atmosphere during ASTM11.
Photo 5. A group photo of participants who have been with ABoVE since its inception: [left to right] Ryan Pavlick, Chip Miller, Elizabeth Hoy, Libby Larson, Peter Griffith, Fred Huemmrich, Nancy French, Scott Goetz, Laura Bourgeau-Chavez, Eric Kasischke, and Larry Hinzman.Photo credit: Peter Griffith
Conclusion
Overall, ASTM11 brought together an interdisciplinary team for a final team meeting that showcased the many accomplishments made over the past decade. The group outlined current gaps and needs in Arctic and boreal research and discussed possibilities for future NASA terrestrial ecology campaigns. The synthesis science presentations at ASTM11 highlighted the advances ABoVE has made in understanding carbon and ecosystem dynamics in Arctic and boreal regions. It also highlighted the need for further study of cold season and subsurface processes. While this was the last meeting of this ST, research for some projects will continue into 2026, and more publications and data products are expected from ST members in the near term.
Elizabeth Hoy
NASA’s Goddard Space Flight Center/Global Science & Technology Inc. (GSFC/GST,Inc.)
elizabeth.hoy@nasa.gov
Libby Larson
NASA’s Goddard Space Flight Center/Science System and Applications, Inc. (GSFC/SSAI)
libby.larson@nasa.gov
Annabelle Sokolowski
NASA GSFC Office of STEM Engagement (OSTEM) Intern
Caitlin LaNeve
NASA GSFC Office of STEM Engagement (OSTEM) Intern
Summary of the 11th ABoVE Science Team Meeting
21 min read
Summary of the 11th ABoVE Science Team MeetingIntroduction
The NASA Arctic–Boreal Vulnerability Experiment (ABoVE) is a large-scale ecological study in the northern regions of North America (Alaska and western Canada) that was developed to understand environmental changes in the region and the implications of those changes for society. Funded primarily by the NASA Terrestrial Ecology Program, this 10-year campaign has included field, airborne, and satellite remote sensing research to address its overarching scientific question of how environmental change in the Arctic and boreal region of western North America will affect vulnerable ecosystems and society.
ABoVE deployed in three phases: 1) ecosystem dynamics (2015–2018); 2) ecosystem services (2017–2022); and 3) analysis and synthesis (2023–present). Now in the last year of the third phase, the Science Team (ST) consists of 67 active NASA-funded projects with more than 1000 individuals participating. The ABoVE ST has met yearly to discuss the progress of individual teams, plan joint field work, and discuss synthesis activities. ABoVE was featured in a 2019 The Earth Observer article, titled “Summary of the 2019 ABoVE Science Team Meeting” [July–August 2019, Volume 31, Issue 4, pp. 19–22], as well as a 2022 The Earth Observer article, titled “Summary of the Eighth ABoVE Science Team Meeting” [September–October 2022, Volume 34, Issue 5, pp. 28–33].
Meeting Overview
The 11th – and final – ABoVE Science Team Meeting (ASTM11) was held May 12–15, 2025, with 96 registered in-person attendees meeting at the University of Alaska, Fairbanks (UAF) and 67 registered virtual attendees – see Photo 1. The meeting included presentations from Phase 3 projects and synthesis reports from thematic working groups (WGs). ABoVE partners, including collaborators [e.g., the Department of Energy’s Next Generation Ecosystem Experiment-Arctic (NGEE-Arctic), Polar Knowledge Canada (POLAR), the Canadian Forest Service (CFS), and the Government of the Northwest Territories (GNWT)] and representatives from upcoming NASA campaigns focusing on the Arctic, shared updates on their activities. Additionally, the meeting featured sessions highlighting cross-project activities, e.g., ABoVE’s participation in regional fire workshops. The meeting also focused on collaborations with the Scotty Creek Research Station in Canada, the many types of science communication activities during ABoVE, and projects conducting collaborative research with community or regional partners.
Photo 1.The 11th Arctic–Boreal Vulnerability Experiment Science Team (ABoVE) meeting group photo of in-person and virtual participants. Photo credit: Peter Griffith, Leane Kending, and David StroudThe meeting included additional team activities designed to encourage collaboration and understanding between team members. There were opportunities for multiple field trips for in-person attendees, including visits to the Alaska Satellite Facility (ASF) at the Geophysical Institute, the Permafrost Tunnel operated by the Cold Regions Research and Engineering Laboratory (CRREL), the Yankovich Road Fire Interpretive Trail, and the Arctic Research Open House at UAF – see ABove Field Trips section to learn more. The meeting offered early career researchers a chance to receive feedback on their posters and participate in an Early Career lunch event. The meeting even hosted an ABoVE bingo competition, which encouraged attendees to make new scientific and social connections – see Photo 2.
Photo 2. Scott Goetz [University of Northern Arizona—ABoVE Science Team Lead] poses with ABoVE BINGO winner Wanwan Liang [University of Utah]. Photo credit: Wanwan LiangMeeting Opening
The first day of the meeting began with a series of opening remarks from the ABoVE leadership team. Peter Griffith [NASA’s Goddard Space Flight Center (GSFC)/Science Systems and Applications, Inc. (SSAI)—Chief Scientist, Carbon Cycle and Ecosystems Office (CCEO)], Scott Goetz [Northern Arizona University (NAU)—ABoVE ST Lead], and Ryan Pavlick [NASA Headquarters (HQ)—ABoVE Program Manager] all noted the significance of this final meeting and discussed the major scientific advances of ABoVE made possible through the dedication of ST members, WG leads, planning committees, and contributors who have made ABoVE a success. Goetz reviewed the meeting goals and objectives:
- receive updates about currently funded projects;
- receive reports on Thematic WG advances with an emphasis on multiple WG and cross-phase synthesis activities;
- receive updates on research connections with partners and collaborators;
- discuss, reflect, and document the history of ABoVE, including major advances, lessons learned, and items to accomplish in the time remaining; and
- celebrate ABoVE success stories, with advice for potential future NASA large-scale coordinated campaigns.
Working Group Presentations and Breakouts
Throughout the first few days of the meeting, leads for the thematic working groups (WG) presented synthetic overviews of the research efforts of their group members, identified current gaps in planned or completed research, and discussed potential future work. Following these presentations, breakout groups convened to discuss future activities of the WGs. Short summaries of each presentation are available below. Together, these presentations demonstrate the highly interconnected nature of carbon cycles, hydrology, permafrost dynamics, and disturbance regimes in Arctic–boreal ecosystems. The presentations also showcase the substantial ongoing WG efforts to synthesize findings and identify critical knowledge gaps for future research priorities.
Vegetation Dynamics Working Group
WG Leads: Matthew Macander [Alaska Biological Research, Inc. (ABR)] and Paul Montesano [GSFC/ADNET Systems Inc.]
The Vegetation Dynamics WG discussed new advances in understanding Arctic–boreal vegetation structure and function that have been made over the past 10 years through comprehensive biomass maps and multidecadal trend analyses. ABoVE research revealed a critical boreal forest biome shift with greening in nitrogen-rich northern forests and browning in drought-stressed southern forests. The group has identified key knowledge gaps in predicting post-fire vegetation recovery and detecting pervasive declines in vegetation resilience across southern boreal forests. The results suggest higher vulnerability to abrupt forest loss that could dampen the expected increase in carbon sequestration under future climate scenarios.
Spectral Imaging Working Group
WG Leads: Fred Huemmrich [GSFC/University of Maryland Baltimore County] and Peter Nelson [Laboratory of Ecological Spectroscopy (LECOSPEC)]
Over the past year, the Spectral Imaging WG focused on the fundamental scale problem in Arctic ecology, which refers to the mismatch between observation scales and ecological process scales, which span spatial scales from leaf level to larger study areas and temporal scales from minutes to decades. The Airborne Visible/Infrared Imaging Spectrometer – Next Generation (AVIRIS-NG) and AVIRIS-3 datasets provide the first broad-area and high-spatial and spectral resolution coverage of high-latitude terrestrial ecosystems. The WG is now completing a scaling synthesis paper and preparing for the new era of data-rich spectral imaging with improved capabilities in data management, machine learning, and modeling applications for high-latitude research.
Modeling Working Group
WG Lead: Josh Fisher [Chapman University]
The Modeling WG aims to reduce model uncertainties in simulations and projections in the Arctic–boreal region across all ABoVE ecosystem indicators. The WG had polled the ST to determine the variables most needed for their Earth system models and is now using the field, airborne, and satellite datasets to better constrain these models. This WG discussed the benefits to the modeling community of transforming the more than 100 ABoVE datasets into a common grid and projection format used by modelers.
Carbon Dynamics Working Group
WG Leads: Jonathan Wang [University of Utah] and Jennifer Watts [Woodwell Climate Research Center (WCRC)]
The Carbon Dynamics WG has focused its recent work on three areas: decadal syntheses of carbon dioxide (CO2) fluxes from eddy covariance towers, machine learning approaches to upscaling wetland and lake methane (CH4) emissions, and carbon flux modeling across the Arctic–boreal zone. The research integrated atmospheric CO2 observations to improve carbon flux estimates and examined wildfire impacts on both carbon emissions and albedo changes. A significant component of the work involved comparing top-down versus bottom-up carbon flux models, with particular attention to permafrost and peatland regions.
Hydrology-Permafrost-Wetlands Working Group
WG Leads: Laura Bourgeau-Chavez [Michigan Technological University], David Butman [University of Washington], John Kimball [University of Montana], and Melissa Schwab [University of California, Irvine]
The Hydrology–Permafrost–Wetlands WG focused on the processes controlling changes in permafrost distribution and properties and their impacts. There was discussion about the nature, causes, and consequences of hydrologic change (e.g. water storage, mobility, and distribution) and about ecosystem water, energy, and carbon cycle linkages. The presenters mentioned integration of ABoVE datasets with NASA satellite missions [e.g., NASA–Indian Space Research Organisation (ISRO) Synthetic Aperture Radar (NISAR) and Surface Water and Ocean Topography (SWOT) missions]. WG members discussed the connections between ABoVE research and several crosscutting initiatives, including two NASA Arctic coastlines efforts [e.g., Frontlines Of Rapidly Transforming Ecosystems Earth Venture Suborbital (FORTE EVS) campaign and NASA’s Arctic-COastal Land Ocean InteRactionS (COLORS)] and the WCRC’s Permafrost Pathways.
Disturbance Working Group
WG Leads: Dong Chen [University of Maryland, College Park] and Jinhyuk Kim [University of California, Irvine]
The Disturbance WG leads presented their decade-long perspective on disturbance-related research in the ABoVE domain. The presentation incorporated artificial intelligence (AI)-generated summaries of ABoVE-affiliated research across multiple disturbance types, including boreal wildfires, tundra wildfires, and thermokarst/permafrost degradation processes. Chen and Kim acknowledged the extensive contributions from researchers and WG members while outlining future directions for disturbance research.
Success Stories
Four “Success Story” presentations and panels took place during ASTM11, which showcased efforts of ABoVE ST members and the leadership team to create and coordinate engagement efforts that spanned individual projects.
Success Story 1: ABoVE Participation in Regional Fire Workshops
A substantial portion of ABoVE research has focused on wildfire, and many members of the ST have participated in domestic and international wildfire efforts, connecting researchers with land managers across Alaska and Canada. Randi Jandt [UAF] discussed the Alaska Fire Science Consortium workshops (held in 2017 and 2022). Jenn Baltzer [Wilfred Laurier University (WLU), Canada] discussed Northwest Territories workshops (held in 2014 and 2025), both of which occurred in response to extreme fire seasons in the region. Laura Bourgeau-Chavez outlined ABoVE’s participation in all of these workshops. The workshops facilitated knowledge exchange and collaboration on critical wildfire management priorities, including fire risk assessment, real-time modeling, post-fire effects, and climate change impacts on fire regimes. Key features included small focus groups, field trips to command centers and fire-affected areas, and integration of Indigenous knowledge with new technologies to inform management practices and climate preparedness strategies.
Success Story 2: Collaborations with Scotty Creek Research Station (SCRS)
ASTM11 participants watched the film, “Scotty Creek Research Community – The Spirit of Collaboration,” about the SCRS, Canada’s first and only Indigenous-led research station. Following the film, station team members participated in a panel discussion. Ramona Pearson [Ramona Pearson Consulting, Canada], Maude Auclair [WLU], Mason Dominico [WLU], Michael McPhee [Sambaa K’e First Nation, Canada], and William “Bill” Quinton [WLU] discussed their decade-long collaboration with ABoVE. The partnership involved ABoVE collecting airborne hyperspectral, lidar, and radar imagery, while SCRS researchers provided field data for calibration and validation. In 2022, management of the station transitioned to Łı́ı́dlı̨ı̨ Kų́ę́ First Nation (LKFN, Canada), and ABoVE continued collaborating through knowledge exchange, including with early-career researchers and interns. When a 2022 fire destroyed the field station and surrounding area, ABoVE flew additional flights to capture airborne imagery observations to allow comparison of pre- and post-fire conditions.
Success Story 3: Science Communication
During the ABoVE field campaign, ST members and CCEO staff engaged in multiple strategies to communicate research results to the public. The activities included interactive engagement through airborne open houses and guest flights, ST member narratives in the “Notes from the Field” blog posts on the NASA Earth Observatory website, and professional multimedia production, including Earth Observatory content and award-winning videos. This multifaceted strategy demonstrates effective scientific communication through direct public engagement and high-quality, multimedia storytelling, making complex research accessible to diverse audiences.
Success Story 4: Engagement Activities
This session highlighted several examples of community engagement across the ABoVE domain. Gerald “J.J.” Frost [ABR] discussed synthesizing ecosystem responses and elder observations in western Alaska for his ABoVE project. In another example, ABoVE researchers from Michigan Tech Research Institute (MTRI) partnered with Ducks Unlimited Canada (DUC) and local organizations. Dana Redhuis [MTRI] and Rebecca Edwards [DUC] described their on-the-land camps that provide hands-on training for Northwest Territories youth in wetlands education and ecological monitoring. Kevin Turner [Brock University, Canada] showcased his work with members of the Vuntut Gwitchin First Nation in Old Crow Flats, Yukon, evaluating how climate and land cover change influence water dynamics and carbon balance. These activities demonstrate collaborative research that integrates Indigenous and Western knowledge approaches to address climate change impacts.
ABoVE Phase 3 Project Presentations
Project leads of the 20 NASA-funded ABoVE Phase 3 projects presented updates that were organized by scientific theme. The presentations spanned multiple days of the meeting. Table 1 below provides all the project titles, presenter names, and links to each project and presentation. Science results from four of the presentations are shown in Figures 1–4 below as indicated in the table.
Table 1. An overview ofABoVE Phase 3 projects and presenters. The Project name includes the last name of the Principal Investigator, NASA funding program (TE for Terrestrial Ecology), the year of the NASA solicitation funding the research, and provides a hyperlink to the Project Profile. A hyperlink to each presentation is provided as either PowerPoint (PPT) file or PDF.
Project Carbon Presenter(s) Bloom (TE 2021): Using CO2, CH4 and land-surface constraints to resolve sign and magnitude of northern high latitude carbon-climate feedbacks [PDF] Eren Bilir [NASA/Jet Propulsion Laboratory (JPL)]; Principal Investigator (PI): Alexis (Anthony) Bloom [NASA/Jet Propulsion Laboratory (JPL)] Butman (TE 2021): Do changing terrestrial-aquatic interfaces in Arctic-boreal landscapes control the form, processing, and fluxes of carbon? [PPT] David Butman [University of Washington] – see Figure 1 Watts (TE 2021): Contributions of tundra and boreal systems to radiative forcing in North America and Russia under contemporary and future conditions [PPT] Jennifer Watts [Woodwell Climate Research Center] Miller-S (TE 2021): A synthesis and reconciliation of greenhouse gas flux estimates across the ABoVE domain [PDF] Scot Miller [Johns Hopkins University] Michalak (TE 2021): Quantifying climate sensitivities of photosynthesis and respiration in Arctic and boreal ecosystems from top-down observational constraints [PDF] Wu Sun and Jiaming Wen [both Carnegie Institution for Science, CI]; PI: Anna Michalak, [Carnegie Institution for Science] Fire Presenter(s) Bourgeau-Chavez (TE 2021): Integrating remote sensing and modeling to better understand the vulnerability of boreal-taiga ecosystems to wildfire [PPT] Laura Bourgeau-Chavez [Michigan Technological University (MTU)] Walker (TE 2021): Drivers and Impacts of Reburning in boreal forest Ecosystems (DIRE) [PDF] Jeremy Forsythe [Northern Arizona University (NAU)]; PI: Xanthe Walker [NAU] Wang (TE 2021): Quantifying disturbance and global change impacts on multi-decadal trends in aboveground biomass and land cover across Arctic-boreal North America [PPT] Jonathan Wang [University of Utah]– see Figure 2 Wildlife Presenter(s) Boelman (TE 2021): The future of the Forest-Tundra Ecotone: A synthesis that adds interactions among snow, vegetation, and wildlife to the equation [PPT] Natalie Boelman [Lamont-Doherty Earth Observatory, Columbia University] French (TE 2021): Informing wetland policy and management for waterfowl habitat and other ecosystem services using multi-frequency synthetic aperture radar [PPT] Nancy French [MTU] – see Figure 3 Hydrology / Permafrost Presenter(s) Du (TE 2021): High resolution mapping of surface soil freeze thaw status and active layer thickness for improving the understanding of permafrost dynamics and vulnerability [PPT] Jinyang Du [University of Montana] Miller (TE 2021): Enhanced methane emissions in transitional permafrost environments: An ABoVE phase 3 synthesis investigation [PPT] Charles “Chip” Miller [NASA/JPL] Tape (TE 2021): Characterizing a widespread disturbance regime in the ABoVE domain: Beaver engineering [PPT] Kenneth Tape [University of Alaska, Fairbanks] Zhuang (TE 2021): Role of linked hydrological, permafrost, ground ice, and land cover changes in regional carbon balance across boreal and Arctic landscapes [PDF] Qianlai Zhuang [Purdue University] Vegetation Structure Presenter(s) Duncanson (TE 2021): Mapping boreal forest biomass recovery rates across gradients of vegetation structure and environmental change [PPT] Paul Montesano [GSFC/ADNET Systems Inc]; PI: Laura Duncanson [University of Maryland]—see Figure 4 Lara (TE 2021): ABoVE-Ground characterization of plant species succession in retrogressive thaw slumps using imaging spectroscopy [PPT] Mark Lara [University of Illinois, Urbana-Champaign] Vegetation Dynamics Presenter(s) Frost (TE 2021): Towards a warmer, less frozen future Arctic: Synthesis of drivers, ecosystem responses, and elder observations along bioclimatic gradients in western Alaska [PPT] Gerald “J.J.” Frost [ABR] Goetz (TE 2021): Mapping and modeling attributes of an Arctic-boreal biome shift: Phase-3 applications within the ABoVE domain [PPT] Scott Goetz [NAU] Liu (TE 2021): Characterizing Arctic-boreal vegetation resilience under climate change and disturbances [PPT] Yanlan Liu [The Ohio State University] Townsend (TE 2021): Functional diversity as a driver of gross primary productivity variation across the ABoVE domain [PPT] Philip Townsend [University of Wisconsin]Determining Aboveground Biomass Density Using ICESat-2 Data and Modeling
Figure 1. Despite their relatively small coverage, surface water extent across boreal and arctic lowlands significantly impacts landscape-scale estimates of carbon emissions. The red points on the map in the figure indicates locations of available lake chemistry data derived from ABoVE-supported research, from collaborators, and from a preliminary literature search. Figure credit. David Butman Figure 2. The Arctic-boreal carbon cycle is inextricably linked to vegetation composition and demography, both of which are being altered by climate change, rising levels of atmospheric carbon dioxide, and climate-induced changes in disturbance regimes. The map in the figure shows above-ground biomass (AGB) change across Arctic-boreal North America (2022–1984) created using a machine learning model of AGB trained on from more than 45,000 field plots and 200,000 km2 of airborne lidar data. Figure credit: Wanwan Liang Figure 3. Wetlands provide many ecosystem services, including waterfowl habitat, carbon sequestration, and water quality. Northern wetlands Iin the ABovE study area) are threatened from both land use expansion and climate change disruptions, prompting the need for informed management strategies. Copernicus Sentinel 1 synthetic aperture radar (SAR) data have been used to create this map of flooding (hydroperiod) in wetland areas around the Great Slave Lake in Canada The color code on the map corresponds to the number of times the SAR imagery indicated a place was flooded (inundated). Such information is helpful for predicting within-season changes in wetland extent. Figure credit: Nancy French Figure 4. Advances have been made in mapping aboveground biomass density (AGBD). Shown here as an example is an AGBD map created using stata from the ICESat-2 pan-Boreal 30-m (98-ft) tree height and biomass data product [left] and the ensemble mean of the standard deviation of AGBD, aggregated to modelling tiles [right]. Current research aims to expand these maps and understand regional vegetation changes. Figure credit. Laura Duncanson/data from ORNL DAACASTM11 Poster Sessions
ASTM11 featured 41 research posters across three sessions, organized by thematic area – see Table 3 and Photo 3. The Poster Session agenda details the range of topics that spanned airborne synthetic aperture radar (SAR) and satellite imagery to northern ecosystem fieldwork. Key research topics that emerged included CO2 and CH4 emissions from terrestrial and aquatic systems, ongoing permafrost thaw, fire impacts on carbon cycling, vegetation mapping and biomass estimation, and the impacts of wildlife on the landscape.
Table 2. A breakdown of ASTM11 poster presentations by science theme.
Poster Theme Poster Count Carbon Dynamics 5 Crosscutting, Modeling, or Other 6 Fire Disturbance 5 Permafrost, Hydrology, and Wetlands 13 Vegetation Dynamics and Distribution 7 Vegetation Structure and Function 4 Wildlife and Ecosystem Services 1 Photo 3. Poster presentations and sessions during ASTM11 offered opportunities for presenters to share their latest research findings with meeting participants. Photo credit: Elizabeth HoyABoVE Field Trips
ASTM11 offered multiple field trip options across the Fairbanks region of Alaska. The fieldtrips provided ST members an opportunity to interact with the research community – see Photo 4.
Trip to Alaska Satellite Facility (ASF) and Geophysical Institute
ASF is a data archive for many SAR datasets from a variety of sensors and has multiple ground station facilities. During the tour, participants visited the ASF operations room and ASF rooftop antenna. The Geophysical Institute tour also featured the Alaska Earthquake Center, Wilson Alaska Technical Center, and Alaska Center for Unmanned Aircraft Systems Integration.
Trip to Cold Regions Research and Engineering Laboratory (CRREL) Permafrost Tunnel
The U.S. Army Core of Engineers CRREL Permafrost Tunnel is located in Fox, AK – about 15 km (9 mi) north of Fairbanks. Over 300 m (984 ft) of tunnel have been excavated, exposing Pleistocene ice and carbon-rich yedoma permafrost that ranges in age from 18,000 to 43,000 years old. The tunnel exposes mammoth and bison bones and a variety of permafrost soils. Ongoing projects in the tunnel cover a range of topics, including engineering and geophysical work, Mars analog studies, and biogeochemistry and microbiology of permafrost soils.
Wildfire Walk: Yankovich Road Fire Interpretive Trail
On July 11, 2021, a wildfire burned 3.5 acres (14,164 m2) of UAF land. In 2024, the UAF Alaska Fire Science Consortium, Bureau of Land Management Alaska Fire Service, and local artist Klara Maisch collaborated with others to develop the Wildfire Walk at the site. The interpretive trail is an outdoor learning experience with interpretive wayside markers that describe the fire incident, the relationship between wildfire and the boreal forest, fire science and environmental change, and wildfire prevention – see Figure 1.
UAF Arctic Research Open House
The UAF Arctic Research Open House was an opportunity for ST members and the public to explore the wide range of research happening at UAF and meet other scientists. ABoVE hosted an information table at the event.
Research Connections
The success of ABoVE as a large-scale research study over the Arctic and boreal regions within and outside the United States depended on collaboration with multiple organizations. Many of the ABoVE collaborators were able to present at ASTM11.
Andrew Applejohn [Polar Knowledge Canada (POLAR)] provided details about the scope, mandate, and facilities available through POLAR, a Canadian government agency that has partnered with the ABoVE ST for the duration of the campaign.
Ryan Connon [Government of the Northwest Territories (GNWT)] discussed the decade-long collaboration between ABoVE and the GNWT, including knowledge sharing of wildlife collar data, field-data ground measurements, and remote sensing analyses.
Gabrielle Gascon [Canadian Forest Service (CFS), Natural Resources Canada] explained the scope of Canada’s National Forest Inventory and the current CFS focus on wildfire and the CFS’s other areas of research related to the northern regions. Another presentation featured information about various vegetation mapping initiatives where Matthew Macander discussed an Alaska-based effort called AKVEG Map, a vegetation plot database, and Logan Berner [NAU] detailed a pan-Arctic plant aboveground biomass synthesis dataset.
Brendan Rogers [WCRC] showcased research from Permafrost Pathways, designed to bring together permafrost-related science experts with local communities to inform Arctic policy and develop adaptation and mitigation strategies to address permafrost thaw. NGEE-Arctic is another U.S. government effort that partnered specifically with ABoVE for the duration of the two efforts, and Bob Bolton [Oak Ridge National Laboratory (ORNL)] provided updates on the project.
Tomoko Tanabe [Japan’s National Institute of Polar Research (JNIPR)] gave a presentation about NIPR to better inform ABoVE scientists about other international Arctic efforts, including a new Japanese Arctic research initiative called the Arctic Challenge for Sustainability III (ArCS III), designed to address social issues related to environmental and social changes in the Arctic.
Additional Presentations
An additional presentation aimed to keep the ABoVE ST informed of future NASA Arctic research efforts. Kelsey Bisson [NASA HQ—Program Scientist for the Ocean Biology and Biogeochemistry Program] discussed NASA Arctic-COLORS and Maria Tzortziou [City University of New York/Columbia University, LDEO] discussed the FORTE EVS campaign. The proposed Arctic-COLORS field campaign would quantify the biogeochemical and ecological response of Arctic nearshore systems to rapid changes in terrestrial fluxes and ice conditions. The NASA FORTE EVS campaign will fill a critical gap in understanding Alaska’s northernmost ecosystems by investigating eroding coastlines, rivers, deltas, and estuaries that connect land and sea systems, using airborne platforms.
Scott Goetz continued with a presentation on U.S. efforts to plan the International Polar Year, scheduled for 2032–2033. Ryan Pavlick provided details on the NISAR mission, which launched after the meeting on July 30, 2025, and discussed other possible future NASA missions.
A Career Trajectory panel featured Jennifer Watts, Jonathan Wang, Brendan Rogers, and Xiaoran “Seamore” Zhu [Boston University]. The panelists discussed opportunities for researchers from different academic backgrounds and at different career stages, and they provided details about how ABoVE has impacted their careers. They also discussed how NASA campaigns offer opportunities for early career scientists to join a team of peers to grow their abilities throughout the duration of the decade-long research.
Klara Maisch, a local artist, discussed her work creating science-informed artwork through interdisciplinary collaborations with scientists and other creators – see Figure 5. Maisch described the benefits of partnering with artists to share science with a broad audience and showcased artwork she has created.
Figure 5. Lower Tanana Homelands – 2022 Yankovich Fire – Plot Painting [left], with original plot reference photograph [right]. Image Credit: Klara MaischOverarching Presentations
A series of presentations on the overall structure and outcomes of ABoVE were held during ASTM11. Charles “Chip” Miller [NASA/JPL—Deputy ABoVE ST Lead, ABoVE Airborne Lead] provided details about SAR, hyperspectral, and lidar airborne measurements collected between 2017 and 2024 for the ABoVE Airborne Campaign.
ABoVE Logistics Office members Daniel Hodkinson [GSFC/SSAI], Sarah Dutton [GSFC/SSAI], and Leanne Kendig [GSFC/Global Science & Technology, Inc. (GST, Inc.)] discussed the many field teams and activities supported during ABoVE. Overall, more than 50 teams were trained in field safety topics, with more than 1,200 training certificates awarded. Elizabeth Hoy [NASA GSFC/GST, Inc.] and Debjani Singh [ORNL] discussed the more than 250 data products developed during the ABoVE program and how to access them through NASA Earthdata. Example visualizations of ABoVE data products can be found in Figure 6.
Figure 6. ABoVE logo created with different data products from the campaign used to compose each letter.A: Active Layer Thickness from Remote Sensing Permafrost Model, Alaska, 2001-2015;. Tree (inside A): Normalized Difference Vegetation Index (NDVI) Trends across Alaska and Canada from Landsat, 1984-2012;. B: Landsat-derived Annual Dominant Land Cover Across ABoVE Core Domain, 1984-2014;; O: Wildfire Carbon Emissions and Burned Plot Characteristics, NWT, CA, 2014-2016;; V: AVHRR-Derived Forest Fire Burned Area-Hot Spots, Alaska and Canada, 1989-2000;; E: Lake Bathymetry Maps derived from Landsat and Random Forest Modeling, North Slope, AK; and Underline (under O): Plot lines from the ABoVE Planning Tool visualizer. Figure credit: Caitlin LaNeveThe Collaborations and Engagement WG held a plenary discussion to highlight the many activities that ABoVE researchers have been involved in over the past decade. The discussion highlighted the need for individual projects and campaign leadership to work together to ensure participation and understanding of planned research at local and regional levels.
A highlight of the meeting was the “Legacy of ABoVE” panel discussion moderated by Nancy French [MTU]. Panelists included Eric Kasischke [MTU], Scott Goetz, Chip Miller, Peter Griffith, Libby Larson [NASA GSFC/SSAI], and Elizabeth Hoy. Each panelist reflected on their journey to develop ABoVE, which included an initial scoping study developed more than 15 years ago. Members of the panel – all a part of the ABoVE leadership team – joined the campaign at different stages of their career. Each panelist arrived with different backgrounds, bringing their unique perspective to the group that helped to frame the overall campaign development. Following the panel, all ST members who have been a part of ABoVE since its start over a decade ago came to the front for a group photo – see Photo 5.
Following the panel, the ABoVE ST leads presented their overall thoughts on the meeting and facilitated a discussion with all participants at the meeting. Participants noted the important scientific discoveries made during ABoVE and enjoyed the collegial atmosphere during ASTM11.
Photo 5. A group photo of participants who have been with ABoVE since its inception: [left to right] Ryan Pavlick, Chip Miller, Elizabeth Hoy, Libby Larson, Peter Griffith, Fred Huemmrich, Nancy French, Scott Goetz, Laura Bourgeau-Chavez, Eric Kasischke, and Larry Hinzman. Photo credit: Peter GriffithConclusion
Overall, ASTM11 brought together an interdisciplinary team for a final team meeting that showcased the many accomplishments made over the past decade. The group outlined current gaps and needs in Arctic and boreal research and discussed possibilities for future NASA terrestrial ecology campaigns. The synthesis science presentations at ASTM11 highlighted the advances ABoVE has made in understanding carbon and ecosystem dynamics in Arctic and boreal regions. It also highlighted the need for further study of cold season and subsurface processes. While this was the last meeting of this ST, research for some projects will continue into 2026, and more publications and data products are expected from ST members in the near term.
Elizabeth Hoy
NASA’s Goddard Space Flight Center/Global Science & Technology Inc. (GSFC/GST,Inc.)
elizabeth.hoy@nasa.gov
Libby Larson
NASA’s Goddard Space Flight Center/Science System and Applications, Inc. (GSFC/SSAI)
libby.larson@nasa.gov
Annabelle Sokolowski
NASA GSFC Office of STEM Engagement (OSTEM) Intern
Caitlin LaNeve
NASA GSFC Office of STEM Engagement (OSTEM) Intern
NASA Invites Media to View Artemis Moon Rocket, Spacecraft at Kennedy
Media are invited to see NASA’s fully assembled Artemis II SLS (Space Launch System) rocket and Orion spacecraft in mid-October before its crewed test flight around the Moon next year.
The event at NASA’s Kennedy Space Center in Florida will showcase hardware for the Artemis II lunar mission, which will test capabilities needed for deep space exploration. NASA and industry subject matter experts will be available for interviews.
Attendance is open to U.S. citizens and international media. Media accreditation deadlines are as follows:
- International media without U.S. citizenship must apply by 11:59 p.m. EDT on Monday, Sept. 22.
- U.S. media and U.S. citizens representing international media organizations must apply by 11:59 p.m. EDT on Monday, Sept. 29.
Media wishing to take part in person must apply for credentials at:
Credentialed media will receive a confirmation email upon approval, along with additional information about the specific date for the mid-October activities when they are determined. NASA’s media accreditation policy is available online. For questions about accreditation, please email: ksc-media-accreditat@mail.nasa.gov. For other questions, please contact the NASA Kennedy newsroom at: 321-867-2468.
Prior to the media event, the Orion spacecraft will transition from the Launch Abort System Facility to the Vehicle Assembly Building at NASA Kennedy, where it will be placed on top of the SLS rocket. The fully stacked rocket will then undergo complete integrated testing and final hardware closeouts ahead of rolling the rocket to Launch Pad 39B for launch. During this effort, technicians will conduct end-to-end communications checkouts, and the crew will practice day of launch procedures during their countdown demonstration test.
Artemis II will send NASA astronauts Reid Wiseman, Victor Glover, Christina Koch, and CSA (Canadian Space Agency) astronaut Jeremy Hansen on an approximately 10-day journey around the Moon and back. As part of a Golden Age of innovation and exploration, Artemis will pave the way for new U.S.-crewed missions on the lunar surface ahead in preparation toward the first crewed mission to Mars.
To learn more about the Artemis II mission, visit:
https://www.nasa.gov/mission/artemis-ii
-end-
Rachel Kraft / Lauren Low
Headquarters, Washington
202-358-1100
rachel.h.kraft@nasa.gov / lauren.e.low@nasa.gov
Tiffany Fairley
Kennedy Space Center, Fla.
321-867-2468
tiffany.l.fairley@nasa.gov
Even in our digital world, materials still matter
NASA Data, Trainings Help Uruguay Navigate Drought
- Earth
- Explore
- Science at Work
- Multimedia
- Data
- For Researchers
- About Us
Lee esta historia en español aquí.
NASA satellite data and trainings helped Uruguay create a drought-response tool that its National Water Authority now uses to monitor reservoirs and guide emergency decisions. A similar approach could be applied in the United States and other countries around the world.
From 2018 to 2023, Uruguay experienced its worst drought in nearly a century. The capital city of Montevideo, home to nearly 2 million people, was especially hard hit. By mid-2023, Paso Severino, the largest reservoir and primary water source for Montevideo, had dropped to just 1.7% of its capacity. As water levels declined, government leaders declared an emergency. They began identifying backup supplies and asked: Was there water left in other upstream reservoirs — mainly used for livestock and irrigation — that could help?
That’s when environmental engineer Tiago Pohren and his colleagues at the National Water Authority (DINAGUA – Ministry of Environment) turned to NASA data and trainings to build an online tool that could help answer that question and improve monitoring of the nation’s reservoirs.
“Satellite data can inform everything from irrigation scheduling in the Great Plains to water quality management in the Chesapeake Bay,” said Erin Urquhart, manager of the water resources program at NASA Headquarters in Washington. “NASA provides the reliable data needed to respond to water crises anywhere in the world.”
Learning to Detect Water from SpaceThe DINAGUA team learned about NASA resources during a 2022 workshop in Buenos Aires, organized by the Interagency Science and Applications Team (ISAT). Led by NASA, the U.S. Army Corps of Engineers, and the U.S. Department of State, the workshop focused on developing tools to help manage water in the La Plata River Basin, which spans multiple South American countries including Uruguay.
At the workshop, researchers from NASA introduced participants to methods for measuring water resources from space. NASA’s Applied Remote Sensing (ARSET) program also provided a primer on remote sensing principles.
DINAGUA team supervisor Jose Rodolfo Valles León asks a question during a 2022 workshop in Buenos Aires. Other members of the Uruguay delegation — Florencia Hastings, Vanessa Erasun Rodríguez de Líma, Vanessa Ferreira, and Teresa Sastre (current Director of DINAGUA) — sit in the row behind.Organization of American States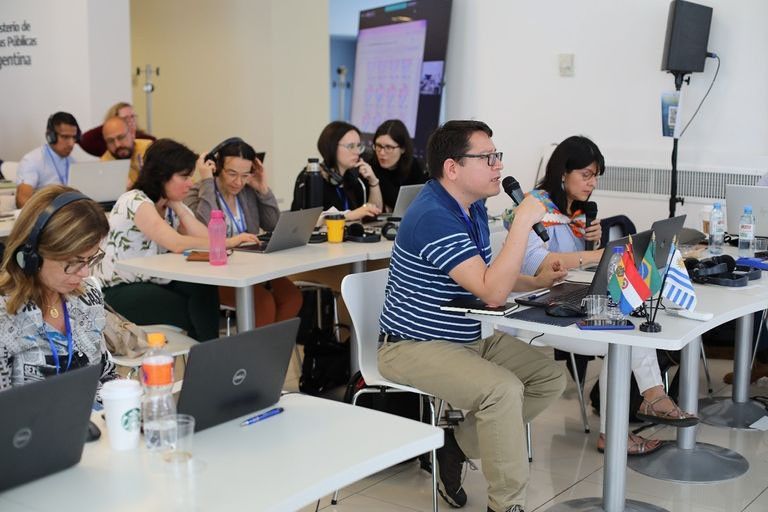
“NASA doesn’t just deliver data,” said John Bolten, NASA’s lead scientist for ISAT and chief of the Hydrological Sciences Laboratory at NASA’s Goddard Space Flight Center in Greenbelt, Maryland. “We collaborate with our partners and local experts to translate the data into information that is useful, usable, and relevant. That kind of coordination is what makes NASA’s water programs so effective on the ground, at home and around the world.”
The DINAGUA team brought ideas and provided guidelines to Pohren for a tool that applies Landsat and Sentinel satellite imagery to detect changes in Uruguay’s reservoirs. Landsat, a joint NASA-U.S. Geological Survey mission, provides decades of satellite imagery to track changes in land and water. The Sentinel missions, a part of the European Commission managed Copernicus Earth Observation program and operated by ESA (the European Space Agency), provide complementary visible, infrared, and microwave imagery for surface water assessments.
From a young age, Pohren was familiar with water-related challenges, as floods repeatedly inundated his relatives’ homes in his hometown of Montenegro, Brazil. It was extra motivation for him as he scoured ARSET tutorials and taught himself to write computer code. The result was a monitoring tool capable of estimating the surface area of Uruguay’s reservoirs over time.
A screenshot of the reservoir monitoring tool shows the Paso Severino’s surface water coverage alongside time-series data tracking its variations.Tiago Pohren
The tool draws on several techniques to differentiate the surface water extent of reservoirs. These techniques include three optical indicators derived from the Landsat 8 and Sentinel-2 satellites:
- Normalized Difference Water Index, which highlights water by comparing how much green and near-infrared light is reflected. Water absorbs infrared light, so it stands out clearly from land.
- Modified Normalized Difference Water Index, which swaps near-infrared with shortwave infrared to improve the contrast and reduce errors when differentiating between water and built-up or vegetated areas.
- Automated Water Extraction Index, which combines four types of reflected light — green, near-infrared, and two shortwave infrared bands — to help separate water from shadows and other dark features.
In 2023, the DINAGUA team used Pohren’s tool to examine reservoirs located upstream from Montevideo’s drinking water intake. But the data told a tough story.
“There was water available in other reservoirs, but it was a very small amount compared to the water demand of the Montevideo metropolitan region,” Pohren said. Simulations showed that even if all of the water were released, most of it would not reach the water intake for Montevideo or the Paso Severino reservoir.
Despite this news, the analysis prevented actions that might have wasted important resources for maintaining productive activities in the upper basin, Pohren said. Then, in August 2023, rain began to refill Uruguay’s reservoirs, allowing the country to declare an end to the water crisis.
From right to left: Tiago Pohren, Vanessa Erasun, and Florencia Hastings at the second ISAT workshop in March 2024.Organization of American States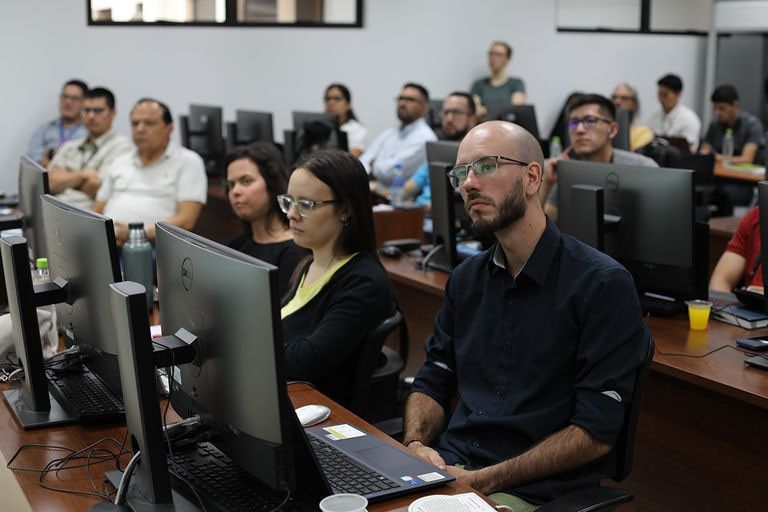
Though the immediate water crisis has passed, the tool Pohren created will be useful in the future in Uruguay and around the world. During an ISAT workshop in 2024, he shared his tool with international water resources managers with the hope it could aid their own drought response efforts. And DINAGUA officials still use it to identify and monitor dams, irrigation reservoirs, and other water bodies in Uruguay.
Pohren continues to use NASA training and data to advance reservoir management. He’s currently exploring an ARSET training on how the Surface Water and Ocean Topography (SWOT) mission will further improve the system by allowing DINAGUA to directly measure the height of water in reservoirs. He is also following NASA’s new joint mission with ISRO (the Indian Space Research Organization) called NISAR, which launched on July 30. The NISAR satellite will provide radar data that detects changes in water extent, regardless of cloud cover or time of day. “If a drought happens again,” Pohren said, “with the tools that we have now, we will be much more prepared to understand what the conditions of the basin are and then make predictions.”
Environmental engineer Tiago Pohren conducts a field inspection on the Canelón Grande reservoir, the second-largest reservoir serving Montevideo, during the drought.Tiago Pohren
By Melody Pederson, Rachel Jiang
The authors would like to thank Noelia Gonzalez, Perry Oddo, Denise Hill, and Delfina Iervolino for interview support as well as Jerry Weigel for connecting with Tiago about the tool’s development.
Share Details Last Updated Sep 10, 2025 Related Terms Explore More 1 min read NASA’s Black Marble: Stories from the Night SkyStudying the glowing patterns of Earth’s surface helps us understand human activity, respond to disasters,…
Article 1 month ago 4 min read NUBE: New Card Game Helps Learners Identify Cloud Types Through Play Article 1 month ago 6 min read NASA’s TRACERS Studies Explosive Process in Earth’s Magnetic Shield Article 2 months ago Keep Exploring Discover More Topics From NASA EarthYour home. Our Mission. And the one planet that NASA studies more than any other.
Explore Earth Science
Earth Science in ActionNASA’s unique vantage point helps us inform solutions to enhance decision-making, improve livelihoods, and protect our planet.
Earth Multimedia & Galleries
Scientists find evidence of flowing water on Ryugu’s ancient parent asteroid. 'It was a genuine surprise!'
NASA Data, Trainings Help Uruguay Navigate Drought
- Earth
- Explore
- Science at Work
- Multimedia
- Data
- For Researchers
- About Us
NASA Earth Observatory/ Wanmei Liang
Lee esta historia en español aquí.
NASA satellite data and trainings helped Uruguay create a drought-response tool that its National Water Authority now uses to monitor reservoirs and guide emergency decisions. A similar approach could be applied in the United States and other countries around the world.
From 2018 to 2023, Uruguay experienced its worst drought in nearly a century. The capital city of Montevideo, home to nearly 2 million people, was especially hard hit. By mid-2023, Paso Severino, the largest reservoir and primary water source for Montevideo, had dropped to just 1.7% of its capacity. As water levels declined, government leaders declared an emergency. They began identifying backup supplies and asked: Was there water left in other upstream reservoirs — mainly used for livestock and irrigation — that could help?
That’s when environmental engineer Tiago Pohren and his colleagues at the National Water Authority (DINAGUA – Ministry of Environment) turned to NASA data and trainings to build an online tool that could help answer that question and improve monitoring of the nation’s reservoirs.
“Satellite data can inform everything from irrigation scheduling in the Great Plains to water quality management in the Chesapeake Bay,” said Erin Urquhart, manager of the water resources program at NASA Headquarters in Washington. “NASA provides the reliable data needed to respond to water crises anywhere in the world.”
Learning to Detect Water from SpaceThe DINAGUA team learned about NASA resources during a 2022 workshop in Buenos Aires, organized by the Interagency Science and Applications Team (ISAT). Led by NASA, the U.S. Army Corps of Engineers, and the U.S. Department of State, the workshop focused on developing tools to help manage water in the La Plata River Basin, which spans multiple South American countries including Uruguay.
At the workshop, researchers from NASA introduced participants to methods for measuring water resources from space. NASA’s Applied Remote Sensing (ARSET) program also provided a primer on remote sensing principles.
DINAGUA team supervisor Jose Rodolfo Valles León asks a question during a 2022 workshop in Buenos Aires. Other members of the Uruguay delegation — Florencia Hastings, Vanessa Erasun Rodríguez de Líma, Vanessa Ferreira, and Teresa Sastre (current Director of DINAGUA) — sit in the row behind. Organization of American States“NASA doesn’t just deliver data,” said John Bolten, NASA’s lead scientist for ISAT and chief of the Hydrological Sciences Laboratory at NASA’s Goddard Space Flight Center in Greenbelt, Maryland. “We collaborate with our partners and local experts to translate the data into information that is useful, usable, and relevant. That kind of coordination is what makes NASA’s water programs so effective on the ground, at home and around the world.”
The DINAGUA team brought ideas and provided guidelines to Pohren for a tool that applies Landsat and Sentinel satellite imagery to detect changes in Uruguay’s reservoirs. Landsat, a joint NASA-U.S. Geological Survey mission, provides decades of satellite imagery to track changes in land and water. The Sentinel missions, a part of the European Commission managed Copernicus Earth Observation program and operated by ESA (the European Space Agency), provide complementary visible, infrared, and microwave imagery for surface water assessments.
From a young age, Pohren was familiar with water-related challenges, as floods repeatedly inundated his relatives’ homes in his hometown of Montenegro, Brazil. It was extra motivation for him as he scoured ARSET tutorials and taught himself to write computer code. The result was a monitoring tool capable of estimating the surface area of Uruguay’s reservoirs over time.
A screenshot of the reservoir monitoring tool shows the Paso Severino’s surface water coverage alongside time-series data tracking its variations. Tiago PohrenThe tool draws on several techniques to differentiate the surface water extent of reservoirs. These techniques include three optical indicators derived from the Landsat 8 and Sentinel-2 satellites:
- Normalized Difference Water Index, which highlights water by comparing how much green and near-infrared light is reflected. Water absorbs infrared light, so it stands out clearly from land.
- Modified Normalized Difference Water Index, which swaps near-infrared with shortwave infrared to improve the contrast and reduce errors when differentiating between water and built-up or vegetated areas.
- Automated Water Extraction Index, which combines four types of reflected light — green, near-infrared, and two shortwave infrared bands — to help separate water from shadows and other dark features.
In 2023, the DINAGUA team used Pohren’s tool to examine reservoirs located upstream from Montevideo’s drinking water intake. But the data told a tough story.
“There was water available in other reservoirs, but it was a very small amount compared to the water demand of the Montevideo metropolitan region,” Pohren said. Simulations showed that even if all of the water were released, most of it would not reach the water intake for Montevideo or the Paso Severino reservoir.
Despite this news, the analysis prevented actions that might have wasted important resources for maintaining productive activities in the upper basin, Pohren said. Then, in August 2023, rain began to refill Uruguay’s reservoirs, allowing the country to declare an end to the water crisis.
From right to left: Tiago Pohren, Vanessa Erasun, and Florencia Hastings at the second ISAT workshop in March 2024. Organization of American StatesThough the immediate water crisis has passed, the tool Pohren created will be useful in the future in Uruguay and around the world. During an ISAT workshop in 2024, he shared his tool with international water resources managers with the hope it could aid their own drought response efforts. And DINAGUA officials still use it to identify and monitor dams, irrigation reservoirs, and other water bodies in Uruguay.
Pohren continues to use NASA training and data to advance reservoir management. He’s currently exploring an ARSET training on how the Surface Water and Ocean Topography (SWOT) mission will further improve the system by allowing DINAGUA to directly measure the height of water in reservoirs. He is also following NASA’s new joint mission with ISRO (the Indian Space Research Organization) called NISAR, which launched on July 30. The NISAR satellite will provide radar data that detects changes in water extent, regardless of cloud cover or time of day. “If a drought happens again,” Pohren said, “with the tools that we have now, we will be much more prepared to understand what the conditions of the basin are and then make predictions.”
Environmental engineer Tiago Pohren conducts a field inspection on the Canelón Grande reservoir, the second-largest reservoir serving Montevideo, during the drought. Tiago PohrenBy Melody Pederson, Rachel Jiang
The authors would like to thank Noelia Gonzalez, Perry Oddo, Denise Hill, and Delfina Iervolino for interview support as well as Jerry Weigel for connecting with Tiago about the tool’s development.
Share Details Last Updated Sep 10, 2025 Related Terms Explore More 1 min read NASA’s Black Marble: Stories from the Night SkyStudying the glowing patterns of Earth’s surface helps us understand human activity, respond to disasters,…
Article
1 month ago 4 min read NUBE: New Card Game Helps Learners Identify Cloud Types Through Play
Article
1 month ago 6 min read NASA’s TRACERS Studies Explosive Process in Earth’s Magnetic Shield
Article
2 months ago Keep Exploring Discover More Topics From NASA Earth
Your home. Our Mission. And the one planet that NASA studies more than any other.
Explore Earth Science
NASA’s unique vantage point helps us inform solutions to enhance decision-making, improve livelihoods, and protect our planet.
Earth Multimedia & Galleries