
Feed aggregator
Space weather could threaten NASA’s Artemis II astronauts during their trip to the moon
A major solar storm during the Artemis II mission could harm astronauts. Here’s how NASA is protecting them
Tales of Two Comets: A1 MAPS and R3 Pan-STARRS Both Make a Showing in April
All eyes are on the inner solar system in April 2026, as two comets reach perihelion. One, Comet R3 Pan-STARRS we’ve known about since last year. Another, sungrazer A1 MAPS was just found as the first comet of 2026 and presents us with a big question: will it survive its blistering perihelion passage on Saturday, April 4th, or simply vaporize like the majority of sungrazers before it?
Watch live: Artemis II launch
The first launch opportunity for Artemis II, the first mission to bring astronauts towards the Moon in over 50 years, is set for 1 April at 18:24 local time (2 April at 00:24 CEST). Tune in from one hour before launch at 22:24 BST / 23:24 CEST on ESA Web TV to watch the launch.
A once-fantastical collider could answer physics’ biggest mysteries
A once-fantastical collider could answer physics’ biggest mysteries
Attacks from our immune system are a cause of long covid
Attacks from our immune system are a cause of long covid
Godspeed, Artemis II!
Godspeed, Artemis II!
NASA astronaut Jessica Meir took this photo of an Artemis program patch floating in the International Space Station’s cupola. She posted it on X on March 30, 2026, with the following caption: “Our work on the @Space_Station has provided the foundation to explore further, preparing us to return humans to the Moon this week. Stay tuned as we enter the @NASAArtemis era! Expedition 74 will certainly be keeping a close watch. Godspeed, Artemis II!”
Image credit: NASA/Jessica Meir
Utah’s Great Salt Lake may be hiding a massive reservoir of fresh water
Fresh-water-saturated sediment or bedrock may extend as deep as three or four kilometers below the Great Salt Lake’s basin, a new study suggests
Landsat Reveals Reservoir Changes and Bathymetry
- Landsat Home
- Missions
- News
- Data
- Benefits
- Outreach
- Multimedia
- About
- Search
Communities worldwide rely on reservoirs for drinking water, hydroelectric power, irrigation, and more. These critical freshwater resources are affected by seasonal and long-term changes; water levels in reservoirs can dip during hot summer months or due to prolonged drought, or can flood after a particularly strong storm. Despite their importance, there are key gaps in our knowledge of reservoir structure and dynamics. Two recent papers use Landsat data to help fill in those gaps.
Researchers from the University of Southampton used Landsat data to identify where water advanced or retreated from 1984 to 2022, creating the first global dataset pinpointing the exact year of permanent surface water changes—such as when a reservoir formed or a stream dried up. The study can track changes in streams as narrow as 30m and lakes as small as 900m2. In a separate study, Texas A&M University researchers used Landsat data to build a global bathymetry dataset called ‘3D-LAKES’ that enables water managers to estimate reservoir storage capacity.
To view this video please enable JavaScript, and consider upgrading to a web browser that
supports HTML5 video
The above animation shows the Amistad Reservoir on the border of Texas and Mexico. It uses a natural-color Landsat image from 1985 overlaid onto a Copernicus Digital Elevation Model (DEM) and bathymetric data from the 3D-LAKES dataset. Vertical relief is exaggerated by a factor of four to emphasize topographic features and landforms. The reservoir is jointly managed by the U.S. and Mexico through the International Boundary and Water Commission (IBWC) for flood control, recreation, and hydroelectric power. Despite its importance to the two countries, the reservoir is slowly shrinking. The surface water transitions dataset shows the water levels retreating in recent decades, with significant recessions between 2012 and 2016. The 3D-LAKES dataset reveals the underwater shape of the reservoir. Together, these datasets complement the in situ water level and conditions data collected throughout the year.
Tracking Surface Water TransitionsHuman communities both shape and are shaped by water. We divert rivers, build reservoirs, and construct artificial islands, while natural forces—storms, meandering rivers, and rising seas—reshape our waterways and coastlines. With satellite data as an important tool to study ecosystem dynamics, researchers have begun to build a more comprehensive global understanding of where water is and how it shifts over time. In their water transitions study, the University of Southampton team focused specifically on permanent changes in lakes, rivers, coastlines, and other water bodies worldwide.
Looking at long-term changes in surface water can help scientists understand drivers of change, said Gustavo Willy Nagel, lead researcher on the paper. Knowing when a lake began receding helps water managers investigate whether drought, irrigation, or other forces caused the decline.
Running from July 31, 1985 to November 10, 2025, this animation shows that the Amistad Reservoir levels fluctuate with the seasons but slowly decline. The time series is composed of images from Landsats 5, 7, 8, and 9. Ross Walter/NASAScientists, policymakers, and water managers can explore the interactive dataset that Nagel and his team created to visualize changes close to home as well as stark global impacts such as the drying of the Aral Sea, the lakes created by melting glaciers in Tibet, and the building of the Palm Islands in Dubai.
Assessing long-term changes in surface water presents a key challenge, as surface water is extremely dynamic. Seasonal fluctuations and climatic forces mean that rivers, lakes, and coastlines are changing all the time. To identify permanent water changes while excluding seasonal fluctuations, the researchers ran two algorithms. The first detected whether the water body was advancing or retreating over the study period using the Modified Normalized Difference Water Index (mNDWI), which uses the shortwave-infrared (SWIR) instead of the near-infrared (NIR) band. The second algorithm used the Green_Red Normalized Difference Water Index (grNDWI)—an index proposed by the research team—to identify the precise year that the water body transitioned. A change was considered “permanent” if it did not revert to its previous condition during the study period of 1984 to 2022.
“The dataset is showing, for every location on the planet, areas where water advanced or retracted and the year of that change,” said Nagel.
This screenshot from the Water Change Time Detection tool on Google Earth Engine shows the Amistad Reservoir receding over time. Red and orange represent areas where water receded, whereas blue represents areas where water advanced. Major recessions occurred between 2012 and 2016. Ross Walter/NASA Visualizing Lakes in 3D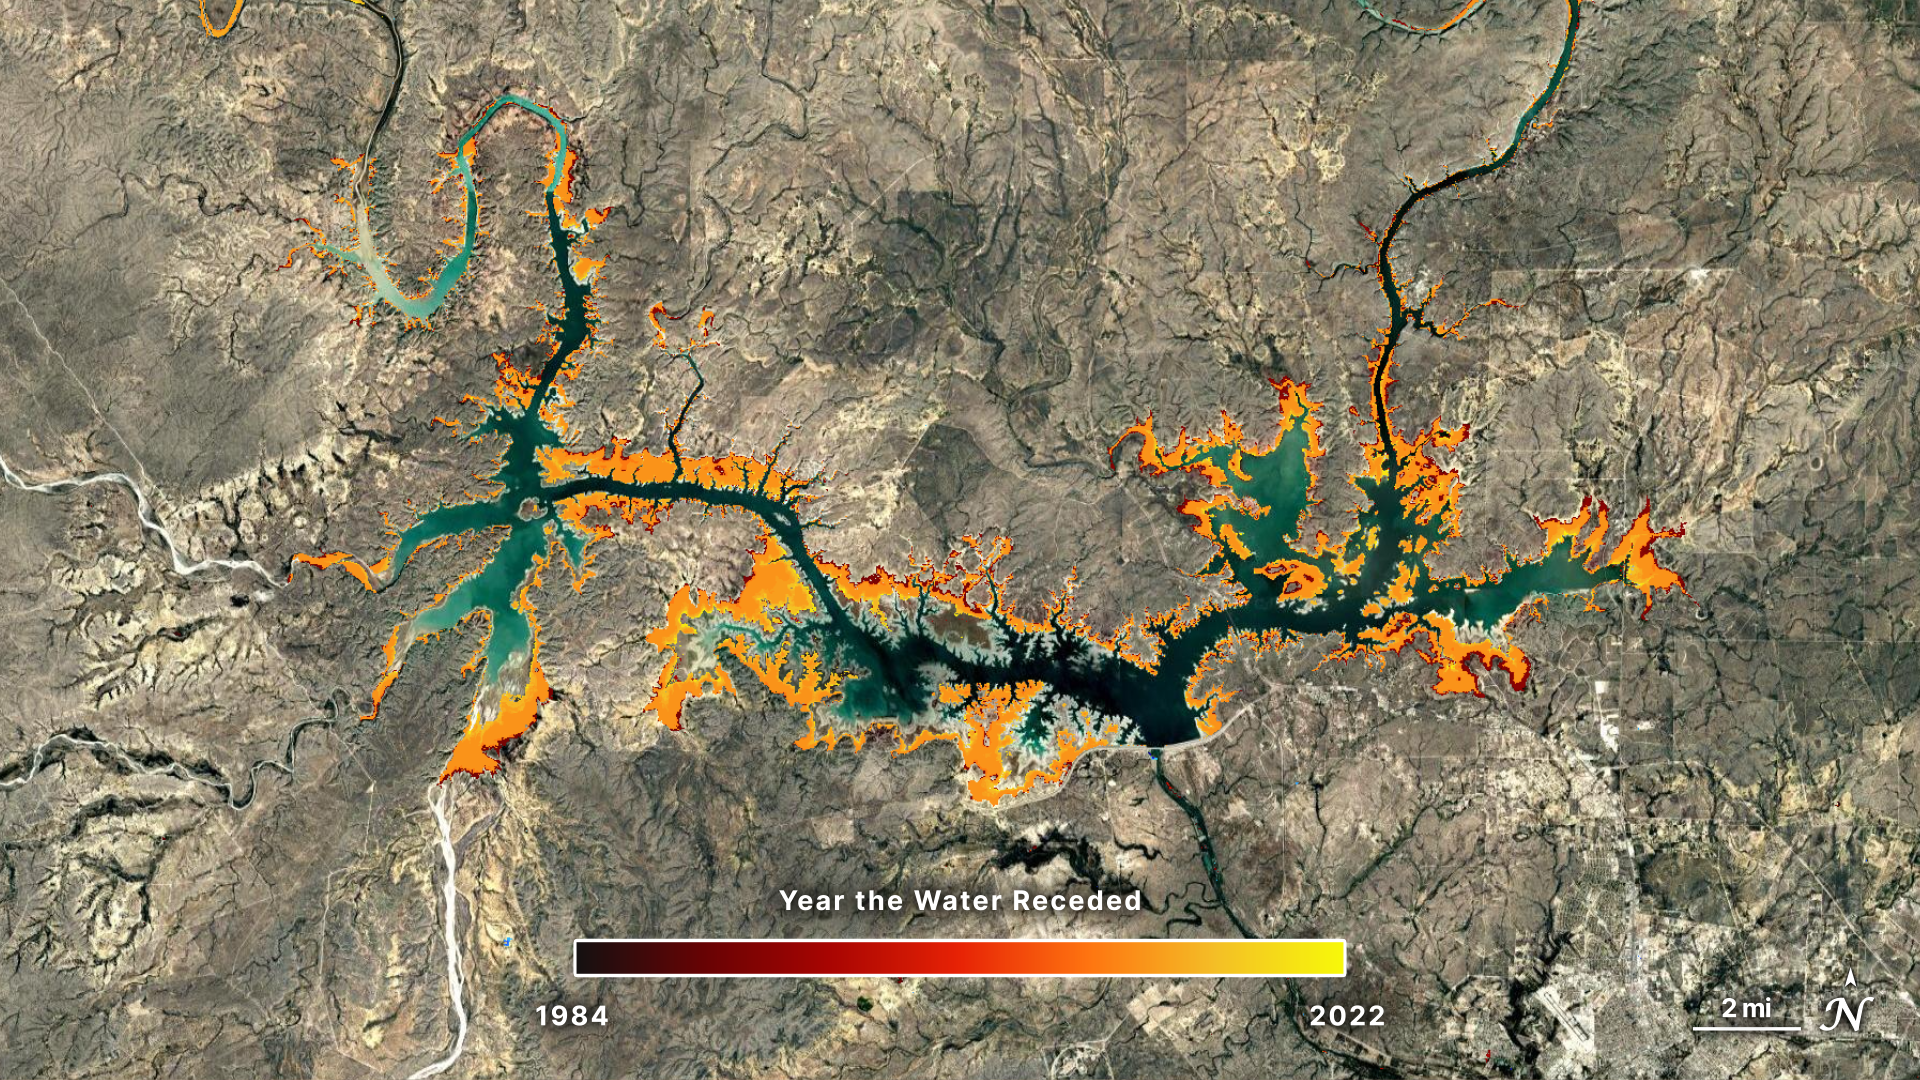
Landsat can help us monitor surface water. But what about what’s under the surface?
In a study published in Scientific Data in October 2025, researchers from Texas A&M University fused Landsat and ICESat-2 data to create bathymetry maps for half a million global lakes and reservoirs. The research team, led by Huilin Gao, used Landsat imagery to calculate the surface area of water bodies, delineate where water meets land, and track how water extent changes over time. Then, they combined laser altimetry from the ICESat-2 satellite to infer the underwater bathymetry of water bodies. With these measurements, the scientists refined area-elevation relationships, a key metric for understanding how water storage changes with water level.
This screenshot from the 3D-LAKES dataset shows bathymetry in the Amistad Reservoir. Green represents shallow waters while purple represents deeper waters. Comparing this screenshot to the results from the water change detection tool, it appears that the areas where water receded align with the shallower portions of the reservoir. Ross Walter/NASA
The resultant dataset, dubbed 3D-LAKES, is static, as bathymetry does not tend to change significantly year to year. “This dataset can support many applications, from monitoring water storage to refining hydrological models,” said Chi-Hsiang Huang, the study’s lead author.
3D-LAKES can be used in combination with Landsat-based maps—like the surface transition research or the popular Global Surface Water dataset—to help water resource managers assess the volume of water held in a reservoir or lake. This allows them to evaluate flood risk, map habitat, or calculate how much water is available during a particularly dry season. Researchers can also track changing water volume over time, helping understand long-term trends in water storage.
Measuring underwater topography has historically been expensive and impractical at global scales. The 3D-LAKES dataset now provides researchers and managers with crucial bathymetric data for lakes and reservoirs worldwide. “With this new dataset, we can achieve a more comprehensive understanding of the impacts of lakes and reservoirs on regional climatology, water security, and ecosystem services,” said Gao. Both studies provide water and land managers with unprecedented tools for resource management and planning—from the Amistad Reservoir to the Australian Outback to the Brazilian Amazon.
Explore More
Landsat Reveals Reservoir Changes and Bathymetry
5 min read
In two recent studies, researchers used Landsat data to fill key gaps in our knowledge of reservoir structure and dynamics.
Mar 31, 2026 ArticleSeeing Blue During Schirmacher’s Summer Melt Season
5 min read
A network of meltwater lakes and drainage channels made an Antarctic ice shelf known for its blue ice areas even…
Mar 30, 2026 ArticleSatellite Spots a Spawn
3 min read
The activity of herring around Vancouver Island in British Columbia brightened coastal waters enough to be detectable from space.
Mar 27, 2026 Article1
2
3
…
301
Next
Landsat Reveals Reservoir Changes and Bathymetry
- Landsat Home
- Missions
- News
- Data
- Benefits
- Outreach
- Multimedia
- About
- Search
Communities worldwide rely on reservoirs for drinking water, hydroelectric power, irrigation, and more. These critical freshwater resources are affected by seasonal and long-term changes; water levels in reservoirs can dip during hot summer months or due to prolonged drought, or can flood after a particularly strong storm. Despite their importance, there are key gaps in our knowledge of reservoir structure and dynamics. Two recent papers use Landsat data to help fill in those gaps.
Researchers from the University of Southampton used Landsat data to identify where water advanced or retreated from 1984 to 2022, creating the first global dataset pinpointing the exact year of permanent surface water changes—such as when a reservoir formed or a stream dried up. The study can track changes in streams as narrow as 30m and lakes as small as 900m2. In a separate study, Texas A&M University researchers used Landsat data to build a global bathymetry dataset called ‘3D-LAKES’ that enables water managers to estimate reservoir storage capacity.
To view this video please enable JavaScript, and consider upgrading to a web browser that
supports HTML5 video
The above animation shows the Amistad Reservoir on the border of Texas and Mexico. It uses a natural-color Landsat image from 1985 overlaid onto a Copernicus Digital Elevation Model (DEM) and bathymetric data from the 3D-LAKES dataset. Vertical relief is exaggerated by a factor of four to emphasize topographic features and landforms. The reservoir is jointly managed by the U.S. and Mexico through the International Boundary and Water Commission (IBWC) for flood control, recreation, and hydroelectric power. Despite its importance to the two countries, the reservoir is slowly shrinking. The surface water transitions dataset shows the water levels retreating in recent decades, with significant recessions between 2012 and 2016. The 3D-LAKES dataset reveals the underwater shape of the reservoir. Together, these datasets complement the in situ water level and conditions data collected throughout the year.
Tracking Surface Water TransitionsHuman communities both shape and are shaped by water. We divert rivers, build reservoirs, and construct artificial islands, while natural forces—storms, meandering rivers, and rising seas—reshape our waterways and coastlines. With satellite data as an important tool to study ecosystem dynamics, researchers have begun to build a more comprehensive global understanding of where water is and how it shifts over time. In their water transitions study, the University of Southampton team focused specifically on permanent changes in lakes, rivers, coastlines, and other water bodies worldwide.
Looking at long-term changes in surface water can help scientists understand drivers of change, said Gustavo Willy Nagel, lead researcher on the paper. Knowing when a lake began receding helps water managers investigate whether drought, irrigation, or other forces caused the decline.
Running from July 31, 1985 to November 10, 2025, this animation shows that the Amistad Reservoir levels fluctuate with the seasons but slowly decline. The time series is composed of images from Landsats 5, 7, 8, and 9. Ross Walter/NASAScientists, policymakers, and water managers can explore the interactive dataset that Nagel and his team created to visualize changes close to home as well as stark global impacts such as the drying of the Aral Sea, the lakes created by melting glaciers in Tibet, and the building of the Palm Islands in Dubai.
Assessing long-term changes in surface water presents a key challenge, as surface water is extremely dynamic. Seasonal fluctuations and climatic forces mean that rivers, lakes, and coastlines are changing all the time. To identify permanent water changes while excluding seasonal fluctuations, the researchers ran two algorithms. The first detected whether the water body was advancing or retreating over the study period using the Modified Normalized Difference Water Index (mNDWI), which uses the shortwave-infrared (SWIR) instead of the near-infrared (NIR) band. The second algorithm used the Green_Red Normalized Difference Water Index (grNDWI)—an index proposed by the research team—to identify the precise year that the water body transitioned. A change was considered “permanent” if it did not revert to its previous condition during the study period of 1984 to 2022.
“The dataset is showing, for every location on the planet, areas where water advanced or retracted and the year of that change,” said Nagel.
This screenshot from the Water Change Time Detection tool on Google Earth Engine shows the Amistad Reservoir receding over time. Red and orange represent areas where water receded, whereas blue represents areas where water advanced. Major recessions occurred between 2012 and 2016. Ross Walter/NASA Visualizing Lakes in 3DLandsat can help us monitor surface water. But what about what’s under the surface?
In a study published in Scientific Data in October 2025, researchers from Texas A&M University fused Landsat and ICESat-2 data to create bathymetry maps for half a million global lakes and reservoirs. The research team, led by Huilin Gao, used Landsat imagery to calculate the surface area of water bodies, delineate where water meets land, and track how water extent changes over time. Then, they combined laser altimetry from the ICESat-2 satellite to infer the underwater bathymetry of water bodies. With these measurements, the scientists refined area-elevation relationships, a key metric for understanding how water storage changes with water level.
This screenshot from the 3D-LAKES dataset shows bathymetry in the Amistad Reservoir. Green represents shallow waters while purple represents deeper waters. Comparing this screenshot to the results from the water change detection tool, it appears that the areas where water receded align with the shallower portions of the reservoir. Ross Walter/NASAThe resultant dataset, dubbed 3D-LAKES, is static, as bathymetry does not tend to change significantly year to year. “This dataset can support many applications, from monitoring water storage to refining hydrological models,” said Chi-Hsiang Huang, the study’s lead author.
3D-LAKES can be used in combination with Landsat-based maps—like the surface transition research or the popular Global Surface Water dataset—to help water resource managers assess the volume of water held in a reservoir or lake. This allows them to evaluate flood risk, map habitat, or calculate how much water is available during a particularly dry season. Researchers can also track changing water volume over time, helping understand long-term trends in water storage.
Measuring underwater topography has historically been expensive and impractical at global scales. The 3D-LAKES dataset now provides researchers and managers with crucial bathymetric data for lakes and reservoirs worldwide. “With this new dataset, we can achieve a more comprehensive understanding of the impacts of lakes and reservoirs on regional climatology, water security, and ecosystem services,” said Gao. Both studies provide water and land managers with unprecedented tools for resource management and planning—from the Amistad Reservoir to the Australian Outback to the Brazilian Amazon.
Explore More
Landsat Reveals Reservoir Changes and Bathymetry
5 min read
In two recent studies, researchers used Landsat data to fill key gaps in our knowledge of reservoir structure and dynamics.
Mar 31, 2026 ArticleSeeing Blue During Schirmacher’s Summer Melt Season
5 min read
A network of meltwater lakes and drainage channels made an Antarctic ice shelf known for its blue ice areas even…
Mar 30, 2026 ArticleSatellite Spots a Spawn
3 min read
The activity of herring around Vancouver Island in British Columbia brightened coastal waters enough to be detectable from space.
Mar 27, 2026 Article1
2
3
…
301
Next
New fibre-optic record allows 50,000,000 movies to be streamed at once
New fibre-optic record allows 50,000,000 movies to be streamed at once
SpaceX Starlink satellite suffers mysterious ‘anomaly’ in orbit
Elon Musk’s space Internet company said this satellite, which appears to have blown to pieces, did not appear to pose a risk to the ISS or the upcoming NASA moon mission
New Astro Images: Saturn, the Crab Nebula, and a Newborn Planet
Striking images from Hubble, Webb, and the Very Large Telescope dive into Saturn's atmosphere, capture the Crab Nebula's expansion, and reveal a newborn planet.
The post New Astro Images: Saturn, the Crab Nebula, and a Newborn Planet appeared first on Sky & Telescope.
April Podcast: Spotlight on Gemini
This month’s episode showcases the stars and planets visible on April evenings. We’ll explore full-Moon quirks; spot Venus and Jupiter after sunset; learn about Gemini, the celestial twins; and hunt for meteors toward month’s end. So grab your curiosity, and come along on this month’s Sky Tour.
The post April Podcast: Spotlight on Gemini appeared first on Sky & Telescope.
NASA’s nuclear mission to Mars isn’t as crazy as it sounds
The U.S. space agency’s Skyfall project calls for sending robotic helicopters to Mars on a nuclear-powered spacecraft before the end of Donald Trump’s presidency
Are We About to Permanently Scar the Night Sky With One Million AI Satellite and 50,000 Space Mirrors?
If you thought the current crop of satellite megaconstellations was bad, you’re going to be horribly disappointed by new proposals from both SpaceX and a company called Reflect Orbital. Their combined plans would fundamentally alter the night sky as we know it, and the global astronomical community is sounding the alarm - most notably letters from the Royal Astronomical Society (RAS), the European Southern Observatory (ESO), and the International Astronomical Union (IAU) strongly opposing the plan, which currently sits with America’s Federal Communications Commission (FCC) for approval.