
Feed aggregator
Could James and the Giant Peach inspire the future of food?
Could James and the Giant Peach inspire the future of food?
NIH Agrees to Evaluate Stalled Scientific Grants
Health officials have agreed to assess pending medical research grants after a Trump administration antidiversity purge put them on ice
Microbiology
2 min read
Preparations for Next Moonwalk Simulations Underway (and Underwater) Microbiology Laboratory at JSC NASA. Microorganisms and Spaceflight
Spaceflight poses a risk of adverse health effects due to the interactions between microorganisms, their hosts, and their environment. The JSC Microbiology team addresses the benefits and risks related to microorganisms, including infectious disease, allergens, environmental and food contamination, and the impacts of changes in environmental and human microbial ecology aboard spacecraft. The team includes certified medical technologists, environmental microbiologists, mycologists, and biosafety professionals.
The JSC Microbiology laboratory is a critical component of the Human Health and Performance Directorate and is responsible for addressing crew health and environmental issues related to microbial infection, allergens, and contamination. This responsibility is achieved by operational monitoring and investigative research using classical microbiological, advanced molecular, and immunohistochemical techniques. This research has resulted in a significant number of presentations and peer-reviewed publications contributing to the field of Microbiology with articles in journals such as Infection and Immunity, Journal of Infectious Disease and Applied and Environmental Microbiology, Nature Reviews Microbiology, and Proceedings of the National Academies of Science.
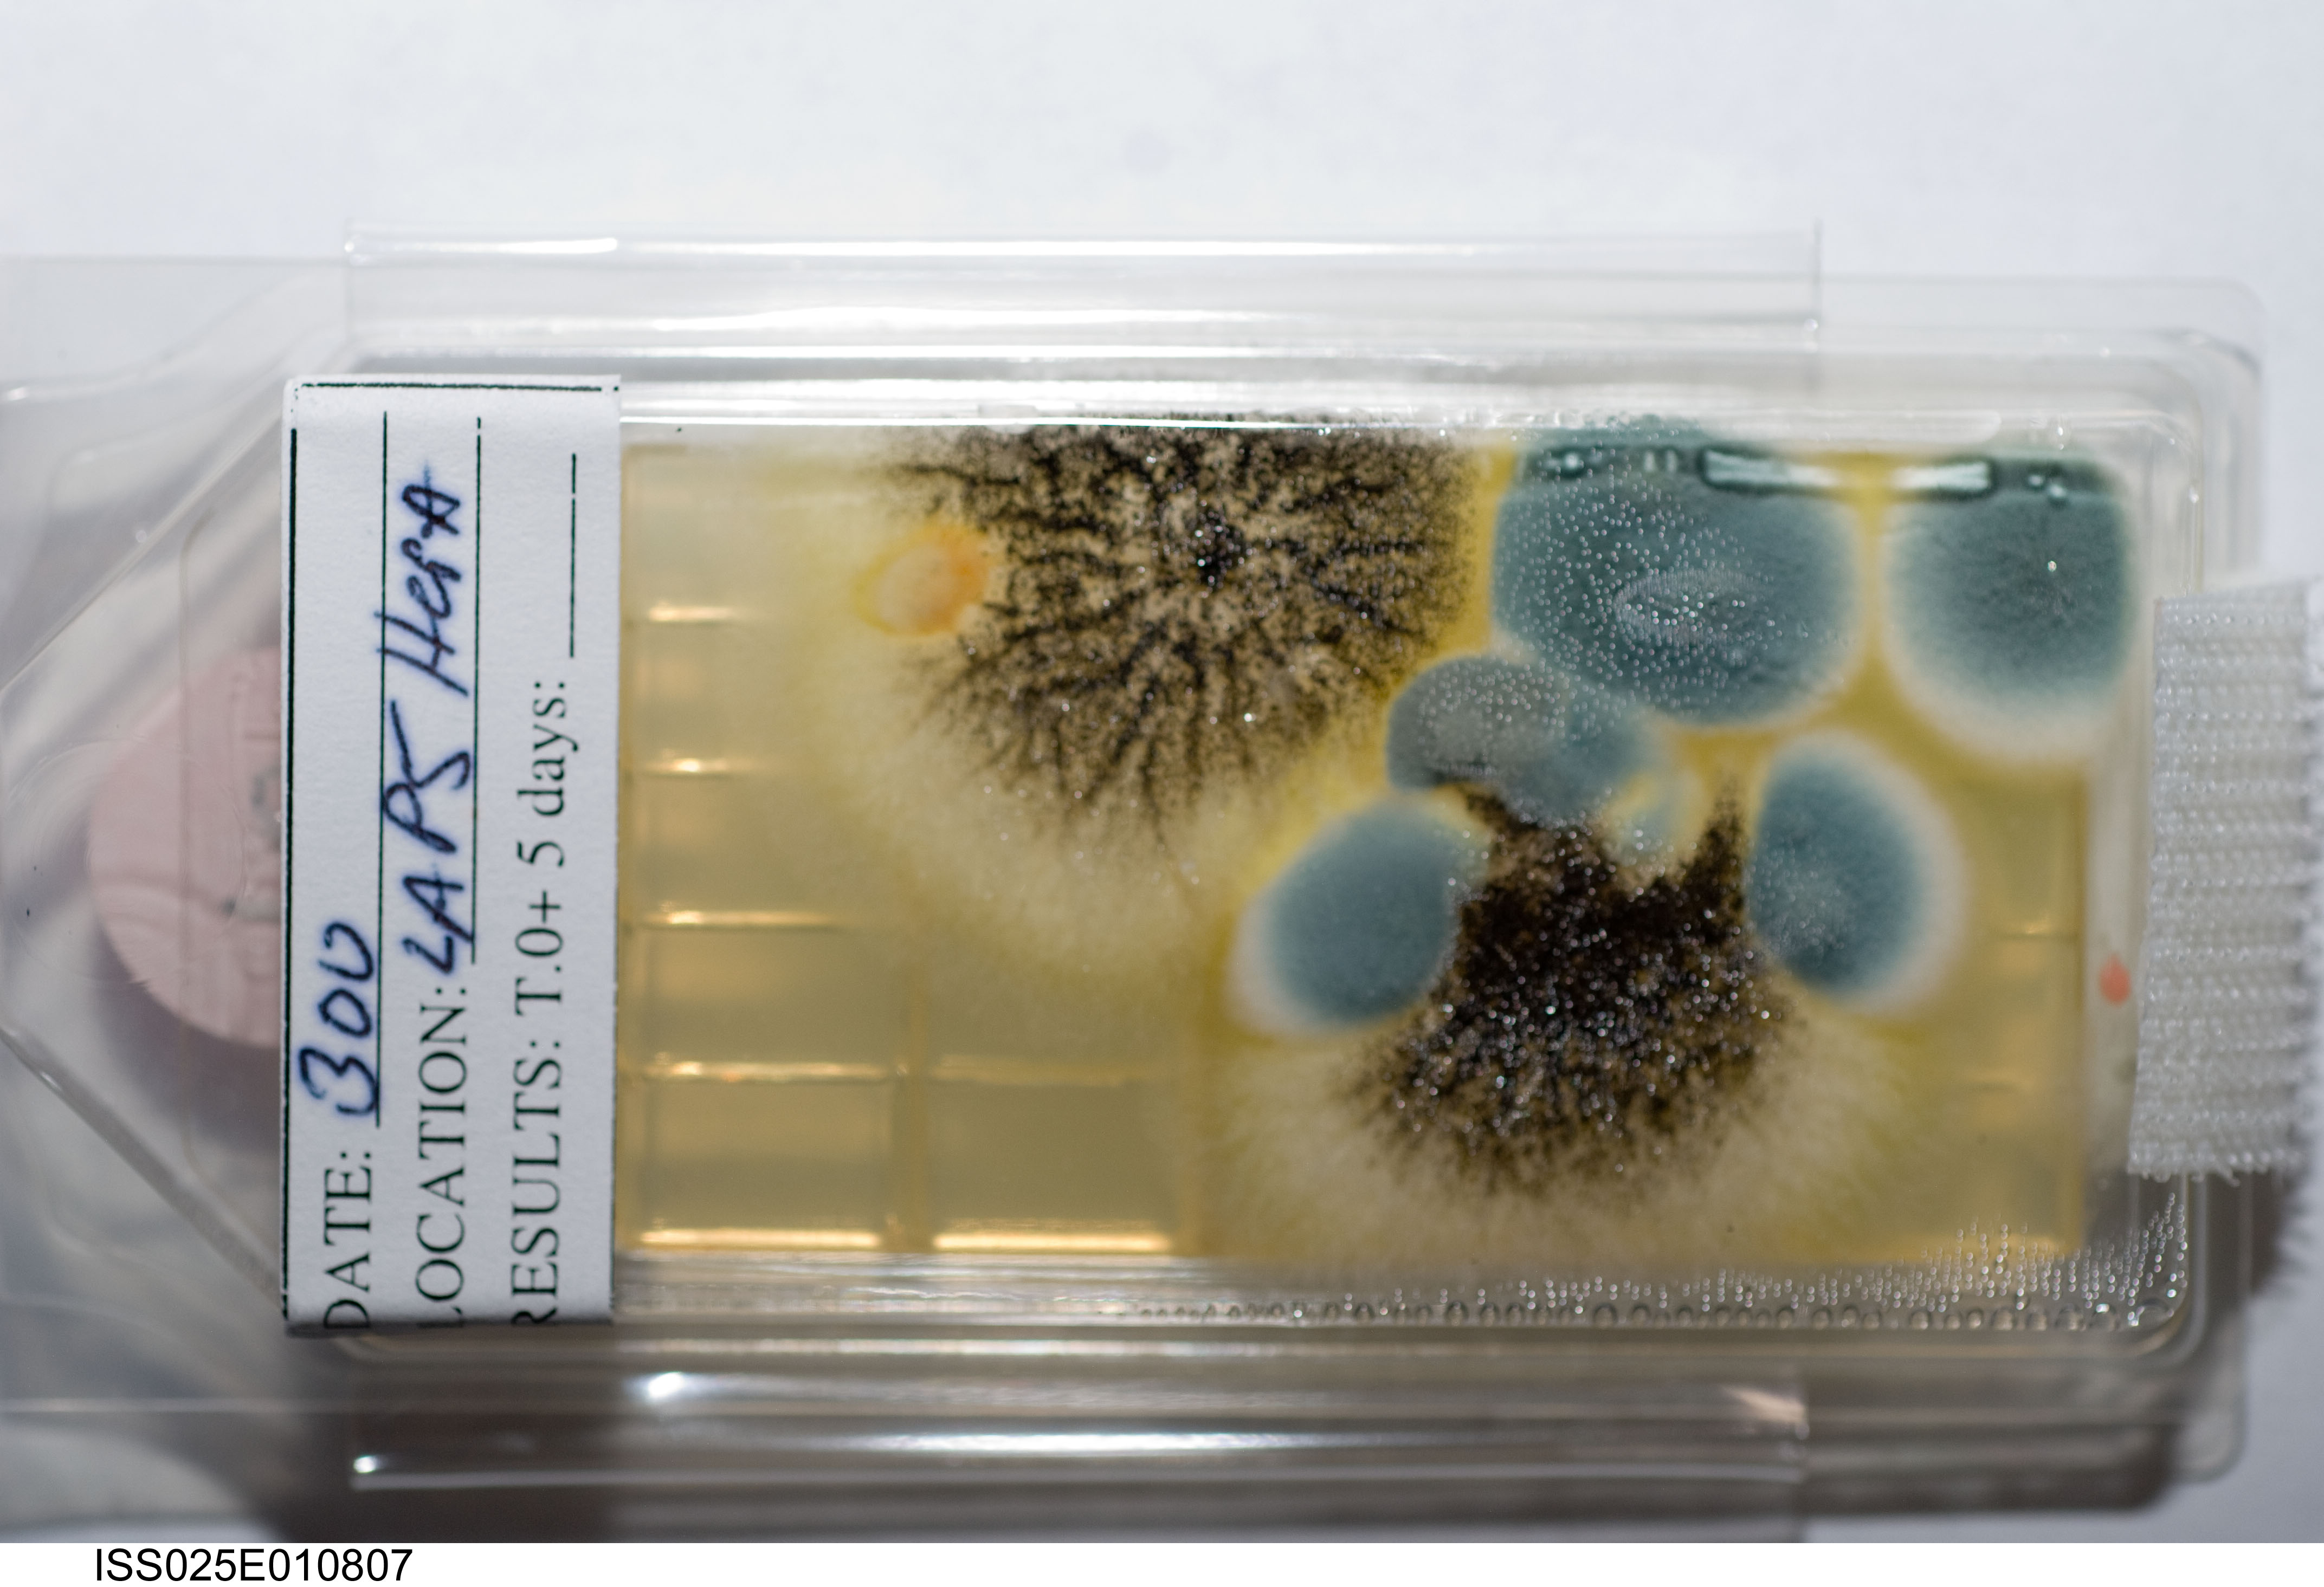
Fun Fact: Microorganisms display unexpected responses when grown in the spaceflight environment compared to otherwise identically grown microbes on Earth.NASA
Christian Castro is streaking bacteria to be characterized using a variety of culture media. Photo Date: May 29, 2018. Location: Building 21 – Microbiology Lab. NASA Keeping Crew-members Safe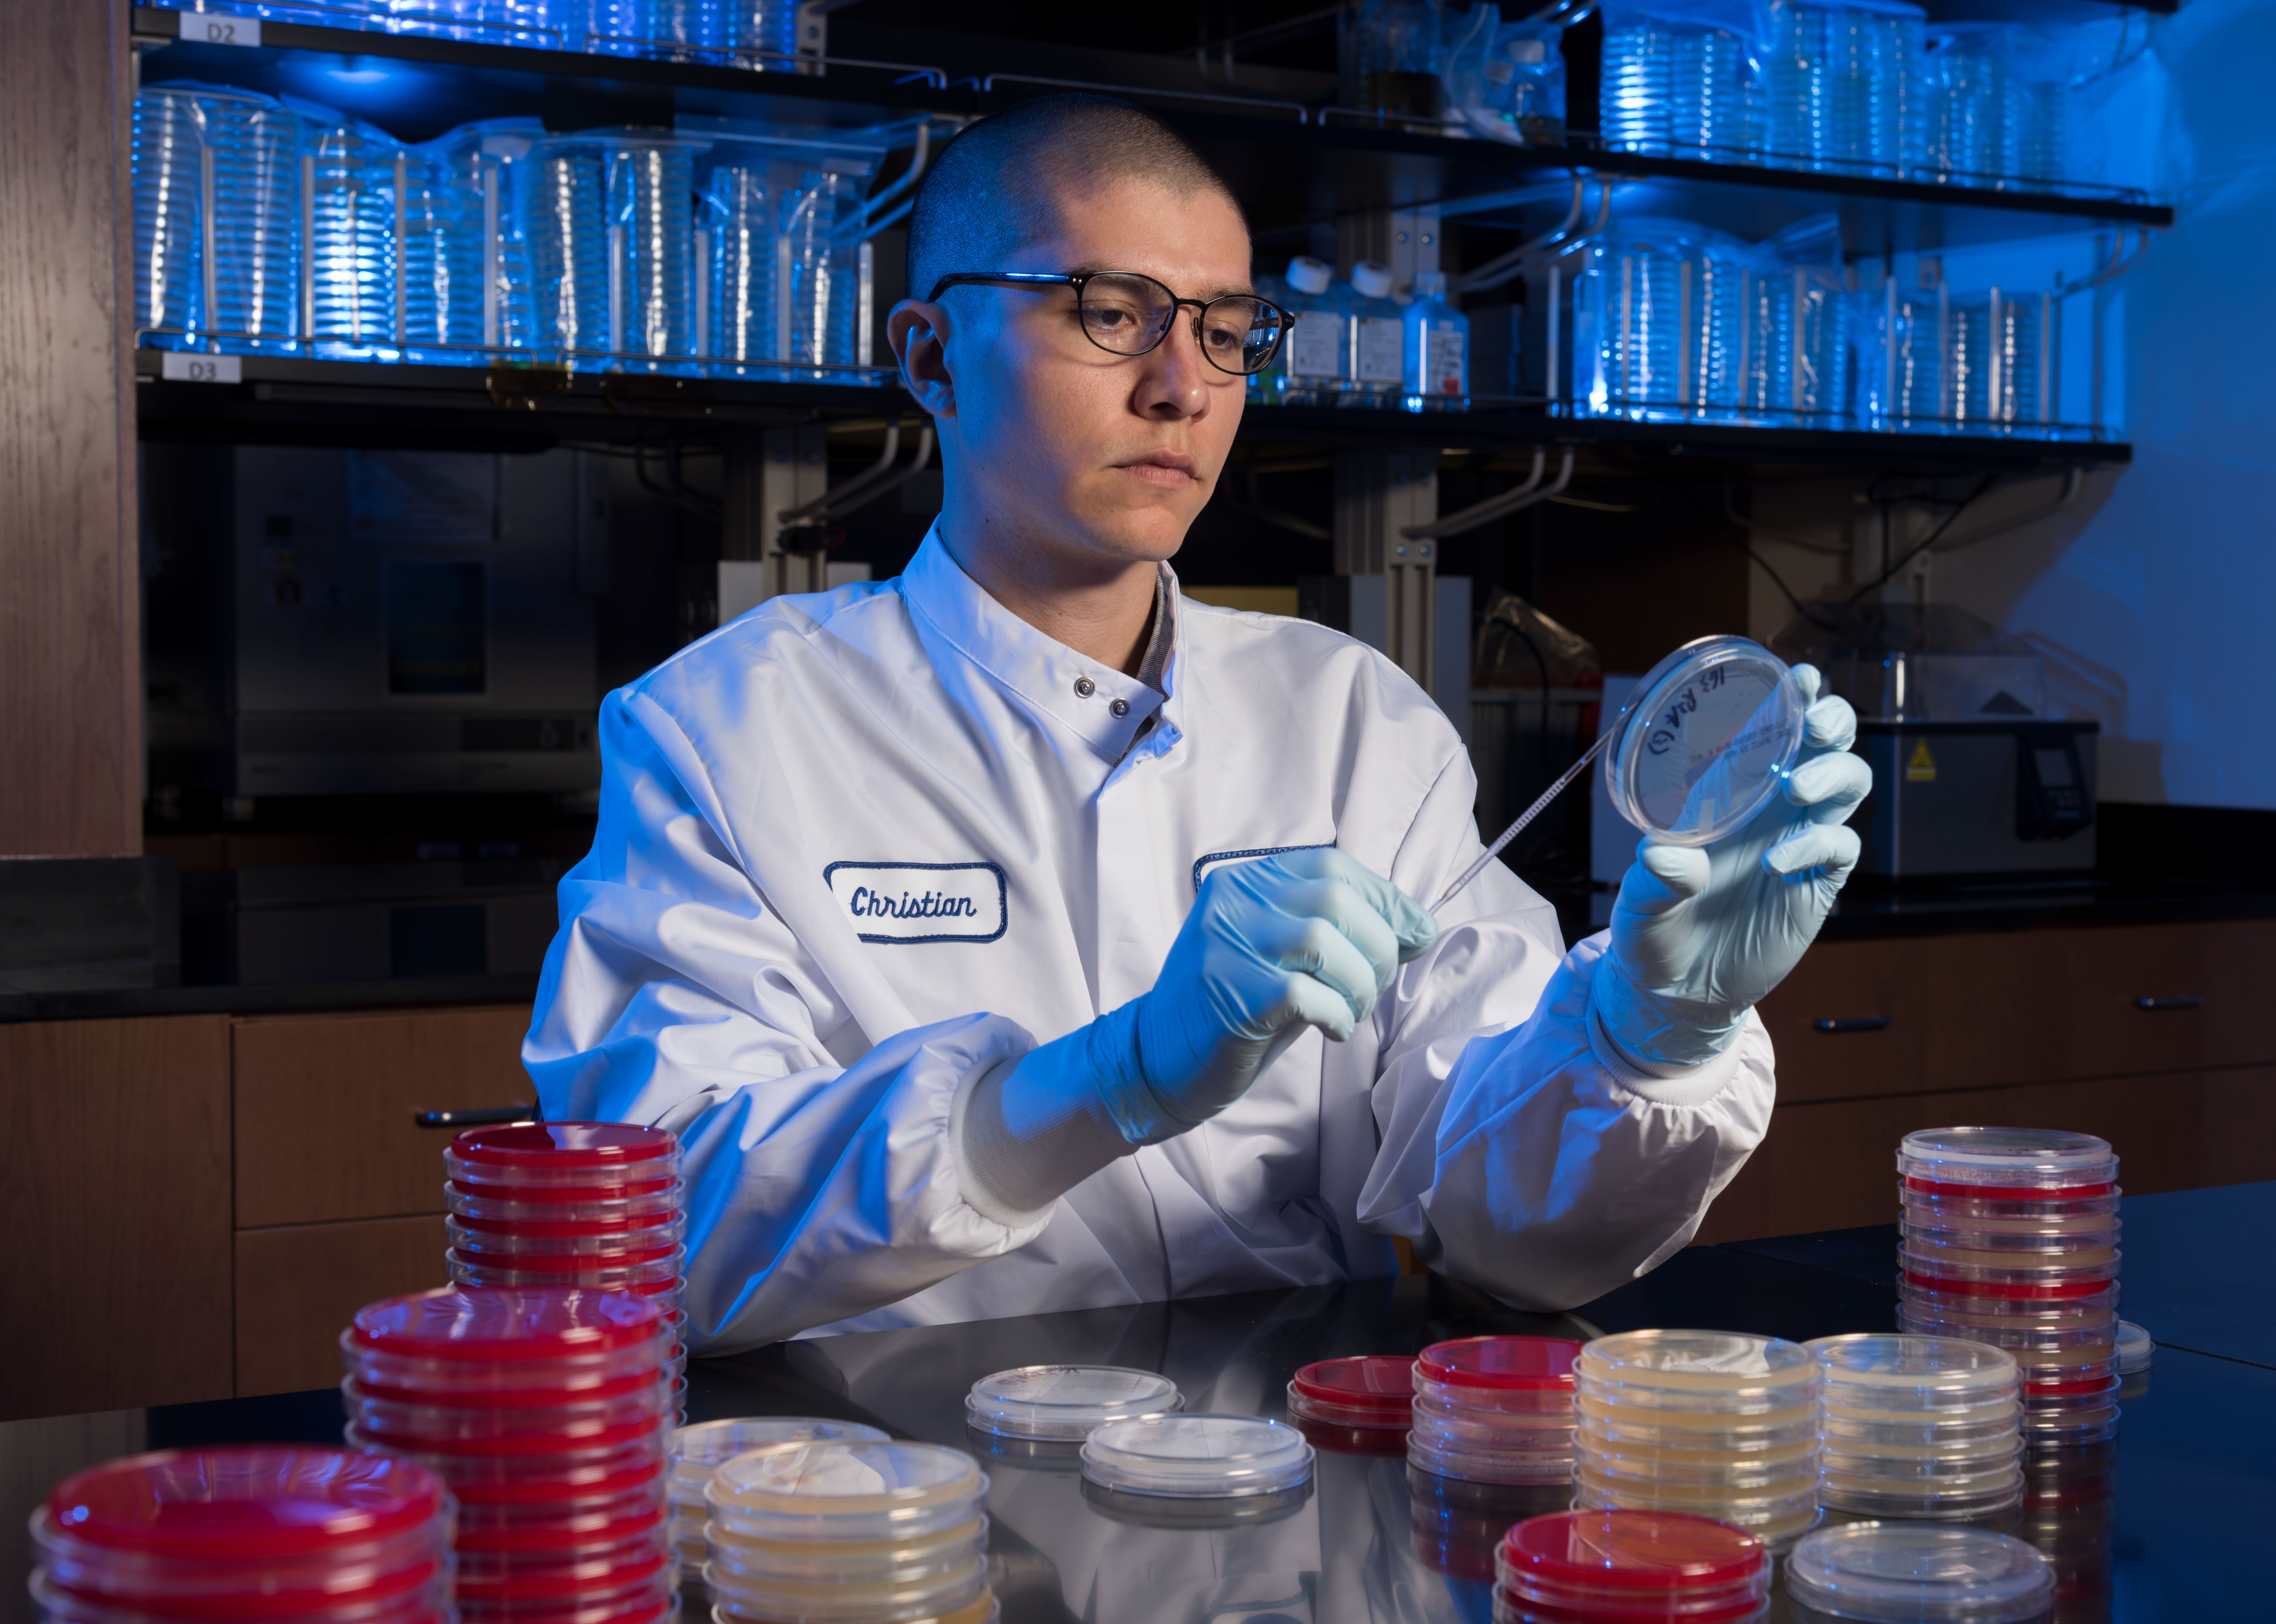
As a functional part of the Crew Health Care System and in support of Environmental Control and Life Support Systems engineers, the Microbiology Laboratory team defines requirements, coordinates and analyzes microbial sampling, and analysis of air, surface, and water samples. These environmental samples, including preflight and in-flight samples, re-analyzed to ensure that microorganisms do not adversely affect crew health or system performance.
Microbiologists also serve as team members when anomalous events occur that might affect crew health or life support systems operations. Spaceflight food samples also are evaluated preflight to decrease the risk of infectious disease to the crew.
A crewmember identifies unknown environmental microbes aboard the ISS through DNA sequencing.NASA Technology and Hardware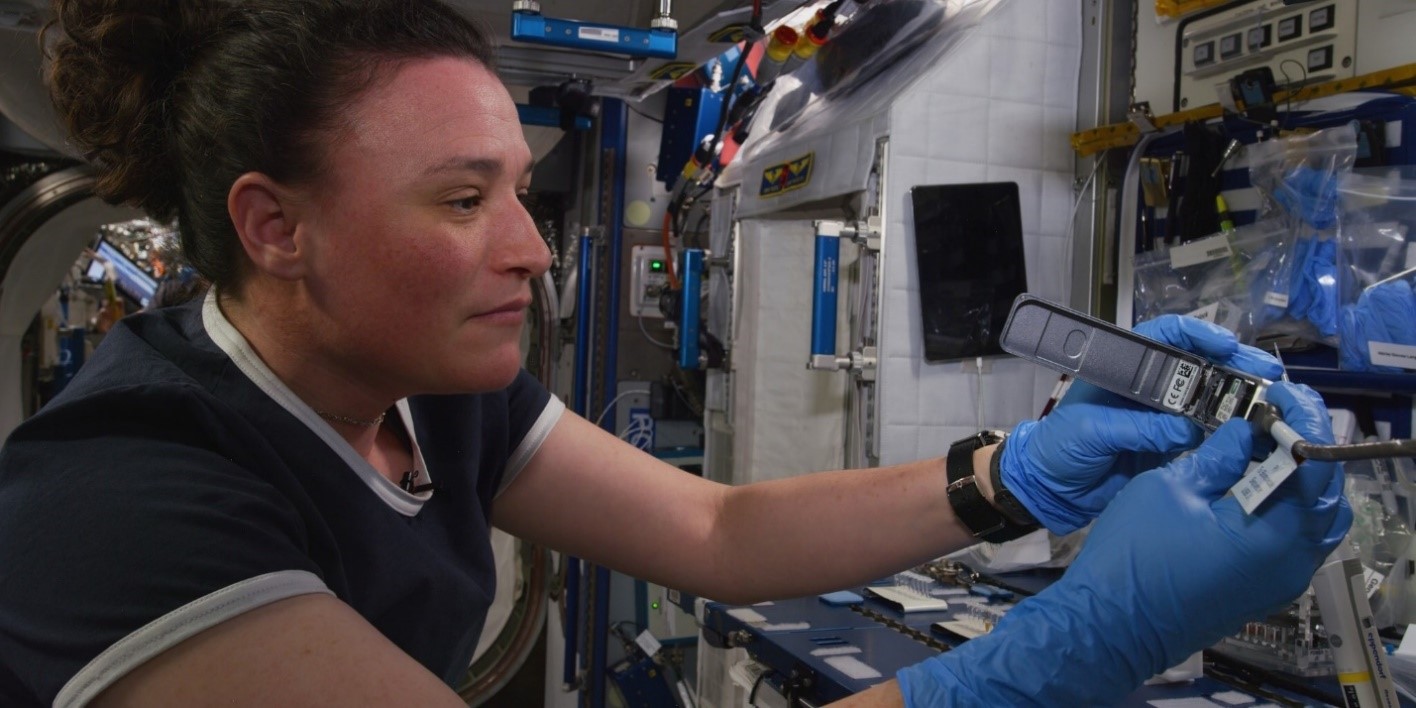
- ABI DNA sequencer
- Illumina MiSeq desktop sequencer
- Oxford Nanopore Technologies MinION DNA / RNA sequencers
- Agilent Bioanalyzer
- VITEK 2 Microbial Identification
- Space analogue bioreactors
Sarah Wallace, PhD
Hang Nguyen, PhD
Humans In Space
Missions
International Space Station
Solar System
Microbiology
2 min read
Preparations for Next Moonwalk Simulations Underway (and Underwater) Microbiology Laboratory at JSC NASA. Microorganisms and SpaceflightSpaceflight poses a risk of adverse health effects due to the interactions between microorganisms, their hosts, and their environment. The JSC Microbiology team addresses the benefits and risks related to microorganisms, including infectious disease, allergens, environmental and food contamination, and the impacts of changes in environmental and human microbial ecology aboard spacecraft. The team includes certified medical technologists, environmental microbiologists, mycologists, and biosafety professionals.
The JSC Microbiology laboratory is a critical component of the Human Health and Performance Directorate and is responsible for addressing crew health and environmental issues related to microbial infection, allergens, and contamination. This responsibility is achieved by operational monitoring and investigative research using classical microbiological, advanced molecular, and immunohistochemical techniques. This research has resulted in a significant number of presentations and peer-reviewed publications contributing to the field of Microbiology with articles in journals such as Infection and Immunity, Journal of Infectious Disease and Applied and Environmental Microbiology, Nature Reviews Microbiology, and Proceedings of the National Academies of Science.
Fun Fact: Microorganisms display unexpected responses when grown in the spaceflight environment compared to otherwise identically grown microbes on Earth.NASA
Christian Castro is streaking bacteria to be characterized using a variety of culture media. Photo Date: May 29, 2018. Location: Building 21 – Microbiology Lab. NASA Keeping Crew-members SafeAs a functional part of the Crew Health Care System and in support of Environmental Control and Life Support Systems engineers, the Microbiology Laboratory team defines requirements, coordinates and analyzes microbial sampling, and analysis of air, surface, and water samples. These environmental samples, including preflight and in-flight samples, re-analyzed to ensure that microorganisms do not adversely affect crew health or system performance.
Microbiologists also serve as team members when anomalous events occur that might affect crew health or life support systems operations. Spaceflight food samples also are evaluated preflight to decrease the risk of infectious disease to the crew.
A crewmember identifies unknown environmental microbes aboard the ISS through DNA sequencing.NASA Technology and Hardware- ABI DNA sequencer
- Illumina MiSeq desktop sequencer
- Oxford Nanopore Technologies MinION DNA / RNA sequencers
- Agilent Bioanalyzer
- VITEK 2 Microbial Identification
- Space analogue bioreactors
Sarah Wallace, PhD
Hang Nguyen, PhD
Humans In Space
Missions
International Space Station
Solar System
Physicists stirred up controversy with scientific cooking tips in 2025
Physicists stirred up controversy with scientific cooking tips in 2025
NASA’s Chandra Rings in New Year With Champagne Cluster
Celebrate the New Year with the “Champagne Cluster,” a galaxy cluster seen in this new image from NASA’s Chandra X-ray Observatory and optical telescopes.
Astronomers discovered this galaxy cluster Dec. 31, 2020. The date, combined with the bubble-like appearance of the galaxies and the superheated gas seen with Chandra observations (represented in purple), inspired the scientists to nickname the galaxy cluster the Champagne Cluster, a much easier-to-remember name than its official designation of RM J130558.9+263048.4.
The new composite image shows that the Champagne Cluster is actually two galaxy clusters in the process of merging to form an even larger cluster. Multimillion-degree gas in galaxy clusters usually takes on an approximately circular or moderately oval shape in images, but in the Champagne Cluster it is more widely spread from top to bottom, revealing the presence of the two colliding clusters. Two clumps of individual galaxies making up the colliding clusters can be seen toward the top and bottom of center. (The image has been rotated clockwise by 90 degrees so that North points to the right.)
The hot gas outweighs the combined mass in all of the hundred-plus individual galaxies in the newly forming cluster. The clusters also contain even larger amounts of unseen dark matter, the mysterious substance that pervades the universe.
In addition to the Chandra data, this new image contains optical data from the Legacy Surveys (red, green, and blue), which consists of three individual and complementary surveys from various telescopes in Arizona and Chile.
The Champagne Cluster is a member of a rare class of merging clusters, which includes the well-known Bullet Cluster, where the hot gas in each cluster has collided and slowed down, and there is a clear separation between the hot gas and the most massive galaxy in each cluster.
By comparing the data with computer simulations, astronomers came up with two possibilities for the history of the Champagne Cluster. One is that the two clusters already collided with each other over two billion years ago. After the collision the two clusters traveled outward and then were pulled back toward each other by gravity, and are now heading into a second collision. The other idea is that a single collision occurred about 400 million years ago, and the two clusters are now traveling away from each other after that collision. Researchers think further studies of the Champagne Cluster can potentially teach them how dark matter reacts to a high-speed collision.
A paper describing these results recently appeared in The Astrophysical Journal and is available online. The authors of the paper are Faik Bouhrik, Rodrigo Stancioli, and David Wittman, all from the University of California, Davis.
NASA’s Marshall Space Flight Center in Huntsville, Alabama, manages the Chandra program. The Smithsonian Astrophysical Observatory’s Chandra X-ray Center controls science operations from Cambridge, Massachusetts, and flight operations from Burlington, Massachusetts.
Read more from NASA’s Chandra X-ray Observatory
Learn more about the Chandra X-ray Observatory and its mission here:
Visual DescriptionThis release features a composite image of a galaxy cluster discovered on New Year’s Eve day, 2020.
The cluster appears here as a large collection of brilliant white lights, each a distinct galaxy. A neon purple cloud stretches across the cluster’s crowded core. Many of the hundred-plus galaxies in the cluster are in two clumps of galaxies towards the top and bottom of center. Some are encircled by a faint glowing haze, while a few foreground stars gleam with diffraction spikes. Some of the smaller galaxies are tinted blue, orange, or red, and some appear more oblong than round, suggesting spiral shapes viewed edge-on.
The neon purple cloud sits at the heart of the image, surrounding the most densely-packed part of the cluster. This cloud, which spreads vertically across the cluster, is multimillion-degree gas observed by Chandra. The two clumps of observable galaxies, and the spread of superheated gas, reveal that the Champagne Cluster is in fact two clusters in the process of colliding.
With the two clusters of sparkling light clinking together, and the auspicious discovery date, astronomers have dubbed the merged cosmic structure “The Champagne Cluster”.
News Media ContactMegan Watzke
Chandra X-ray Center
Cambridge, Mass.
617-496-7998
mwatzke@cfa.harvard.edu
Joel Wallace
Marshall Space Flight Center, Huntsville, Alabama
256-544-0034
joel.w.wallace@nasa.gov
Editor’s note, Dec. 11, 2025: This story was updated to include an additional partner’s research…
Article 4 weeks ago Keep Exploring Discover More Topics From NASA ChandraSpace Telescope
Imaging X-ray Polarimetry Explorer (IXPE)The Imaging X-ray Polarimetry Explorer (IXPE) is a space observatory built to discover the secrets of some of the most…
Hubble Space TelescopeSince its 1990 launch, the Hubble Space Telescope has changed our fundamental understanding of the universe.
James Webb Space TelescopeWebb is the premier observatory of the next decade, serving thousands of astronomers worldwide. It studies every phase in the…
NASA’s New Chief Hints Iconic Space Shuttle Might Not Be Moving to Texas After All
NASA’s new boss Jared Isaacman hinted that he could break with Texas lawmakers’ push to move iconic space shuttle Discovery from the Smithsonian to Houston
Passing Baby Stars Lock Arms in Rare Astronomical Find
Astronomers have discovered a bridge of gas and dust between two protostars, the signature of a close encounter 15,000 years ago.
The post Passing Baby Stars Lock Arms in Rare Astronomical Find appeared first on Sky & Telescope.
The emotion you never knew you had, and how to feel more of it
The emotion you never knew you had, and how to feel more of it
The century-long hunt for the gigantic meteorite that vanished
The century-long hunt for the gigantic meteorite that vanished
The cassette tape made a comeback in 2025 thanks to a DNA upgrade
The cassette tape made a comeback in 2025 thanks to a DNA upgrade
EU carbon border tax will force others to cut emissions from 2026
EU carbon border tax will force others to cut emissions from 2026
Europa Clipper Reveals a New Perspective on Comet 3I/ATLAS
Researchers have been trying to look at interstellar object 3I/ATLAS from every conceivable angle. That includes very unconventional ones. Recently, while 3I/ATLAS passed out of view of the Earth, it moved into a great vantage point for one of our interplanetary probes. Europa Clipper, whose main mission is to explore Jupiter’s active moon, turned its gaze during its six year journey back towards the center of the solar system and observed 3I/ATLAS as it was reaching its perihelion, and out of sight from the Earth.