
NASA - Breaking News
Curiosity Blog, Sols 4589 – 4592: Setting up to explore Volcán Peña Blanca
- Curiosity Home
- Science
- News and Features
- Multimedia
- Mars Missions
- Mars Home
Written by Abigail Fraeman, Deputy Project Scientist at NASA’s Jet Propulsion Laboratory
Earth planning date: Thursday, July 3, 2025
The team was delighted this morning to learn that Wednesday’s drive had completed flawlessly, placing us in a stable position facing a ~3 foot high ridge located ~35 feet away. This ridge is the eastern edge of a feature the team has informally named “Volcán Peña Blanca.” This feature certainly looked intriguing in orbital images, but once we saw Curiosity’s pictures of it from the ground, we decided it was cool enough to spend the time to investigate it closer. The images from the ground show a lot more detail than is visible in orbit, including clear sedimentary structures exposed along the ridge face which could provide important clues about how the rocks in the boxwork-bearing terrain were initially deposited – dunes? Rivers? Lakes? The team picked their favorite spot to approach the ridge and take a closer look during Wednesday’s planning, so Curiosity made a sharp right turn to take us in that direction. Using today’s images, we refined our plan for the exact location to approach and planned a drive to take us there, setting us up for contact science on Monday.
We had the opportunity to plan four sols today, to cover the U.S. 4th of July holiday weekend, so there was lots of time for activities besides the drive. Curiosity is currently sitting right in front of some light toned rocks, including one we gave the evocative name “Huellas de Dinosaurios.” It’s extremely unlikely we’ll see dinosaur footprints in the rock, but we will get the chance to investigate it with APXS, MAHLI, and ChemCam. We also have a pair of ChemCam only targets on a more typical bedrock target named “Amboro” and some pebbles named “Tunari.” Mastcam will take a high resolution of mosaic covering Volcán Peña Blanca, some nearby rocks named “Laguna Verde,” a small light colored rock named “Suruto,” and various patterns in the ground. Two ChemCam RMI mosaics of features in the distant Mishe Mokwa face and environment monitoring activities round out the plan.
For more Curiosity blog posts, visit MSL Mission Updates
Learn more about Curiosity’s science instruments
Explore More 2 min read Curiosity Blog, Sol 4588: Ridges and troughs
Article
2 hours ago
2 min read Curiosity Blog, Sols 4586-4587: Straight Drive, Strategic Science
Article
6 days ago
3 min read An Update From the 2025 Mars 2020 Science Team Meeting
Article
6 days ago
Keep Exploring Discover More Topics From NASA
Mars
Mars Resources
Explore this page for a curated collection of Mars resources.
Rover Basics
Each robotic explorer sent to the Red Planet has its own unique capabilities driven by science. Many attributes of a…
Mars Exploration: Science Goals
The key to understanding the past, present or future potential for life on Mars can be found in NASA’s four…
Curiosity Blog, Sol 4588: Ridges and troughs
- Curiosity Home
- Science
- News and Features
- Multimedia
- Mars Missions
- Mars Home
Written by Lucy Thompson, APXS Collaborator and Senior Research Scientist at the University of New Brunswick, Canada
Earth planning date: Wednesday, July 2, 2025
As we traverse the boxwork terrain, we are encountering a series of more resistant ridges/bedrock patches, and areas that are more rubbly and tend to form lower relief polygonal or trough-like features. We came into planning this morning in one of the trough-like features after another successful drive. The science team is interested in determining why we see these different geomorphological and erosional expressions. Is the rock that comprises the more resistant ridges and patches a different composition to the rock in the troughs and low relief areas? How do the rocks vary texturally? Might the resistant bedrock be an indicator of what we will encounter when we reach the large boxworks that we are driving towards?
We managed to find a large enough area of rock to safely brush (target – “Guapay”), after which we will place APXS and MAHLI to determine the composition and texture. ChemCam will also analyze a different rock target, “Taltal” for chemistry and texture, and we will also acquire an accompanying Mastcam documentation image. The resistant ridge that we are planning to drive towards (“Volcan Pena Blanca”) and eventually investigate will be captured in a Mastcam mosaic. ChemCam will utilize their long-distance imaging capabilities to image the “Mishe Mokwa” butte off to the southeast of our current location, which likely contains bedrock layers that we will eventually pass through as we continue our climb up Mount Sharp.
After a planned drive, taking us closer to the “Volcan Pena Blanca” ridge, MARDI will image the new terrain beneath the wheels, before we execute some atmospheric observations. Mastcam will make a tau observation to monitor dust in the atmosphere and Navcam will acquire a zenith movie. Standard DAN, RAD and REMS activities round out the plan.
For more Curiosity blog posts, visit MSL Mission Updates
Learn more about Curiosity’s science instruments
Explore More 2 min read Curiosity Blog, Sols 4589 – 4592: Setting up to explore Volcán Peña Blanca
Article
44 minutes ago
2 min read Curiosity Blog, Sols 4586-4587: Straight Drive, Strategic Science
Article
6 days ago
3 min read An Update From the 2025 Mars 2020 Science Team Meeting
Article
6 days ago
Keep Exploring Discover More Topics From NASA
Mars
Mars Resources
Explore this page for a curated collection of Mars resources.
Rover Basics
Each robotic explorer sent to the Red Planet has its own unique capabilities driven by science. Many attributes of a…
Mars Exploration: Science Goals
The key to understanding the past, present or future potential for life on Mars can be found in NASA’s four…
Working in Space
In this May 23, 2025, image, NASA astronaut Jonny Kim works inside the SpaceX Dragon cargo spacecraft completing cargo operations before it undocked from the International Space Station’s Harmony module several hours later. Kim launched to the International Space Station on April 8, 2025; this is his first mission.
See what Kim and other space station crew do aboard the orbital lab.
Image credit: NASA; JAXA (Japan Aerospace Exploration Agency)/Takuya Onishi
NASA’s Hubble and Webb Telescopes Reveal Two Faces of a Star Cluster Duo
- Hubble Home
- Overview
- Impact & Benefits
- Science
- Observatory
- Team
- Multimedia
- News
- More
3 min read
NASA’s Hubble and Webb Telescopes Reveal Two Faces of a Star Cluster Duo A vast network of stars, gas, and dust is strung among a duo of star clusters in this combined image from NASA’s Hubble and Webb space telescopes. Open clusters NGC 460 and NGC 456 reside in the Small Magellanic Cloud, a dwarf galaxy orbiting the Milky Way. This highly detailed 527 megapixel mosaic consists of 12 overlapping observations and includes both visible and infrared wavelengths. To view some of its incredible detail, download the 40.1 MB file and zoom in. NASA, ESA, and C. Lindberg (The Johns Hopkins University); Processing: Gladys Kober (NASA/Catholic University of America)Download this image
A riotous expanse of gas, dust, and stars stake out the dazzling territory of a duo of star clusters in this combined image from NASA’s Hubble and Webb space telescopes.
Open clusters NGC 460 and NGC 456 reside in the Small Magellanic Cloud, a dwarf galaxy orbiting the Milky Way. Open clusters consist of anywhere from a few dozen to a few thousand young stars loosely bound together by gravity. These particular clusters are part of an extensive complex of star clusters and nebulae that are likely linked to one another. As clouds of gas collapse, stars are born. These young, hot stars expel intense stellar winds that shape the nebulae around them, carving out the clouds and triggering other collapses, which in turn give rise to more stars.
In these images, Hubble’s view captures the glowing, ionized gas as stellar radiation blows “bubbles” in the clouds of gas and dust (blue), while Webb’s infrared vision highlights the clumps and delicate filamentary structures of dust (red). In Hubble images, dust is often seen silhouetted against and blocking light, but in Webb’s view, the dust – warmed by starlight – shines with its own infrared glow. This mixture of gas and dust between the universe’s stars is known as the interstellar medium.
Hubble (ACS) Webb (NIRCAM)
This Hubble image shows a duo of open clusters, NGC 460 and NGC 456. The nebulae’s glowing gas, ionized by the radiation of nearby stars, is distinct in Hubble’s view. NASA, ESA, and C. Lindberg (The Johns Hopkins University); Processing: Gladys Kober (NASA/Catholic University of America)
In Webb’s infrared view of open clusters NGC 460 and NGC 456, dusty areas are visible as bright structures glowing red. Many background galaxies are visible, their infrared light passing through the region’s obscuring clouds of gas and dust. NASA, ESA, and C. Lindberg (The Johns Hopkins University); Processing: Gladys Kober (NASA/Catholic University of America) Hubble (ACS)Webb (NIRCAM)
This Hubble image shows a duo of open clusters, NGC 460 and NGC 456. The nebulae’s glowing gas, ionized by the radiation of nearby stars, is distinct in Hubble’s view. NASA, ESA, and C. Lindberg (The Johns Hopkins University); Processing: Gladys Kober (NASA/Catholic University of America) In Webb’s infrared view of open clusters NGC 460 and NGC 456, dusty areas are visible as bright structures glowing red. Many background galaxies are visible, their infrared light passing through the region’s obscuring clouds of gas and dust. NASA, ESA, and C. Lindberg (The Johns Hopkins University); Processing: Gladys Kober (NASA/Catholic University of America)
Hubble (ACS)
Webb (NIRCAM)
Hubble and Webb view a duo of open star clusters
CurtainToggle2-Up
Image Details
Slide to switch between Hubble and Web images. Hubble’s view captures visible light and some infrared wavelengths, while Webb’s view is exclusively infrared. The nebulae’s glowing gas, ionized by the radiation of nearby stars, is distinct in Hubble’s view. Dusty areas that appear dark in the Hubble image are visible as bright structures in the Webb image, and more background galaxies are visible since infrared light from fainter and farther galaxies can pass through the obscuring clouds of gas and dust.
Downloads
Hubble
JPEG
(47 MB)
Webb
JPEG
(35 MB)
The nodules visible in these images are scenes of active star formation, with stars ranging from just one to 10 million years old. In contrast, our Sun is 4.5 billion years old. The region that holds these clusters, known as the N83-84-85 complex, is home to multiple, rare O-type stars, hot and extremely massive stars that burn hydrogen like our Sun. Astronomers estimate there are only around 20,000 O-type stars among the approximately 400 billion stars in the Milky Way.
Clouds of ionized gas dominate open cluster NGC 460 in the Hubble image (left), while tendrils of dust are on display in the Webb image (right). Together, the two images provide a more comprehensive look at the region. NASA, ESA, and C. Lindberg (The Johns Hopkins University); Processing: Gladys Kober (NASA/Catholic University of America) The Hubble image of NGC 456 (left) shows a puffy, bluish cloud of ionized gas, while the Webb image (right) displays the same cluster’s cavern-like outline of dust. NASA, ESA, and C. Lindberg (The Johns Hopkins University); Processing: Gladys Kober (NASA/Catholic University of America)The Small Magellanic Cloud is of great interest to researchers because it is less enriched in metals than the Milky Way. Astronomers call all elements heavier than hydrogen and helium – that is, with more than two protons in the atom’s nucleus – “metals.” This state mimics conditions in the early universe, so the Small Magellanic Cloud provides a relatively nearby laboratory to explore theories about star formation and the interstellar medium at early stages of cosmic history. With these observations of NGC 460 and NGC 456, researchers intend to study how gas flows in the region converge or divide; refine the collision history between the Small Magellanic Cloud and its fellow dwarf galaxy, the Large Magellanic Cloud; examine how bursts of star formation occur in such gravitational interactions between galaxies; and better understand the interstellar medium.
Explore MoreHubble’s Star Clusters
Exploring the Birth of Stars
Hubble’s Nebulae
Facebook logo @NASAHubble @NASAHubble Instagram logo @NASAHubble
Media Contact:
Claire Andreoli
NASA’s Goddard Space Flight Center, Greenbelt, MD
claire.andreoli@nasa.gov
Since its 1990 launch, the Hubble Space Telescope has changed our fundamental understanding of the universe.
Hubble’s Cosmic Adventure
Hubble’s Night Sky Challenge
Hubble’s 35th Anniversary
Aaisha Ali: From Marine Biology to the Artemis Control Room
As humanity prepares to return to the lunar surface, Aaisha Ali is behind the scenes ensuring mission readiness for astronauts set to orbit the Moon during Artemis II.
Ali is the Artemis ground control flight lead at NASA’s Johnson Space Center in Houston. She makes sure her team has the resources needed for the next giant leap to the Moon and beyond.
Aaisha Ali on console in the International Space Station Flight Control Room at NASA’s Johnson Space Center in Houston. NASA/Robert Markowitz My passion has always been science. I started by exploring the ocean, and now I get to help explore the stars.Aaisha Ali
Artemis Ground Control Flight Lead
Ali received a bachelor’s degree in biology from Texas A&M University at Galveston before beginning a career as a marine biologist. Her curiosity about science and communication eventually led her from studying marine life to sharing NASA’s mission with the public. With a robust skill set that includes public relations, media relations, and strategic communications, she went on to work at Space Center Houston and later at Johnson on the protocol and digital imagery teams.
Today, Ali leads the ground control team supporting Artemis II, ensuring that systems, simulations, and procedures are ready for the mission. Her role includes developing flight rules, finalizing operations plans and leading training sessions – known as “network sims” – that prepare her team to respond quickly and effectively.
“Because I’ve had a multifaceted career path, it has given me a different outlook,” she said. “Diversity of mindsets helps us approach problems. Sometimes a different angle is exactly what we need.”
Aaisha Ali, right, with her two siblings.Her perspective was also shaped by visits to her grandmother in the Caribbean as a child. “She lived in the tropical forest in a small village in Trinidad,” Ali said. “I was fortunate enough to spend summers on the island and experience a different way of life, which has helped me grow into the person I am today.”
Communication, she explained, is just as critical as technical expertise. “When we report to the flight director, we are the experts in our system. But we have to be clear and concise. You don’t get a lot of time on the flight loop to explain.”
That clarity, humility, and sense of teamwork are values Ali says have shaped her journey.
Aaisha Ali participates in a public affairs event at Ellington Field Joint Reserve Base in Houston in 2005. We don’t do it by ourselves. Everyone — from our engineers to custodial staff to cafeteria workers — plays a role in getting us to the Moon. NASA is for the world. And it takes all of us.Aaisha ali
Artemis Ground Control Flight Lead
Looking ahead, Ali is especially passionate about inspiring the Artemis Generation — those who will one day explore the Moon and Mars. She often shares advice with her nieces and nephews, including one determined nephew who has dreamed of becoming an astronaut since age 7.
“Do what you love, and NASA will find a place for you,” she said. “NASA is a big place. If you love the law, we have lawyers. If you love art, science, or technology, there’s a place for you. Passion is what we’re looking for.”
Aaisha Ali at Walt Disney World in Orlando, Florida.In her free time, Ali enjoys photography and connecting with nature by camping and visiting national parks. She also loves planning trips to Walt Disney World, meeting new people, experiencing different cultures, and learning new things.
Even as her days are packed with simulations and mission prep, Ali knows landing astronauts on the lunar surface for Artemis III is not far behind.
“There’s a lot of uphill left to climb,” she said. “But we’re ready.”
Explore More 4 min read Going the Distance: Lisa Pace Leads Exploration Development Integration at Johnson Article 1 week ago 5 min read Heather Cowardin Safeguards the Future of Space Exploration Article 2 weeks ago 4 min read I Am Artemis: Patrick Junen Article 2 weeks agoNASA Remembers Former Johnson Director Jefferson Howell
July 3, 2025
Jefferson Davis Howell, Jr., former director of NASA’s Johnson Space Center in Houston, died July 2, in Bee Cave, Texas. He was 85 years old.
Howell was a champion of the construction of the International Space Station, working on a deadline to complete the orbiting lab by 2004. He oversaw four space shuttle crews delivering equipment and hardware to reach that goal. He also served as director during a pivotal moment for the agency: the loss of STS-107 and the crew of space shuttle Columbia. He made it his personal responsibility to meet with the families, look after them, and attend memorial services, all while keeping the families informed of the accident investigation as it unfolded.
“Gen. Howell led NASA Johnson through one of the most difficult chapters in our history, following the loss of Columbia and her crew,” said acting associate administrator Vanessa Wyche. “He brought strength and steady direction, guiding the workforce with clarity and compassion. He cared deeply for the people behind the mission and shared his leadership skills generously with the team. We extend our heartfelt condolences to his family and all who knew and loved him.”
At the time of his selection as director, he was serving as senior vice president with Science Applications International Corporation (SAIC) as the program manager for the safety, reliability, and quality assurance contract at Johnson. Following the accident, he made it his mission to improve the relationship between the civil servant and contractor workforce. He left his position and the agency, in October 2005, shortly after the Return-to-Flight mission of STS-114.
“General Howell stepped into leadership at Johnson during a pivotal time, as the International Space Station was just beginning to take shape. He led and supported NASA’s successes not only in space but here on the ground — helping to strengthen the center’s culture and offering guidance through both triumph and tragedy,” said Steve Koerner, Johnson Space Center’s acting director. “On behalf of NASA’s Johnson Space Center, we offer our deepest sympathies to his family, friends, and all those who had the privilege of working alongside him. The impact of his legacy will continue to shape Johnson for decades to come.”
The Victoria, Texas, native was a retired lieutenant general in the U.S. Marine Corps with a decorated military career prior to his service at NASA. He flew more than 300 combat missions in Vietnam and Thailand.
Howell is survived by his wife Janel and two children. A tree dedication will be held at NASA Johnson’s memorial grove in the coming year.
-end-
Chelsey Ballarte
Johnson Space Center, Houston
281-483-5111
NASA Mission Monitoring Air Quality from Space Extended
4 min read
Preparations for Next Moonwalk Simulations Underway (and Underwater)Since launching in 2023, NASA’s Tropospheric Emissions: Monitoring of Pollution mission, or TEMPO, has been measuring the quality of the air we breathe from 22,000 miles above the ground. June 19 marked the successful completion of TEMPO’s 20-month-long initial prime mission, and based on the quality of measurements to date, the mission has been extended through at least September 2026. The TEMPO mission is NASA’s first to use a spectrometer to gather hourly air quality data continuously over North America during daytime hours. It can see details down to just a few square miles, a significant advancement over previous satellites.
“NASA satellites have a long history of missions lasting well beyond the primary mission timeline. While TEMPO has completed its primary mission, the life for TEMPO is far from over,” said Laura Judd, research physical scientist and TEMPO science team member at NASA’s Langley Research Center in Hampton, Virginia. “It is a big jump going from once-daily images prior to this mission to hourly data. We are continually learning how to use this data to interpret how emissions change over time and how to track anomalous events, such as smoggy days in cities or the transport of wildfire smoke.”
To view this video please enable JavaScript, and consider upgrading to a web browser that supports HTML5 video
By measuring nitrogen dioxide (NO2) and formaldehyde (HCHO), TEMPO can derive the presence of near-surface ozone. On Aug. 2, 2024 over Houston, TEMPO observed exceptionally high ozone levels in the area. On the left, NO2 builds up in the atmosphere over the city and over the Houston Ship Channel. On the right, formaldehyde levels are seen reaching a peak in the early afternoon. Formaldehyde is largely formed through the oxidation of hydrocarbons, an ingredient of ozone production, such as those that can be emitted by petrochemical facilities found in the Houston Ship Channel. Trent Schindler/NASA's Scientific Visualization StudioWhen air quality is altered by smog, wildfire smoke, dust, or emissions from vehicle traffic and power plants, TEMPO detects the trace gases that come with those effects. These include nitrogen dioxide, ozone, and formaldehyde in the troposphere, the lowest layer of Earth’s atmosphere.
“A major breakthrough during the primary mission has been the successful test of data delivery in under three hours with the help of NASA’s Satellite Needs Working Group. This information empowers decision-makers and first responders to issue timely air quality warnings and help the public reduce outdoor exposure during times of higher pollution,” said Hazem Mahmoud, lead data scientist at NASA’s Atmospheric Science Data Center located at Langley Research Center.
…the substantial demand for TEMPO's data underscores its critical role…hazem mahmoud
NASA Data Scientist
TEMPO data is archived and distributed freely through the Atmospheric Science Data Center. “The TEMPO mission has set a groundbreaking record as the first mission to surpass two petabytes, or 2 million gigabytes, of data downloads within a single year,” said Mahmoud. “With over 800 unique users, the substantial demand for TEMPO’s data underscores its critical role and the immense value it provides to the scientific community and beyond.” Air quality forecasters, atmospheric scientists, and health researchers make up the bulk of the data users so far.
To view this video please enable JavaScript, and consider upgrading to a web browser that supports HTML5 video
On April 14, strong winds triggered the formation of a huge dust storm in the U.S. central plains and fueled the ignition of grassland fires in Oklahoma. On the left, the NO2 plumes originating from the grassland fires are tracked hour-by-hour by TEMPO. Smoke can be discerned from dust as a source since dust is not a source of NO2. The animation on the right shows the ultraviolet (UV) aerosol index, which indicates particulates in the atmosphere that absorb UV light, such as dust and smoke. Trent Schindler/NASA's Scientific Visualization StudioThe TEMPO mission is a collaboration between NASA and the Smithsonian Astrophysical Observatory, whose Center for Astrophysics Harvard & Smithsonian oversees daily operations of the TEMPO instrument and produces data products through its Instrument Operations Center.
Datasets from TEMPO will be expanded through collaborations with partner agencies like the National Oceanic and Atmospheric Administration (NOAA), which is deriving aerosol products that can distinguish between smoke and dust particles and offer insights into their altitude and concentration.
To view this video please enable JavaScript, and consider upgrading to a web browser that supports HTML5 video
On May 5, TEMPO measured NO2 emissions over the Twin Cities in the center of Minnesota during morning rush hour. The NO2 increases seen mid-day through the early evening hours are illustrated by the red and black shaded areas at the Red River Valley along the North Dakota state line. These levels are driven by emissions from the soils in agriculturally rich areas. Agricultural soil emissions are influenced by environmental factors like temperature and moisture as well as fertilizer application. Small fires and enhancements from mining activities can also be seen popping up across the region through the afternoon.Trent Schindler/NASA's Scientific Visualization Studio“These datasets are being used to inform the public of rush-hour pollution, air quality alerts, and the movement of smoke from forest fires,” said Xiong Liu, TEMPO’s principal investigator at the Center for Astrophysics Harvard & Smithsonian. “The library will soon grow with the important addition of aerosol products. Users will be able to use these expanded TEMPO products for air quality monitoring, improving forecast models, deriving pollutant amounts in emissions and many other science applications.”
The TEMPO mission detects and highlights movement of smoke originating from fires burning in Manitoba on June 2. Seen in purple hues are observations made by TEMPO in the ultraviolet spectrum compared to Advanced Baseline Imagers (ABIs) on NOAA’s GOES-R series of weather satellites that do not have the needed spectral coverage. The NOAA GOES-R data paired with NASA’s TEMPO data enhance state and local agencies’ ability to provide near-real-time smoke and dust impacts in local air quality forecasts.NOAA/NESDIS/Center for Satellite Applications and Research“The TEMPO data validation has truly been a community effort with over 20 agencies at the federal and international level, as well as a community of over 200 scientists at research and academic institutions,” Judd added. “I look forward to seeing how TEMPO data will help close knowledge gaps about the timing, sources, and evolution of air pollution from this unprecedented space-based view.”
An agency review will take place in the fall to assess TEMPO’s achievements and extended mission goals and identify lessons learned that can be applied to future missions.
The TEMPO mission is part of NASA’s Earth Venture Instrument program, which includes small, targeted science investigations designed to complement NASA’s larger research missions. The instrument also forms part of a virtual constellation of air quality monitors for the Northern Hemisphere which includes South Korea’s Geostationary Environment Monitoring Spectrometer and ESA’s (European Space Agency) Sentinel-4 satellite. TEMPO was built by BAE Systems Inc., Space & Mission Systems (formerly Ball Aerospace). It flies onboard the Intelsat 40e satellite built by Maxar Technologies. The TEMPO Instrument Operations Center and the Science Data Processing Center are operated by the Smithsonian Astrophysical Observatory, part of the Center for Astrophysics | Harvard & Smithsonian in Cambridge.
For more information about the TEMPO instrument and mission, visit:
https://science.nasa.gov/mission/tempo/
About the AuthorCharles G. HatfieldScience Public Affairs Officer, NASA Langley Research Center Share Details Last Updated Jul 03, 2025 LocationNASA Langley Research Center Related Terms Explore More 3 min read NASA’s Hubble and Webb Telescopes Reveal Two Faces of a Star Cluster DuoA riotous expanse of gas, dust, and stars stake out the dazzling territory of a…
Article 9 hours ago 3 min read Aaisha Ali: From Marine Biology to the Artemis Control Room Article 14 hours ago 2 min read Hubble Observations Give “Missing” Globular Cluster Time to ShineA previously unexplored globular cluster glitters with multicolored stars in this NASA Hubble Space Telescope…
Article 4 days ago Keep Exploring Discover More Topics From NASAMissions
Humans in Space
Climate Change
Solar System
Hubble Observations Give “Missing” Globular Cluster Time to Shine
- Hubble Home
- Overview
- Science
- Impact & Benefits
- Observatory
- Team
- Multimedia
- News
- More
2 min read
Hubble Observations Give “Missing” Globular Cluster Time to Shine This NASA Hubble Space Telescope image features a dense and dazzling array of blazing stars that form globular cluster ESO 591-12. NASA, ESA, and D. Massari (INAF — Osservatorio di Astrofisica e Scienza dello Spazio); Processing: Gladys Kober (NASA/Catholic University of America)Download this image
A previously unexplored globular cluster glitters with multicolored stars in this NASA Hubble Space Telescope image. Globular clusters like this one, called ESO 591-12 or Palomar 8, are spherical collections of tens of thousands to millions of stars tightly bound together by gravity. Globular clusters generally form early in the galaxies’ histories in regions rich in gas and dust. Since the stars form from the same cloud of gas as it collapses, they typically hover around the same age. Strewn across this image of ESO 591-12 are a number of red and blue stars. The colors indicate their temperatures; red stars are cooler, while the blue stars are hotter.
Hubble captured the data used to create this image of ESO 591-12 as part of a study intended to resolve individual stars of the entire globular cluster system of the Milky Way. Hubble revolutionized the study of globular clusters since earthbound telescopes are unable to distinguish individual stars in the compact clusters. The study is part of the Hubble Missing Globular Clusters Survey, which targets 34 confirmed Milky Way globular clusters that Hubble has yet to observe.
The program aims to provide complete observations of ages and distances for all of the Milky Way’s globular clusters and investigate fundamental properties of still-unexplored clusters in the galactic bulge or halo. The observations will provide key information on the early stages of our galaxy, when globular clusters formed.
Explore MoreHubble’s Star Clusters
Exploring the Birth of Stars
Facebook logo @NASAHubble @NASAHubble Instagram logo @NASAHubble
Media Contact:
Claire Andreoli
NASA’s Goddard Space Flight Center, Greenbelt, MD
claire.andreoli@nasa.gov
Since its 1990 launch, the Hubble Space Telescope has changed our fundamental understanding of the universe.
Hubble’s Cosmic Adventure
Hubble’s Night Sky Challenge
Hubble’s 35th Anniversary
NASA Advances Pressure Sensitive Paint Research Capability
5 min read
Preparations for Next Moonwalk Simulations Underway (and Underwater) The Swept Wing Flow Test model, known as SWiFT, with pressure sensitive paint applied, sports a pink glow under ultraviolet lights while tested during 2023 in a NASA wind tunnel at Langley Research Center in Virginia.NASA / Dave BowmanMany of us grew up using paint-by-number sets to create beautiful color pictures.
For years now, NASA engineers studying aircraft and rocket designs in wind tunnels have flipped that childhood pastime, using computers to generate images from “numbers-by-paint” – pressure sensitive paint (PSP), that is.
Now, advances in the use of high-speed cameras, supercomputers, and even more sensitive PSP have made this numbers-by-paint process 10,000 times faster while creating engineering visuals with 1,000 times higher resolution.
So, what’s the big difference exactly between the “old” capability in use at NASA for more than a decade and the “new?”
“The key is found by adding a single word in front of PSP, namely ‘unsteady’ pressure sensitive paint, or uPSP,” said E. Lara Lash, an aerospace engineer from NASA’s Ames Research Center in California’s Silicon Valley.
With PSP, NASA researchers study the large-scale effects of relatively smooth air flowing over the wings and body of aircraft. Now with uPSP, they are able to see in finer detail what happens when more turbulent air is present – faster and better than ever before.
In some cases with the new capability, researchers can get their hands on the wind tunnel data they’re looking for within 20 minutes. That’s quick enough to allow engineers to adjust their testing in real time.
Usually, researchers record wind tunnel data and then take it back to their labs to decipher days or weeks later. If they find they need more data, it can take additional weeks or even months to wait in line for another turn in the wind tunnel.
“The result of these improvements provides a data product that is immediately useful to aerodynamic engineers, structural engineers, or engineers from other disciplines,” Lash said.
Robert Pearce, NASA’s associate administrator for aeronautics, who recently saw a demonstration of uPSP-generated data displayed at Ames, hailed the new tool as a national asset that will be available to researchers all over the country.
“It’s a unique NASA innovation that isn’t offered anywhere else,” Pearce said. “It will help us maintain NASA’s world leadership in wind tunnel capabilities.”
A technician sprays unsteady pressure sensitive paint onto the surface of a small model of the Space Launch System in preparation for testing in a NASA wind tunnel.NASA / Dave Bowman How it WorksWith both PSP and uPSP, a unique paint is applied to scale models of aircraft or rockets, which are mounted in wind tunnels equipped with specific types of lights and cameras.
When illuminated during tests, the paint’s color brightness changes depending on the levels of pressure the model experiences as currents of air rush by. Darker shades mean higher pressure; lighter shades mean lower pressure.
Cameras capture the brightness intensity and a supercomputer turns that information into a set of numbers representing pressure values, which are made available to engineers to study and glean what truths they can about the vehicle design’s structural integrity.
“Aerodynamic forces can vibrate different parts of the vehicle to different degrees,” Lash said. “Vibrations could damage what the vehicle is carrying or can even lead to the vehicle tearing itself apart. The data we get through this process can help us prevent that.”
Traditionally, pressure readings are taken using sensors connected to little plastic tubes strung through a model’s interior and poking up through small holes in key places, such as along the surface of a wing or the fuselage.
Each point provides a single pressure reading. Engineers must use mathematical models to estimate the pressure values between the individual sensors.
With PSP, there is no need to estimate the numbers. Because the paint covers the entire model, its brightness as seen by the cameras reveals the pressure values over the whole surface.
A four-percent scale model of the Space Launch System rocket is tested in 2017 using unsteady Pressure Sensitive Paint inside the 11-foot by 11-foot Unitary Plan Wind Tunnel at NASA’s Ames Research Center in California.NASA / Dominic Hart Making it BetterThe introduction, testing, and availability of uPSP is the result of a successful five-year-long effort, begun in 2019, in which researchers challenged themselves to significantly improve the PSP’s capability with its associated cameras and computers.
The NASA team’s desire was to develop and demonstrate a better process of acquiring, processing, and visualizing data using a properly equipped wind tunnel and supercomputer, then make the tool available at NASA wind tunnels across the country.
The focus during a capability challenge was on NASA’s Unitary Plan Facility’s 11-foot transonic wind tunnel, which the team connected to the nearby NASA Advanced Supercomputing Facility, both located at Ames.
Inside the wind tunnel, a scale model of NASA’s Space Launch System rocket served as the primary test subject during the challenge period.
Now that the agency has completed its Artemis I uncrewed lunar flight test mission, researchers can match the flight-recorded data with the wind tunnel data to see how well reality and predictions compare.
With the capability challenge officially completed at the end of 2024, the uPSP team is planning to deploy it to other wind tunnels and engage with potential users with interests in aeronautics or spaceflight.
“This is a NASA capability that we have, not only for use within the agency, but one that we can offer industry, academia, and other government agencies to come in and do research using these new tools,” Lash said.
NASA’s Aerosciences Evaluation and Test Capabilities portfolio office, an organization managed under the agency’s Aeronautics Research Mission Directorate, oversaw the development of the uPSP capability.
Watch this uPSP Video About the AuthorJim BankeManaging Editor/Senior WriterJim Banke is a veteran aviation and aerospace communicator with more than 40 years of experience as a writer, producer, consultant, and project manager based at Cape Canaveral, Florida. He is part of NASA Aeronautics' Strategic Communications Team and is Managing Editor for the Aeronautics topic on the NASA website.
Facebook logo @NASA@NASAaero@NASA_es @NASA@NASAaero@NASA_es Instagram logo @NASA@NASAaero@NASA_es Linkedin logo @NASA Explore More 4 min read NASA Mission Monitoring Air Quality from Space Extended Article 4 days ago 6 min read By Air and by Sea: Validating NASA’s PACE Ocean Color Instrument Article 2 weeks ago 3 min read NASA Intern Took Career from Car Engines to Cockpits Article 2 weeks ago Keep Exploring Discover More Topics From NASAMissions
Artemis
Aeronautics STEM
Explore NASA’s History
Share Details Last Updated Jul 03, 2025 EditorJim BankeContactJim Bankejim.banke@nasa.gov Related TermsOld Glory on the Red Planet
The United States flag adorns an aluminum plate mounted at the base of the mast, or “head,” of NASA’s Perseverance Mars rover. This image of the plate was taken on June 28, 2025 (the 1,548th day, or sol, of the mission), by the WATSON (Wide Angle Topographic Sensor for Operations and eNgineering) camera on the end of the rover’s robotic arm.
WATSON, part of an instrument called SHERLOC (Scanning Habitable Environments with Raman & Luminescence for Organics & Chemicals), was built by Malin Space Science Systems (MSSS) in San Diego and is operated jointly by MSSS and NASA’s Jet Propulsion Laboratory in Southern California. JPL, which is managed for the agency by Caltech, built and manages operations of the Perseverance rover.
Discovery Alert: Scientists Spot a Planetary Carousel
KOI-134 b and KOI-134 c
This artist’s concept shows the KOI-134 system which, in 2025, a paper revealed to have two planets: KOI-134 b and KOI-134 c. NASA/JPL-Caltech/K. Miller (Caltech/IPAC) The DiscoveryA new investigation into old Kepler data has revealed that a planetary system once thought to house zero planets actually has two planets which orbit their star in a unique style, like an old-fashioned merry-go-round.
Key FactsThe KOI-134 system contains two planets which orbit their star in a peculiar fashion on two different orbital planes, with one planet exhibiting significant variation in transit times. This is the first-discovered system of its kind.
DetailsOver a decade ago, scientists used NASA’s Kepler Space Telescope to observe the KOI-134 system and thought that it might have a planet orbiting, but they deemed this planet candidate to be a false positive, because its transits (or passes in front of its star) were not lining up as expected. These transits were so abnormal that the planet was actually weeded out through an automated system as a false positive before it could be analyzed further.
However, NASA’s commitment to openly sharing scientific data means that researchers can constantly revisit old observations to make new discoveries. In this new study, researchers re-analyzed this Kepler data on KOI-134 and confirmed that not only is the “false positive” actually a real planet, but the system has two planets and some really interesting orbital dynamics!
First, the “false positive” planet, named KOI-134 b, was confirmed to be a warm Jupiter (or a warm planet of a similar size to Jupiter). Through this analysis, researchers uncovered that the reason this planet eluded confirmation previously is because it experiences what are called transit timing variations (TTVs), or small differences in a planet’s transit across its star that can make its transit “early” or “late” because the planet is being pushed or pulled by the gravity from another planet which was also revealed in this study. Researchers estimate that KOI-134 b transits across its star as much as 20 hours “late” or “early,” which is a significant variation. In fact, it was so significant that it’s the reason why the planet wasn’t confirmed in initial observations.
As these TTVs are caused by the gravitational interaction with another planet, this discovery also revealed a planetary sibling: KOI-134 c. Through studying this system in simulations that include these TTVs, the team found that KOI-134 c is a planet slightly smaller than Saturn and closer to its star than KOI-134 b.
This artist’s concept shows the KOI-134 system which, in 2025, a paper revealed to have two planets: KOI-134 b and KOI-134 c. NASA/JPL-Caltech/K. Miller (Caltech/IPAC)KOI-134 c previously eluded observation because it orbits on a tilted orbital plane, a different plane from KOI-134 b, and this tilted orbit prevents the planet from transiting its star. The two orbital planes of these planets are about 15 degrees different from one another, also known as a mutual inclination of 15 degrees, which is significant. Due to the gravitational push and pull between these two planets, their orbital planes also tilt back and forth.
Another interesting feature of this planetary system is something called resonance. These two planets have a 2 to 1 resonance, meaning within the same time that one planet completes one orbit, the other completes two orbits. In this case, KOI-134 b has an orbital period (the time it takes a planet to complete one orbit) of about 67 days, which is twice the orbital period of KOI-134 c, which orbits every 33-34 days.
Between the separate orbital planes tilting back and forth, the TTVs, and the resonance, the two planets orbit their star in a pattern that resembles two wooden ponies bobbing up and down as they circle around on an old-fashioned merry go round.
Fun FactsWhile this system started as a false positive with Kepler, this re-analysis of the data reveals a vibrant system with two planets. In fact, this is the first-ever discovered compact, multiplanetary system that isn’t flat, has such a significant TTV, and experiences orbital planes tilting back and forth.
Also, most planetary systems do not have high mutual inclinations between close planet pairs. In addition to being a rarity, mutual inclinations like this are also not often measured because of challenges within the observation process. So, having measurements like this of a significant mutual inclination in a system, as well as measurements of resonance and TTVs, provides a clear picture of dynamics within a planetary system which we are not always able to see.
The DiscoverersA team of scientists led by Emma Nabbie of the University of Southern Queensland published a paper on June 27 on their discovery, “A high mutual inclination system around KOI-134 revealed by transit timing variations,” in the journal “Nature Astronomy.” The observations described in this paper and used in simulations in this paper were made by NASA’s Kepler Space Telescope and the paper included collaboration and contributions from institutions including the University of Geneva, University of La Laguna, Purple Mountain Observatory, the Harvard-Smithsonian Center for Astrophysics, the Georgia Institute of Technology, the University of Southern Queensland, and NASA’s retired Kepler Space Telescope.
NASA Sets Briefings for SpaceX Crew-11 Mission to Space Station
NASA and its partners will discuss the upcoming crew rotation to the International Space Station during a pair of news conferences on Thursday, July 10, from the agency’s Johnson Space Center in Houston.
First is an overview news conference at 12 p.m. EDT with mission leadership discussing final launch and mission preparations on the agency’s YouTube channel.
Next, crew will participate in a news conference at 2 p.m. on NASA’s YouTube channel, followed by individual astronaut interviews at 3 p.m. This is the final media opportunity with Crew-11 before they travel to NASA’s Kennedy Space Center in Florida for launch.
The Crew-11 mission, targeted to launch in late July/early August, will carry NASA astronauts Zena Cardman and Mike Fincke, JAXA (Japan Aerospace Exploration Agency) astronaut Kimiya Yui, and Roscosmos cosmonaut Oleg Platonov to the orbiting laboratory. The crew will launch aboard a SpaceX Dragon spacecraft on the company’s Falcon 9 rocket from Launch Complex 39A.
United States-based media seeking to attend in person must contact the NASA Johnson newsroom no later than 5 p.m. on Monday, July 7, at 281-483-5111 or jsccommu@mail.nasa.gov. A copy of NASA’s media accreditation policy is available online.
Any media interested in participating in the news conferences by phone must contact the Johnson newsroom by 9:45 a.m. the day of the event. Media seeking virtual interviews with the crew must submit requests to the Johnson newsroom by 5 p.m. on Monday, July 7.
Briefing participants are as follows (all times Eastern and subject to change based on real-time operations):
12 p.m.: Mission Overview News Conference
- Steve Stich, manager, Commercial Crew Program, NASA Kennedy
- Bill Spetch, operations integration manager, International Space Station Program, NASA Johnson
- NASA’s Space Operations Mission Directorate representative
- Sarah Walker, director, Dragon Mission Management, SpaceX
- Mayumi Matsuura, vice president and director general, Human Spaceflight Technology Directorate, JAXA
2 p.m.: Crew News Conference
- Zena Cardman, Crew-11 commander, NASA
- Mike Fincke, Crew-11 pilot, NASA
- Kimiya Yui, Crew-11 mission specialist, JAXA
- Oleg Platonov, Crew-11 mission specialist, Roscosmos
3 p.m.: Crew Individual Interview Opportunities
- Crew-11 members available for a limited number of interviews
Selected as a NASA astronaut in 2017, Cardman will conduct her first spaceflight. The Williamsburg, Virginia, native holds a bachelor’s degree in Biology and a master’s in Marine Sciences from the University of North Carolina at Chapel Hill. At the time of selection, she was pursuing a doctorate in geosciences. Cardman’s geobiology and geochemical cycling research focused on subsurface environments, from caves to deep sea sediments. Since completing initial training, Cardman has supported real-time station operations and lunar surface exploration planning. Follow @zenanaut on X and @zenanaut on Instagram.
This will be Fincke’s fourth trip to the space station, having logged 382 days in space and nine spacewalks during Expedition 9 in 2004, Expedition 18 in 2008, and STS-134 in 2011, the final flight of space shuttle Endeavour. Throughout the past decade, Fincke has applied his expertise to NASA’s Commercial Crew Program, advancing the development and testing of the SpaceX Dragon spacecraft and Boeing Starliner spacecraft toward operational certification. The Emsworth, Pennsylvania, native is a graduate of the United States Air Force Test Pilot School and holds bachelors’ degrees from the Massachusetts Institute of Technology, Cambridge, in both aeronautics and astronautics, as well as Earth, atmospheric and planetary sciences. He also has a master’s degree in aeronautics and astronautics from Stanford University in California. Fincke is a retired U.S. Air Force colonel with more than 2,000 flight hours in over 30 different aircraft. Follow @AstroIronMike on X and Instagram.
With 142 days in space, this will be Yui’s second trip to the space station. After his selection as a JAXA astronaut in 2009, Yui flew as a flight engineer for Expedition 44/45 and became the first Japanese astronaut to capture JAXA’s H-II Transfer Vehicle using the station’s robotic arm. In addition to constructing a new experimental environment aboard Kibo, he conducted a total of 21 experiments for JAXA. In November 2016, Yui was assigned as chief of the JAXA Astronaut Group. He graduated from the School of Science and Engineering at the National Defense Academy of Japan in 1992. He later joined the Air Self-Defense Force at the Japan Defense Agency (currently the Ministry of Defense). In 2008, Yui joined the Air Staff Office at the Ministry of Defense as a lieutenant colonel. Follow @astro_kimiya on X.
The Crew-11 mission also will be Platonov’s first spaceflight. Before his selection as a cosmonaut in 2018, Platonov earned a degree in engineering from Krasnodar Air Force Academy in aircraft operations and air traffic management. He also earned a bachelor’s degree in state and municipal management in 2016 from the Far Eastern Federal University in Vladivostok, Russia. Assigned as a test cosmonaut in 2021, he has experience in piloting aircraft, zero gravity training, scuba diving, and wilderness survival.
For more information about the mission, visit:
https://www.nasa.gov/commercialcrew
-end-
Claire O’Shea / Joshua Finch
Headquarters, Washington
202-358-1100
claire.a.o’shea@nasa.gov / joshua.a.finch@nasa.gov
Sandra Jones / Joseph Zakrzewski
Johnson Space Center, Houston
281-483-5111
sandra.p.jones@nasa.gov / Joseph.a.zakrzewski@nasa.gov
NASA Awards Simulation and Advanced Software Services II Contract
NASA has awarded a contract to MacLean Engineering & Applied Technologies, LLC of Houston to provide simulation and advanced software services to the agency.
The Simulation and Advanced Software Services II (SASS II) contract includes services from Oct. 1, 2025, through Sept. 30, 2030, with a maximum potential value not to exceed $150 million. The contract is a single award, indefinite-delivery/indefinite-quality contract with the capability to issue cost-plus-fixed-fee task orders and firm-fixed-price task orders.
Under the five-year SASS II contract, the awardee is tasked to provide simulation and software services for space-based vehicle models and robotic manipulator systems; human biomechanical representations for analysis and development of countermeasures devices; guidance, navigation, and control of space-based vehicles for all flight phases; and space-based vehicle on-board computer systems simulations of flight software systems. Responsibilities also include astronomical object surface interaction simulation of space-based vehicles, graphics support for simulation visualization and engineering analysis, and ground-based and onboarding systems to support human-in-the-loop training.
Major subcontractors include Tietronix Software Inc. in Houston and VEDO Systems, LLC, in League City, Texas.
For information about NASA and agency programs, visit:
-end-
Tiernan Doyle
Headquarters, Washington
202-358-1600
tiernan.doyle@nasa.gov
Chelsey Ballarte
Johnson Space Center, Houston
281-483-5111
Chelsey.n.ballarte@nasa.gov
How NASA’s SPHEREx Mission Will Share Its All-Sky Map With the World
5 min read
How NASA’s SPHEREx Mission Will Share Its All-Sky Map With the World NASA’s SPHEREx mission will map the entire sky in 102 different wavelengths, or colors, of infrared light. This image of the Vela Molecular Ridge was captured by SPHEREx and is part of the mission’s first ever public data release. The yellow patch on the right side of the image is a cloud of interstellar gas and dust that glows in some infrared colors due to radiation from nearby stars. NASA/JPL-CaltechNASA’s newest astrophysics space telescope launched in March on a mission to create an all-sky map of the universe. Now settled into low-Earth orbit, SPHEREx (Spectro-Photometer for the History of the Universe, Epoch of Reionization, and Ices Explorer) has begun delivering its sky survey data to a public archive on a weekly basis, allowing anyone to use the data to probe the secrets of the cosmos.
“Because we’re looking at everything in the whole sky, almost every area of astronomy can be addressed by SPHEREx data,” said Rachel Akeson, the lead for the SPHEREx Science Data Center at IPAC. IPAC is a science and data center for astrophysics and planetary science at Caltech in Pasadena, California.
Almost every area of astronomy can be addressed by SPHEREx data.Rachel Akeson
SPHEREx Science Data Center Lead
Other missions, like NASA’s now-retired WISE (Wide-field Infrared Survey Explorer), have also mapped the entire sky. SPHEREx builds on this legacy by observing in 102 infrared wavelengths, compared to WISE’s four wavelength bands.
By putting the many wavelength bands of SPHEREx data together, scientists can identify the signatures of specific molecules with a technique known as spectroscopy. The mission’s science team will use this method to study the distribution of frozen water and organic molecules — the “building blocks of life” — in the Milky Way.
This animation shows how NASA’s SPHEREx observatory will map the entire sky — a process it will complete four times over its two-year mission. The telescope will observe every point in the sky in 102 different infrared wavelengths, more than any other all-sky survey. SPHEREx’s openly available data will enable a wide variety of astronomical studies. Credit: NASA/JPL-CaltechThe SPHEREx science team will also use the mission’s data to study the physics that drove the universe’s expansion following the big bang, and to measure the amount of light emitted by all the galaxies in the universe over time. Releasing SPHEREx data in a public archive encourages far more astronomical studies than the team could do on their own.
“By making the data public, we enable the whole astronomy community to use SPHEREx data to work on all these other areas of science,” Akeson said.
NASA is committed to the sharing of scientific data, promoting transparency and efficiency in scientific research. In line with this commitment, data from SPHEREx appears in the public archive within 60 days after the telescope collects each observation. The short delay allows the SPHEREx team to process the raw data to remove or flag artifacts, account for detector effects, and align the images to the correct astronomical coordinates.
The team publishes the procedures they used to process the data alongside the actual data products. “We want enough information in those files that people can do their own research,” Akeson said.
One of the early test images captured by NASA’s SPHEREx mission in April 2025. This image shows a section of sky in one infrared wavelength, or color, that is invisible to the human eye but is represented here in a visible color. This particular wavelength (3.29 microns) reveals a cloud of dust made of a molecule similar to soot or smoke. NASA/JPL-Caltech This image from NASA’s SPHEREx shows the same region of space in a different infrared wavelength (0.98 microns), once again represented by a color that is visible to the human eye. The dust cloud has vanished because the molecules that make up the dust — polycyclic aromatic hydrocarbons — do not radiate light in this color. NASA/JPL-CaltechDuring its two-year prime mission, SPHEREx will survey the entire sky twice a year, creating four all-sky maps. After the mission reaches the one-year mark, the team plans to release a map of the whole sky at all 102 wavelengths.
In addition to the science enabled by SPHEREx itself, the telescope unlocks an even greater range of astronomical studies when paired with other missions. Data from SPHEREx can be used to identify interesting targets for further study by NASA’s James Webb Space Telescope, refine exoplanet parameters collected from NASA’s TESS (Transiting Exoplanet Survey Satellite), and study the properties of dark matter and dark energy along with ESA’s (European Space Agency’s) Euclid mission and NASA’s upcoming Nancy Grace Roman Space Telescope.
The SPHEREx mission’s all-sky survey will complement data from other NASA space telescopes. SPHEREx is illustrated second from the right. The other telescope illustrations are, from left to right: the Hubble Space Telescope, the retired Spitzer Space Telescope, the retired WISE/NEOWISE mission, the James Webb Space Telescope, and the upcoming Nancy Grace Roman Space Telescope. NASA/JPL-CaltechThe IPAC archive that hosts SPHEREx data, IRSA (NASA/IPAC Infrared Science Archive), also hosts pointed observations and all-sky maps at a variety of wavelengths from previous missions. The large amount of data available through IRSA gives users a comprehensive view of the astronomical objects they want to study.
“SPHEREx is part of the entire legacy of NASA space surveys,” said IRSA Science Lead Vandana Desai. “People are going to use the data in all kinds of ways that we can’t imagine.”
NASA’s Office of the Chief Science Data Officer leads open science efforts for the agency. Public sharing of scientific data, tools, research, and software maximizes the impact of NASA’s science missions. To learn more about NASA’s commitment to transparency and reproducibility of scientific research, visit science.nasa.gov/open-science. To get more stories about the impact of NASA’s science data delivered directly to your inbox, sign up for the NASA Open Science newsletter.
By Lauren Leese
Web Content Strategist for the Office of the Chief Science Data Officer
The SPHEREx mission is managed by NASA’s Jet Propulsion Laboratory for the agency’s Astrophysics Division within the Science Mission Directorate at NASA Headquarters. BAE Systems in Boulder, Colorado, built the telescope and the spacecraft bus. The science analysis of the SPHEREx data will be conducted by a team of scientists located at 10 institutions in the U.S., two in South Korea, and one in Taiwan. Caltech in Pasadena managed and integrated the instrument. The mission’s principal investigator is based at Caltech with a joint JPL appointment. Data will be processed and archived at IPAC at Caltech. The SPHEREx dataset will be publicly available at the NASA-IPAC Infrared Science Archive. Caltech manages JPL for NASA.
To learn more about SPHEREx, visit:
Media ContactsCalla Cofield
Jet Propulsion Laboratory, Pasadena, Calif.
626-808-2469
calla.e.cofield@jpl.nasa.gov
Amanda Adams
Office of the Chief Science Data Officer
256-683-6661
amanda.m.adams@nasa.gov
Article
6 hours ago
11 min read 3 Years of Science: 10 Cosmic Surprises from NASA’s Webb Telescope
Article
7 hours ago
7 min read A New Alloy is Enabling Ultra-Stable Structures Needed for Exoplanet Discovery
Article
1 day ago
Keep Exploring Discover More Topics From NASA
Missions
Humans in Space
Climate Change
Solar System
What’s Up: July 2025 Skywatching Tips from NASA
Mars shines in the evening, and is joined briefly by Mercury. Jupiter joins Venus as the month goes on. And all month, look for Aquila the eagle.
Skywatching HighlightsAll Month – Planet Visibility:
- Venus: Shines brightly in the east each morning during the couple of hours before sunrise, with the Pleiades and bright stars Aldebaran and Capella.
- Mars: Sits in the west, about 20 degrees above the horizon as twilight fades. Sets a couple of hours after dark.
- Jupiter: Starts to become visible low in the east in the hour before sunrise after mid-month. You’ll notice it rises a bit higher each day through August, quickly approaching closer to Venus each morning.
- Mercury: Visible very low in the west (10 degrees or lower) the first week or so in July. Find it for a short time before it sets, beginning 30-45 minutes after sunset.
- Saturn: Rises around midnight and climbs to a point high in the south as dawn approaches.
Daily Highlights:
July 1 – 7 – Mercury is relatively bright and easy to spot without a telescope, beginning about 30-45 minutes after sunset for the first week or so of July. You will need an unobstructed view toward the horizon, and note that it sets within an hour after the Sun.
July 21 & 22 – Moon, Venus, & Jupiter – Look toward the east this morning to find a lovely scene, with the crescent Moon and Venus, plus several bright stars. And if you have a clear view toward the horizon, Jupiter is there too, low in the sky.
July 28 – Moon & Mars – The crescent Moon appears right next to Mars this evening after sunset.
All month – Constellation: Aquila – The Eagle constellation, Aquila, appears in the eastern part of the sky during the first half of the night. Its brightest star, Altair, is the southernmost star in the Summer Triangle, which is an easy-to-locate star pattern in Northern Hemisphere summer skies.
TranscriptWhat’s Up for July? Mars shines in the evening sky, sixty years after its first close-up, Venus brightens your mornings, and the eagle soars overhead.
First up, Mercury is visible for a brief time following sunset for the first week of July. Look for it very low in the west 30 to 45 minutes after sundown. It sets within the hour after that, so be on the ball if you want to catch it!
Mars is visible for the first hour or two after it gets dark. You’ll find it sinking lower in the sky each day and looking a bit dimmer over the course of the month, as our two planets’ orbits carry them farther apart. The crescent Moon appears right next to Mars on the 28th.
Sky chart showing Mercury and Mars in the western sky following sunset in early July. NASA/JPL-CaltechJuly is the 60th anniversary of the first successful flyby of Mars, by NASA’s Mariner 4 spacecraft in 1965. Mariner 4 sent back the first photos of another planet from deep space, along with the discovery that the Red Planet has only a very thin, cold atmosphere.
Next, Saturn is rising late in the evening, and by dawn it’s high overhead to the south.
Looking to the morning sky, Venus shines brightly all month. You’ll find it in the east during the couple of hours before sunrise, with the Pleiades and bright stars Aldebaran and Capella. And as the month goes on, Jupiter makes its morning sky debut, rising in the hour before sunrise and appearing a little higher each day.
Sky chart showing Venus in the morning sky in July. NASA/JPL-CaltechBy the end of the month, early risers will have the two brightest planets there greeting them each morning. They’re headed for a super-close meetup in mid-August, and the pair will be a fixture of the a.m. sky through late this year. Look for them together with the crescent moon on the 21st and 22nd.
Aquila, The Eagle
From July and into August, is a great time to observe the constellation Aquila, the eagle.
Sky chart showing the shape and orientation of the constellation Aquila in the July evening sky. Aquila’s brightest star, Altair, is part of the Summer Triangle star pattern. NASA/JPL-CaltechThis time of year, it soars high into the sky in the first half of the night. Aquila represents the mythical eagle that was a powerful servant and messenger of the Greek god Zeus. The eagle carried his lightning bolts and was a symbol of his power as king of the gods.
To find Aquila in the sky, start by locating its brightest star, Altair. It’s one the three bright stars in the Summer Triangle, which is super easy to pick out during summer months in the Northern Hemisphere. Altair is the second brightest of the three, and sits at the southernmost corner of the triangle.
The other stars in Aquila aren’t as bright as Altair, which can make observing the constellation challenging if you live in an area with a lot of light pollution. It’s easier, though, if you know how the eagle is oriented on the sky. Imagine it’s flying toward the north with its wings spread wide, its right wing pointed toward Vega. If you can find Altair, and Aquila’s next brightest star, you can usually trace out the rest of the spread-eagle shape from there. The second half of July is the best time of the month to observe Aquila, as the Moon doesn’t rise until later then, making it easier to pick out the constellation’s fainter stars.
Observing the constellation Aquila makes for a worthy challenge in the July night sky. And once you’re familiar with its shape, it’s hard not to see the mythical eagle soaring overhead among the summertime stars.
Here are the phases of the Moon for July.
The phases of the Moon for July 2025. NASA/JPL-CaltechYou can stay up to date on all of NASA’s missions exploring the solar system and beyond at science.nasa.gov. I’m Preston Dyches from NASA’s Jet Propulsion Laboratory, and that’s What’s Up for this month.
Keep Exploring Discover More Topics From NASA
Missions
Humans in Space
Climate Change
Solar System
To the Spacemobile!
In this Nov. 1, 1964, image, three members of NASA’s Lewis Research Center’s (now NASA’s Glenn Research Center in Cleveland) Educational Services Office pose with one of the center’s Spacemobile space science demonstration units. Once the NACA (National Advisory Committee for Aeronautics) became NASA, public outreach became one of the agency’s core tenets. Lewis, which had previously been a closed laboratory, began hosting open houses and elaborate space fairs in the early 1960s.
In addition, the center initiated educational programs that worked with local schools and a robust speaker’s bureau that explained NASA activities to the community. One aspect of these efforts was the Spacemobile Program. These vehicles included a delegated speaker, exhibits, models, and other resources. The Spacemobiles, which made forays across the Midwest, were extremely active throughout the 1960s.
Image credit: NASA
Discovery Alert: Flaring Star, Toasted Planet
A giant planet some 400 light-years away, HIP 67522 b, orbits its parent star so tightly that it appears to cause frequent flares from the star’s surface, heating and inflating the planet’s atmosphere.
Key FactsOn planet Earth, “space weather” caused by solar flares might disrupt radio communications, or even damage satellites. But Earth’s atmosphere protects us from truly harmful effects, and we orbit the Sun at a respectable distance, out of reach of the flares themselves.
Not so for planet HIP 67522 b. A gas giant in a young star system – just 17 million years old – the planet takes only seven days to complete one orbit around its star. A “year,” in other words, lasts barely as long as a week on Earth. That places the planet perilously close to the star. Worse, the star is of a type known to flare – especially in their youth.
In this case, the proximity of the planet appears to result in fairly frequent flaring.
DetailsThe star and the planet form a powerful but likely a destructive bond. In a manner not yet fully understood, the planet hooks into the star’s magnetic field, triggering flares on the star’s surface; the flares whiplash energy back to the planet. Combined with other high-energy radiation from the star, the flare-induced heating appears to have increased the already steep inflation of the planet’s atmosphere, giving HIP 67522 b a diameter comparable to our own planet Jupiter despite having just 5% of Jupiter’s mass.
This might well mean that the planet won’t stay in the Jupiter size-range for long. One effect of being continually pummeled with intense radiation could be a loss of atmosphere over time. In another 100 million years, that could shrink the planet to the status of a “hot Neptune,” or, with a more radical loss of atmosphere, even a “sub-Neptune,” a planet type smaller than Neptune that is common in our galaxy but lacking in our solar system.
Fun FactsFour hundred light-years is much too far away to capture images of stellar flares striking orbiting planets. So how did a science team led by Netherlands astronomer Ekaterina Ilin discover this was happening? They used space-borne telescopes, NASA’s TESS (Transiting Exoplanet Survey Satellite) and the European Space Agency’s CHEOPS (CHaracterising ExoPlanets Telescope), to track flares on the star, and also to trace the path of the planet’s orbit.
Both telescopes use the “transit” method to determine the diameter of a planet and the time it takes to orbit its star. The transit is a kind of mini-eclipse. As the planet crosses the star’s face, it causes a tiny dip in starlight reaching the telescope. But the same observation method also picks up sudden stabs of brightness from the star – the stellar flares. Combining these observations over five years’ time and applying rigorous statistical analysis, the science team revealed that the planet is zapped with six times more flares than it would be without that magnetic connection.
The DiscoverersA team of scientists from the Netherlands, Germany, Sweden, and Switzerland, led by Ekaterina Ilin of the Netherlands Institute for Radio Astronomy, published their paper on the planet-star connection, “Close-in planet induces flares on its host star,” in the journal Nature on July 2, 2025.
Keep Exploring Discover More Topics From NASA
Search for Life
Stars
Galaxies
Black Holes
Explore This Section
- Exoplanets Home
- Exoplanets Overview
- Search for Life
- Discoveries
- Immersive
- News
- Resources
- More
Near-Earth Asteroids as of July 2025
1 min read
Near-Earth Asteroids as of July 2025Each month, NASA’s Planetary Defense Coordination Office releases a monthly update featuring the most recent figures on NASA’s planetary defense efforts, near-Earth object close approaches, and other timely facts about comets and asteroids that could pose an impact hazard with Earth. Here is what we’ve found so far.
Updated: July 2, 2025
Share Details Last Updated Jul 02, 2025 Related Terms Explore More 11 min read 3 Years of Science: 10 Cosmic Surprises from NASA’s Webb TelescopeArticle
1 hour ago
6 min read NASA Missions Help Explain, Predict Severity of Solar Storms
Article
21 hours ago
7 min read A New Alloy is Enabling Ultra-Stable Structures Needed for Exoplanet Discovery
Article
1 day ago
3 Years of Science: 10 Cosmic Surprises from NASA’s Webb Telescope
- Webb
- News
- Overview
- Science
- Observatory
- Multimedia
- Team
- More
Since July 2022, NASA’s James Webb Space Telescope has been unwaveringly focused on our universe. With its unprecedented power to detect and analyze otherwise invisible infrared light, Webb is making observations that were once impossible, changing our view of the cosmos from the most distant galaxies to our own solar system.
Webb was built with the promise of revolutionizing astronomy, of rewriting the textbooks. And by any measure, it has more than lived up to the hype — exceeding expectations to a degree that scientists had not dared imagine. Since science operations began, Webb has completed more than 860 scientific programs, with one-quarter of its time dedicated to imaging and three-quarters to spectroscopy. In just three years, it has collected nearly 550 terabytes of data, yielding more than 1,600 research papers, with intriguing results too numerous to list and a host of new questions to answer.
Here are just a few noteworthy examples.
1. The universe evolved significantly faster than we previously thought.Webb was specifically designed to observe “cosmic dawn,” a time during the first billion years of the universe when the first stars and galaxies were forming. What we expected to see were a few faint galaxies, hints of what would become the galaxies we see nearby.
Instead, Webb has revealed surprisingly bright galaxies that developed within 300 million years of the big bang; galaxies with black holes that seem far too massive for their age; and an infant Milky Way-type galaxy that existed when the universe was just 600 million years old. Webb has observed galaxies that already “turned off” and stopped forming stars within a billion years of the big bang, as well as those that developed quickly into modern-looking “grand design” spirals within 1.5 billion years.
Hundreds of millions of years might not seem quick for a growth spurt, but keep in mind that the universe formed in the big bang roughly 13.8 billion years ago. If you were to cram all of cosmic time into one year, the most distant of these galaxies would have matured within the first couple of weeks, rapidly forming multiple generations of stars and enriching the universe with the elements we see today.
Max Resolution Version of JADES Deep Field
Image: JADES deep field The JADES Deep Field uses observations taken by NASA’s James Webb Space Telescope (JWST) as part of the JADES (JWST Advanced Deep Extragalactic Survey) program. A team of astronomers studying JADES data identified about 80 objects that changed in brightness over time. Most of these objects, known as transients, are the result of exploding stars or supernovae.
Prior to this survey, only a handful of supernovae had been found above a redshift of 2, which corresponds to when the universe was only 3.3 billion years old — just 25% of its current age. The JADES sample contains many supernovae that exploded even further in the past, when the universe was less than 2 billion years old. It includes the farthest one ever spectroscopically confirmed, at a redshift of 3.6. Its progenitor star exploded when the universe was only 1.8 billion years old.
NASA, ESA, CSA, STScI, JADES Collaboration 2. Deep space is scattered with enigmatic “Little Red Dots.”Webb has revealed a new type of galaxy: a distant population of mysteriously compact, bright, red galaxies dubbed Little Red Dots. What makes Little Red Dots so bright and so red? Are they lit up by dense groupings of unusually bright stars or by gas spiraling into a supermassive black hole, or both? And whatever happened to them? Little Red Dots seem to have appeared in the universe around 600 million years after the big bang (13.2 billion years ago), and rapidly declined in number less than a billion years later. Did they evolve into something else? If so, how? Webb is probing Little Red Dots in more detail to answer these questions.
3. Pulsating stars and a triply lensed supernova are further evidence that the “Hubble Tension” is real.How fast is the universe expanding? It’s hard to say because different ways of calculating the current expansion rate yield different results — a dilemma known as the Hubble Tension. Are these differences just a result of measurement errors, or is there something weird going on in the universe? So far, Webb data indicates that the Hubble Tension is not caused by measurement errors. Webb was able to distinguish pulsating stars from nearby stars in a crowded field, ensuring that the measurements weren’t contaminated by extra light. Webb also discovered a distant, gravitationally lensed supernova whose image appears in three different locations and at three different times during its explosion. Calculating the expansion rate based on the brightness of the supernova at these three different times provides an independent check on measurements made using other techniques. Until the matter of the Hubble Tension is settled, Webb will continue measuring different objects and exploring new methods.
4. Webb has found surprisingly rich and varied atmospheres on gas giants orbiting distant stars.While NASA’s Hubble Space Telescope made the first detection of gases in the atmosphere of a gas giant exoplanet (a planet outside our solar system), Webb has taken studies to an entirely new level. Webb has revealed a rich cocktail of chemicals, including hydrogen sulfide, ammonia, carbon dioxide, methane, and sulfur dioxide — none of which had been clearly detected in an atmosphere outside our solar system before. Webb has also been able to examine exotic climates of gas giants as never before, detecting flakes of silica “snow” in the skies of the puffy, searing-hot gas giant WASP-17 b, for example, and measuring differences in temperature and cloud cover between the permanent morning and evening skies of WASP-39 b.
Image: Spectrum of WASP-107 b A transmission spectrum of the “warm Neptune” exoplanet WASP-107 b captured by NASA’s Hubble and Webb space telescopes, shows clear evidence for water, carbon dioxide, carbon monoxide, methane, sulfur dioxide, and ammonia in the planet’s atmosphere. These measurements allowed researchers to estimate the interior temperature and mass of the core of the planet, as well as understand the chemistry and dynamics of the atmosphere. NASA, ESA, CSA, Ralf Crawford (STScI) 5. A rocky planet 40 light-years from Earth may have an atmosphere fed by gas bubbling up from its lava-covered surface.Detecting, let alone analyzing, a thin layer of gas surrounding a small rocky planet is no easy feat, but Webb’s extraordinary ability to measure extremely subtle changes in the brightness of infrared light makes it possible. So far, Webb has been able to rule out significant atmosphere on a number of rocky planets, and has found tantalizing signs of carbon monoxide or carbon dioxide on 55 Cancri e, a lava world that orbits a Sun-like star. With findings like these, Webb is laying the groundwork for NASA’s future Habitable Worlds Observatory, which will be the first mission purpose-built to directly image and search for life on Earth-like planets around Sun-like stars.
6. Webb exposes the skeletal structure of nearby spiral galaxies in mesmerizing detail.We already knew that galaxies are collections of stars, planets, dust, gas, dark matter, and black holes: cosmic cities where stars form, live, die, and are recycled into the next generation. But we had never been able to see the structure of a galaxy and the interactions between stars and their environment in such detail. Webb’s infrared vision reveals filaments of dust that trace the spiral arms, old star clusters that make up galactic cores, newly forming stars still encased in dense cocoons of glowing dust and gas, and clusters of hot young stars carving enormous cavities in the dust. It also elucidates how stellar winds and explosions actively reshape their galactic homes.
Image: PHANGS Phantom Galaxy (M74/NGC 628) A near- to mid-infrared image from NASA’s James Webb Space Telescope highlights details in the complex structure of a nearby galaxy that are invisible to other telescopes. The image of NGC 628, also known as the Phantom Galaxy, shows spiral arms with lanes of warm dust (represented in red), knots of glowing gas (orange-yellow), and giant bubbles (black) carved by hot, young stars. The dust-free core of the galaxy is filled with older, cooler stars (blue). NASA, ESA, CSA, STScI, Janice Lee (STScI), Thomas Williams (Oxford), PHANGS team 7. It can be hard to tell the difference between a brown dwarf and a rogue planet.Brown dwarfs form like stars, but are not dense or hot enough to fuse hydrogen in their cores like stars do. Rogue planets form like other planets, but have been ejected from their system and no longer orbit a star. Webb has spotted hundreds of brown-dwarf-like objects in the Milky Way, and has even detected some candidates in a neighboring galaxy. But some of these objects are so small — just a few times the mass of Jupiter — that it is hard to figure out how they formed. Are they free-floating gas giant planets instead? What is the least amount of material needed to form a brown dwarf or a star? We’re not sure yet, but thanks to three years of Webb observations, we now know there is a continuum of objects from planets to brown dwarfs to stars.
8. Some planets might be able to survive the death of their star.When a star like our Sun dies, it swells up to form a red giant large enough to engulf nearby planets. It then sheds its outer layers, leaving behind a super-hot core known as a white dwarf. Is there a safe distance that planets can survive this process? Webb might have found some planets orbiting white dwarfs. If these candidates are confirmed, it would mean that it is possible for planets to survive the death of their star, remaining in orbit around the slowly cooling stellar ember.
9. Saturn’s water supply is fed by a giant fountain of vapor spewing from Enceladus.Among the icy “ocean worlds” of our solar system, Saturn’s moon Enceladus might be the most intriguing. NASA’s Cassini mission first detected water plumes coming out of its southern pole. But only Webb could reveal the plume’s true scale as a vast cloud spanning more than 6,000 miles, about 20 times wider than Enceladus itself. This water spreads out into a donut-shaped torus encircling Saturn beyond the rings that are visible in backyard telescopes. While a fraction of the water stays in that ring, the majority of it spreads throughout the Saturnian system, even raining down onto the planet itself. Webb’s unique observations of rings, auroras, clouds, winds, ices, gases, and other materials and phenomena in the solar system are helping us better understand what our cosmic neighborhood is made of and how it has changed over time.
Video: Water plume and torus from Enceladus A combination of images and spectra captured by NASA’s James Webb Space Telescope show a giant plume of water jetting out from the south pole of Saturn’s moon Enceladus, creating a donut-shaped ring of water around the planet.Credit: NASA, ESA, CSA, G. Villanueva (NASA’s Goddard Space Flight Center), A. Pagan (STScI), L. Hustak (STScI) 10. Webb can size up asteroids that may be headed for Earth.
In 2024 astronomers discovered an asteroid that, based on preliminary calculations, had a chance of hitting Earth. Such potentially hazardous asteroids become an immediate focus of attention, and Webb was uniquely able to measure the object, which turned out to be the size of a 15-story building. While this particular asteroid is no longer considered a threat to Earth, the study demonstrated Webb’s ability to assess the hazard.
Webb also provided support for NASA’s Double Asteroid Redirection Test (DART) mission, which deliberately smashed into the Didymos binary asteroid system, showing that a planned impact could deflect an asteroid on a collision course with Earth. Both Webb and Hubble observed the impact, serving witness to the resulting spray of material that was ejected. Webb’s spectroscopic observations of the system confirmed that the composition of the asteroids is probably typical of those that could threaten Earth.
—-
In just three years of operations, Webb has brought the distant universe into focus, revealing unexpectedly bright and numerous galaxies. It has unveiled new stars in their dusty cocoons, remains of exploded stars, and skeletons of entire galaxies. It has studied weather on gas giants, and hunted for atmospheres on rocky planets. And it has provided new insights into the residents of our own solar system.
But this is only the beginning. Engineers estimate that Webb has enough fuel to continue observing for at least 20 more years, giving us the opportunity to answer additional questions, pursue new mysteries, and put together more pieces of the cosmic puzzle.
For example: What were the very first stars like? Did stars form differently in the early universe? Do we even know how galaxies form? How do stars, dust, and supermassive black holes affect each other? What can merging galaxy clusters tell us about the nature of dark matter? How do collisions, bursts of stellar radiation, and migration of icy pebbles affect planet-forming disks? Can atmospheres survive on rocky worlds orbiting active red dwarf stars? Is Uranus’s moon Ariel an ocean world?
As with any scientific endeavor, every answer raises more questions, and Webb has shown that its investigative power is unmatched. Demand for observing time on Webb is at an all-time high, greater than any other telescope in history, on the ground or in space. What new findings await?
By Dr. Macarena Garcia Marin and Margaret W. Carruthers, Space Telescope Science Institute, Baltimore, Maryland
Media ContactsLaura Betz – laura.e.betz@nasa.gov
NASA’s Goddard Space Flight Center, Greenbelt, Md.
Christine Pulliam – cpulliam@stsci.edu
Space Telescope Science Institute, Baltimore, Md.
Webb is the premier observatory of the next decade, serving thousands of astronomers worldwide. It studies every phase in the…
Galaxies
Exoplanets
Universe
Share Details Last Updated Jul 02, 2025 Editor Marty McCoy Contact Laura Betz laura.e.betz@nasa.gov Related Terms
NASA Stennis Engineer Takes Pride in Test Support Work
As a controls engineer at NASA’s Stennis Space Center near Bay St. Louis, Mississippi, Dwayne Lavigne does not just fix problems – he helps put pieces together at America’s largest rocket propulsion test site.
“There are a lot of interesting problems to solve, and they are never the same,” Lavigne said. “Sometimes, it is like solving a very cool puzzle and can be pretty satisfying.”
Lavigne programs specialized computers called programmable logic controllers. They are extremely fast and reliable for automating precisely timed operations during rocket engine tests as NASA Stennis supports the agency’s Artemis missions to explore the Moon and build the foundation for the first crewed mission to Mars.
However, the system will not act unless certain parameters are met in the proper sequence. It can be a complex relationship. Sometimes, 20 or 30 things must be in the correct configuration to perform an operation, such as making a valve open or close, or turning a motor on or off.
The Picayune, Mississippi, native is responsible for establishing new signal paths between test hardware and the specialized computers.
He also develops the human machine interface for the controls. The interface is a screen graphic that test engineers use to interact with hardware.
Lavigne has worked with NASA for more than a decade. One of his proudest work moments came when he contributed to development of an automated test sequencing routine used during all RS-25 engine tests on the Fred Haise Test Stand.
“We’ve had many successful tests over the years, and each one is a point of pride,” he said.
When Lavigne works on the test stand, he works with the test hardware and interacts with technicians and engineers who perform different tasks than he does. It provides an appreciation for the group effort it takes to support NASA’s mission.
“The group of people I work with are driven to get the job done and get it done right,” he said.
In total, Lavigne has been part of the NASA Stennis federal city for 26 years. He initially worked as a contractor with the Naval Oceanographic Office as a data entry operator and with the Naval Research Laboratory as a software developer.
September marks 55 years since NASA Stennis became a federal city. NASA, and more than 50 companies, organizations, and agencies located onsite share in operating costs, which allows tenants to direct more of their funding to individual missions.
“Stennis has a talented workforce accomplishing many different tasks,” said Lavigne. “The three agencies I’ve worked with at NASA Stennis are all very focused on doing the job correctly and professionally. In all three agencies, people realize that lives could be at risk if mistakes are made or shortcuts are taken.”
Learn More About Careers at NASA Stennis Explore More 6 min read A Defining Era: NASA Stennis and Space Shuttle Main Engine Testing Article 1 month ago 4 min read NASA Stennis Releases First Open-Source Software Article 2 months ago 5 min read NASA Stennis Software is Built for Future Growth Article 2 months ago
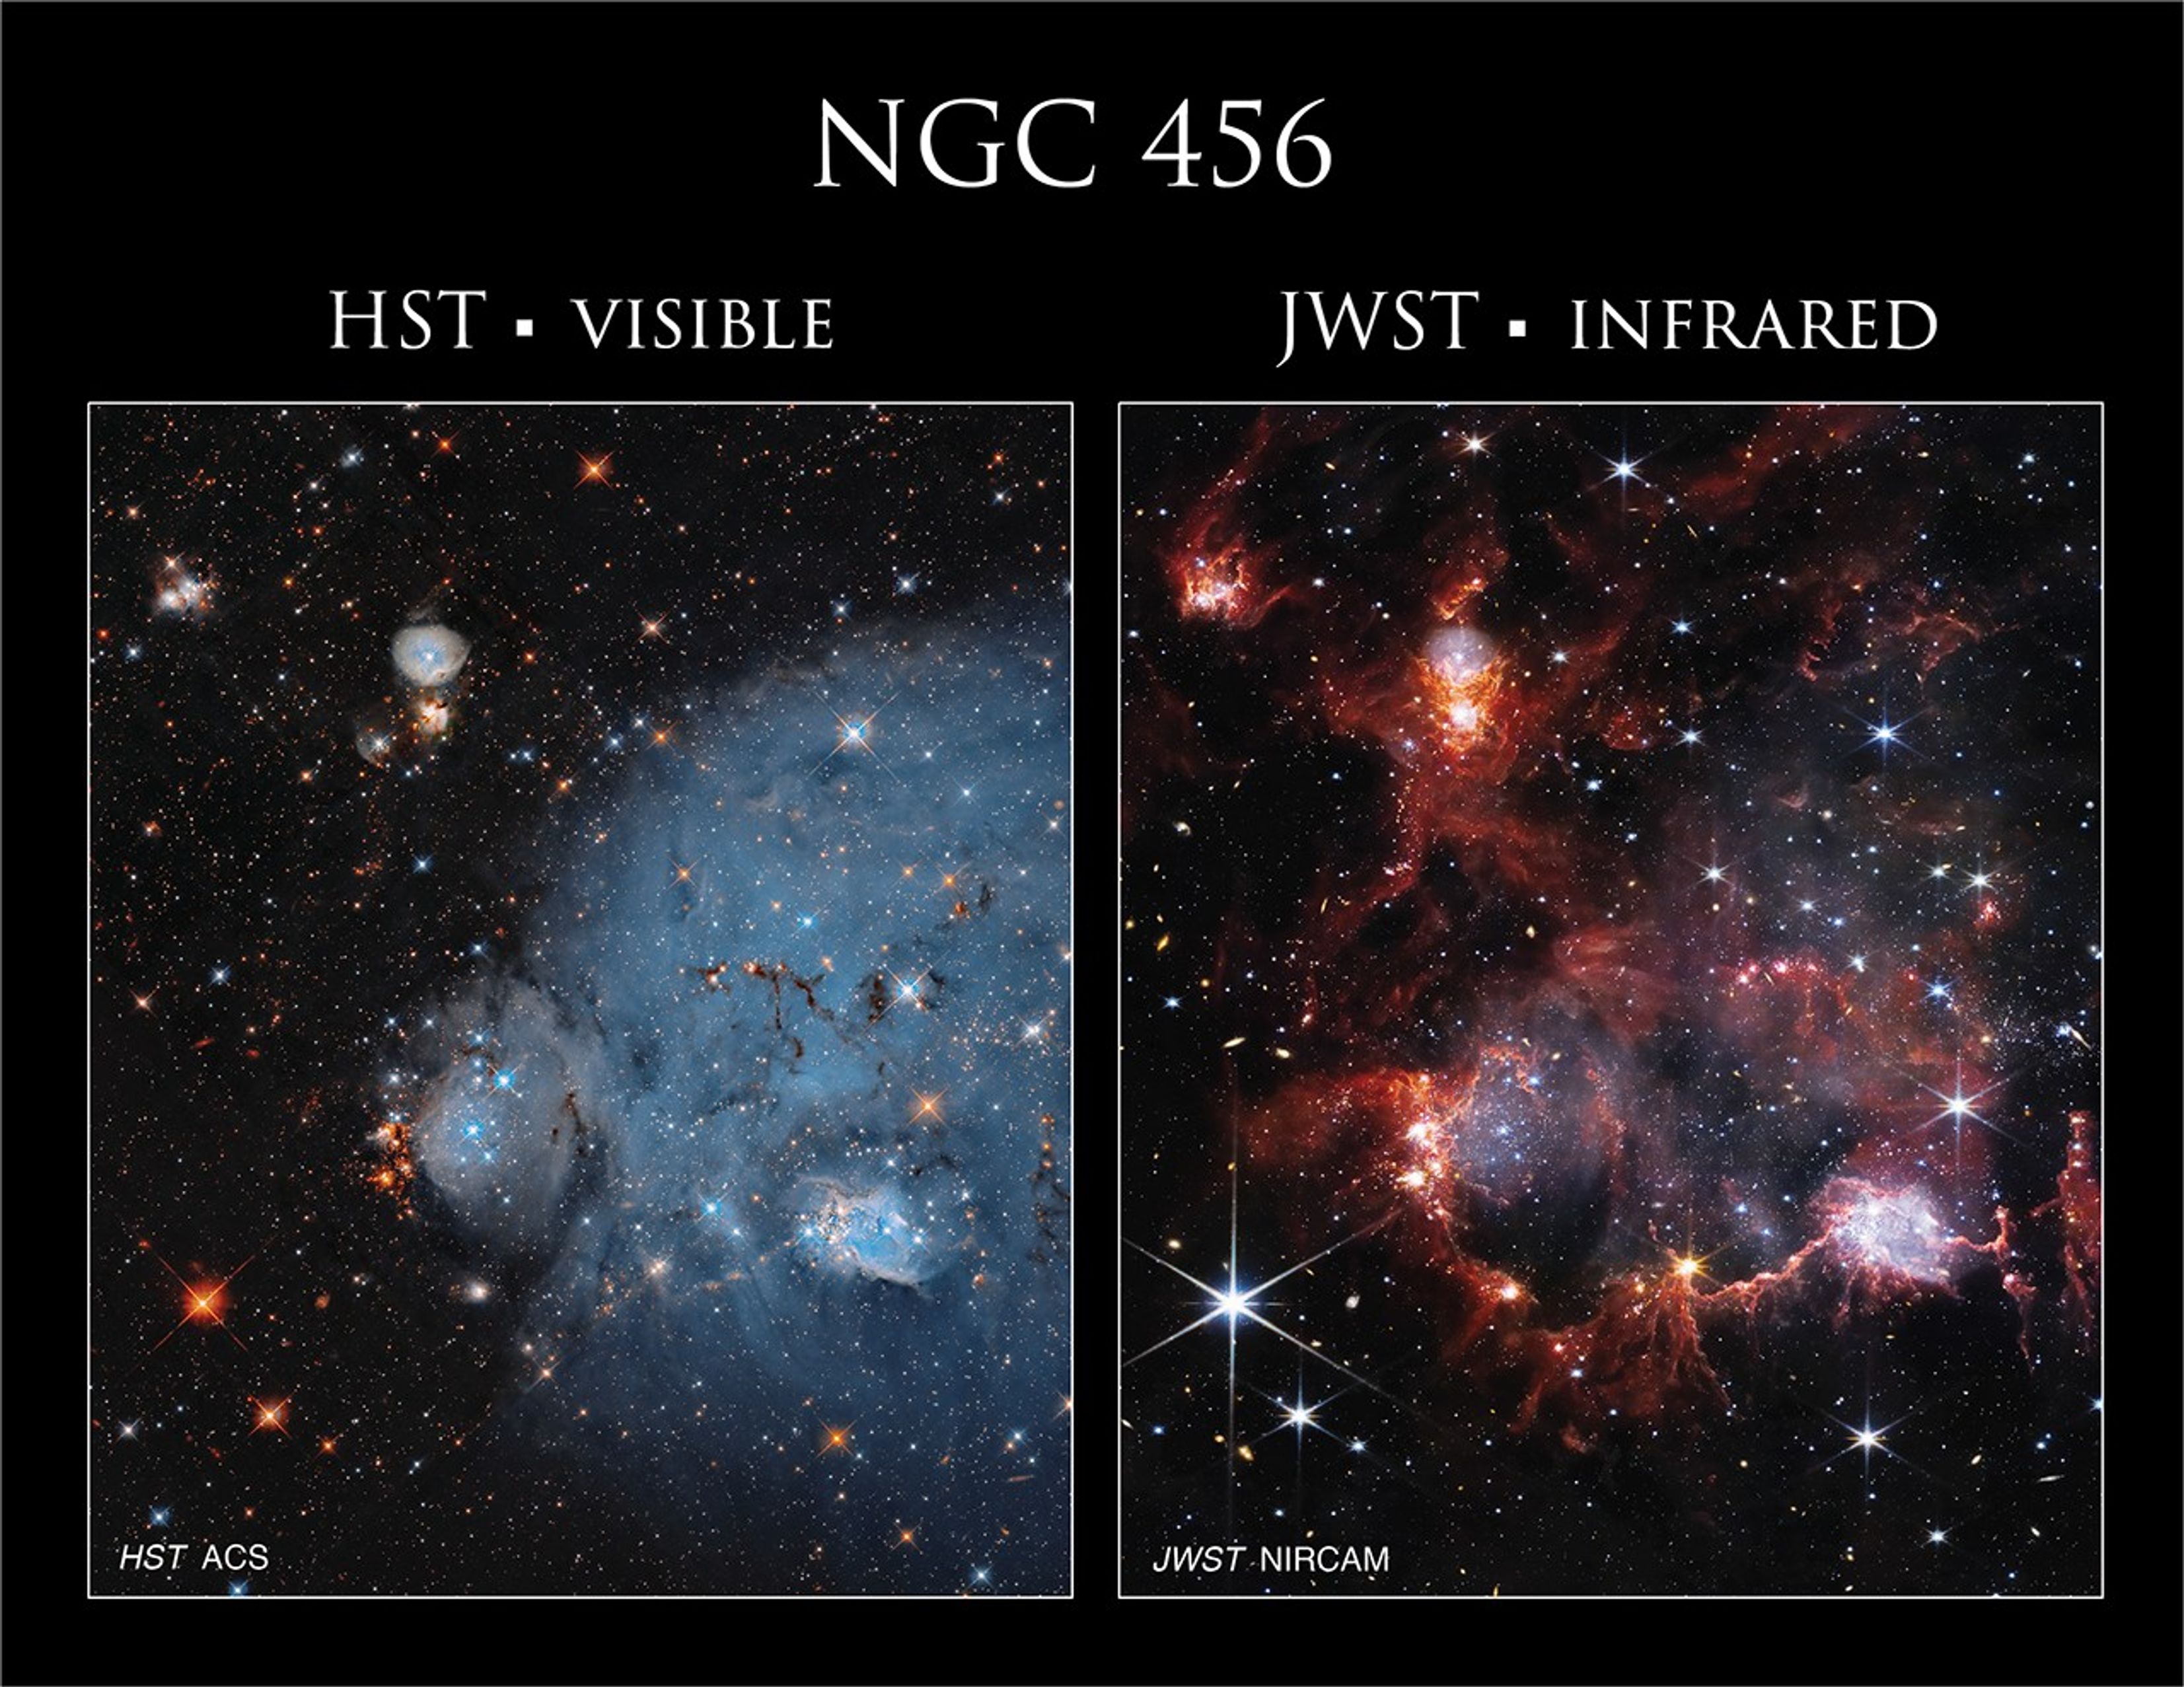
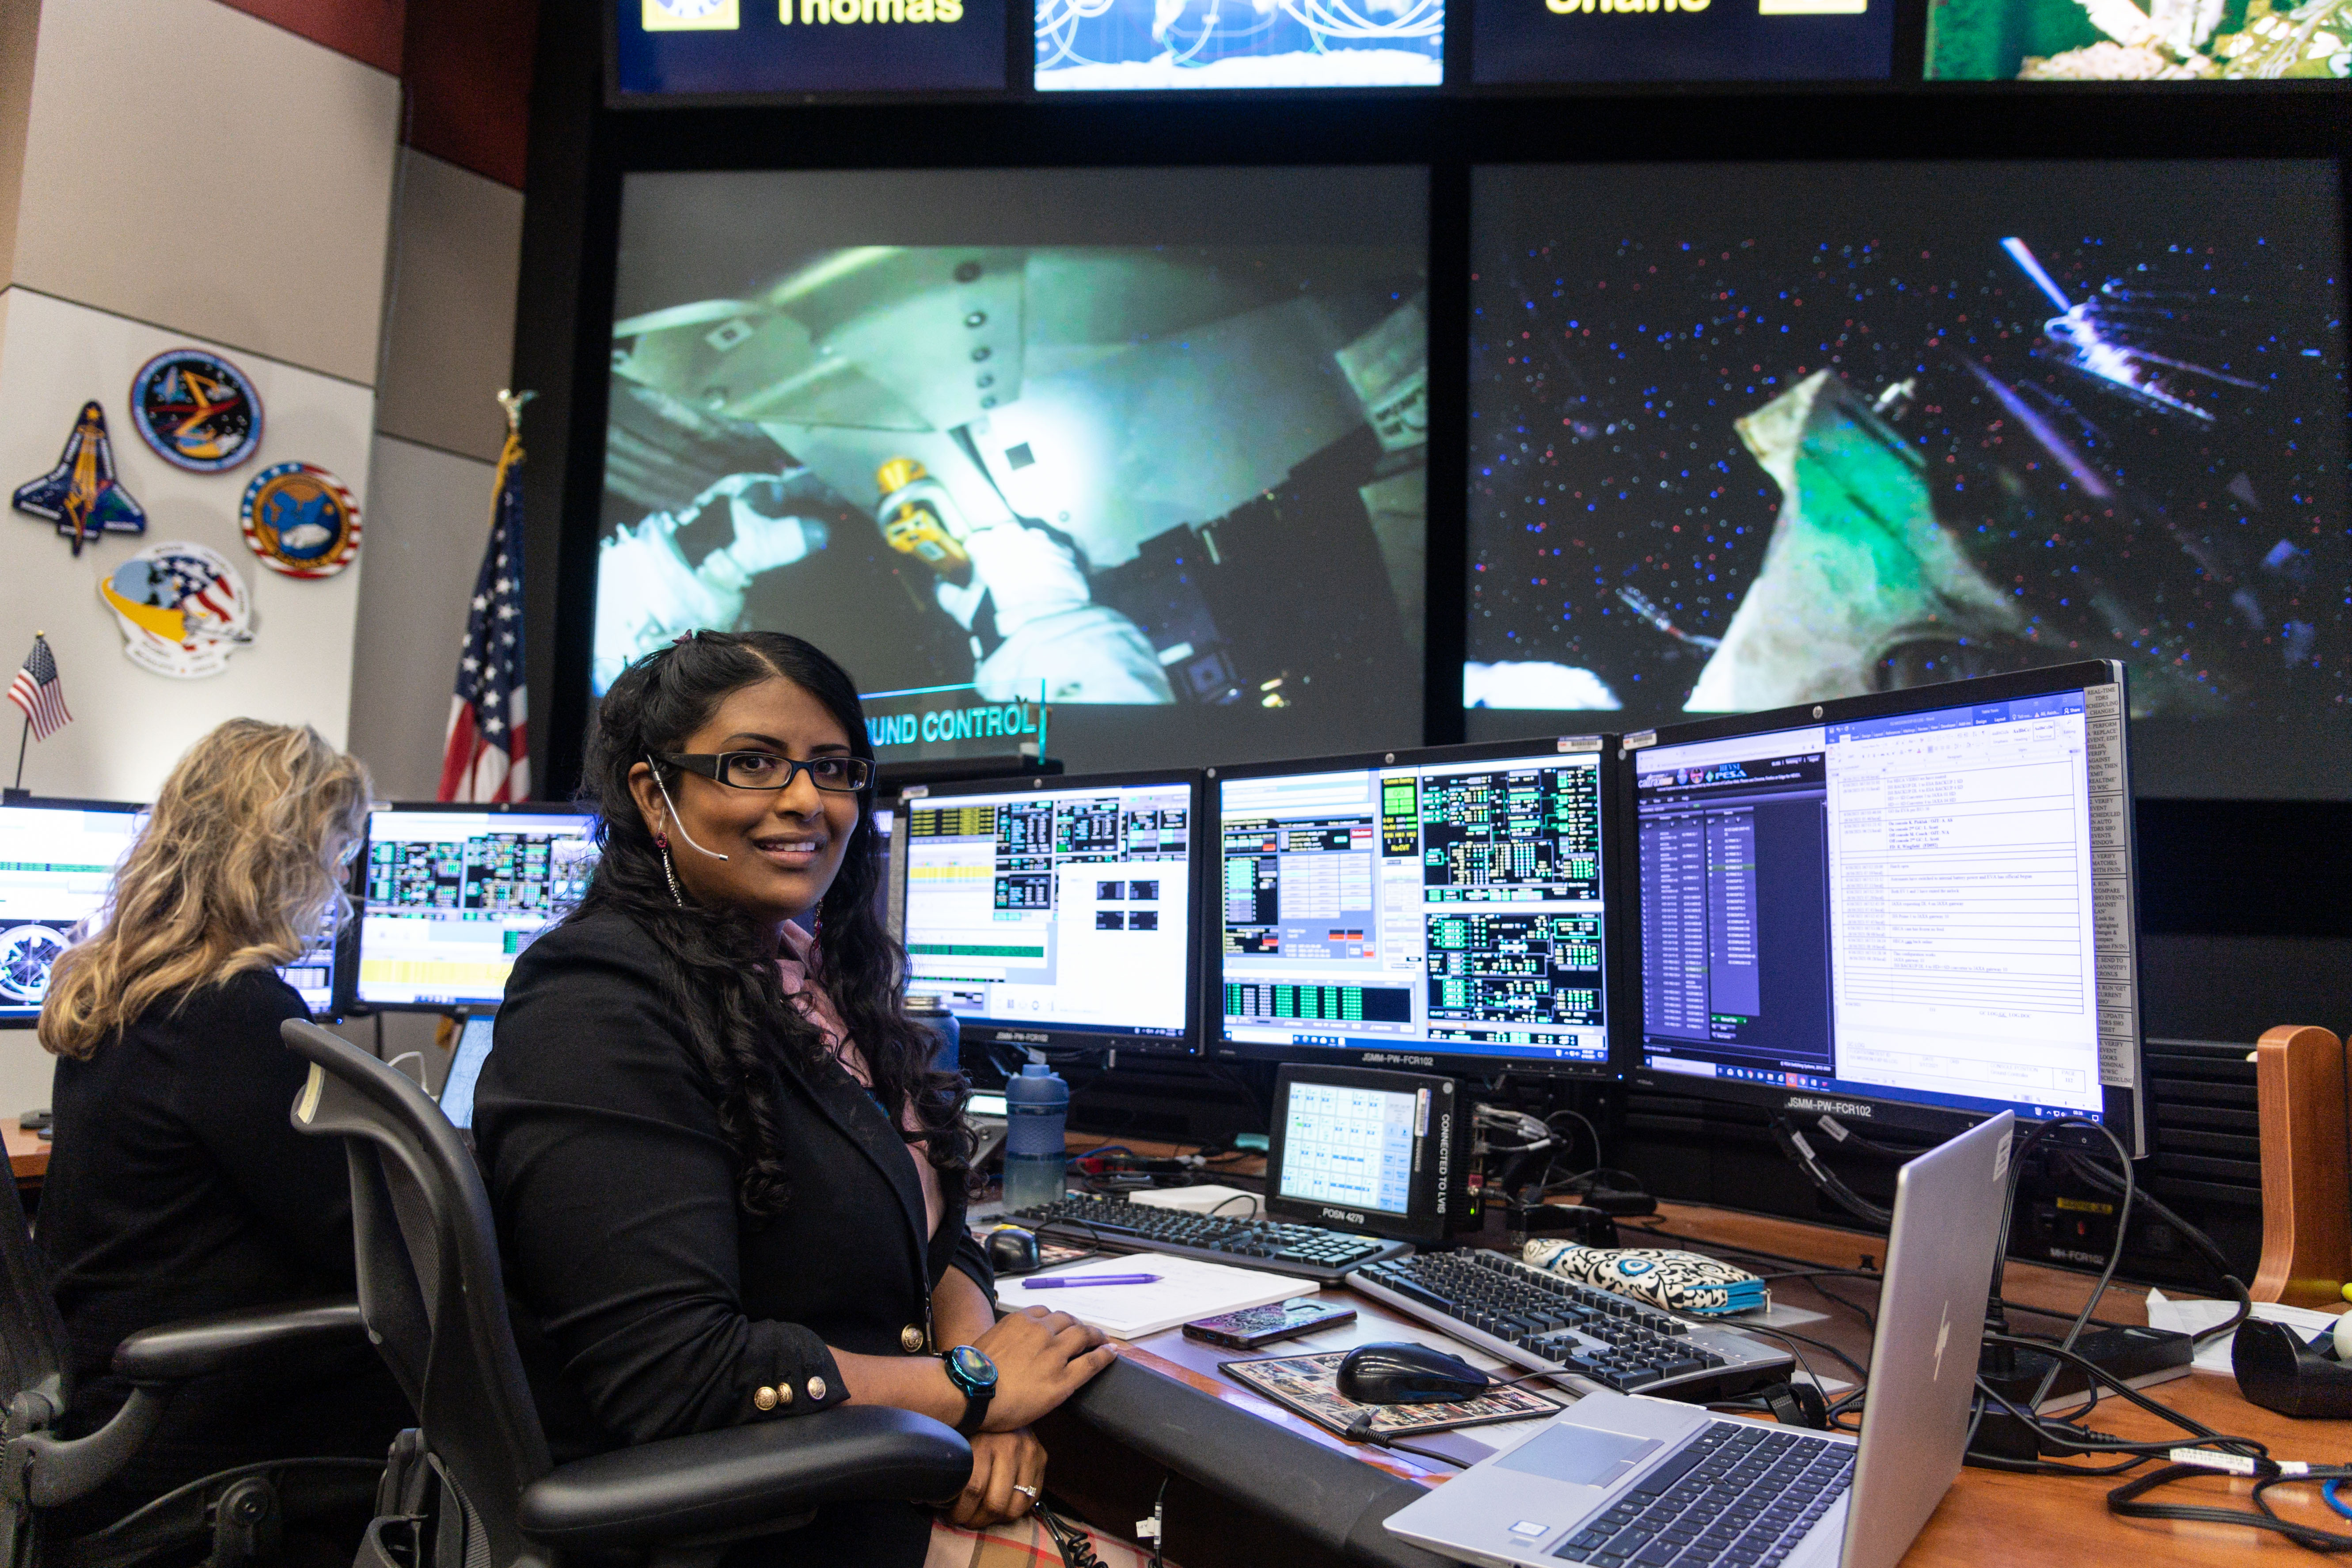
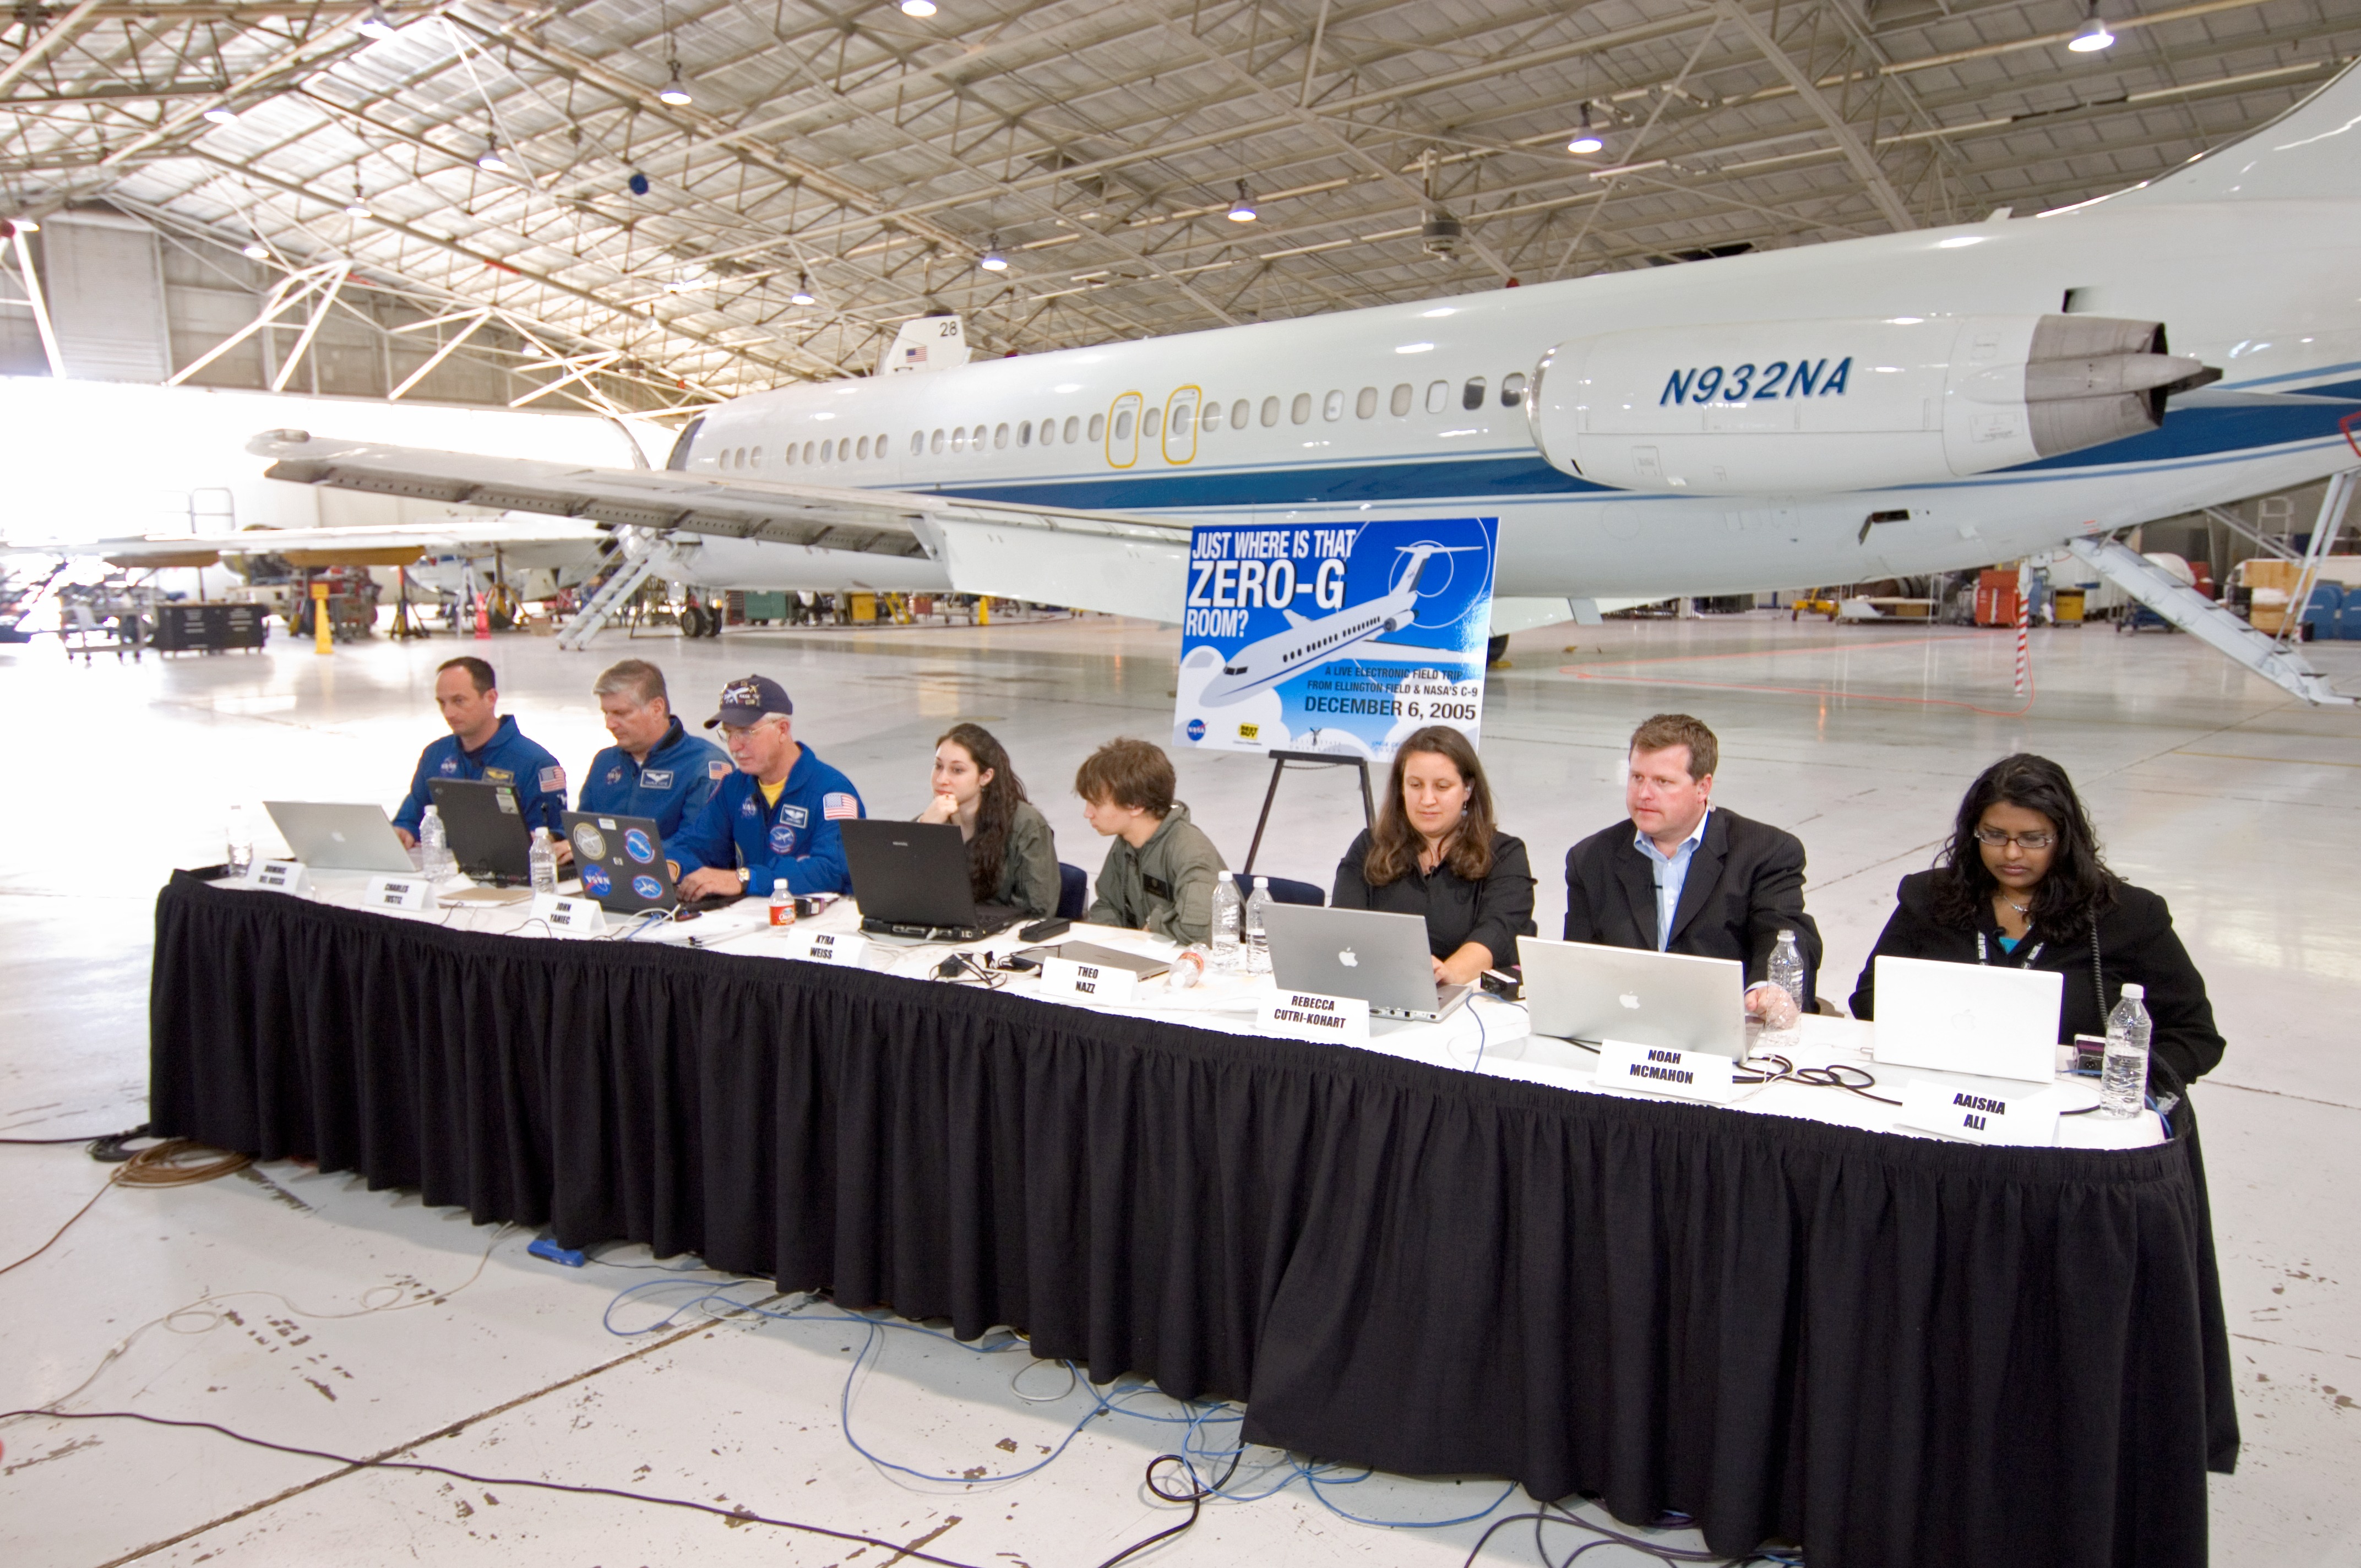
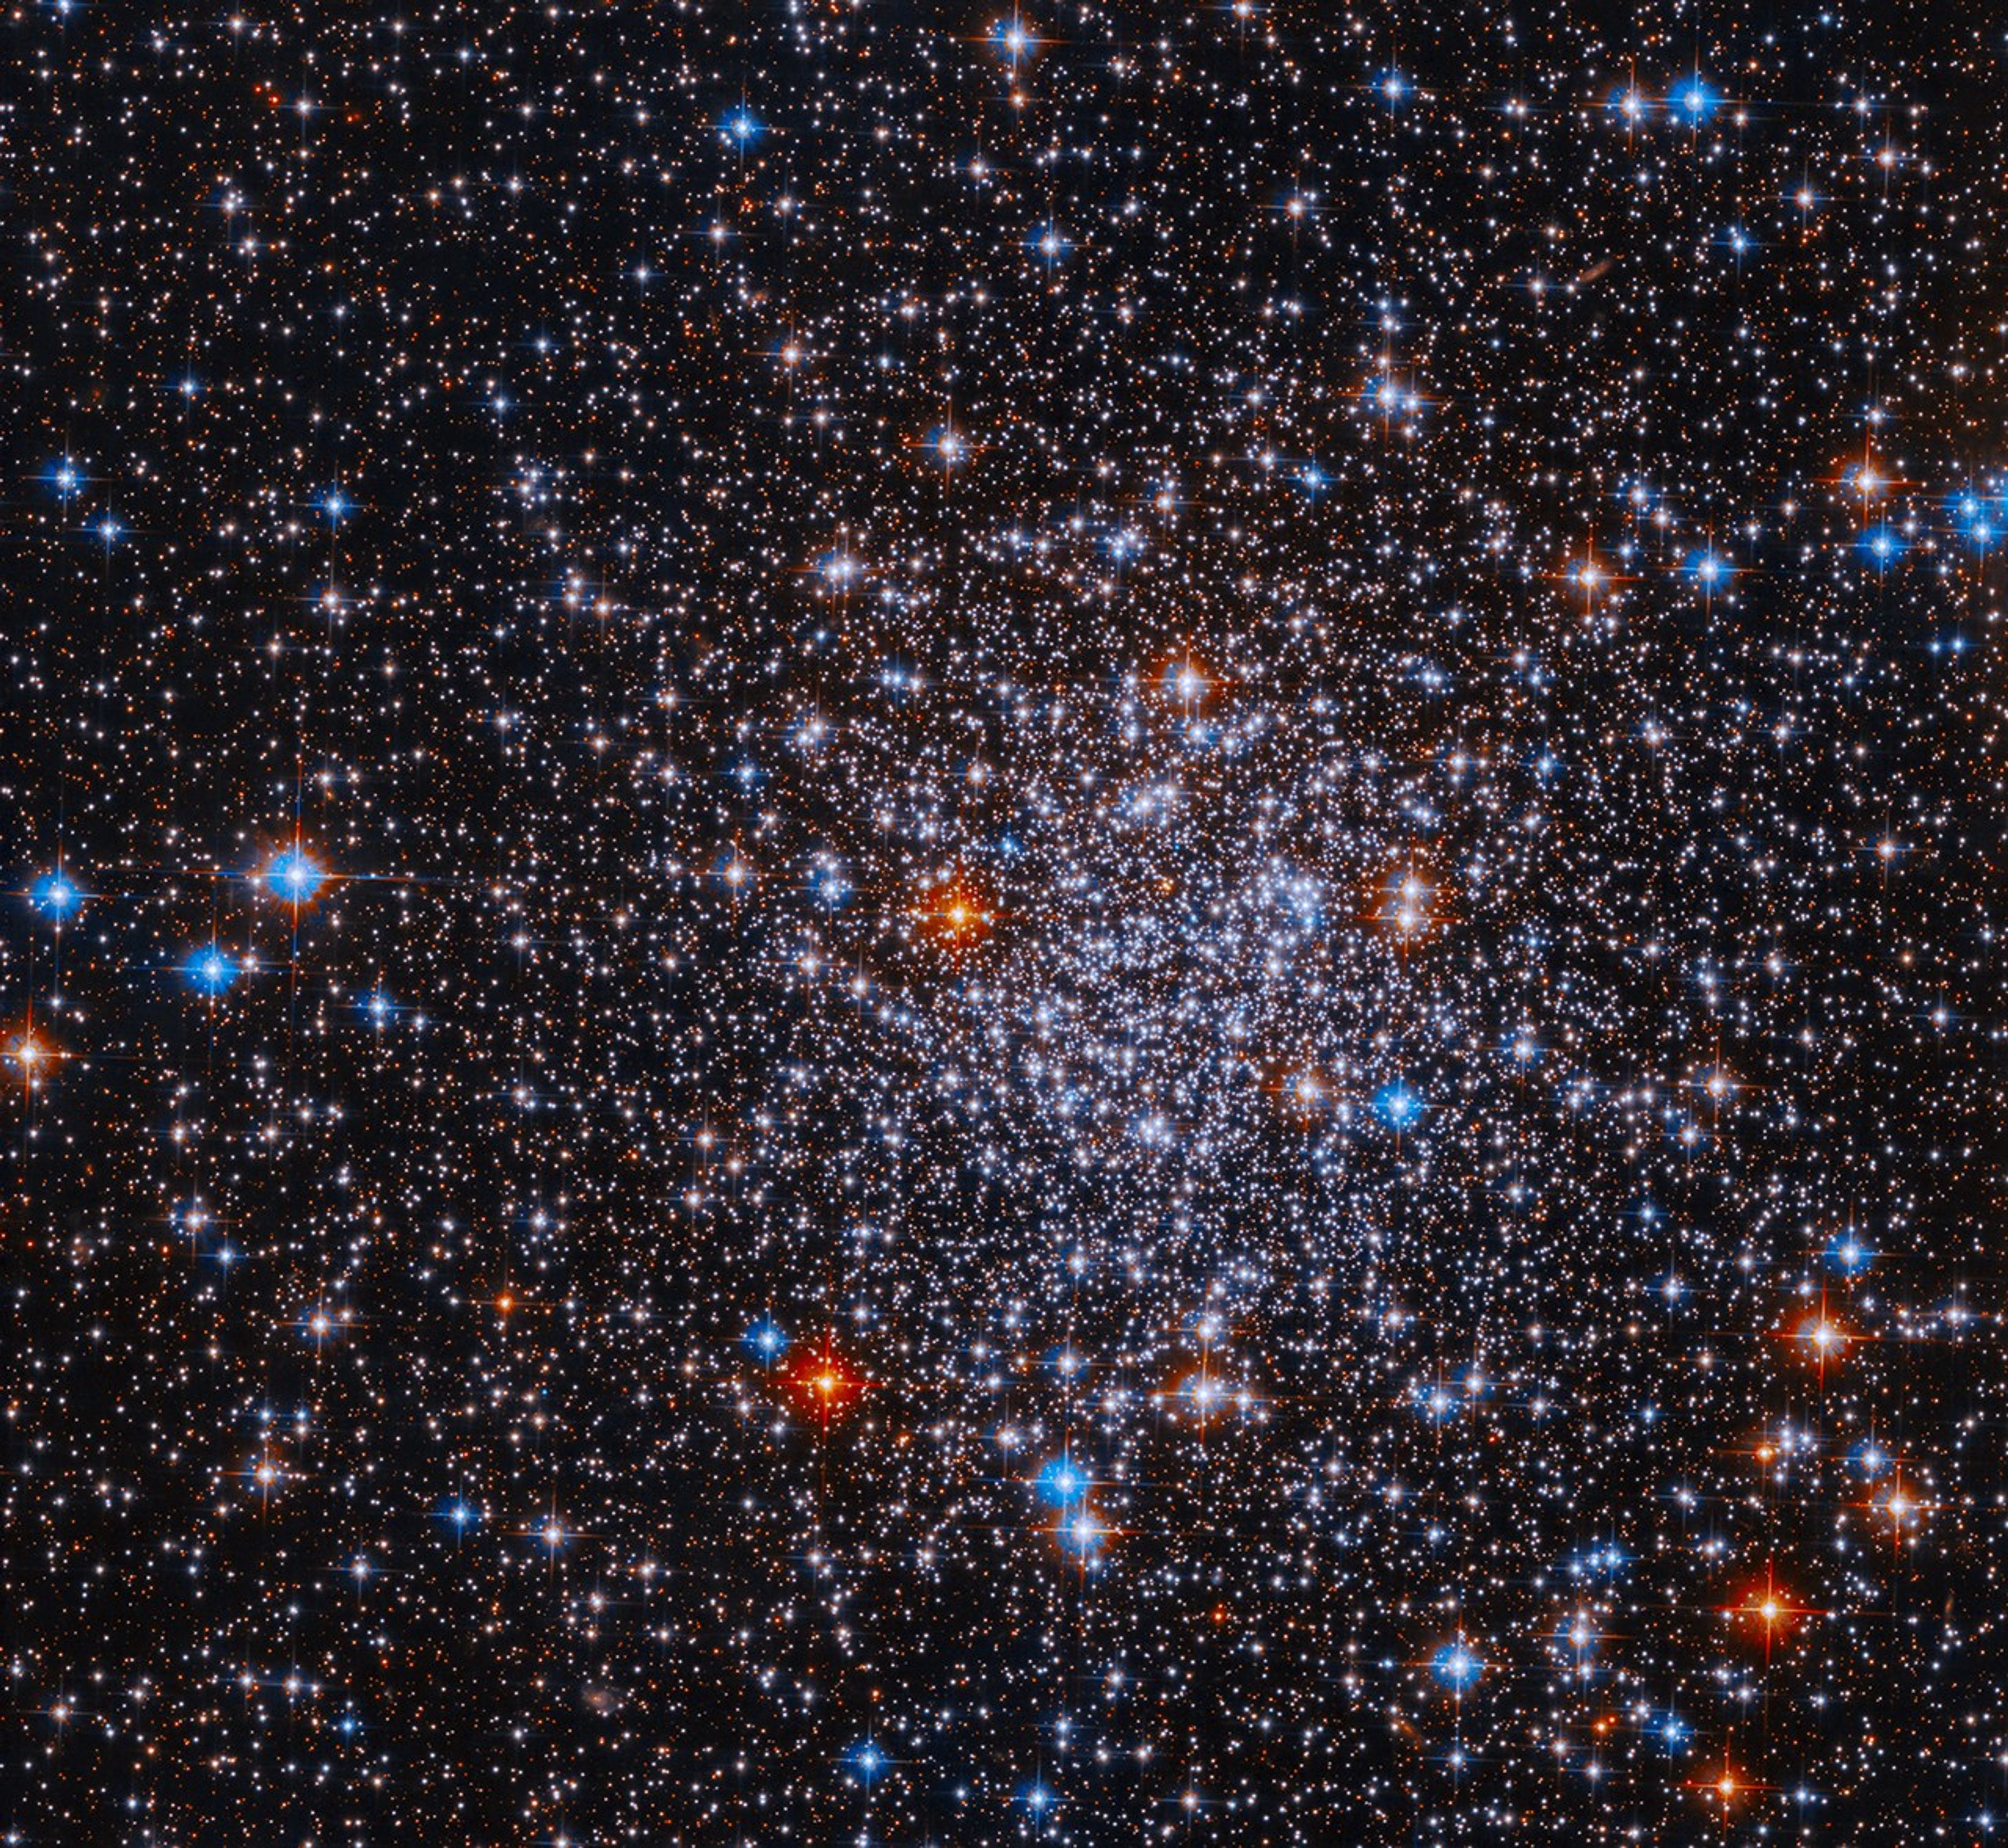
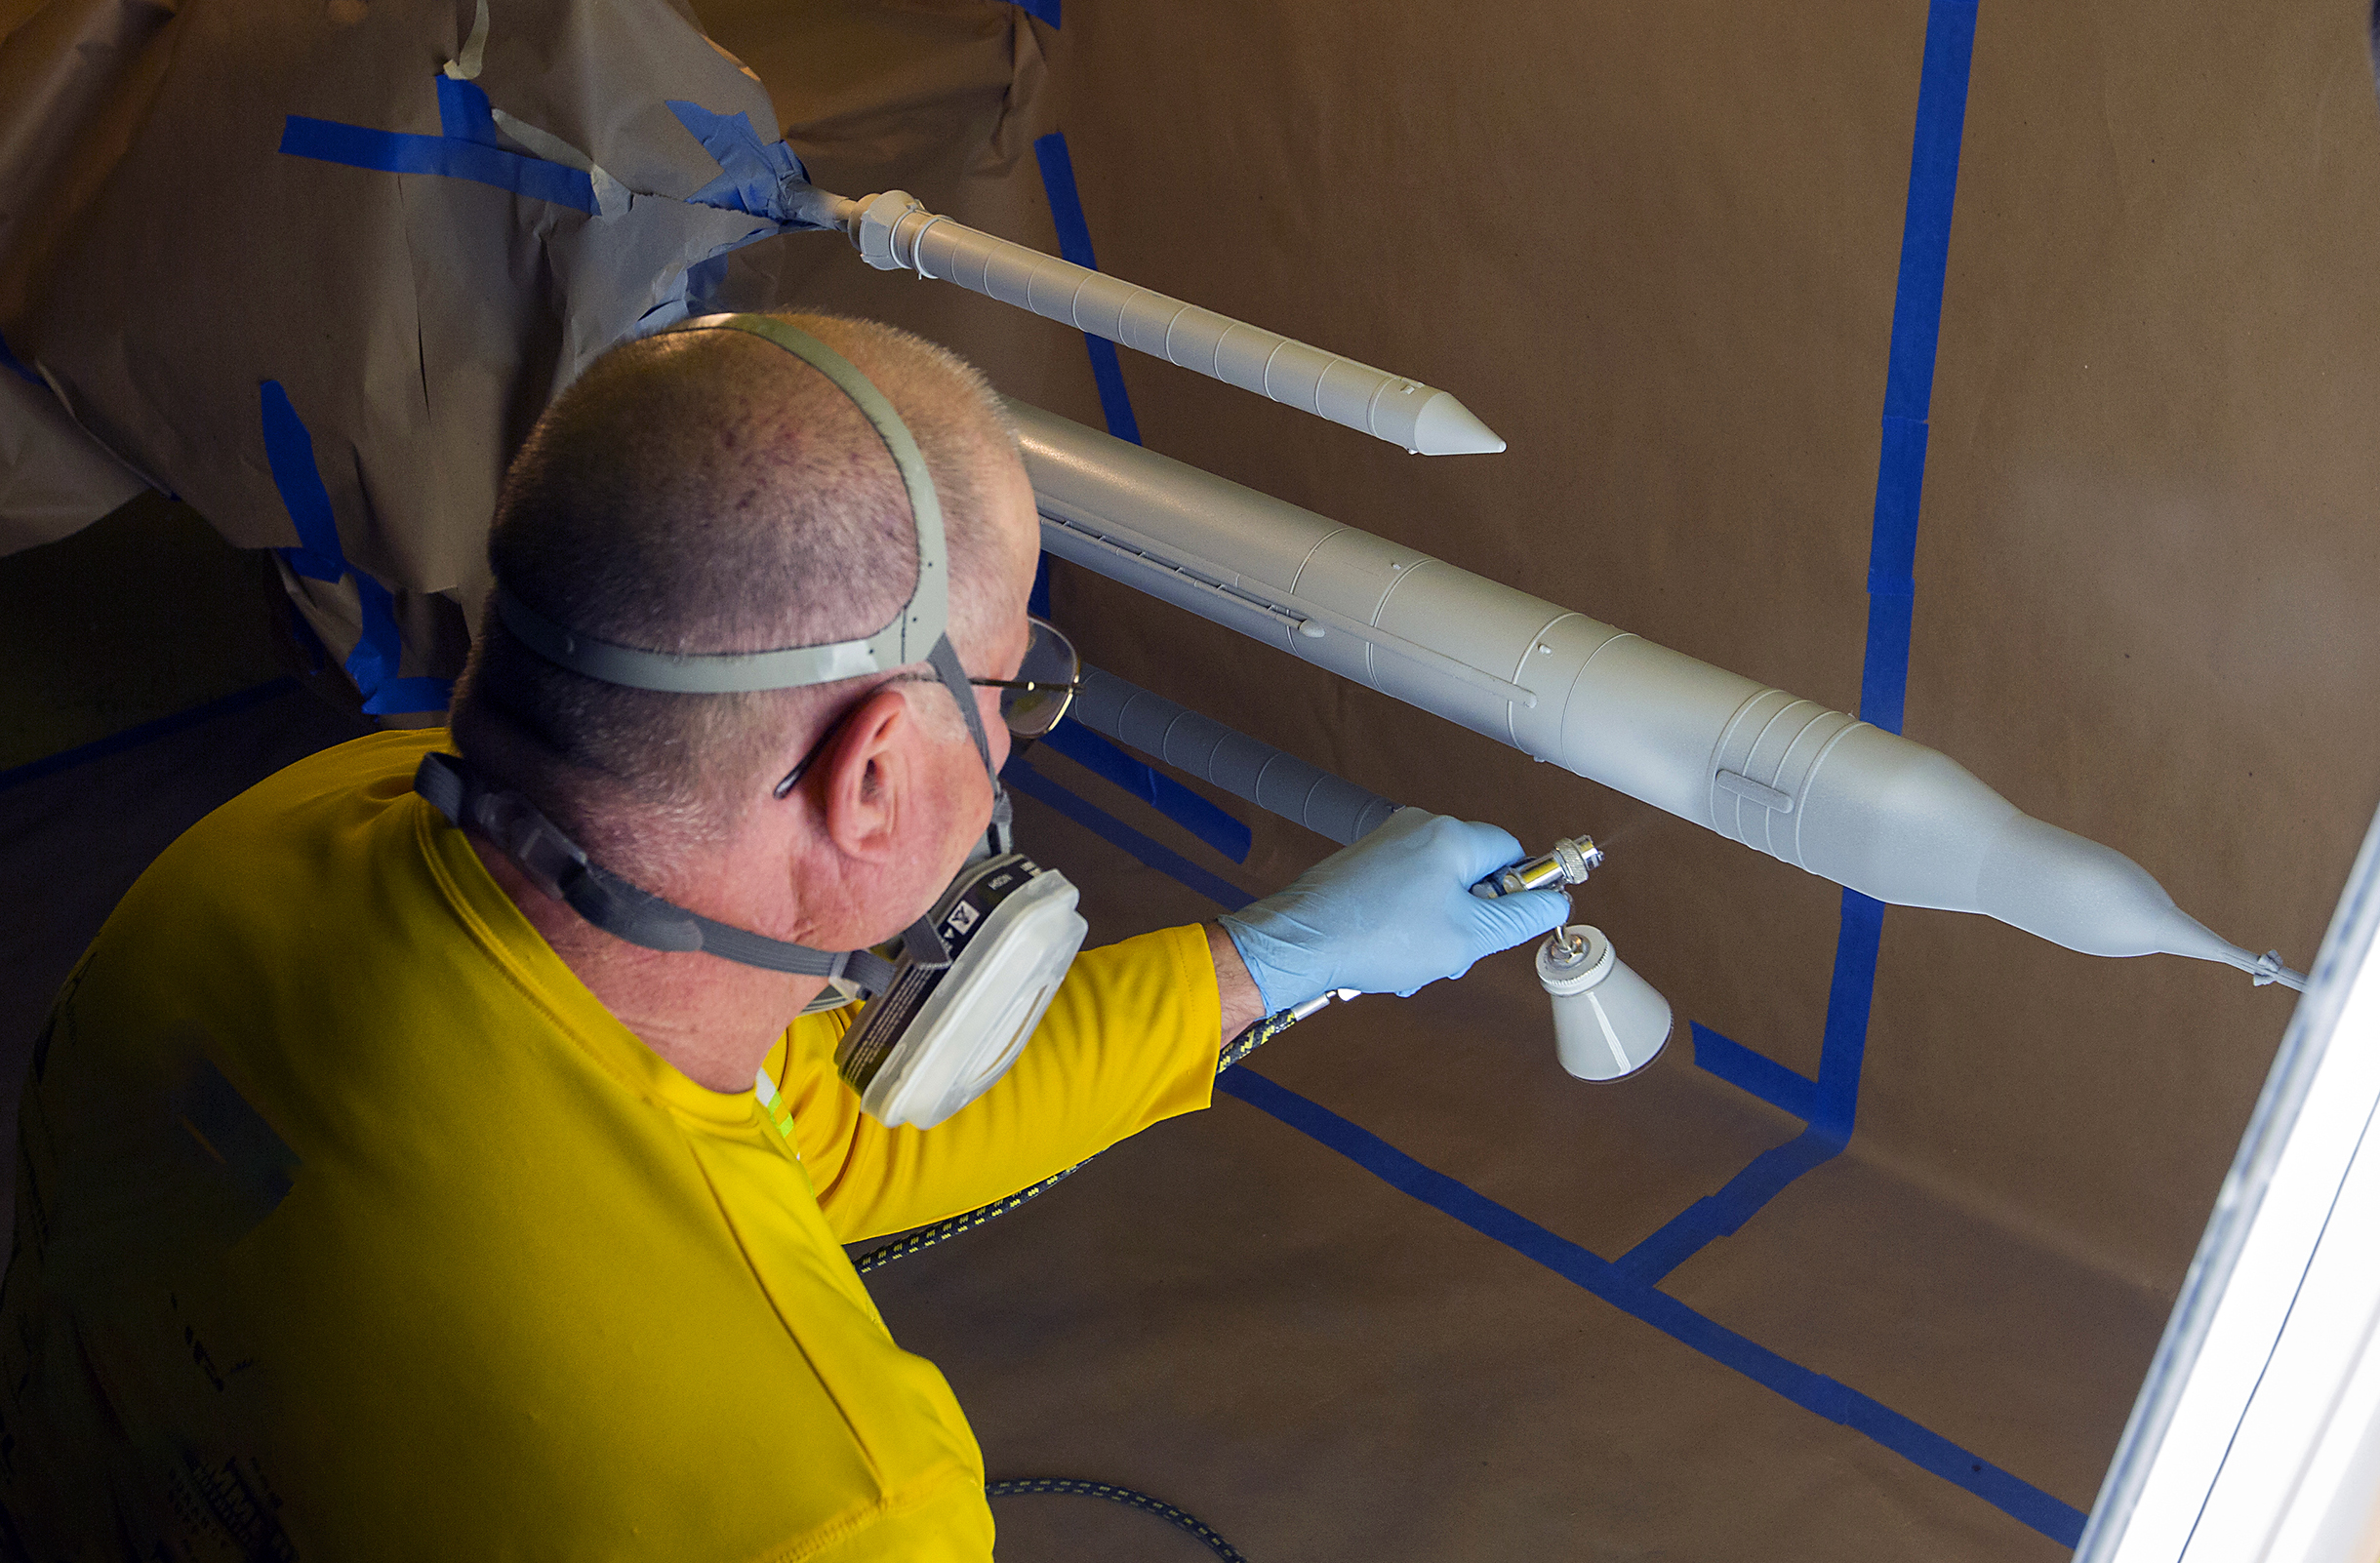
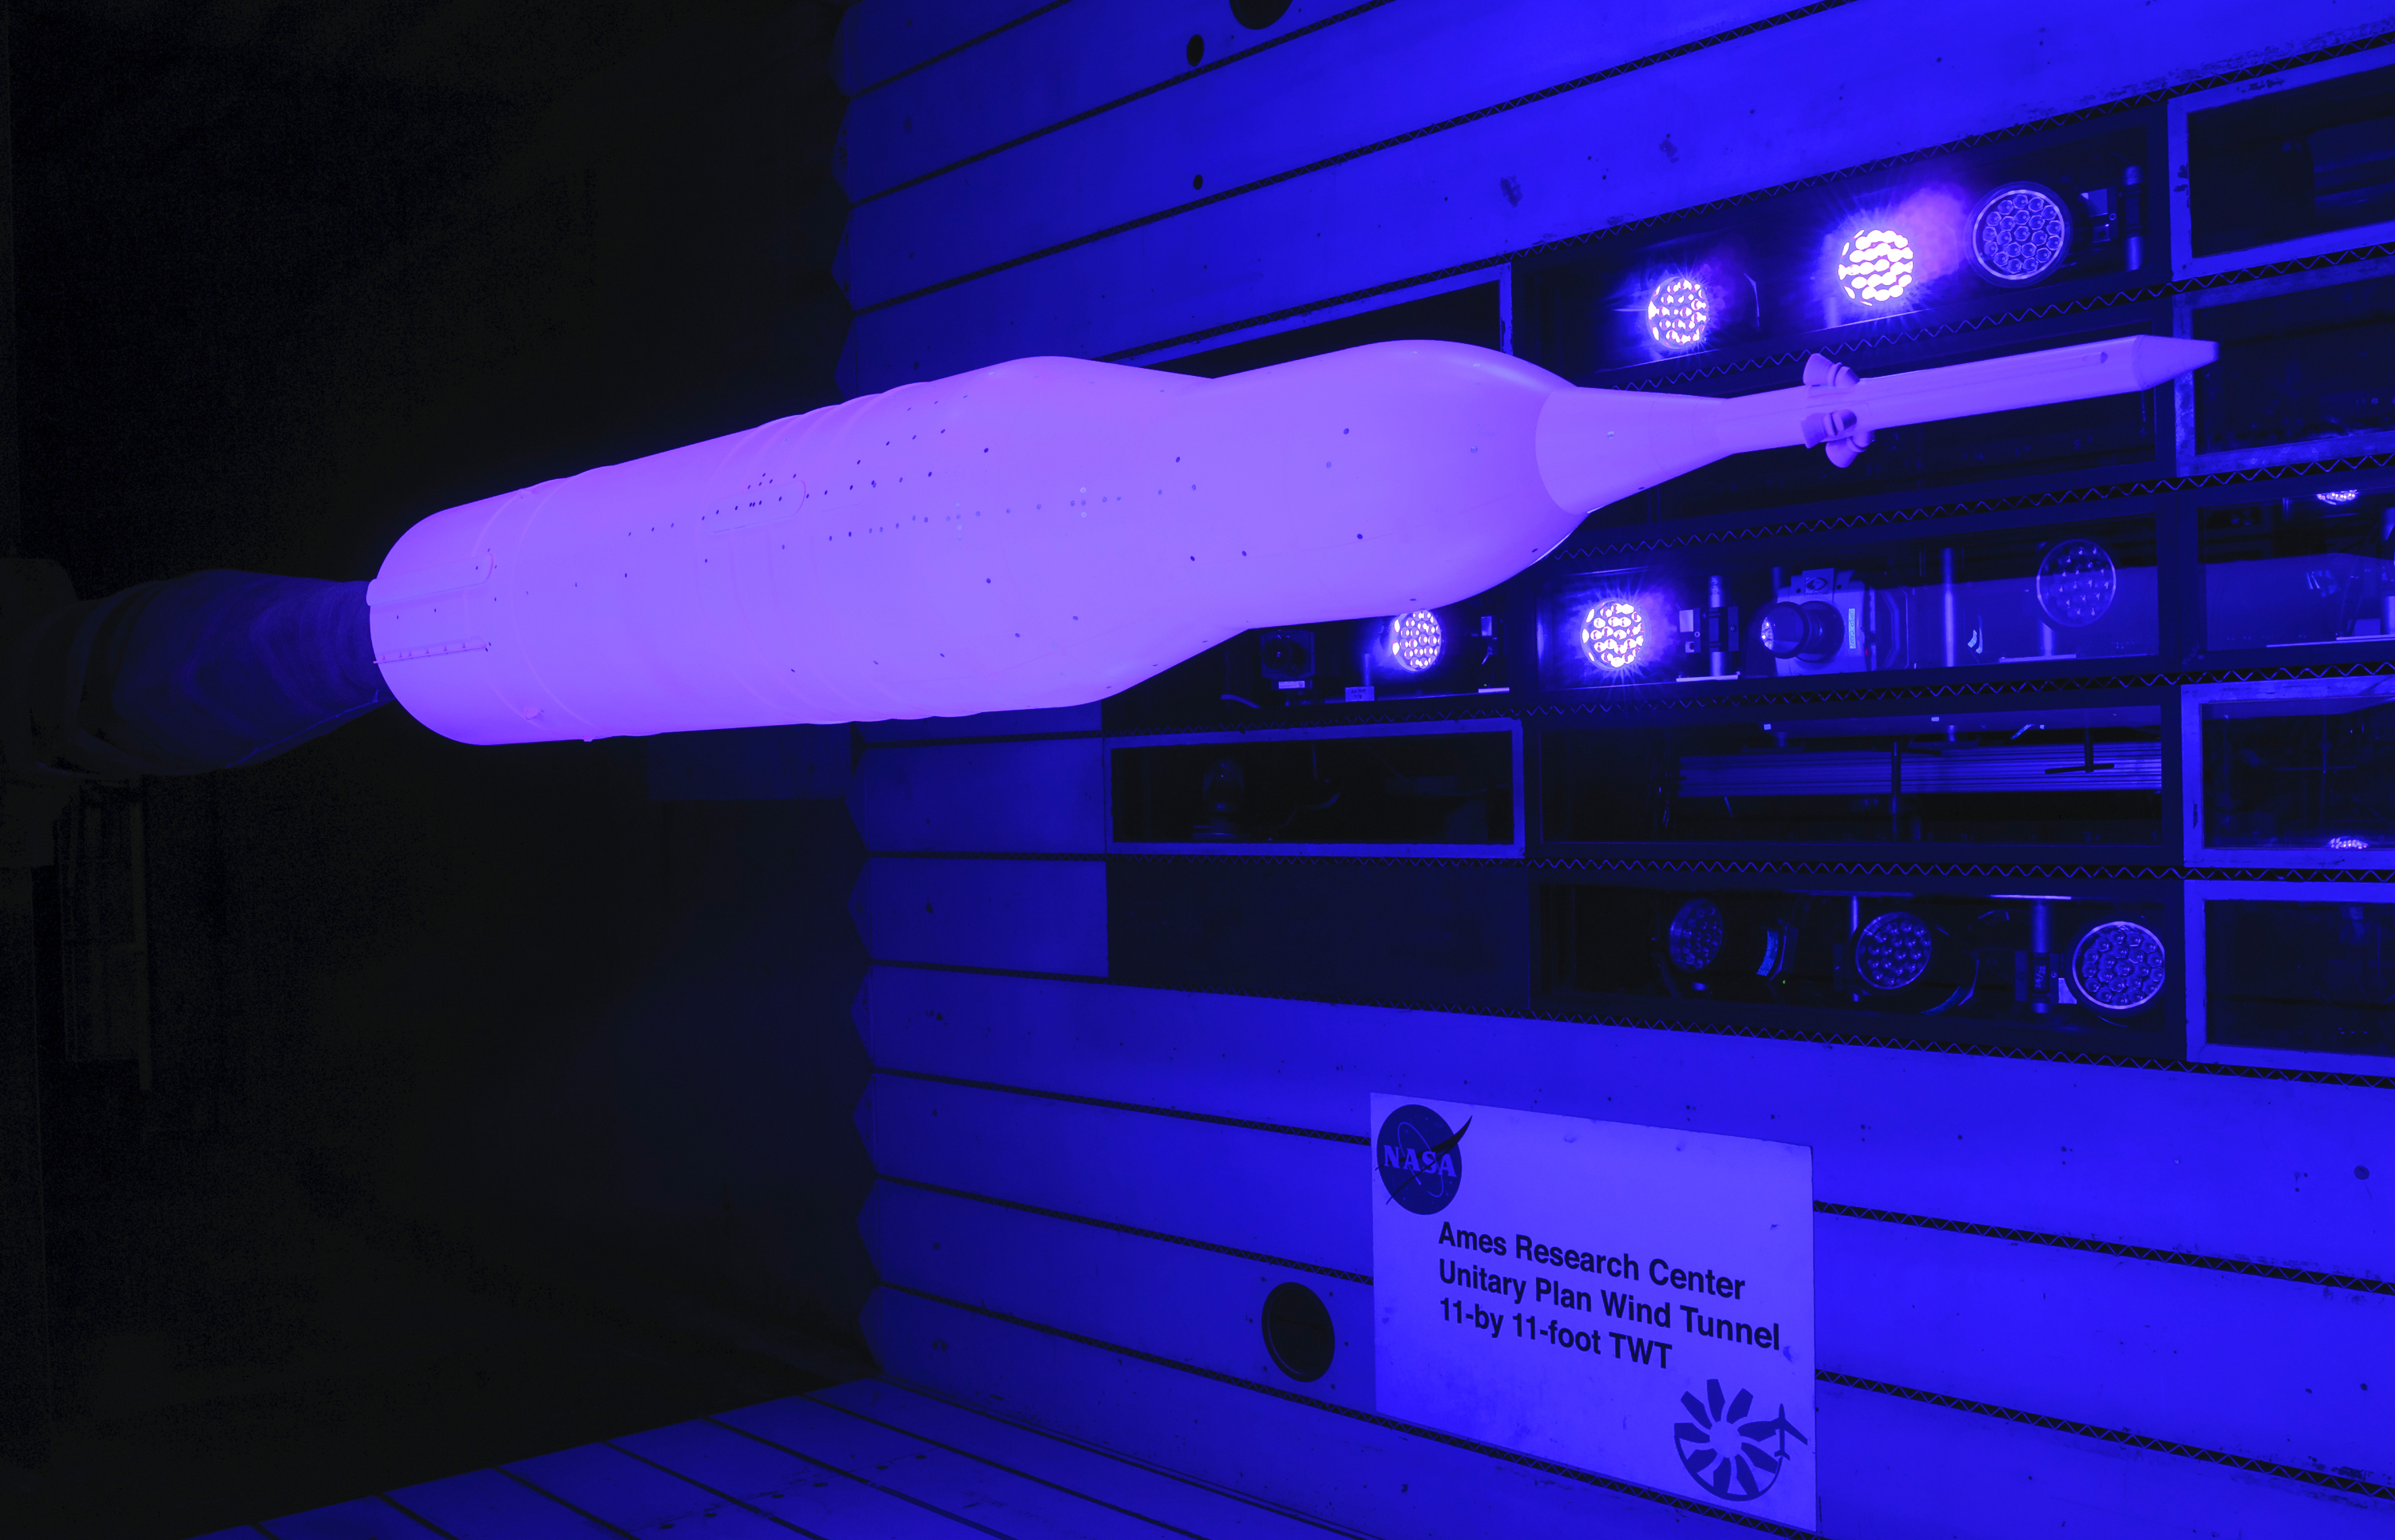
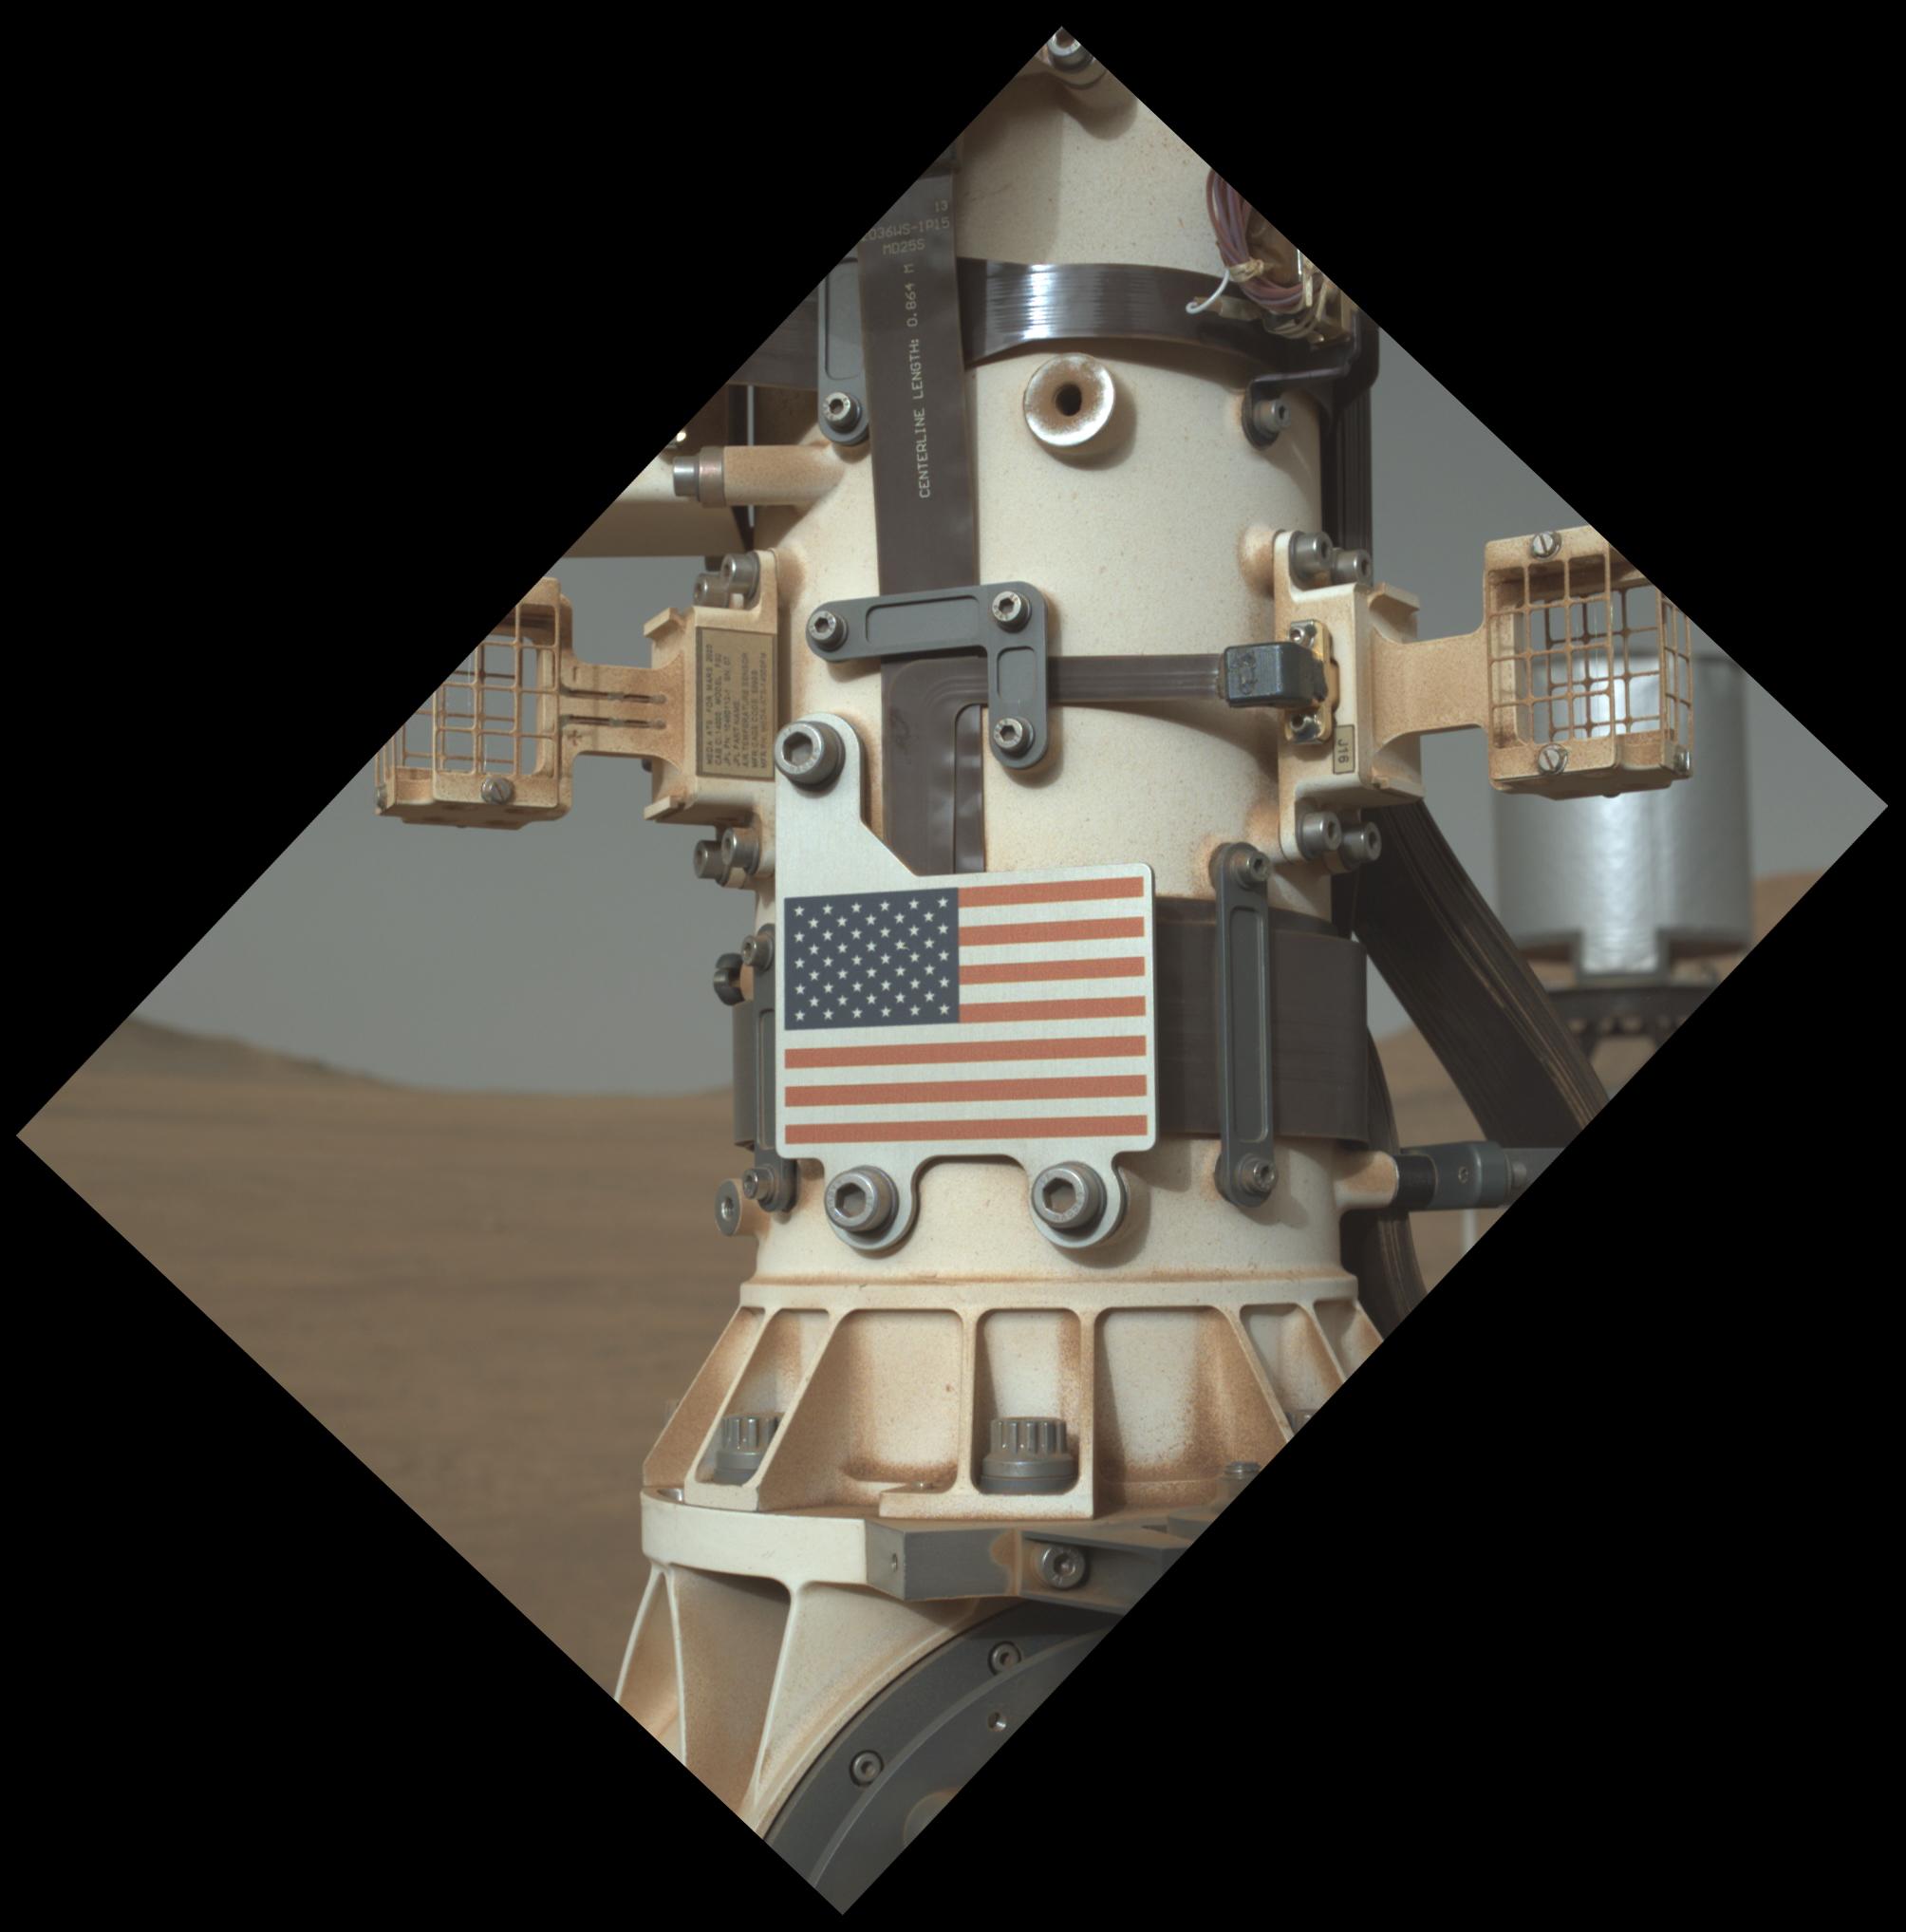
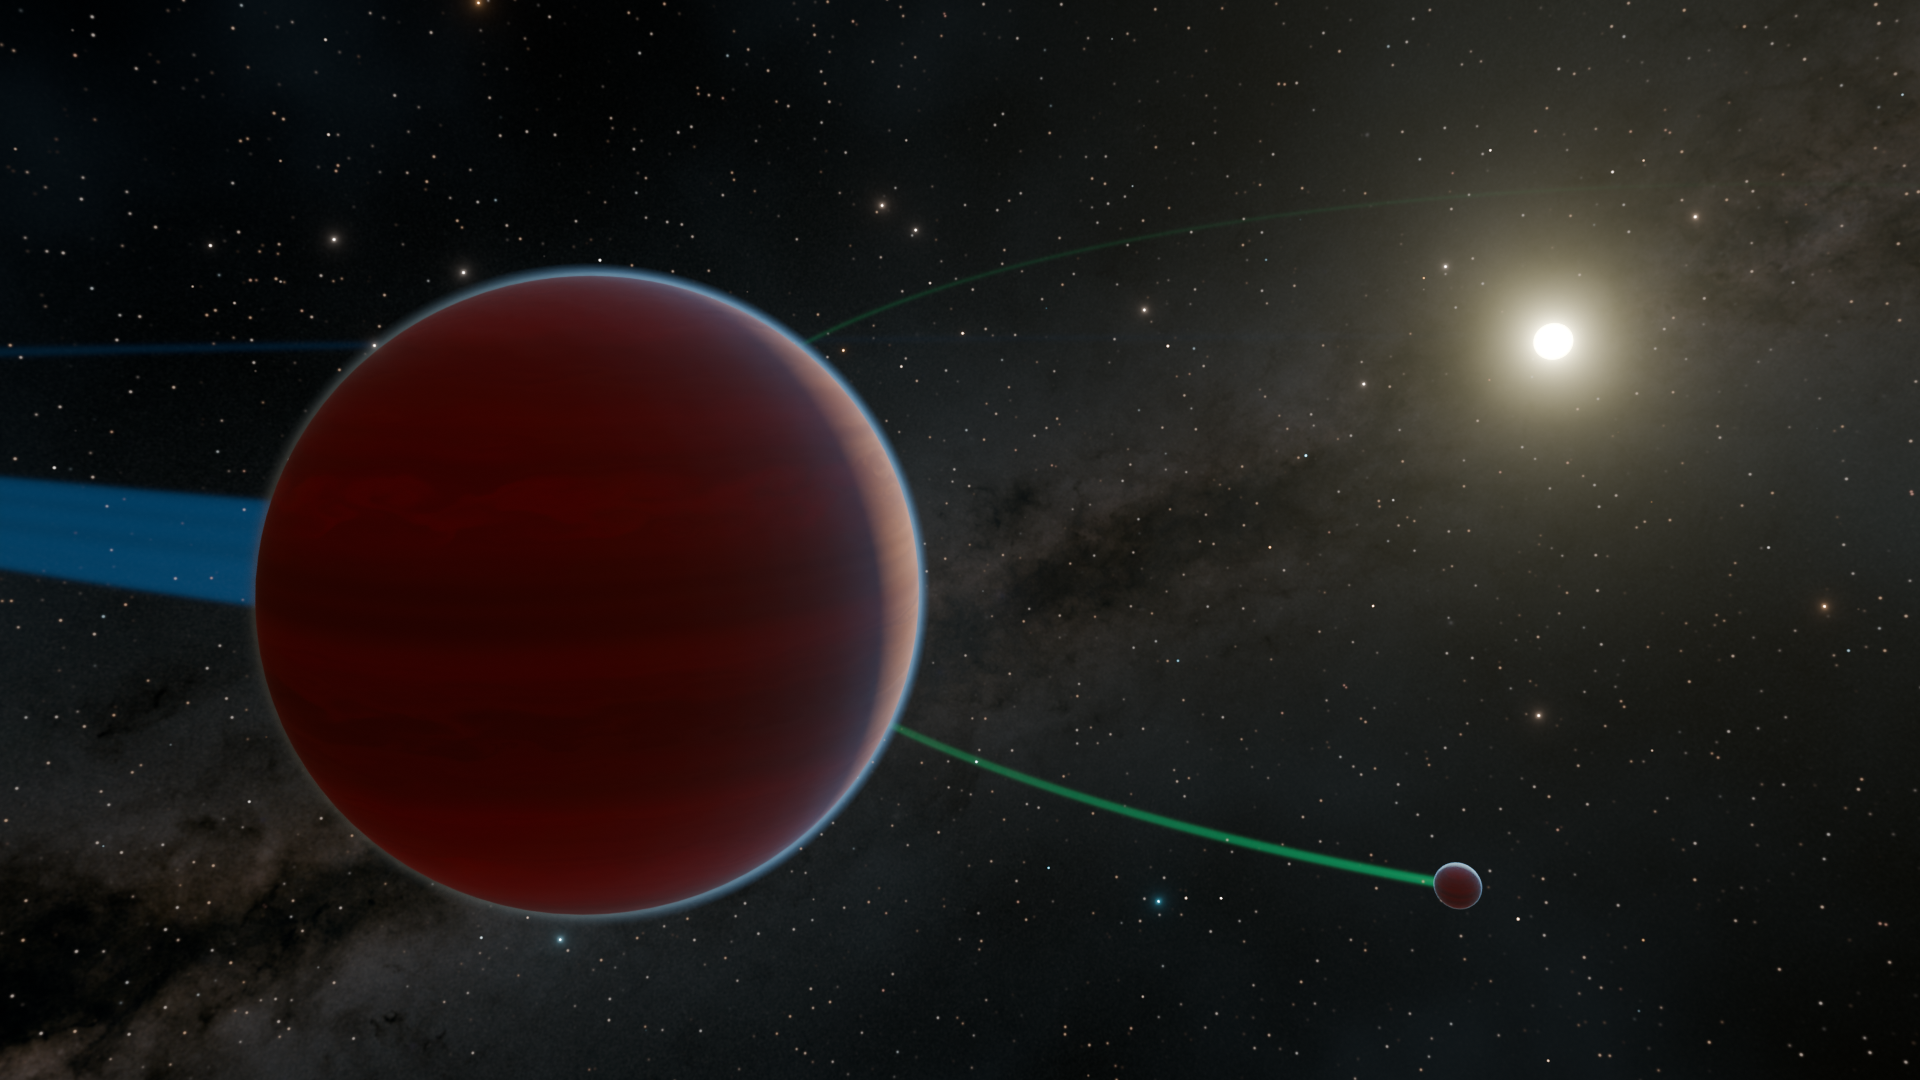
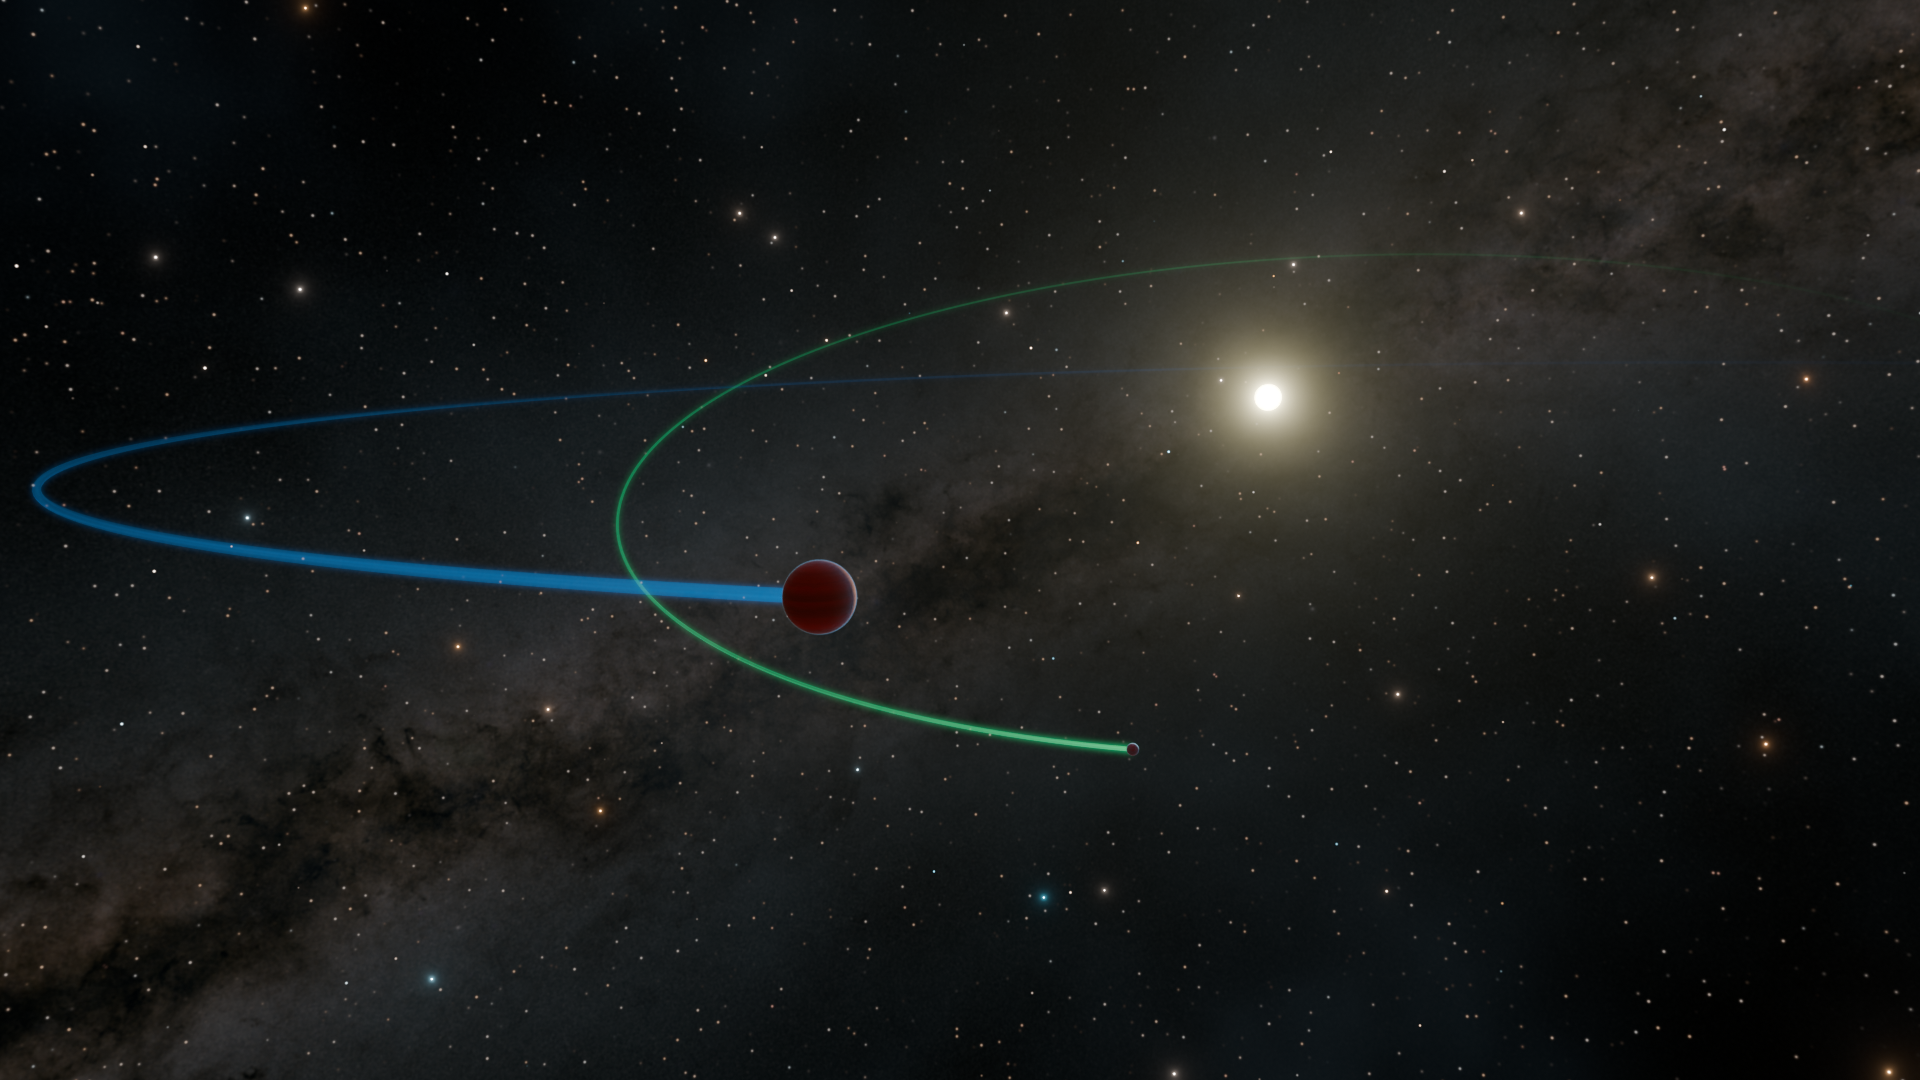
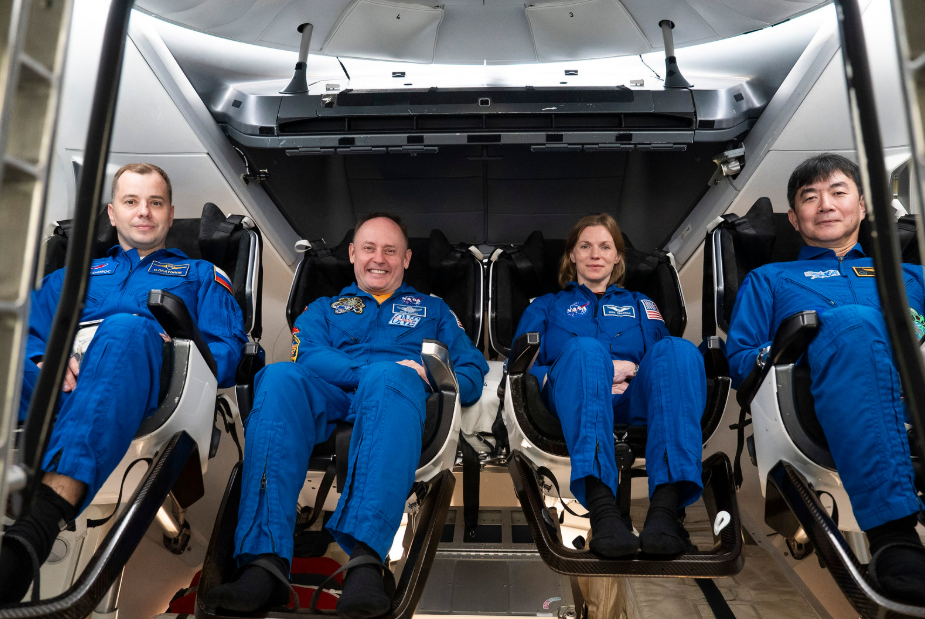
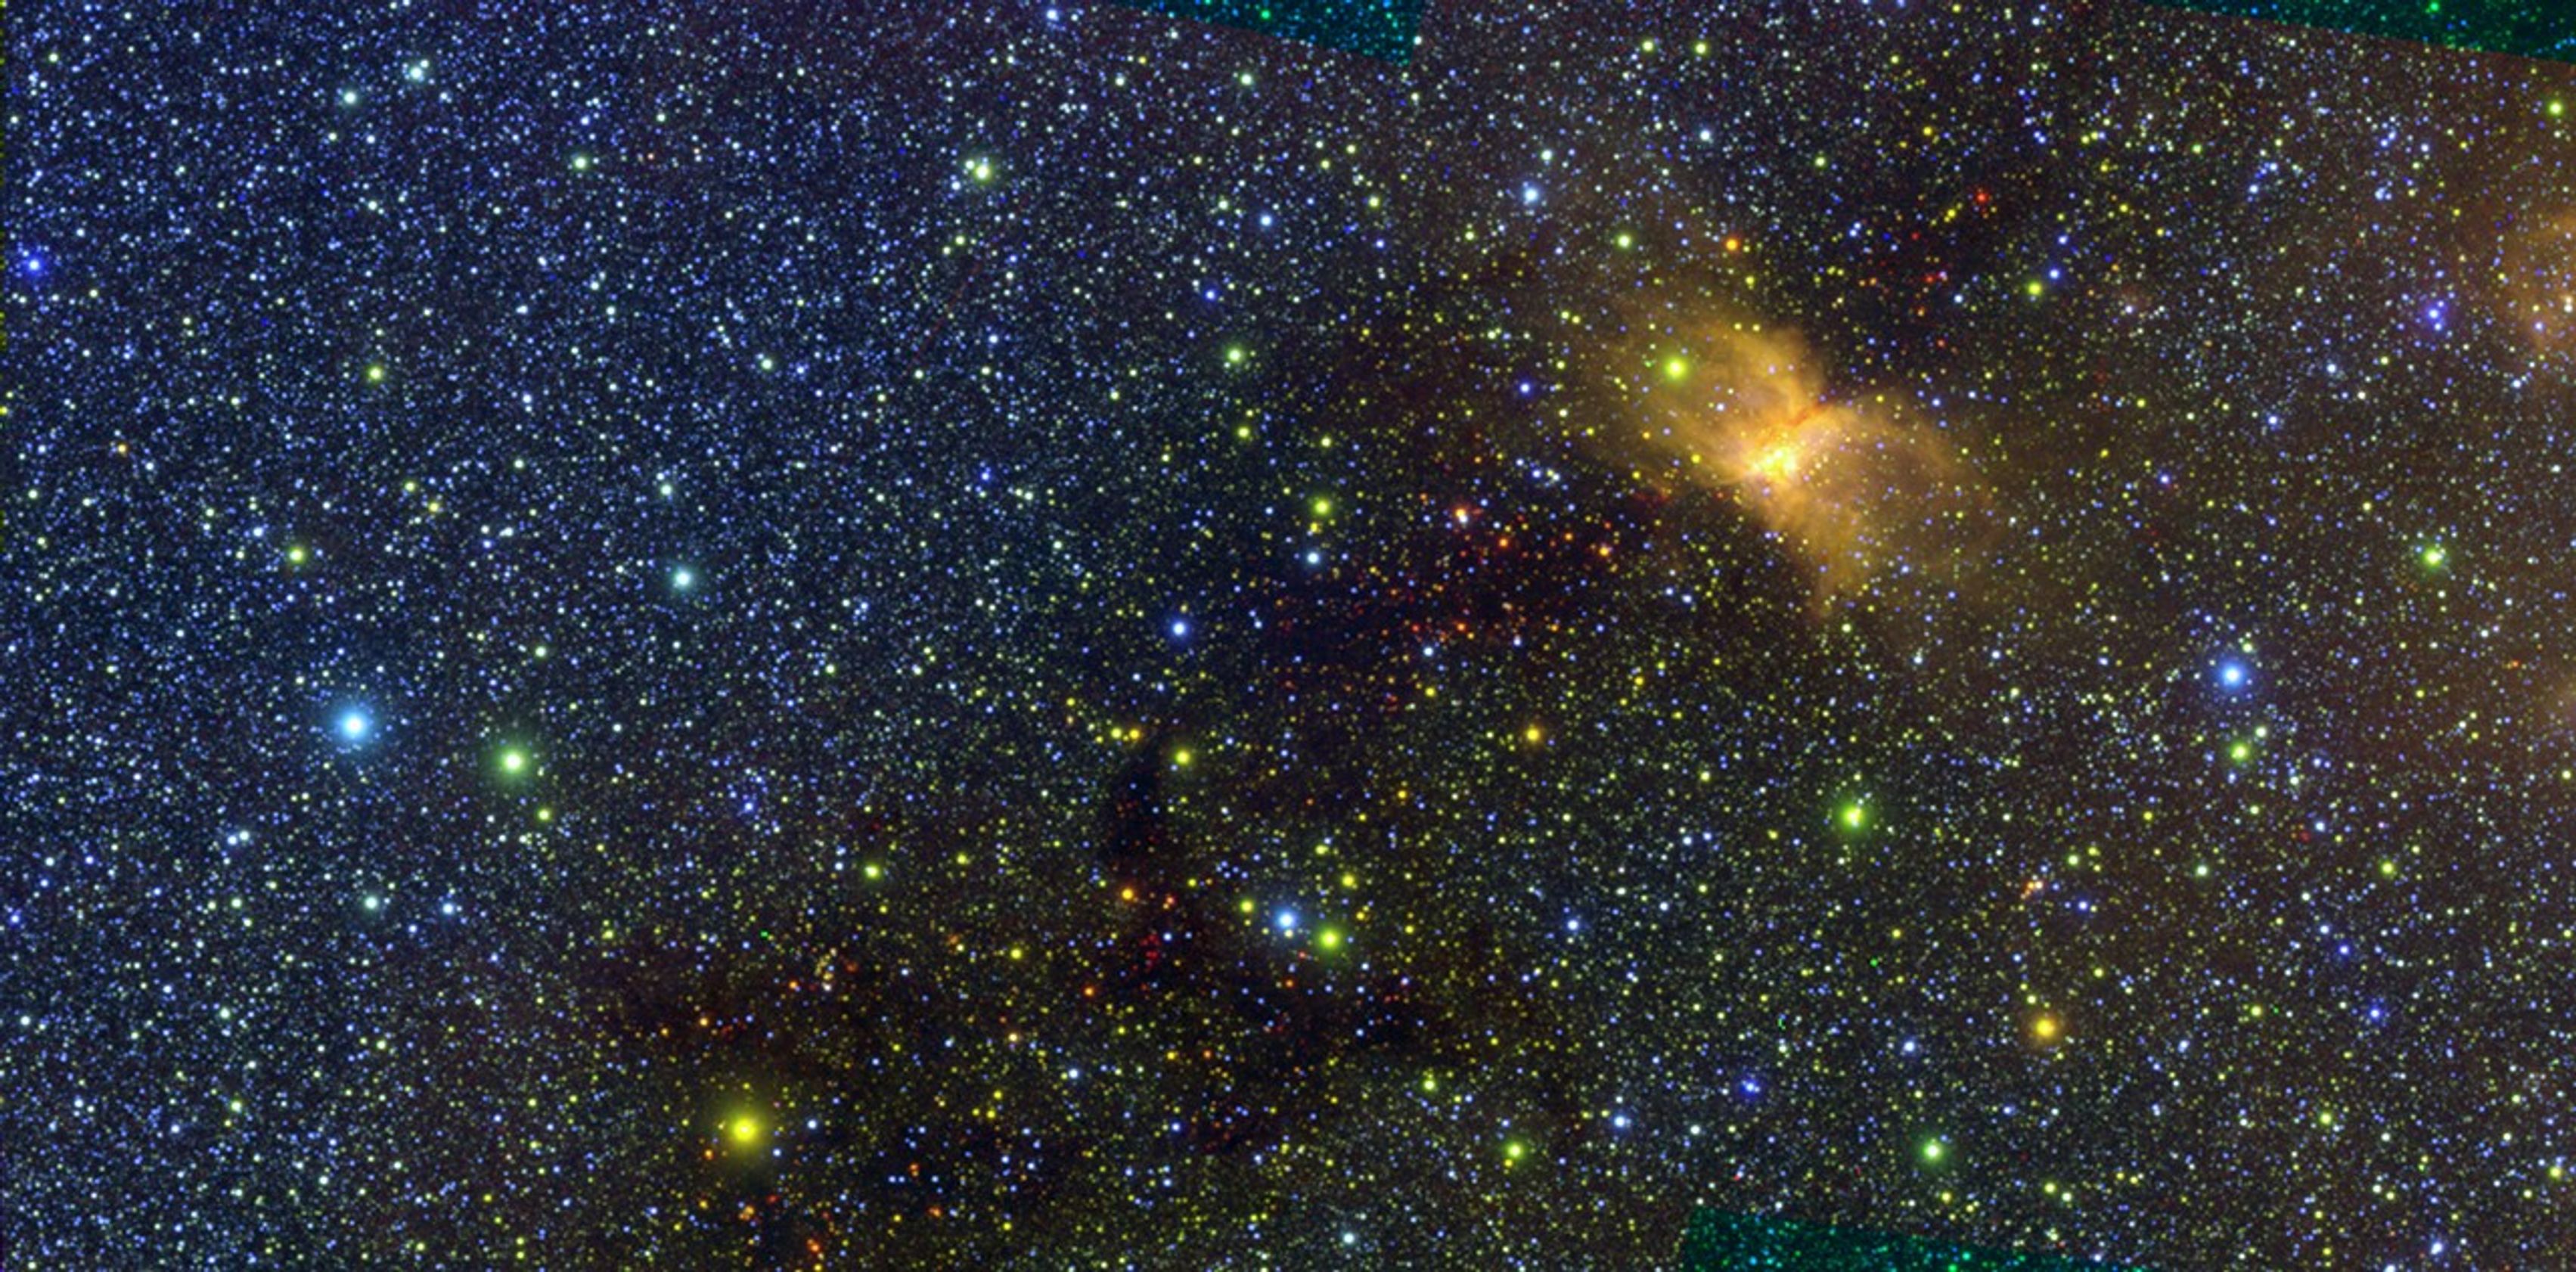
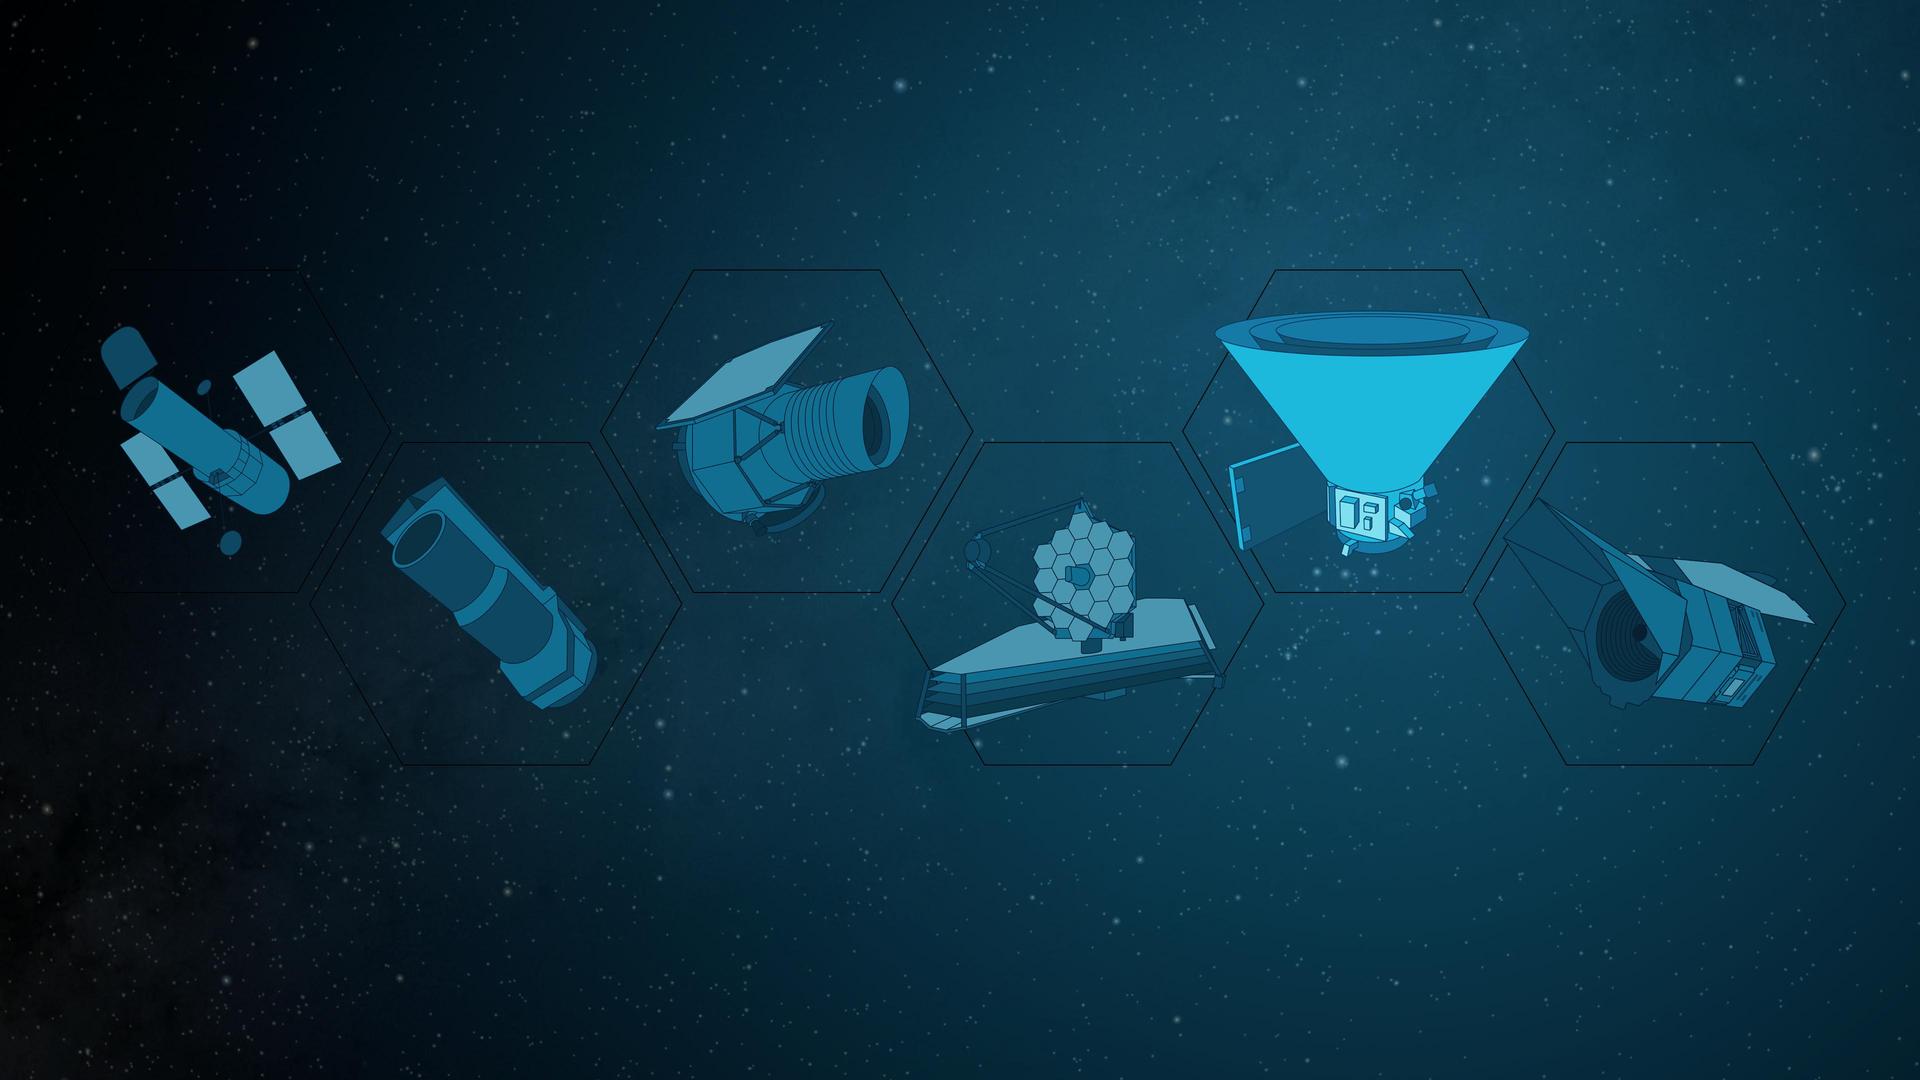
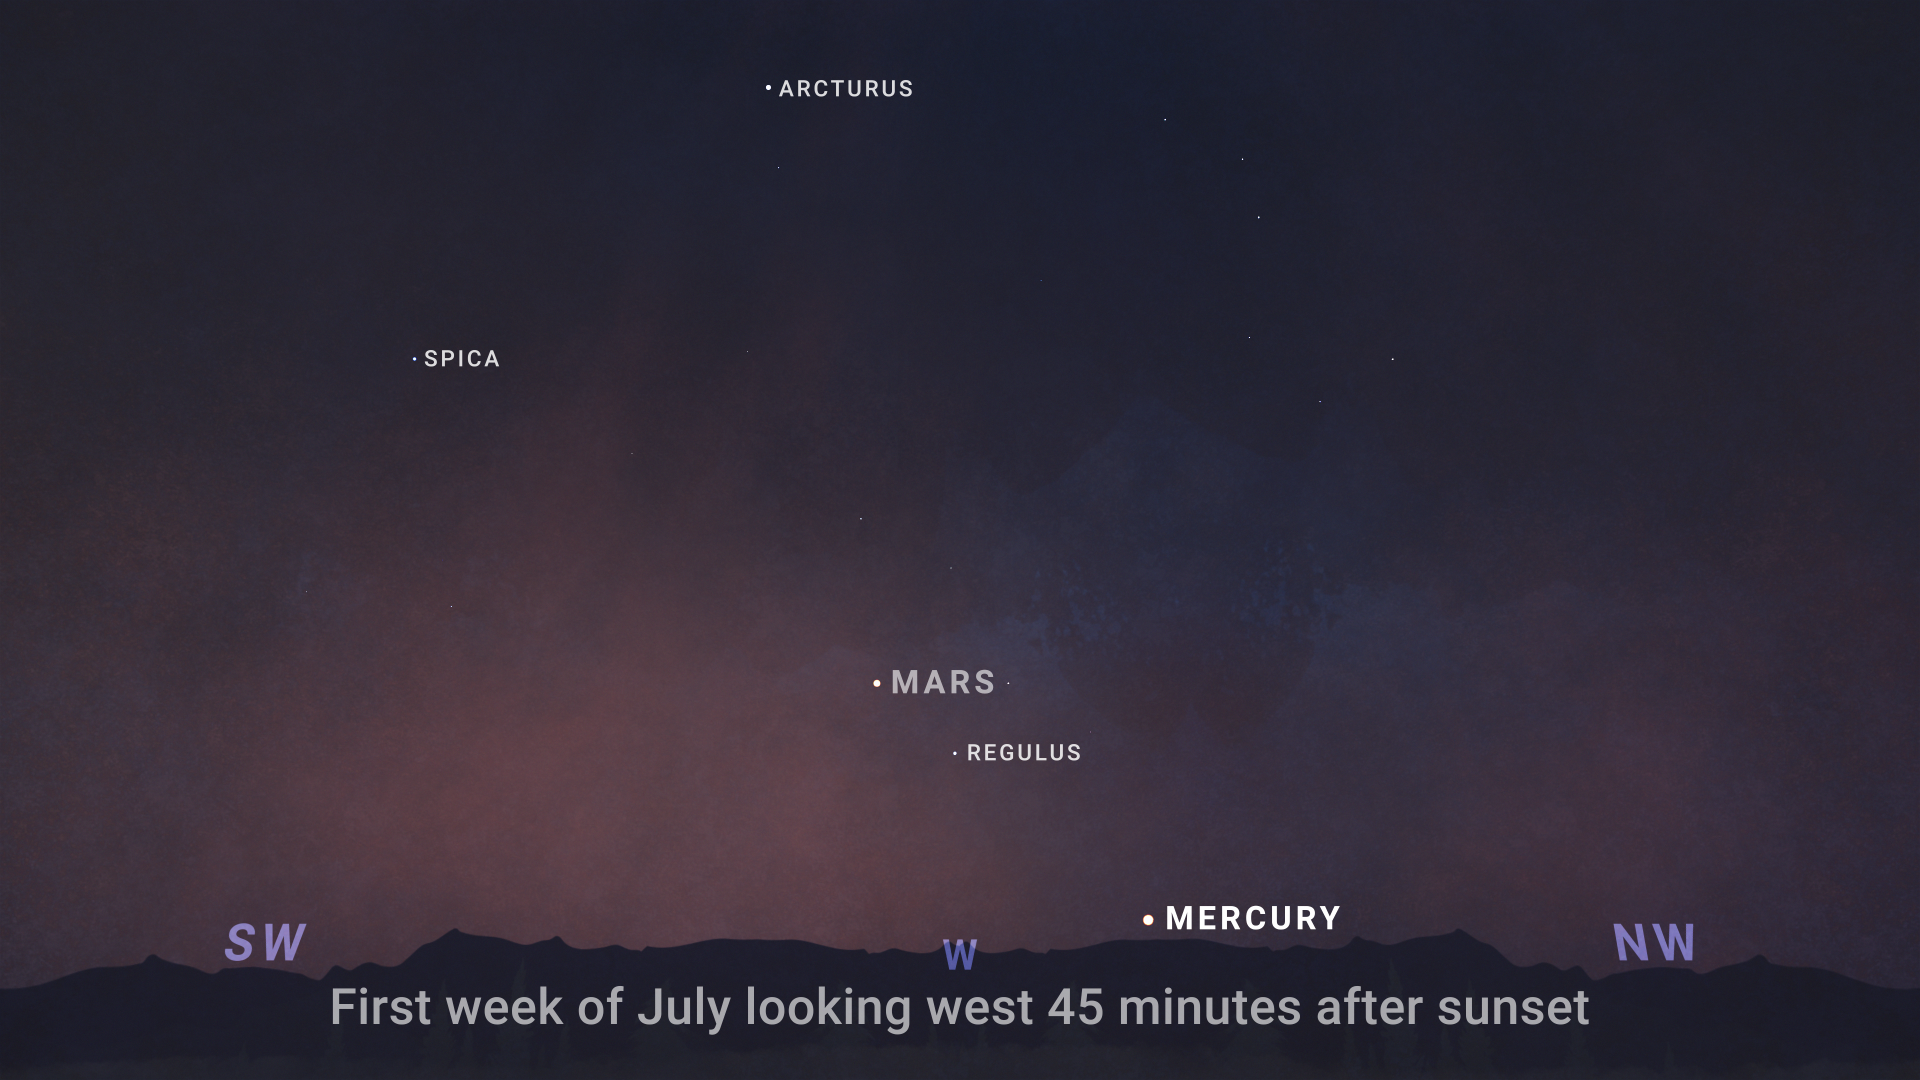
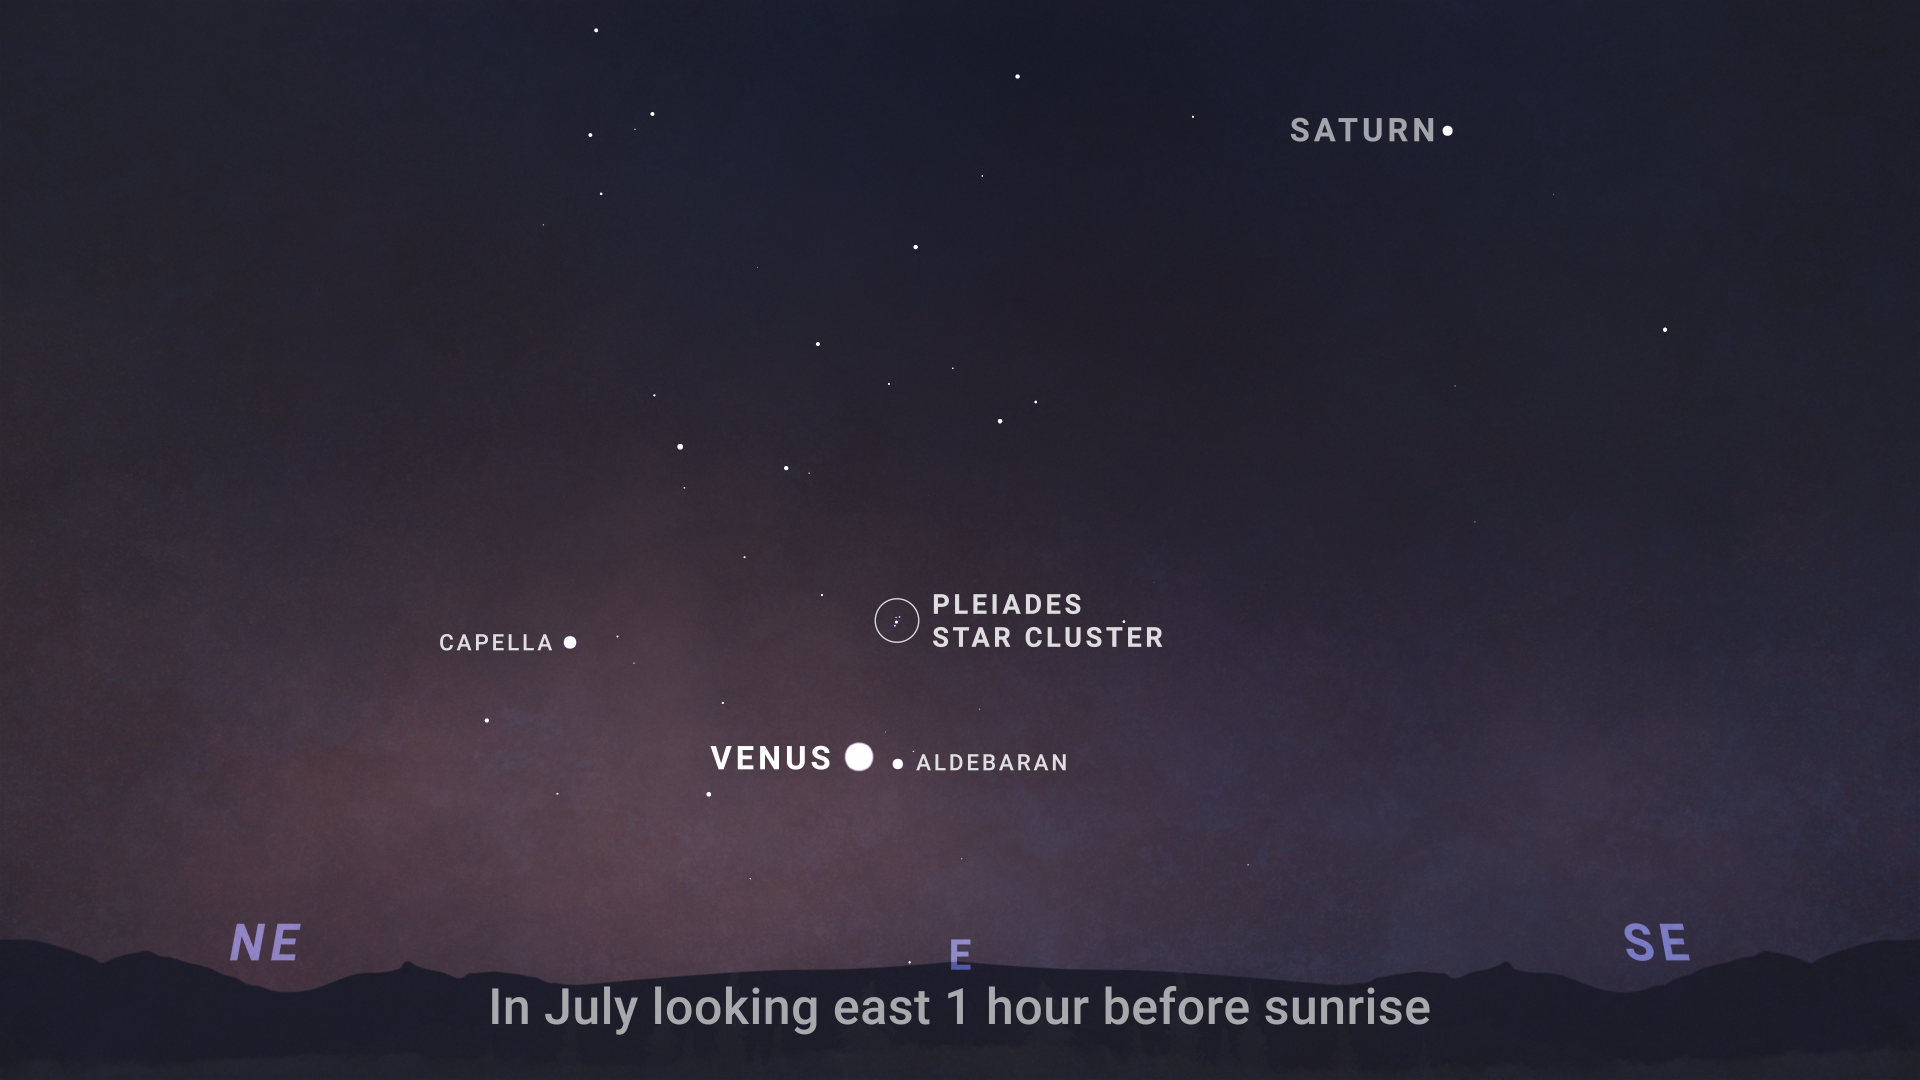
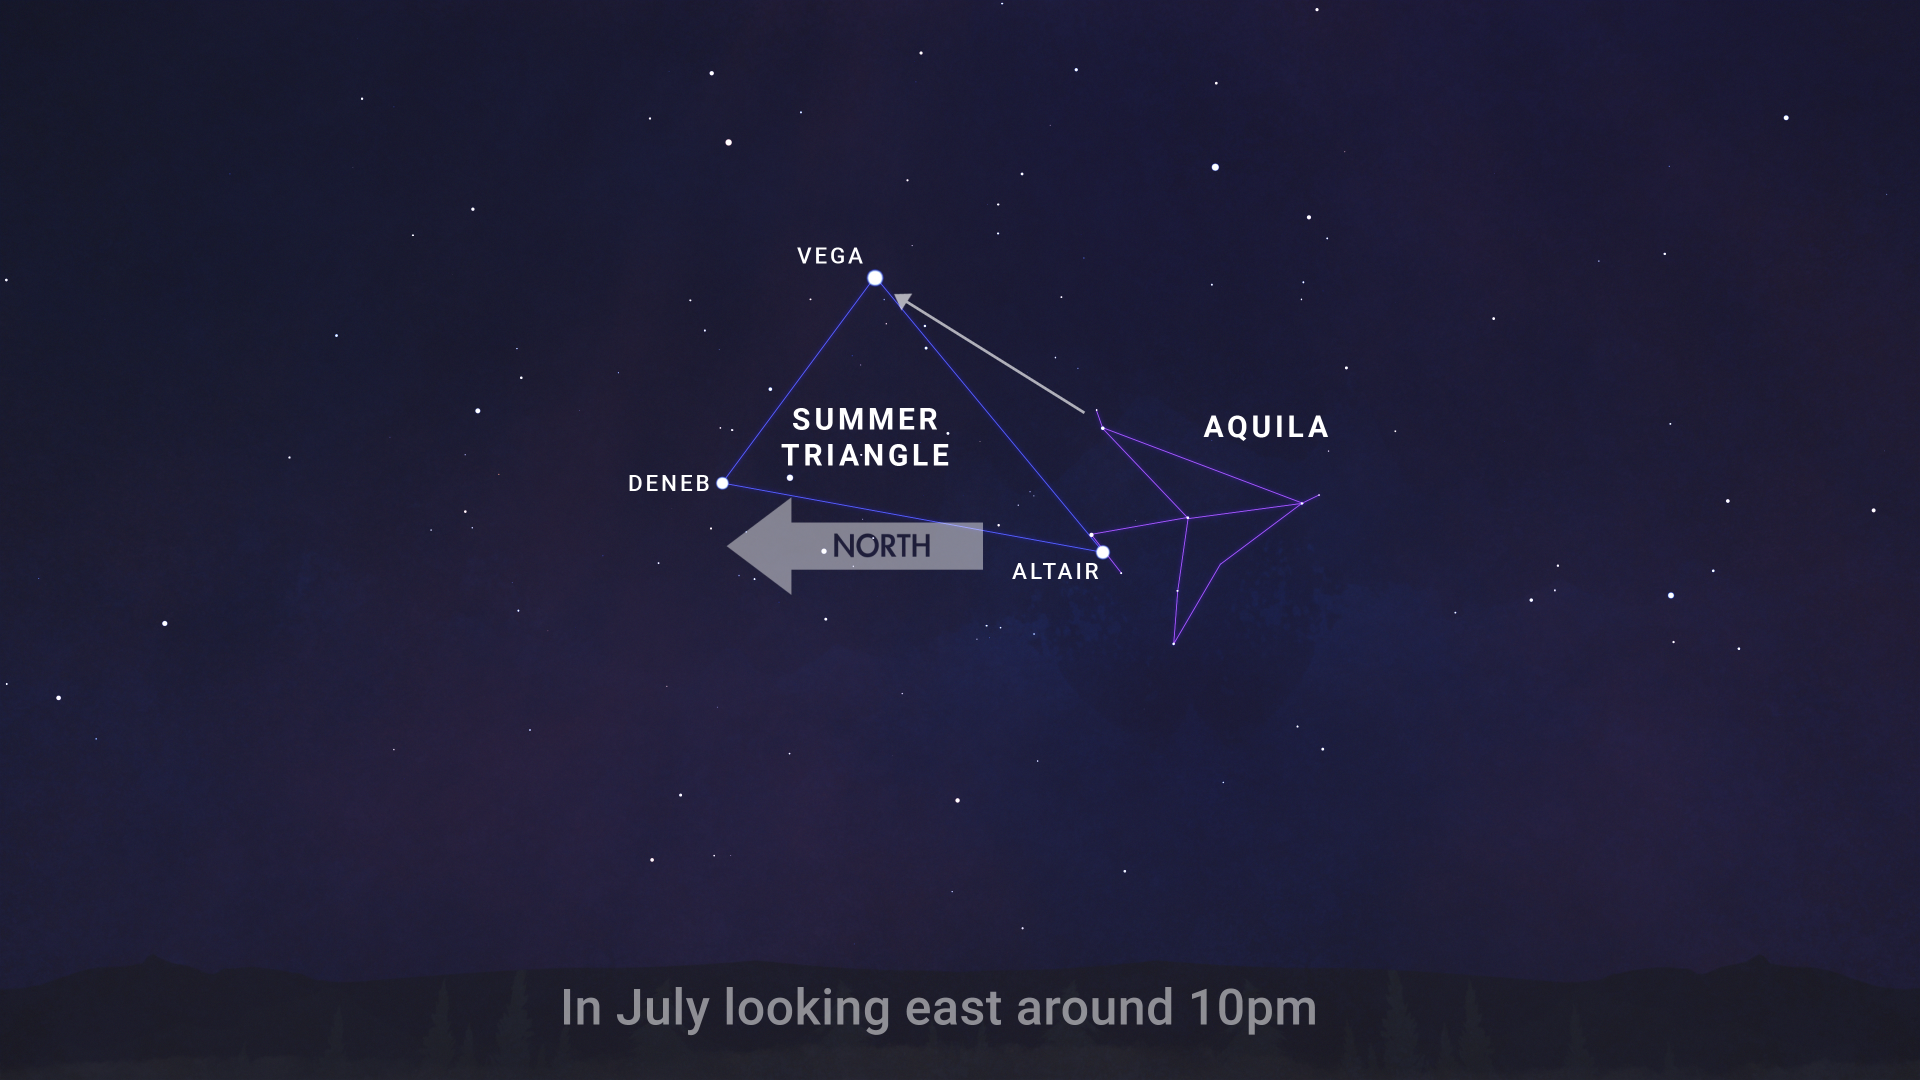
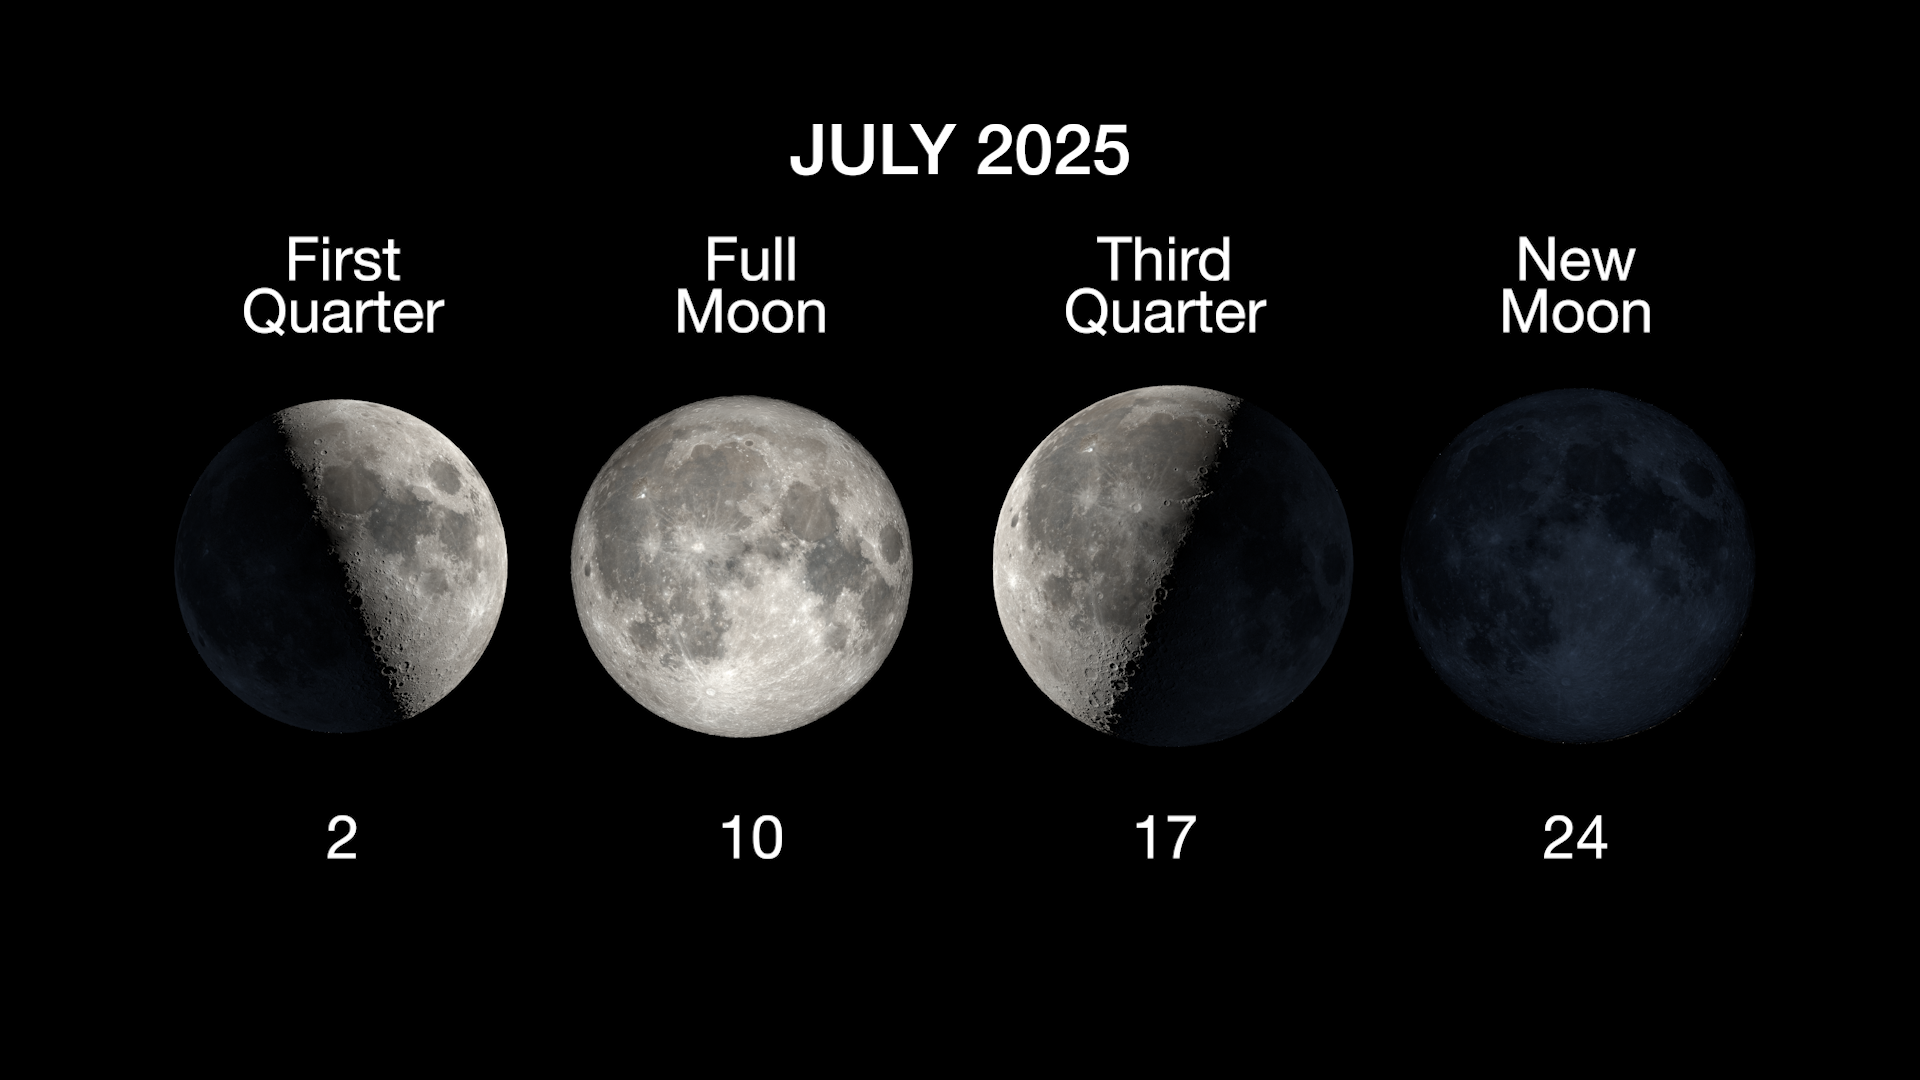
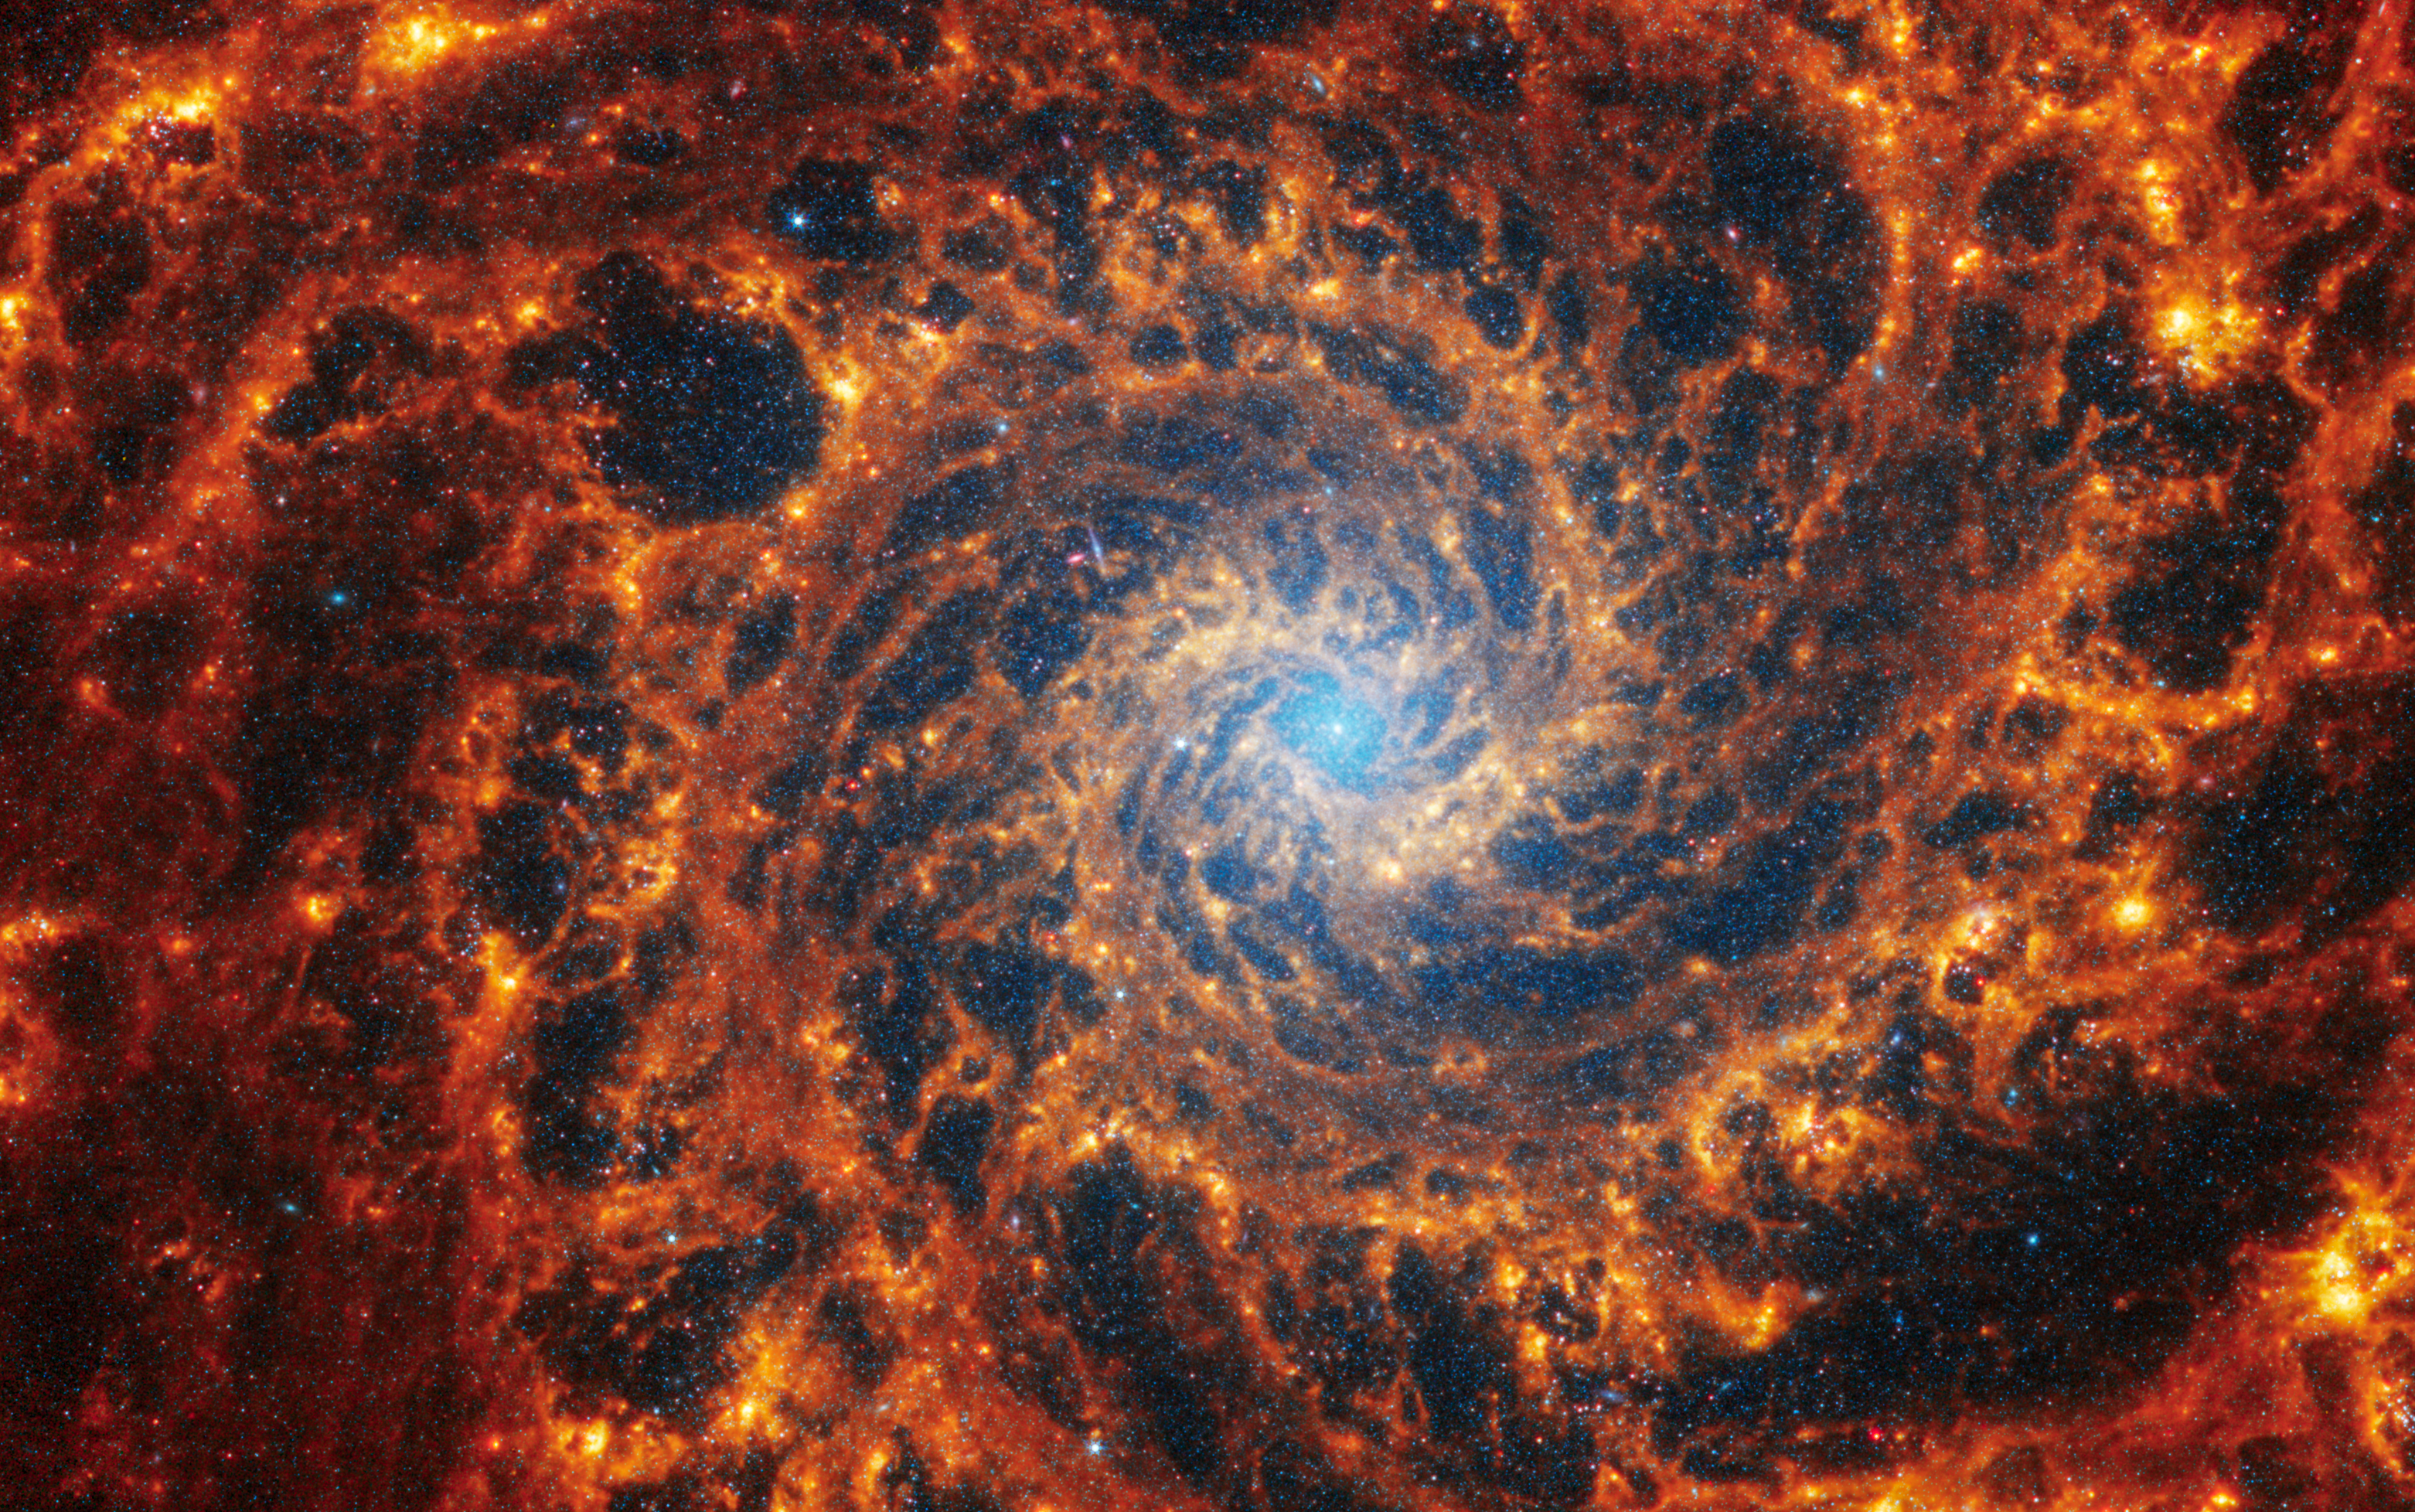