
NASA - Breaking News
The Final Earth Observer Editor’s Corner: October–December 2025
14 min read
The Final Earth Observer Editor’s Corner: October–December 2025It is with a heavy heart that I announce that NASA Earth Science Communications has directed The Earth Observer to conduct an orderly shutdown of the publication. No new content will be published after Dec. 31, 2025.
While the sunset of The Earth Observer is bittersweet for our team, the good news is that all of the rich historical and descriptive content preserved on The Earth Observer‘s archives page will remain accessible to the world. If you’ve never checked this page out, I highly encourage you to do so. You’ll find all of our archived issues saved in a PDF format, and – if you scroll down the page – you’ll find an annotated bibliography with links to numerous entries about a variety of topics to provide the historic context of the progress and accomplishments of the Earth Observing System (EOS).
–Alan Ward, Executive Editor, The Earth Observer
Almost 37 years ago, in March 1989, the first issue of The Earth Observer newsletter was released – see Figure 1. The three-page document contained one article that explained the rationale for the National Oceanic and Atmospheric Administration (NOAA) forgoing earlier plans to place instruments on NASA’s first EOS polar platform – at that time envisioned as one of several large platforms operated by NASA, NOAA, Europe, and Japan, with numerous instruments on each platform. Along with this article, that first issue featured an EOS launch schedule, a list of publications and acronyms, and a personals section. Yes, personals. It’s hard to believe that a NASA newsletter would feature personals but remember that this first issue was published at a time before the internet was widely available. The newsletter served as a bridge to quickly connect hundreds of newly chosen EOS investigators scattered worldwide with the latest EOS program developments. The content of early issues included the latest reports from Investigators Working Group meetings, payload panel reviews, and instrument Science Team Meetings (STM). In short, before the Web, The Earth Observer was the thread that kept the various EOS teams connected.
The Earth Observer issue covers: March 1989 (first issue) and Nov. 1989.”> The Earth Observer issue covers: March 1989 (first issue) and Nov. 1989. Figure 1. The look of The Earth Observer has evolved over the years. This graphic shows the evolution of the newsletter’s front-page over the past 36 years. Note how our logo evolved and eventually disappeared. After 2004, new NASA communications guidelines required the NASA logo to be shown on the front instead of the individual program logo. Since 2011, online issues of The Earth Observer have been available in color. A redesign in 2019 included the new logo and tagline for the 30th anniversary; the logo was removed and the tagline tweaked in 2020. The final print issue was published in May 2024. The Earth Observer began publishing content online Summer 2024. The last photo in the series shows the home page for The Earth Observer’s website as of December 2025, which will remain accessible after 2025 as a historic archive. Credit: Debbi McLean/NASA’s Goddard Space Flight Center The Earth Observer issue covers:: Jan.–Feb. 1997 and Jan–Feb. 2000.”> The Earth Observer issue covers:: Jan.–Feb. 1997 and Jan–Feb. 2000. Figure 1. The look of The Earth Observer has evolved over the years. This graphic shows the evolution of the newsletter’s front-page over the past 36 years. Note how our logo evolved and eventually disappeared. After 2004, new NASA communications guidelines required the NASA logo to be shown on the front instead of the individual program logo. Since 2011, online issues of The Earth Observer have been available in color. A redesign in 2019 included the new logo and tagline for the 30th anniversary; the logo was removed and the tagline tweaked in 2020. The final print issue was published in May 2024. The Earth Observer began publishing content online Summer 2024 The last photo in the series shows the home page for The Earth Observer’s website as of December 2025, which will remain accessible after 2025 as a historic archives. Credit: Debbi McLean/NASA’s Goddard Space Flight Center The Earth Observer issue covers: Jan.–Feb. 2006 and Jan.–Feb. 2008.”> The Earth Observer issue covers: Jan.–Feb. 2006 and Jan.–Feb. 2008. Figure 1. The look of The Earth Observer has evolved over the years. This graphic shows the evolution of the newsletter’s front-page over the past 36 years. Note how our logo evolved and eventually disappeared. After 2004, new NASA communications guidelines required the NASA logo to be shown on the front instead of the individual program logo. Since 2011, online issues of The Earth Observer have been available in color. A redesign in 2019 included the new logo and tagline for the 30th anniversary; the logo was removed and the tagline tweaked in 2020. The final print issue was published in May 2024. The Earth Observer began publishing content online Summer 2024 The last photo in the series shows the home page for The Earth Observer’s website as of December 2025, which will remain accessible after 2025 as a historic archives. Credit: Debbi McLean/NASA’s Goddard Space Flight Center The Earth Observer issue covers: Jan.–/Feb. 2011 (now in color) and March–April 2014 (25th anniversary).”> The Earth Observer issue covers: Jan.–/Feb. 2011 (now in color) and March–April 2014 (25th anniversary). Figure 1. The look of The Earth Observer has evolved over the years. This graphic shows the evolution of the newsletter’s front-page over the past 36 years. Note how our logo evolved and eventually disappeared. After 2004, new NASA communications guidelines required the NASA logo to be shown on the front instead of the individual program logo. Since 2011, online issues of The Earth Observer have been available in color. A redesign in 2019 included the new logo and tagline for the 30th anniversary; the logo was removed and the tagline tweaked in 2020. The final print issue was published in May 2024. The Earth Observer began publishing content online Summer 2024 The last photo in the series shows the home page for The Earth Observer’s website as of December 2025, which will remain accessible after 2025 as a historic archives. Credit: Debbi McLean/NASA’s Goddard Space Flight Center The Earth Observe issue covers: Jan.–Feb. 2019 (30th anniversary) and Jan.–Feb. 2020.”> The Earth Observe issue covers: Jan.–Feb. 2019 (30th anniversary) and Jan.–Feb. 2020. Figure 1. The look of The Earth Observer has evolved over the years. This graphic shows the evolution of the newsletter’s front-page over the past 36 years. Note how our logo evolved and eventually disappeared. After 2004, new NASA communications guidelines required the NASA logo to be shown on the front instead of the individual program logo. Since 2011, online issues of The Earth Observer have been available in color. A redesign in 2019 included the new logo and tagline for the 30th anniversary; the logo was removed and the tagline tweaked in 2020. The final print issue was published in May 2024. The Earth Observer began publishing content online Summer 2024 The last photo in the series shows the home page for The Earth Observer’s website as of December 2025, which will remain accessible after 2025 as a historic archives. Credit: Debbi McLean/NASA’s Goddard Space Flight Center The Earth Observer‘s final pdf issue cover (May 2024) and website screenshot (Dec.2025).”> The Earth Observer‘s final pdf issue cover (May 2024) and website screenshot (Dec.2025). Figure 1. The look of The Earth Observer has evolved over the years. This graphic shows the evolution of the newsletter’s front-page over the past 36 years. Note how our logo evolved and eventually disappeared. After 2004, new NASA communications guidelines required the NASA logo to be shown on the front instead of the individual program logo. Since 2011, online issues of The Earth Observer have been available in color. A redesign in 2019 included the new logo and tagline for the 30th anniversary; the logo was removed and the tagline tweaked in 2020. The final print issue was published in May 2024. The Earth Observer began publishing content online Summer 2024 The last photo in the series shows the home page for The Earth Observer’s website as of December 2025, which will remain accessible after 2025 as a historic archives. Credit: Mike Marosy/NASA’s Goddard Space Flight CenterThe history of The Earth Observer is intimately intertwined with the development of EOS; it is difficult to speak of one entity without discussing the other. Over the years, as EOS grew from an idea into actual spacecraft and instruments launching and flying in space, the newsletter began chronicling their journey. Early issues of The Earth Observer describe – often in meticulous detail – the meetings and deliberations during which the EOS concept evolved through various revisions and restructuring before the first EOS mission took flight. In the end, NASA launched three mid-sized “flagship” missions (about the size of a small bus) that became known as Terra (1999), Aqua (2002), and Aura (2004) and complemented their measurement capabilities with numerous other small-to-mid-sized missions. The result is the Earth-observing fleet in orbit above us today. Many of these missions fly in polar, low Earth, or geosynchronous orbit, while several others observe the Earth from the perspective of the International Space Station (ISS) – see Figure 2.
EOS missions are known for their longevity; many missions (and their follow-ons) have long outlived their anticipated life cycle. Each of these missions beam back reams of raw data that must be processed and stored so that it can be accessed and used as input to computer models and scientific studies to understand past environmental conditions, place our current situation in the proper context, and make predictions about the future path our planet could follow.
To view this video please enable JavaScript, and consider upgrading to a web browser that
supports HTML5 video
During its nearly 37-year run, The Earth Observer has borne witness to the successes, failures, frustrations, and advancements of EOS, and of the broader Earth Science endeavors of NASA and its domestic and international partners. Given that publication of this final content marks the end of an era, the newsletter team felt it appropriate to offer some perspective on the newsletter’s contribution. The feature that resulted focuses on the relationship between The Earth Observer and EOS – with specific emphasis on our reporting on satellite missions. See the online article, The Earth Observer: Offering Perspectives from Space Through Time, to learn more.
One of the final items published focuses on Terra, the first EOS flagship, which launched into the night sky on Dec. 18, 1999 from Vandenberg Space Force [then Air Force Base (VSFB)] in California on what was designed as a six-year mission of discovery. Terra’s payload included five instruments – Advanced Spaceborne Thermal Emission and Reflection Radiometer (ASTER), Clouds and the Earth’s Radiant Energy System (CERES), Measurement of Pollution in the Troposphere (MOPITT), Multi-angle Imaging SpectroRadiometer (MISR), and Moderate Resolution Imaging Spectroradiometer (MODIS) – intended to collect data that would fill in gaps in our knowledge of the Earth System (as it stood on the cusp of the 21st century). In particular, the satellite gathered information about how land interacts with the atmosphere on a regional and continental scale. The mission also focused on measuring key planetary characteristics needed to understand Earth’s changing environment (e.g., albedo, roughness, evaporation rate, and photosynthesis). The goal was to provide a holistic approach to address larger scientific questions. For more than 26 years, Terra has trained her five instruments toward Earth and gathered data to address wildfires, flooding, hurricanes, and polar ice.
As 2020 drew to a close, in order to conserve enough fuel for the end of the mission, NASA Headquarters decided it was time to for Terra to stop conducting the periodic maneuvers to maintain its 10:30 AM equator crossing. After ceasing maneuvers, the satellite began to drift, which Terra (and the other flagships) have done for the past few years. As Terra’s life draws to a close, it continues to ignite the imagination of the next generation of scientists to catapult the study of our planet for generations to come. Refer to the article, Terra: The End of an Era, to learn more about the feat of engineering that has kept the satellite gathering data two decades past the end of its “Prime Mission” and the key scientific achievements that have resulted.
Since 1997, six CERES instruments have been launched on the EOS and the Joint Polar Satellite System (JPSS) platforms, including the Tropical Rainfall Measuring Mission (TRMM), Terra [2], Aqua [2], the Suomi National Polar-orbiting Platform (Suomi NPP), and the Joint Polar Satellite System–1 (JPSS-1, now named NOAA–20) missions, and used to study Earth’s radiation budget (ERB) – the amount of sunlight absorbed by Earth and the amount of infrared energy emitted back to space – that has a strong influence on climate. Researchers pair measurements from CERES instruments with information gathered from other sources to clarify ERB. While the latency of CERES data prevents it from being used for weather forecasting directly, the information on ERB can be used to verify the radiation parameterization of computer models used to make weather forecasts and predictions about future climate conditions. The ERB data can also be applied to other science research and applications that benefit society. As an example, researchers have used this data to accurately detail changes in the movement of energy from Earth – especially the role that clouds and aerosols play in Earth’s energy budget. The CERES Science Team has a long history of recording proceedings of their meetings in The Earth Observer. It is thus appropriate that a CERES STM summary should be among the last items published this newsletter. Read more about the current status of CERES in space in the article, The State of CERES: Updates and Highlights.
The CERES STM also includes an update on the Polar Radiant Energy in the Far InfraRed Experiment (PREFIRE) mission, which publicly released its data products in June 2025. PREFIRE measurements are being used to quantify the far-infrared spectrum beyond 15 mm – which accounts for over 50% of the outgoing long wave radiation in polar regions. Additionally, the atmospheric greenhouse effect is sensitive to thin clouds and small water vapor concentration that have strong far infrared signatures. PREFIRE consists of two shoebox-sized CubeSats, which launched into near polar orbits on separate Rocket Lab Electron rockets from New Zealand in May and June of 2024. Each CubeSat has a miniaturized infrared spectrometer onboard covering 5 to 53 mm with 0.84 mm sampling and a planned operational life of one year. A complete infrared emission spectrum will provide fingerprints to differentiate between several important feedback processes (e.g., cloudiness and water vapor) that leads to Arctic warming, sea ice loss, ice sheet melt, and sea level rise.
NOAA and NASA have partnered in many endeavors together. The Earth Observer has reported on these collaborations over the years. One well known example is the two agency’s partnership to develop and launch the Geostationary Operational Environmental Satellites (GOES). This mission has become the backbone of short-term forecasts and warnings of severe weather and environmental hazards. The first satellite, GOES-1, launched in 1975; the most recent, GOES-19, launched in 2024. The technology onboard has improved exponentially over the past five decades. The article, Sentinels in the Sky: 50 Years of GOES Satellite Observations, describes this progression, highlights some of the data obtained, and provides insights into each of these incremental advancements over the past 50 years in this satellite series.
Turning now to another recent launch, the Plankton, Aerosol, Cloud, ocean Ecosystem (PACE) satellite continues to operate nominally. The data PACE returns allow the scientific community to explore the Earth’s ocean, atmosphere, and land surfaces. In February 2025 (10 days prior to the first anniversary of the mission’s launch), the PACE community gathered at NASA’s Goddard Institute for Space Studies (GISS) for the PAC3 meeting, which was so named because it combined three PACE-related activities: the PACE Postlaunch Airborne eXperiment (PACE–PAX), the third PACE Science and Applications Team (SAT3), and the PACE Validation Science Team (PVST). The PAC3 meeting included updates on the three instruments on PACE: the Ocean Color Instrument (OCI), the Hyper-Angular Rainbow Polarimeter–2 (HARP2), and the Spectropolarimeter for Planetary Exploration (SPEXone).
In addition to reporting on PACE, participants during the meeting gave updates on the latest news about the Earth Cloud Aerosol and Radiation Explorer (EarthCARE) observatory, including preparation for validation activities as part of the joint efforts of the European Space Agency (ESA) and Japan Aerospace eXploration Agency (JAXA). The article also details operational highlights, including validation and aerosol products and cloud products. Several Science and Applications Team (SAT3) groups presented results from studies using PACE data and PACE validation studies. The PACE Science Team will continue to monitor Earth and have identified strategies to continue the long-term data calibration and algorithm refinement to ensure the ongoing delivery of information to the research community. The article, Keeping Up with PACE: Summary of the 2025 PAC3 Meeting, provides a full summary of this event.
On Nov. 16, 2025, the Sentinel-6B mission launched from VSFB. The newest satellite in NASA’s Earth observing fleet measures sea levels with an accuracy of one inch every second, covering 90 percent of the oceans every 10 days. It will also contribute the record of atmospheric temperature and humidity measurements. These data are beneficial in observing movement of surface currents, monitoring the transfer of heat through the oceans and around the planet, and tracking changes in water temperature. Sentinel-6B will carry several instruments on this mission, including a radar altimeter, an advanced microwave radiometer, and a radio occultation antenna. The satellite’s observations will be paired with information from other spacecraft to provide detailed information about Earth’s atmosphere that will contribute high-resolution data for computer models to improve weather forecasting.
Sentinel-6B is another shining example of successful collaboration between NASA and NOAA, along with several European partners – ESA, the European Organisation for the Exploitation of Meteorological Satellites (EUMETSAT), Centre National d’Études Spatiales (CNES), and the European Commission.
Sentinel-6B has publicly released an image showing some of its first observations since launch. The map shows sea levels across a vast stretch of the eastern seaboard and Atlantic Ocean – see Figure 3. The image combines data from Sentinel–6B and its “twin” Sentinel-6 Michael Freilich, which launched in 2020. The data were obtained on Nov. 26, 2025 – just ten days after Sentinel-6B launched.
Figure 3. Sentinel-6B (S6B) and Sentinel-6 Michael Freilich (S6MF) captured data on Nov. 26, 2025 of sea levels across a vast stretch of the Atlantic Ocean. Within the crisscrossing bands, red indicates higher water height relative to the long-term average; blue indicates lower water height. The tracks are layered atop the combined observations of all available sea-level satellites. S6MF currently serves as the “reference” mission, allowing data from all other altimeters to be accurately combined into maps like this one. Credit: EUMETSATTogether, Sentinel-6B and Sentinel-6 Michael Freilich make up the Copernicus Sentinel-6/Jason- Continuity of Service (CS) mission developed by NASA, ESA, EUMETSAT, and NOAA. Sentinel–6/Jason CS continues a series of ocean surface topography missions that began three decades ago with the NASA/CNES Ocean Topography Experiment (TOPEX)/Poseidon mission. The article, Sentinel-6B Extends Global Ocean Height Record, provides an overview of this latest addition to the NASA and to the international Earth observing fleet.
The July–Sept. 2025 posting of “The Editor’s Corner” reported on the successful launch of the joint NASA–Indian Space Research Organization (ISRO) Synthetic Aperture Radar (NISAR) mission on July 30, 2025 from the Satish Dhawan Space Centre on India’s southeastern coast aboard an ISRO Geosynchronous Satellite Launch Vehicle (GSLV) rocket 5. Soon after launch, NISAR entered its Commissioning phase to test out systems before science operations begin. A key milestone of that phase was the completion of the deployment of the 39-ft (12-m) radar antenna reflector on Aug. 15, 2025. A few days later, on Aug. 19, 2025, NISAR obtained its first image and on Nov. 28, 2025, ISRO made the image (and others) publicly available – see Figure 4.
Figure 4. The first NISAR S-band Synthetic Aperture Radar (SAR) image, acquired on Aug. 19, 2025, captures the fertile Godavari River Delta in Andhra Pradesh, India. Various vegetation classes (e.g., mangroves, agriculture, arecanut plantations, aquaculture fields) are clearly seen in the image, which highlights the ability of NISAR’s S-band SAR to map river deltas and agricultural landscapes with precision. Credit: ISRODuring the Commissioning phase, the S-band Synthetic Aperture Radar (SAR) has been regularly obtaining images over India and over global calibration-validation sites in various payload operating configurations. Reference targets such as Corner reflectors were deployed around Ahmedabad, Gujarat and a few more locations in India for calibration. Data acquired over Amazon rainforests were also used for calibration of spacecraft pointing and images. Based on this, payload data acquisition parameters have been fine-tuned resulting in high-quality images. The initial images have scientists and engineers excited about the potential of using S-band SAR data for various targeted science and application areas like agriculture, forestry, geosciences, hydrology, polar/Himalayan ice/snow, and oceanic studies.
NISAR has not one but two radars onboard. The S-band radar, described above, is India’s contribution to the mission; the L-band radar is NASA’s contribution. The L-band radar has also been active during the first few months of NISAR’s mission acquiring images of targets in the United States. Karen St. Germain [NASA HQ—Director of Earth Science Division] gave the opening presentation on the Hyperwall at NASA’s exhibit during the Fall 2025 meeting of the American Geophysical Union (AGU) in New Orleans, LA on Dec. 15, 2025. Her presentation, which can be viewed on YouTube, has a section on NISAR (beginning at the 5:33 time stamp) and includes several examples of novel applications made possible by NISAR’s L-band SAR imaging capabilities.
During her AGU presentation, St. Germain also showed recent examples of data from the Surface Water Ocean Topography (SWOT) mission [at timestamp 0:03 on the YouTube video], highlighting its surface water mapping capabilities, and from PACE [at timestamp 3:34], highlighting its aerosol and biological monitoring capabilities. These missions not only detect aerosol plumes and phytoplankton blooms but are also able to tell what type they are. She briefly mentioned the Sentinel-6B launch [see timestamp 14:02], teasing her presentation at the Town Hall meeting to be held the next day, where she officially unveiled the Sentinel-6B “first light” image shown as Figure 2 in this editorial.
To conclude, The Earth Observer staff claims a moment of editorial privilege. In a way, we conclude where The Earth Observer began, by sending a “personal message” to all the scientists, engineers, educators, and others – both past and present – who have contributed to EOS and other NASA Earth Science programs that have been covered in this newsletter.
We would like to thank all of the NASA and other leaders, team members, scientists, technicians, students, and staff who have shared your stories over the decades. This publication would not have been the success that it was for so many years without the sustained contributions of the NASA and broader Earth Science community. To all those who volunteered their time to contribute to The Earth Observer over the years, offering your reviews, your subject matter expertise, and your collaboration, we say, “Thank you.” It has been an utmost pleasure to be at the forefront of reporting on the emerging results from your endeavors and bringing this information to the EOS community. We wish you all the best in whatever comes next. While we are saddened to lose the opportunity to continue to share your successes with the Earth Science community via The Earth Observer, we will continue to cheer on your effort and look for future opportunities to publicize your successes however we can.
Alan Ward
Executive Editor of The Earth Observer
Barry Lefer
Associate Director of Research, Earth Science Division
The State of CERES: Updates and Highlights
42 min read
The State of CERES: Updates and HighlightsIntroduction
The Clouds and the Earth’s Radiant Energy System (CERES) was initially designed in the late-1980s and early-1990s as a facility instrument for NASA’s Earth Observing System (EOS). Since its inception, NASA’s Langley Research Center (LaRC) has led this effort. CERES has a long history with seven different instruments flying on five different missions since 1997. As of today, six CERES instruments remain in orbit – two are no longer operational: the Proto-Flight Model (PFM) unit flew on the Tropical Rainfall Measuring Mission (TRMM) and functioned for a brief period, and FM2, which was powered-off in January 2025 due to battery constraints on Terra. The active CERES instruments are found on Terra (FM1), Aqua (FM3 and 4), the Suomi National Polar-orbiting Partnership (Suomi NPP) (FM5), and the first Joint Polar Satellite System (JPSS-1) mission, now known as NOAA-20 (FM6). Suomi NPP and the JPSS mission are partnerships between the National Oceanic and Atmospheric Administration (NOAA), which owns the satellites, and NASA, which operates them.
The CERES Team has maintained a history of its Science Team (ST) Meetings, recorded in The Earth Observer. The first CERES STM to be mentioned in the newsletter was the third meeting [Jan. 1990, 2:1, 7], which was listed on the “EOS Calendar.” The earliest full STM summary captured events from the seventh meeting in Fall 1992, CERES Science Team [Jan.–Feb. 1993, 5:1, 11–16]. Since then, the periodic reports (typically spring and fall) have kept readers up to date on the status of the CERES instruments in orbit and the science results from the data gathered. With such a long history of published meeting summaries, it seems fitting that a report on the state of CERES should be among the last articles published by The Earth Observer.
The most recent CERES contribution to The Earth Observer was the article, Update on the State of CERES and Highlights from Recent Science Team Meetings [Sept.–Oct. 2023, 35:5, 43–53]. Since that time, CERES has held four STMs – bringing the total to 42. Norman Loeb [LaRC—CERES Principal Investigator (PI)] hosted all the meetings.
The four most recent meetings were:
- The 39th CERES STM (Fall 2023) at the NASA Goddard Institute for Space Studies (GISS) in New York, Oct. 17–19, 2023.
- The 40th CERES STM (Spring 2024) at LaRC in Hampton, VA, May 14–16, 2024.
- The 41st CERES STM (Fall 2024) at Lawrence Livermore National Laboratory in Livermore, CA, Oct. 1–3, 2024; and
- The 42nd CERES STM (Spring 2025) at LaRC, May 13–15, 2025.
A Fall 2025 meeting had been scheduled at LaRC from Oct. 28–30, 2025, but was cancelled due to the Federal Government shutdown. Planning is underway for another meeting to be held in Spring 2026.
This article will focus on the Fall 2023 and Spring 2024 meetings – drawing primarily from the State of CERES presentation, programmatic content, and mission and instrument status reports delivered at those meetings. The sections on the State of CERES and Invited Presentations also include content from the Fall 2024 and Spring 2025 meetings. The contributed presentations from these latter meetings are not included in this article. For more details, the reader is directed to the CERES website where agendas and links to individual presentations can be found for all four meetings.
The content in this article includes updates on the status of the platforms that carry CERES instruments, CERES data products and algorithms, and CERES outreach activities. The remainder of this article will consist of summaries of the invited science presentations given at these meetings, followed by selected science presentations. More information on the topics briefly mentioned in the summary from the meetings is contained in the respective presentations, which are available on the CERES website.
State of CERES
The State of CERES message is a long-standing tradition, opening the CERES STMs. At the beginning of each meeting, Norman Loeb outlined the major objectives of this group, which remained consistent from meeting to meeting. These objectives include host satellite health, instrument calibration updates, algorithm and validation status from the various Working Groups, and progress toward the next CERES reprocessing.
Loeb began the Fall 2023 meeting by reviewing the large increase in global mean surface temperature based on the European Centre for Medium-Range Weather Forecasts Reanalysis (ERA5) model Version 5 (V5) in 2023. The highest anomaly was reported in September 2023 for the period from 1979 to 2023. The CERES absorbed solar radiation (ASR) – a measure of the difference between incoming solar energy and the energy reflected back into space – exceeded the 90% confidence interval anomaly for March through September 2023 except for May, which does not quite exceed it. The net radiation also exceeded the 90% confidence interval through May of 2023. Starting in June 2023, the Outgoing Longwave Radiation (OLR) exceeded the negative 90% confidence interval, indicating a release of energy out of the atmosphere; however, the net radiation dropped below the 90% confidence interval for the remainder of the year. The 2023 value even exceeded the 2016 El Niño event. The extremely large ASR and OLR values continued into early 2024.
The CERES Terra FM2 operated in Rotating Azimuth Plane (RAP) mode until it failed in January 2025. After that, Terra FM1 switched to RAP mode during Terra’s drifting period. Aqua FM3 likewise operates in RAP mode as Aqua has drifted. This mode allows for capturing data at a larger range of solar zenith angles. For 48 months, the Suomi NPP FM5 has collected rotating-azimuth data; it returned to Cross-track Mode in October 2023. The team noted a small amount of noise periodically detected on the NOAA-20 FM6 shortwave (SW) channel from November 2023 through February 2024. This noise was only observable during space view when the counts approached zero. Several analyses on Earth-viewing footprints could not identify any impact on the SW radiance.
Loeb highlighted some other efforts that are of interest to the group. The World Climate Research Programme (WCRP) started a lighthouse activity on Explaining and Predicting Earth System Change (EPESC) with a focus on understanding and predicting the Earth Energy Imbalance (EEI). This work exemplifies another effort – CERES Model Intercomparison Project (CERESMIP) experiments – that was championed by GISS. The goal is to provide a larger overlap of model output with CERES observations than the earlier Coupled Model Intercomparison Project Phase 6 (CMIP 6), which only observed forcing through 2014 and projected forcing after 2014. Examples of these forcings are Sea Surface Temperature (SST), sea ice concentrations, aerosol and volcanic emissions, and solar irradiance. Climate variability since 2014 is quite pronounced, including EEI, SST trends, Pacific Decadal Oscillation shift, and El Niño events.
During the Fall 2024 meeting, Loeb discussed the impacts of the shifting Terra Mean Local Equatorial Crossing Time. He explained that the SW Top of Atmosphere (ToA) flux difference between NOAA-20 and Terra are smaller in the Northern Hemisphere than the Southern Hemisphere due to closer observation times. The longwave (LW) flux difference is smaller between hemispheres. The CERES team has been collaborating with the European Space Agency’s Earth Cloud, Aerosol and Radiation Explorer (EarthCARE) project to compare results from its Broadband Radiometer (BBR) with those from CERES. Early results showed that EarthCARE’s BBR SW channel is 8% brighter than CERES, and the LW channel is very consistent with CERES – with the possible exception of very cold scenes being colder than CERES. At the May 2025 meeting, Loeb announced that a 25-year Earth Radiation Budget (ERB) record – from March 2000 to February 2025 – has been established.
Bill Smith, Jr. [LaRC] continued the presentation with a review of the progress of the CERES Edition 5 clouds algorithms. This presentation examined the status of balancing the three goals of this effort. He noted the need for consistency between the derived cloud products from the Moderate Resolution Imaging Spectroradiometer (MODIS) on Terra and Aqua and the Visible Infrared Imaging Radiometer Suite (VIIRS) on Suomi NPP and NOAA-20 – especially given the differences in the bands on each instrument. In addition, he discussed the consistency between three generations of geostationary imagers that cover the 25 years in both timeline and across the globe. CERES uses data from NOAA’s Geostationary Operational Environmental Satellites (GOES 9–18); the European Organisation for the Exploitation of Meteorological Satellites’ (EUMETSAT) Operational Meteorological Satellites (Meteosat 5–11); and the Japanese Meteorological Agency’s (JMA) Geostationary Meteorological Satellite (GMS 5), Multifunction Transport Satellite (MTSAT 1R and 2), and Himawari 8 and 9. Finally, Smith presented the accuracy of this approach compared to observations from Cloud-Aerosol Lidar with Orthogonal Polarization (CALIOP) on the Cloud-Aerosol Lidar and Infrared Pathfinder Satellite Observations (CALIPSO) mission.
In his presentations during the Fall 2024 and Spring 2025 meetings, Smith demonstrated improvements with the Edition 5 algorithm showing consistent cloud fraction between MODIS on Aqua and VIIRS on NOAA-20 – with the ocean values being within 2% for both day and night. He noted that additional work still needs to be done for land and polar night. A comparison with CALIPSO data showed that daytime cloud fraction measurements from VIIRS on NOAA-20 are more consistent than those from MODIS on Terra and Aqua. The Edition 5 nighttime algorithm fixes the overestimates in cloud fraction for high clouds, but still underestimates low clouds [below 3 km (1.9 mi)] by 10%. The geostationary imager-derived clouds common three-channel algorithm has better consistency between satellites and day and night cloud fraction. Smith also added that there are some discrepancies in cloud optical depth and particle size between the European Meteosat imager and the other geostationary satellites. The use of the K-D tree algorithm has improved consistency at night with the day cloud properties.
Wenying Su [LaRC] explored how fluxes may change if the Angular Distribution Models (ADMs) are created in different weather patterns (i.e. during El Niño and La Niña events). Two sets of Terra CERES ADMs were produced – one using 24 El Niño months and the other using 24 La Niña months. The global differences between SW fluxes composed from these two sets of ADMs were 0.5 Wm-2 regardless of the period (e.g., El Niño, La Niña, or neutral phase) and showed the same regional difference patterns. Su also explained how to partition the ToA SW fluxes from CERES into visible and near-infrared (NIR) fluxes. She showed how to use spectral radiances generated using look-up tables (LUT) from the MODerate resolution atmospheric TRANsmission (MODTRAN) code and spectral radiances measured by the VIIRS imager to separate the spectrum – see Figure 1. A ratio between the modeled visible band and CERES SW radiance is derived using the LUT. For water clouds, the visible band has the highest albedo due to cloud absorption being near zero. The NIR albedo is much lower than visible band due to high cloud absorption. For ice clouds, the two albedos are closer because ice clouds are more reflective in NIR than the visible band and there is less water vapor absorption above the cloud.
Figure 1. Using spectral radiance measurements generated using look-up tables (LUT) produced by the MODerate resolution atmospheric TRANsmission (MODTRAN) model and spectral radiances measured directly by the Visible Infrared Imager Radiometer Suite (VIIRS), top of atmosphere shortwave fluxes from CERES can be partitioned into monthly gridded instantaneous visible (VIS) [top left] and near-infrared (NIR) [top right] albedo, CERES derived cloud fraction [bottom left], and cloud optical depth from Suomi NPP VIIRS data for context [bottom right]. Figure credit: Su et al., 2024Lusheng Liang [LaRC, Analytical Mechanics Associates (AMA)] discussed the creation of ADMs using additional RAPS data from November 2021 (when Terra started drifting from the Mean Local Time Equatorial crossing of 10:30 AM) to April 2024. This period of observations provided data obtained at a solar zenith angle that is approximately 10° higher in the tropics than was observed during the initial period used for ADM development. New ADMs developed using data from this period have the largest impact for clear sky overland and cloudy sky over ocean versus clear sky over ocean and cloudy sky over land. Liang has also worked to improve the unfiltering coefficients, using the latest version of MODTRAN 5.4, Ping Ying’s cloud properties, two additional view zenith angles, seven additional solar zenith bins, and MODIS BRDF kernels over land and snow. The application of these changes to SW and LW from total minus SW resulted in a -0.30 and 0.30 W/m2 respectively for July 2019. Since NOAA-20’s FM-6 instrument has a LW channel, the team made an effort to reduce the differences between the LW channel from the total channel minus the SW channel. They also created a correction using warmer temperatures for the model over desert areas and cooler temperatures over vegetated land.
Dave Doelling [LaRC] presented a method to compare data from two ERB instruments in the same orbit, such as CERES on NOAA-20 and Libera on JPSS-4. This method is necessary without data from Terra. This approach used the invariant target of Libya-4. He compared the results using CERES instruments on Suomi NPP and NOAA-20. He added a second target to this analysis: Deep Convective Clouds that have cloud tops below 220 K located in the Tropical Western Pacific. Another approach placed the CERES instrument in a scan mode, matching the view zenith of the geostationary orbiting satellites (i.e., Terra FM2, Aqua FM3, and Meteosat-11). The geostationary imager radiances were used to determine the broadband LW flux, which was compared to the CERES-observed LW flux. The regression of these matched pairs of radiances showed that the Terra and Aqua CERES LW regression are within 0.2%. A machine learning approach to determine LW broadband flux from geostationary satellite imager radiance data showed a 75% decrease in bias and a 9% decrease in Root Mean Square Error over the multi-linear regression approach used in Edition 4. Doelling used a similar approach when working with data from the VIIRS imager, using radiance measurements to assign LW and SW fluxes to the cloud layers in the CERES footprint. When normalizing the individual portion of the footprint to the observed CERES data, the global bias is less than 1 W/m2.
In the Spring 2025 meeting, Doelling reported on the small change in monthly global variables from using MERRA-2 instead of GEOS 5.4.1 reanalysis in production of the Single Scanner Footprint (SSF) one degree and Synoptic one degree based on a minimum of a year overlap. He also highlighted the changes in the next version of SYN1deg Edition 4B. These changes included reprocessing of the three two-channel satellites (GMS-5, Met-5, and Met-7), using interpolated cloud retrievals over twilight hours (solar zenith > 60º), and transition to using data from NOAA-20 only and MERRA-2 reanalysis after March 2022.
Seung-Hee Ham [Analytical Mechanics Associates/LaRC] reported the availability of instantaneous Terra and Aqua CERES computed fluxes at the surface and ToA on a 1° equal angle grid [CERES Cloud and Radiative Swath (CRS1deg-Hour)] from January 2018 to December 2022. The algorithm changes to the Edition 5 Fu-Liou radiative transfer calculations reduced the LW ToA flux bias to less than 0.5 W/m2 from around 2 W/m2 with Edition 4.
Ham also discussed plans to increase the number of bands (from 18 to 29) in the Fu-Liou radiative transfer calculations and the corresponding shift in wavelength cut-off used for the bands. Nine gas species will now be used in Edition 5 for each band instead of the maximum of four species used in only one band currently. The line-by-line gas database has also been updated. These changes have less than a 2 W/m2 change in the SW and LW broadband fluxes between Edition 4 and 5, but line-by-line results show better performance.
Seiji Kato [LaRC] evaluated the computed irradiance trends at the ToA, surface, and within the atmosphere. At ToA for all-sky conditions, SW flux has been increasingly adding energy. Conversely, LW flux has been removing the additional energy, but at a smaller rate leading to an overall increase in net energy. At the surface for all-sky conditions, SW flux has been increasing energy, while LW flux has been decreasing at almost the same rate. As a result, there has been a small net increase. Within the atmosphere, the SW flux has increased more than the LW flux, but they are both positive. The global all-sky mean aerosol direct radiative effect from the synoptic one-degree (SYN1deg) was -2.2 W/m2, which was just below the -2.0 W/m2 mean from previous studies.
Paul Stackhouse [LaRC] presented the impact of transitioning the meteorology used in Fast Longwave and SHortwave Flux (FLASHFlux) to the Goddard Earth Observing System–for Instrument Teams (GEOS-IT) product. The global mean difference was less than 0.5 W/m2 in LW daytime surface downward flux, but the zonal bias can reach an absolute value of 5 W/m2 – see Figure 2.
Figure 2. Global annual mean Top of Atmosphere radiative flux changes between 2022 and 2023 for [top], outgoing longwave radiation and [bottom], and reflective shortwave radiation. Figure credit: Stackhouse et al., 2024The Global Learning and Observation to benefit the Environment (GLOBE) clouds team ran Eclipse Challenges during the October 2023 annular and April 2024 total solar eclipses. During each event, citizen scientists were encouraged to collect temperature and cloud measurements before and after the eclipse. The participants collected 34,000 air temperature measurements (which is 2.3 times the average number of observations) and 10,000 (13 times average) cloud measurements for both events. The cloud data showed a decrease in cloudiness as the eclipse approached and an increase after, but contrails showed a steady increase. The data also showed a noticeable decrease in air temperature at the local eclipse maximum.
Invited Science Presentations
The CERES STM typically invites two presentations at each meeting. The summaries for these presentations appear here in chronological order. The Fall 2023 presenters looked at responses to greenhouse gas (GHG) radiative forcing. The Spring 2024 presenters explored the Earth’s hemispheric albedo symmetry and the impact of aerosol changes on the cloud radiative effect (CRE). The Fall 2024 presenters discussed preparation of forcing datasets for CMIP 7 and cloud feedback in models. The Spring 2025 presenters explored trends in spectral radiances and the radiative forcing pattern effect.
Ryan Kramer [NOAA, Geophysical Fluid Dynamics Laboratory] explored the decomposition of the EEI as a tool for monitoring climate change. Kramer explained a Making Earth Systems Data Records for Use in Research Environments (MEaSURE) effort to pull together records from multi-instruments needed for decomposition of radiation forcing and radiative feedback from temperature, water vapor, ToA flux, surface albedo, and CRE – see Figure 3. The portion of the total radiative imbalance not attributed to feedback is due to radiative forcing from LW flux, 0.27 W/m2. This result – supported by observations and by results from the Suite of Community Radiative Transfer codes based on Edwards and Slingo (SOCRATES) – used a radiation scheme created by researchers at the United Kingdom Meteorological (UKMet) Office, where the radiative forcing is caused by an increase in GHG. The atmospheric cooling is balanced with sensible and latent heat flux related to precipitation. Latent heating from precipitation is inversely correlated with atmospheric radiative change. Decomposed atmosphere radiative forcing and feedback showed how GHGs radiatively heat the atmosphere but mute the trend in global precipitation. The reduction of aerosol in China since the 2008 Summer Olympics has regionally increased the SW radiative forcing. This result provides an example of the impact of mitigation efforts. GHG forcing is stronger in the tropics due to larger concentrations of water vapor and decreases in extratropical regions.
Figure 3. Linear trends in shortwave radiative forcing from 2003 through 2018, demonstrating the direct radiative effect of changes in aerosols. Positive trends correspond to less shortwave reflection to space (more planetary absorption) over time. Estimated using Clouds and the Earth’s Radiant Energy System (CERES), Atmospheric Infrared Sounder (AIRS), and CloudSat observation. [Right] Linear trends in aerosol optical depth (AOD) from 2003 through 2018 from Moderate Resolution Imaging Spectroradiometer (MODIS). The AOD trends often mirror shortwave radiative forcing trends, as expected. A positive trend in shortwave radiative forcing (less reflection) stems from a negative trend in AOD. Figure credit: Kramer et al., 2021Susanne Bauer [GISS] examined aerosol and cloud forcing in relation to GHG forcing. Early in the twentieth century, data show aerosols counterbalanced 80% of the GHG forcing, but aerosols began to decrease at the start of this century, reducing their impact to 15% today. The direct aerosol forcing follows the mean aerosol optical depth. It reached the maximum impact in 1977 but has decreased slightly since then. The indirect aerosol forcing is four times larger than the direct forcing and reached its peak in 2007. GISS model version E.21 underpredicted the SW ToA trend and overpredicted the LW ToA – see Figure 4. The version E.3 model received a major upgrade in model physics, cloud microphysics, and turbulence scheme, resulting in substantial improvement modeling marine cirrus clouds, total cloud cover, and precipitable water vapor. The trend in LW ToA flux matches CERES in non-polar regions. While the SW all-sky trend shows improvement, it still underpredicts observations. For example, model aerosol is not picking up the biomass burning in Siberia, which seems to be an artifact of using an older emission data base for the study. The improved aerosol data results reveal a larger trend in cloud droplet number concentration compared to the observations gathered by the Terra satellite. These data remain consistent with the Precipitable Water Vapor trend.
Figure 4. The trend in shortwave clear sky radiation change at the top of the atmosphere over the 23-year time series, from 2001 to 2023, of the CERES datasets in units of W/m2 per decade. Clear sky conditions show changes in the energy budget that are not associated with clouds for [left] CERES dataset and [right] model data using the NASA GISS Model E3.1. Notable features include negative trends over China, Europe, and the Eastern United States, and a positive trend around India, in correspondence with cleaner aerosol conditions in the first three regions and still increasing pollution in India. Energy balance changes in the Arctic and Antarctic are associated with land and sea ice changes. Some of the positive and negative trends in Canada, Russia, Central and Southern Africa, and South America are strongly impacted by biomass burning patterns. Figure credit: Susanne Bauer/CERESMichael Diamond [Florida State University] discussed a proposed test to evaluate whether Earth’s hemispheric albedo symmetry can be maintained. Currently, the all-sky albedo is nearly equal in both hemispheres, but the ToA clear-sky albedo is much greater in the Northern Hemisphere than the Southern Hemisphere, due to the distribution of landmasses. The Southern Hemisphere is also brighter in the visible wavelength, but darker in near-infrared spectrum. This symmetry is unique.
If the Earth was arbitrarily broken up into hemispheres, less than one-third of these hemispheres would be balanced within 1 W/m2. The solar reflection is symmetric, but outgoing LW radiation is not – with less energy leaving the Southern Hemisphere. This global imbalance is reduced with interhemispheric transport through the ocean and atmosphere.
Diamond discussed potential physical mechanisms that could maintain this symmetry (e.g., cloud feedback, solar climate intervention, or hydrological cycles). He noted that surface aerosols and high clouds increase albedo in the Northern Hemisphere, whereas low and altostratus clouds increase albedo in the Southern Hemisphere. Earth’s strong hemispheric albedo asymmetry is transient, which should allow for “natural experiments” to test the mechanism to maintain the symmetry. He discussed the moderate but long-term test for the loss of Arctic sea ice from 2002 to 2012, as well as the decline in clear-sky atmospheric reflection due to air pollution over China that peaked in 2010 and declined in 2019. He also discussed more abrupt changes, including the post-2016 decline in Antarctic sea ice, the decrease in Northern Hemisphere low cloud reflection caused by sulfur fuel regulation as enacted by the International Maritime Organization in 2020, the decreased Northern Hemisphere aerosol concentration following activity restrictions during the COVID-19 pandemic, the increased Southern Hemisphere aerosol concentration during the bushfires in Australia between 2019 and 2020, and the increased Northern Hemisphere aerosol concentration reflection following the Nabro volcanic eruption in 2011 – see Figure 5. Despite these multiple events, the expected change in clear-sky albedo from the surface or aerosol change seems to be masked in the all-sky albedo through simultaneous changes in cloud reflectivity. Many of these events overlap, which complicates how to interpret the results.
Figure 5. During the extreme 2019–2020 Black Summer bushfires in Australia, pollution levels over the Southern Ocean (as measured by aerosol optical depth, or the amount of light scattered and absorbed by pollution particles in the atmosphere) reached their highest values in approximately 20 years of monitoring by NASA’s Moderate resolution Imaging Spectroradiometer (MODIS). Figure credit: Diamond et al., 2024Daniel McCoy [University of Wyoming] discussed his investigation of uncertainty in cloud radiative feedback in climate forcing due to changes in aerosols. At this time, extratropical cloud feedback has an uncertainty of over 2.5 W/m2. Pollution leads to an increase in aerosol concentration, which impacts cloud formation and changes the droplet number concentration. This increase results in changes to the cloud coverage and amount of liquid water content in the clouds – see Figure 6. The work of McCoy and his colleagues has constrained the change in droplet number and liquid water content with the hope of narrowing the effective radiative forcing from aerosol–cloud interaction. Using results from the Community Atmosphere Model (CAM) 6 and observations, they were able to constrain the range of possible droplet number concentration by 27% and liquid water content by 28%. These constraints reduced the effective radiation forcing to 2%. McCoy argued that this small impact is due to the interaction between precipitation efficiency and radiative susceptibility through changes in the Liquid Water Path (LWP), which results in buffering of the radiative effect by reduced radiative sensitivity.
Figure 6. Water vapor path from the Morphed Integrated Microwave Imagery at CIMSS–Total Precipitable Water (MIMIC–TPW) product showing transient eddies moving moisture from the tropics to the extratropics. The relationship between moisture transport, precipitation, and albedo acts to set large-scale Earth system behavior. Figure credit: Development of the MIMIC-TPW2 product is supported by the Joint Polar Satellite System (JPSS) Risk Reduction Program and the Office of Naval Research.David Paynter [Geophysical Fluid Dynamics Laboratory (GFDL)] explored the spectral dimension of recent changes in ERB. The atmospheric state, temperature, and gas species, from each level in a grid box are used in a line-by-line (LBL) radiative code to calculate the spectra. The two codes used are the NOAA GFDL GPU-enabled Radiative Transfer (GRT) and the Reference Forward Model (RFM) from Oxford University. Paynter and colleagues used a LW radiation solver to get ToA fluxes. They then compared the monthly mean spectrally resolved ToA fluxes using ERA5 inputs for 2003 to 2021 to Atmospheric Infrared Sounder (AIRS) observations. Paynter showed that there is generally good agreement between all-sky AIRS climatology and the LBL calculations, and similar spectral trends; however, some bands have larger differences in the trend. The all-sky OLR between the LBL-ERA5, CERES, and AIRS show consistent positive trends between 0.15 to 0.31 W/(m2/decade); however, the LBL-ERA5 0.11 W/(m2/decade) and the CERES -0.15 W/(m2/decade) show disagreement.
David Thompson [Colorado State University/University of East Anglia] studied the pattern associated with ToA radiative response to changes in surface temperature. Historically, this has been accomplished by looking at the local radiative response due to local change in temperature or to global-mean temperature change. The first reflects a two-way interaction between the local radiative flux and local temperature that identifies areas that are changing. The second results are more difficult to interpret because the local response is multiplied by the same value. Thus, Thompson proposed a third method of evaluating the changes by using the global-mean radiative response to changes due to local changes in temperature. This approach identifies positive values with warm temperatures and downward radiative fluxes. The temperature variability over the Eastern Tropical Pacific contributes to positive values in the global internal feedback parameter. The reverse happens in the Western Tropical Pacific. Another advantage of this method is that the contribution of local feedback to the global feedback is easy to calculate. Using the CERES monthly-mean Energy Balanced and Filled (EBAF) data, the global weighted feedback is -1.1 W/m2 with global oceans contributing -0.2 W/m2 and global land -0.9 W/m2. The Eastern Tropical Pacific contribution is 0.1 W/m2 and the Western Tropical Pacific contribution is -0.1 W/m2. This approach can be applied to models to see which are representative of the observations. Preindustrial runs of the model generally reproduce the negative Western Tropical Pacific anomaly; however, Thompson noted that most models do not capture the positive anomaly in the Eastern Tropical Pacific.
Contributed Science Presentation
The following section provides highlights from the contributed science presentations. The content is grouped by Earth radiation instruments that are in development; new techniques for use in climate models and analysis of their results; applications of machine learning; and observational datasets and their analysis.
Future Earth Radiation Instruments
It should be noted that the information shared below reflects the mission plans at the time of the meeting. The mission goals may have changed as a result of changing budgets, agency priorities, and other factors.
Kory Priestly [LaRC] discussed the Athena Economical Payload Integration (EPIC) pathfinder mission using the NovaWurks Hyper Integrated Satlet small satellite platform that is integrated with a spare CERES LW detector and calibration module flight hardware. This setup was designed to test the novel building block approach to satellites as a potential path for the next ERB instrument at a reduced cost. [UPDATE: The Athena mission launched successfully on July 23, 2025. Unfortunately, after being released from the rocket the spacecraft started tumbling and could not be recovered.]
Tristan L’Ecuyer [University of Wisconsin–Madison] presented the science being answered by the Polar Radiant Energy in the Far InfraRed Experiment (PREFIRE) – see Photo 1. The instrument will quantify the far-infrared spectrum beyond 15 μm, which accounts for over 50% of the OLR in polar regions. Additionally, the atmospheric greenhouse effect is sensitive to thin clouds and small water vapor concentration that have strong far infrared signatures. PREFIRE consists of two CubeSats in near polar orbits. The instrument has a miniaturized infrared spectrometer covering 5 to 53 μm with 0.84 mm sampling and an operational life of one year. A complete infrared emission spectrum will provide fingerprints to differentiate between several important feedback processes (e.g., cloudiness and water vapor) that leads to Arctic warming, sea ice loss, ice sheet melt, and sea level rise. [UPDATE: The two PREFIRE CubeSats launched successfully in May and June of 2024, with first light images following in September 2024; public release of PREFIRE data products occurred in June 2025.]
Photo 1. NASA’s Polar Radiant Energy in the Far-InfraRed Experiment (PREFIRE) mission will measure the amount of heat Earth emits into space from two of the coldest, most remote regions on the planet. Photo credit: NASAPeter Pilewskie [Laboratory for Atmospheric and Space Physics (LASP)] announced that Libera will be integrated on Joint Polar Satellite System-4 (JPSS-4), which eliminates the need to remove JPSS-3 from storage. This change will affect the launch order. He also presented a comparison between the Compact Total Irradiance Monitor (CTIM) CubeSat and CERES observations. Pilewskie noted that CTIM uses the same Vertically Aligned Carbon Nanotube (VACANT) detectors that Libera will use. Even though CTIM is designed to measure Total Solar Irradiance, the spacecraft has been oriented to get Earth views during spacecraft eclipse with the Sun (nighttime). CTIM provides a ~170-km (105-mi) footprint – which is about eight times larger than that of CERES. The mean relative difference between CERES and CTIM matches are -1.8% varying between -1.5% for FM6 and 2.0% for FM1.
Climate Model Developments and Analysis
Paulina Czarnecki [Columbia University] introduced a method to use a small number of wavelengths to determine broad band radiative fluxes and heating rates as an alternative to the correlated K parameterization approach. It uses a simple optimization algorithm and a linear model to achieve accuracy similar to correlated K-distribution. The approach uses a small set of spectral points – 16 in the study – to predict the vertically resolved net flux within 1 W/m2 under clear-sky conditions.
Sean Cohen [Columbia University] addressed the impact of rising surface temperature on precipitation. This information is required to determine the relationship between hydrological sensitivity and radiative cooling sensitivity, where convective heating is balanced by radiative cooling. When carbon dioxide (CO2) increases, it masks changes in emission from water vapor, resulting in mean rainfall changes when atmospheric transmission changes at a rate of 2%/K. The “symmetry” of the water vapor spectral window causes atmospheric transmission to change at a near constant rate with the surface temperature. This hydrological sensitivity peaks at subtropical surface temperatures – see Figure 7.
Figure 7. A comparison of an ensemble of General Circulation Model results [faded lines] to predictions from the author’s pen-and-paper model under a constant carbon dioxide (CO2) concentration of 400 ppm (orange) and under varied CO2 concentration (black). The gray line shows the prediction from the source scaling. [Inset] The percent change in mean rainfall [hydrological sensitivity (HS)] with surface temperature as predicted by these same analytical models (same color labels). Figure credit: Cohen et al., 2025George Tselioudis [GISS] explored how shifts in the atmospheric zonal mean circulation changed the CRE. The poleward shift in the location of the Hadley Cell (with corresponding high clouds following it) occurred in both hemispheres; however, it produced SW CRE warming during North Atlantic winter, contrary to SW CRE cooling in both Southern Hemisphere summer and winter. The Southern Hemisphere high cloud shift does not reduce the total cloud amount that occurred in the North Atlantic. The jet stream shift only had an impact during North Atlantic winter. The LW CRE produced a dipole of warming at the previous and new Hadley Circulation positions. The magnitude of LW CRE changes increased with larger upward velocity changes. The SW CRE is dependent on both change in vertical velocity and stability (EIS). Based on these observational findings, Tselioudis evaluated the CMIP 5 and 6 results. Both model results showed lower midlatitude SW CRE warming, but CMIP 5 produced a larger dependence on the climatological Hadley circulation whereas CMIP 6 did not. CMIP 6 models are less dependent on vertical velocity than the earlier set, which allow them to produce Southern Hemisphere SW CRE warming.
Gregory Cesana [GISS] investigated the tropical stratocumulus and shallow cumulus SW feedback, which explains part of the spread in climate sensitivity in the CMIP 5 and 6 models. Observationally, inferred low-cloud feedback is driven by stratocumulus clouds with very little input from cumulus clouds. In the model, cloud type is determined from the mean low cloud fraction in the tropics. When the model cloud fraction is smaller, the cloud is assumed to be cumulus. When it is greater, the cloud is considered to be stratocumulus. CMIP 6 underestimates both low cloud types, but especially in the high stratocumulus regions along the western coasts of continents. Both models favor cumulus over stratocumulus regimes, but the bias for CMIP 6 is less than CMIP 5. The increased model stratocumulus is correlated with increased low-cloud feedback – see Figure 8. If the increased stratocumulus clouds in CMIP 6 matched observations, the mean low cloud feedback would have doubled to 0.7 W/m2 K.
Figure 8. [Left to Right] Maps of stratocumulus (Sc) and shallow cumulus (Cu) cloud feedback for [top to bottom] CALIPSO and CERES observations, the Climate Model Intercomparison Project model (CMIP 6), and CMIP 5 models. The means are given in the upper left corner of each map. The linear correlation coefficients between observations and CMIP 6 and CMIP 5 models are 0.39 and 0.20 for Sc, and 0.30 and 0.22 for Cu, respectively. Collectively, CMIP 6 models substantially improved depiction of Sc cloud feedback both in terms of mean and pattern correlation compared to CMIP 5, and also for Cu clouds to a lesser extent. Both models underestimate the magnitude of the positive feedback – and therefore the warming due to low clouds in response to climate change. Figure credit: Cesana et al., 2023Patrick Taylor [LaRC] explored the cloud–sea ice feedback mechanism – see Photo 2. He explained that results from CMIP 5 and 6 show the largest variation in climate projections in the Arctic – where surface albedo feedback is the biggest contribution to the inter-model differences. He evaluated the difference between ice-free and ice surfaces on either side of the marginal ice zone – a part of the seasonal ice zone ranging from 100- to 200-km (62- to 124-mi) wide that extends from the ice edge into the ice pack. The cloud property differences are strongly tied to the differences in thermodynamic profiles, whereas the ice edge (part that is over open water) has warmer, moister, and weaker lower tropospheric stability than the ice pack, leading to more positive turbulent surface fluxes at the ice edge. The feedback from surface properties and lower tropospheric thermodynamics profile are critical to sea ice loss. This sea ice–cloud feedback is positive in the fall and winter and negative in the spring.
Photo 2. Surface albedo is a measure of reflected sunlight from Earth’s surface. This measurement provides critical information for modeling Earth’s climate, particularly in polar regions; however, computer models struggle to simulate albedo. This photo gives some idea why. The terrain in the Arctic is highly variable, which, along with the heterogeneity in snow and/or ice cover on the surface, make surface albedo one of the most challenging physical variables to represent in climate models. Photo credit: Taylor et al., 2024Doyeon Kim [LaRC—NASA Postdoctoral Program] discussed factors that explain the current Arctic albedo and possible future changes in this region. She noted that the Arctic undergoes rapid warming during the summer with an accompanying decrease in surface albedo each year until it starts to increase again in the fall – see Figure 9. Researchers use the output from the Atmospheric Model Intercomparison Project (AMIP) and CMIP 6 to infer future changes to albedo. In her analysis, Kim decomposed surface albedo into five terms: sea ice albedo in ice region, sea ice concentration, albedo spatial variation, ice region, and albedo in ocean region. She explained that the ice albedo term drives most changes in AMIP where the ice concentration is held constant. Sea ice concentration and ice region terms become important for the CMIP 6 model where they can change.
Kim went on to look at the monthly averages of albedo, pointing out that March and September show large differences. The multimodal mean exhibits a large spread in the ice albedo. The CMIP 6 spread is significantly influenced by both seasonal and spatial variations. During the early summer months, the ice region term contributes to albedo spread across the Barents, Kara, and Laptev Seas and Greenland Sea. The ice albedo term during the late summer contributes to albedo in the East Siberian, Chukchi, and Beaufort Seas and Central Arctic Sea. A significant inter-model spread may be the primary factor that is contributing to the variability observed in Arctic warming across the different model simulations. Kim discussed the significant difference in surface albedo between CERES and the CMIP 6 models. Both ice fraction and ice albedo have a substantial effect on the model spread of albedo. Time series data indicate that sea ice albedo and concentration remain relatively unchanged in response to global warming while the ice region term decreases significantly.
Figure 9. Present-day Arctic surface albedo from the CMIP 6 multi-model mean (2001–2014) compared with Clouds and the Earth’s Radiant Energy System (CERES) observations. Panels (a–d) show CMIP 6 multi-model mean albedo for March, April–May, June–August, and September, while panels (e–h) show corresponding CERES retrievals. Figure credit: Doyeon Kim/NASA Langley Research CenterApplication of Machine Learning
Ben Scarino [LaRC, Analytical Mechanics Associates (AMA)] explored the consistency of skin temperature (i.e., temperature at the surface) and the temperature 2-m (6.5-ft) above the ground from reanalysis and satellite and ground observations, respectively. He reported that the Global Modeling and Assimilation Office (GMAO) does not assimilate either skin or ground temperature into their reanalysis, producing large biases in those values. Conversely, ERA5 does assimilate 2-m temperature in the reanalysis, which reduce variations by 1 K. The introduction of a Deep Neural Network (DNN) adjusts the reanalysis skin temperature to the observed satellite skin temperature – see Figure 10.
Figure 10. An estimate of clear-sky satellite skin temperature bias for day [left column] and night [right column] between GEOS-IT model and satellite observations [top row] and between satellite predictions – using a deep neural network (DNN) – and satellite observations [bottom row]. Use of the DNN reduced the bias between predicted and observed skin temperatures and lowered the standard deviation. Figure credit: Scarino et al., 2023Sunny Sun-Mack [LaRC, AMA] described her efforts to train a Neural Network to identify single and multilayer ice-over-water and cloud top height using the Cloud Aerosol Lidar with Infrared Pathfinder Satellite Observations (CALIPSO), CloudSat, and MODIS [CCCM] pixel-level product from 2008. For single layer cloud top heights, the neural network reduced the standard deviation of difference by nearly half. For the ice cloud top height in multilayer clouds, the standard deviation of difference is one-third. The neural network showed the same “skill” with lower multilayer cloud top heights as it did with single and multilayer upper cloud top heights – (e.g., standard deviation of difference is similar). The single layer cloud base showed similar skill to cloud top height, but the upper cloud base height was slightly worse than the cloud top height. The current algorithm using only imager data cannot differentiate multilayer clouds and creates a single water cloud that does not allow the flux to be calculated properly.
Jay Garg [LaRC/ADNET Systems, Inc] described improvements in SW surface flux using a Machine Learning technique over parameterized instantaneous CERES footprint fluxes. He trained a Neural Network model using the Fu-Liou calculated CERES CRS surface fluxes. This approach reduced the bias from 25 Wm-2 to almost 0 and the Root Mean Square (RMS) Error from nearly 100 to 13 W/m2 for SW surface fluxes. The LW flux statistics showed the bias reduced from 2 Wm-2 to nearly 0 and RMS Error from 12 to 3.5 W/m2 compared to the parameterized flux. These results nearly match the CRS values. Garg explained the plan to implement the Neural Network in the FLASHFlux SSF product – see Figure 11.
Figure 11. Artificial Neural Network differences between the Neural Network LW fluxes and the computed values globally for Jan. 4, 2020. The differences are consistently small across all areas (scale range is -15 to 15 Wm-2). The authors (see Credit below) note the need to improve some areas over continents and areas involving cloud patterns. Figure credit: Garg et al., 2024Takmeng Wong [LaRC] presented recent progress on an imager independent instantaneous flux product to replace the current Earth Radiation Budget Experiment (ERBE)-like product. Wong described the use of a Random Forest classification technique to determine if the scene is clear (defined as 99.9% cloud free) or cloudy. This approach allowed the CERES radiances to be unfiltered – see Figure 12. Wong and colleagues developed separate models for day and night as well as for surface types (e.g., water, land, desert, and ice and snow). Wong discussed how an Artificial Neural Network was used to convert radiances to a flux. Similar to the radiance models, Wong and colleagues did separate analyses for day and night and for the four surface types for both clear and cloudy conditions. The results from this approach were shown superior to the ERBE-like fluxes but not reaching the accuracy of the SSF using imager-derived clouds.
Figure 12. The number of clear footprints per 1 degree region for [Left] Earth Radiation Budget Experiment algorithm applied to CERES and [right] random forest results from CERES data. The right figure demonstrates a significantly reduced number of falsely identified clear pixels. Figure credit: Wong et al., 2024Eshkol Eytan [University of Colorado, Boulder] focused his work on the cloud twilight zone, an area of transition between clear and cloudy skies, such as cloud halo, cloud fragment, and thin clouds only seen in forward scatter. The clear sky reflectance increases, which is wavelength dependent the closer it is to the cloud. Eytan looked for this feature in the LW data. The lower bound for low clouds is ~0.75 W/m2. The fraction of what is considered clear is 60% cloudiness. The cloud twilight zone contribution to the CRE is ~0.8 W/m2 for warm clouds and ~8 W/m2 for all clouds. Eytan broke down MODIS data into 200-km2 (77-mi2) regions and applied a cloud mask. The team then looked at how different channels react with distance. Eytan and colleagues analyzed both visible and LW channels on MODIS. This work determined a pure clear sky value based on distance from known clouds and how it differs from the individual pixel radiance squared divided by the standard deviation obtained in the box. When the twilight spectral measure is greater than one, it signifies cloud contamination. The pure clear MODIS pixels within a CERES footprint are averaged to get a true clear-sky radiance. Often a CERES footprint exceeds the pure clear area. Eytan then explained how he used the clear sky measurement to determine a normalized factor for MODIS data to estimate CRE. He used machine learning between CERES radiances and MODIS radiances at different wavelengths to get pure clear-sky fluxes in homogenous areas. After training on CERES footprint, he then applied MODIS data to smaller areas. The shift of CRE to a higher value, from -6 W/m2 to -10 W/m2 with imager pixels, produced a more confident cloud mask – reducing uncertainty by a third. This value is still larger than the estimated aerosol direct radiative field. Applying the same technique to the thermal portion of the CRE is 1 and 1.5 W/m2.
Observational Datasets and Analysis
Lazaros Oreopoulos [GSFC] presented a new approach for classifying cloudiness at monthly time scales that preserves some of the variability of the original MODIS daily pixel observations. Starting from the 12 previously defined MODIS cloud regimes (CRs) that classified cloud mixtures according to how cloud top pressure and optical depth co-vary on daily scales, he grouped mixtures of CRs occurring regionally over a month using k-means clustering. He classified the geographical distribution of mean occurrences of the resulting eight monthly climatological cloud regimes as “Regimes of Regimes” (RORs) – see Figure 13. When examining the CRE of the RORs, he found that ROR5 contained large amounts of shallow convection. CR10 exhibited strong shortwave and longwave CRE trends because of declining CR10 populations.
Figure 13. Geographical distributions of mean population density [expressed as relative frequency of occurrence (RFO)] for the eight climatological cloud regimes, also called “Regimes of Regimes” (RORs), derived from 20 years of MODIS cloud retrievals. Figure credit: Oreopoulos et al., 2023Maria Hakuba [NASA/Jet Propulsion Laboratory (JPL)] provided an update on the WCRP Global Energy and Water Exchanges (GEWEX) Data and Analysis Panel assessment of the EEI. Quality control led to a skew in the Ocean Heat Content estimates, mapping techniques, and mask and coverage. The year-to-year variability did not follow the CERES EEI; however, a combination of in-situ and altimetry data for hybrid estimates resulted in very good agreement. The agreement with the JPL geodetic ocean heat uptake with the correct expansion efficiency was also good. The net all-sky was positive across all zones. The net clear-sky trend matched all-sky. The net-CRE showed negative trends in Northern Hemisphere deep tropics and high latitudes. The SW and LW CRE complement each other both globally and zonally. The positive SW CRE dominated in the tropics with fewer, lower, and thinner clouds.
Jake Gristley [NOAA’s Cooperative Institute for Research in Environmental Science (CIRES)/University of Colorado, Boulder] explored the angular dimension of ERB with the Wide Field of View camera planned for the Libera mission. The camera is a 2048 x 2048-pixel array that samples the entire Earth disk subtended from the satellite. It provides 1-km (0.62-mi) pixel spacing at nadir with a single spectral channel at 555 nm. This technique produces more data than can be downloaded. The ADM sampling methods Gristley used encompass the Libera Point Spread Function and minimize the amount of data that must be transmitted.
Seung-Hee Ham discussed how to evaluate cloud volumes using CALIPSO, CloudSat, and MODIS observations separately and in combination to determine the strengths and weakness of each approach. CloudSat misses thin cirrus and low clouds; CALIPSO misses low and mid clouds as a result of signal attenuation; and MODIS misses high and low clouds and over detects mid clouds. Ham described a trend from 2008 to 2017 that shows an increase in the upper-most clouds and a decrease in underlying clouds. She also looked at the El Niño Southern Oscillation (ENSO) signal that showed varying responses based on latitude bands. The increase in high clouds above 10 km (6.2 mi) represent an increase in clouds with a temperature between 220 and 240 K. The colder cloud emission and smaller OLR provide positive cloud feedback.
Brent Roberts [NASA’s Marshall Space Flight Center (MSFC)] presented applications of CERES surface fluxes in the Regional Visualization and Monitoring System (in French SERVIR). SERVIR is a joint initiative of NASA, United States Agency for International Development (USAID), and leading geospatial organizations in Asia, Africa, and Latin America. SERVIR uses satellite data and geospatial technology in innovative solutions to improve resilience and sustainable resource management. The projects are driven by demand to meet community needs and values. The CERES fluxes are used input into crop and land surface modeling through NASA’s Prediction of Worldwide Energy Resources (POWER) tool. Another example of where CERES data are used as input is for the Regional Hydrologic Extremes and Assessment System (RHEAS), which is a framework for providing nowcast and forecasts of streamflow and crop yields that has been deployed in Eastern Africa and Southeast Asia. The South Asia Land Data Assimilation System (SALDAS) uses the NASA GEOS Subseasonal to Seasonal (S2S) prediction system and long-term observational records or assimilations to evaluate climate anomalies. The GEOS-S2S information is downscaled to 5 km (3 mi) using Land Information System or Land surface Data Toolkit, which is combined with information from POWER and the Integrated Multi-satellitE Retrievals for Global Precipitation Monitoring (IMERG GPM). The value of CERES surface fluxes is more accurate over the model data when compared to Surface Radiation Budget (SURFRAD) network observations. Roberts explained future plans to refine the downscaling approach to take advantage of satellite-based radiative fluxes.
David Rutan, [ADNET Systems] validated the CERES CRS data product at Siple Dome, Antarctica. The CRS is a CERES footprint-based application of the Fu-Liou Radiative Transfer Model. At the high polar latitude, Terra and Aqua provide multiple passes each day allowing the diurnal cycle to be captured. The calculated LW surface downward flux is consistently too low under both clear and cloudy skies. Whereas the SW surface downward flux is low for cloudy conditions but matches well under clear skies. The surface upward flux comparison demonstrates LW is very low for cloudy skies and improves for clear skies. Conversely, SW is low for cloudy conditions and again matches well with clear skies. Despite the bias, the CERES fluxes captured the dynamic changes in observed radiances. The difference between fluxes calculated by the GMAO GEOS 5.4.1 model, MODIS, and AIRS observed fluxes are shown in Figure 14. The model has a low bias for skin and air [2-m (6-ft) off the ground] temperature and a dry bias in the troposphere compared to the observations.
Figure 14. The calculated data fairly well in the shortwave down, particularly when the sky is clear. The longwave down, the calculations are cold, because it is largely influenced by the near surface air temperature. When Rutan and his team compared current input (GEOS-541) to input for the Edition 5 version of the cloud regimes (GEOS-IT), they found that the current surface air temperature is too low in the Antarctic. Figure credit: Rutan et al., 2023Norman Loeb presented the CERES approach for a seamless climate data record across multiple satellite transitions applied to the EBAF ToA data product. All CERES instruments are anchored to FM1 via intercalibration using coincident measurements. Low Earth Orbiting (LEO) and Geostationary Earth Orbiting (GEO) imager radiances are placed on the same radiometric scale using a combination of ray-matching and invariant targets. Loeb explained the next step that used overlap between successive missions to anchor the level 3 (L3) data product from different satellites to a common reference. He then addressed the question of incorporating a new broadband instrument into the data after a 46-month data gap using computed fluxes from a SYN1deg product or the ERA5. All methods introduced a bias greater than 0.1 W/m2 than currently expressed using EBAF.
Virginia Sawyer [GSFC/Science Systems and Application, Inc.] provided an update on aerosol trends and changes for Dark Target – a satellite algorithm for retrieving aerosol properties from MODIS and other sensors by looking for brightness changes, which is more effective for dark surfaces (e.g., forests and oceans). Sawyer reported that the Collection 6.1 Aerosol Optical Depth (AOD) over land was higher for Terra than for Aqua early in the record. After 2015, however, the two records became more consistent. The Suomi NPP AOD tracks closely to Terra and Aqua, but the NOAA-20 data produce lower aerosol values. This same pattern is seen over the oceans, but the Terra and Aqua do not converge after 2015. Sawyer reported that the preliminary results for MODIS Collection 7 (C7) do not significantly change Aqua results but do increase Terra AOD over land. This finding increases the Terra–Aqua offset. Sawyer indicated that MODIS C7 will include new Dark Target and Deep Blue, a companion algorithm to Dark Target but designed to excel over bright surfaces (e.g., deserts) by using blue/UV bands where aerosols are prominent. Likewise, she reported that the C7 MODIS Deep Blue algorithm will be expanded to retrieve over the ocean, similar to the current version for VIIRS.
Tyler Hanke [University of Illinois] introduced the concept of emergent constraint that combines some current observable climate quantity and its future projections with an observational estimate to constrain future projections. He used ENSO as a potential emergent constraint on the pattern effect. ENSO in both the Eastern Pacific and Central Pacific have associated all-sky radiation patterns that are dominated by low-cloud radiative effect anomalies that are primarily driven by SST. The increase in SST decreases low-clouds and weakens the inversion. These features were identified in both CMIP 6 models and the CERES EBAF product.
Xianglei Huang [University of Michigan] provided OLR trends from CERES, AIRS, and Cross-track Infrared Sounder (CrIS) on Suomi NPP and NOAA-20. The AIRS data showed about half the trend that CERES had over 20 years, but within the uncertainty of both measurements. He reviewed the various sources of differences: ADMs, calibration, and extrapolation. Huang explained that Suomi NPP CrIS data have known issues in the mid-IR channel, so NOAA-20 CrIS must be used for the analysis. A review of the past 10 years shows much closer agreement – around 0.055 W/m2 per year. Huang said that there are enough data to begin to look at spectral trends, which will be a focus of his future endeavors.
Patrick Taylor [LaRC] provided an overview of the Arctic Radiation-Cloud-aerosol-Surface Interaction Experiment (ARCSIX), which is designed to quantify the contributions of surface properties, clouds, aerosols, and precipitation to the Arctic summer surface radiation budget and sea ice melt. Taylor explained how the field experiment will increase the field’s knowledge of the coupling between radiative processes and sea ice surface properties that influence the summer sea ice melt processes that control Arctic cloud regimes and their properties. It also controls the ability to monitor Arctic clouds, radiation, and sea ice processes from space. Even though the thin Arctic clouds can be radiatively important, they are challenging to observe with passive instruments, such as MODIS. The surface albedo is the largest uncertainty in intermodel differences in the Arctic. Two periods of aircraft measurements are available from Greenland between mid-May to mid-June and late-July to mid-August 2024. During the Fall 2024 meeting, Taylor reported that the Wallops Flight Facility (WFF) P-3 completed 19 flights, the LaRC Gulfstream-III had 15 flights, and SPEC Incorporated Learjet had 10 flights out of Pituffik Space Base in northwest Greenland. Altogether the ARCSIX flights accounted for nearly 350 flight hours. Taylor reported that (at the time of the Spring 2025 meeting) these data were still being prepared for public release.
Conclusion
Much like many of the CERES STMs that have preceded them, the last four meetings addressed the current state of CERES instruments, data products and algorithms, and outreach activities. The meetings began with a discussion on global mean surface temperature, progress on cloud algorithms, and changes in SW flux into different components of the electromagnetic spectrum. In addition, the CERES discussions compared ERB instruments, irradiance trends at different levels of the atmosphere, and information shared by citizen scientists during eclipse events in 2023 and 2024. Invited presentations evaluated how to parse radiation forcing and feedback to understand different atmospheric parameters and the use of different models, including Neural Network models, to examine the data gathered by CERES. The presentations also examined the concentration and distribution of aerosols in relation to different cloud types and droplet number and their relationship to climate sensitivity. Several presentations focused on the Arctic, especially with regard to albedo and ice extent. Several projects combined work from CERES and other instruments on the satellite platforms to examine single and multi-layer ice-over-water and cloud top in the atmosphere. The work over the two-year period has brought together a diverse group of experts to clarify atmospheric dynamics to understand changes in radiative flux to improve predictions of future climate conditions.
Walter Miller
NASA’s Langley Research Center/ADNET Systems, Inc.
walter.f.miller@nasa.gov
2025 Space Station Science Snapshots
1 min read
Preparations for Next Moonwalk Simulations Underway (and Underwater) NASA astronaut Zena Cardman processes bone cell samples inside the Kibo laboratory module’s Life Science Glovebox. NASA2025 marks another year pushing the boundaries of scientific research aboard the International Space Station. This past year, over 750 investigations were conducted aboard the space station, supported by crewed missions and resupply vehicles delivering essential cargo and experiments to the orbiting laboratory. This year’s research included testing DNA’s ability to store data, producing vital nutrients on demand, demonstrating technology for space debris removal and satellite maintenance, advancing next-generation medicines, and more. Astronauts visited the space station from across the globe to continue research benefiting humanity on Earth and paving the way for future exploration missions, including NASA’s Artemis program to return humanity to the Moon. On Nov. 2, 2025, NASA and its international partners surpassed 25 years of continuous human presence aboard the space station, showcasing humanity’s dedication to space exploration and scientific discovery.
Over a million images were taken aboard the space station this year, documenting groundbreaking research, observing Earth from space, and even capturing comets and other celestial phenomenon. Rewind and look back at a photo recap of 2025 aboard the space station.
Keep Exploring Discover More Topics From NASALatest News from Space Station Research
Space Station Research and Technology
Space Station Research Results
Space Station Research and Technology Resources
NASA to Preview US Spacewalks at Space Station in January
NASA astronauts will conduct a pair of spacewalks in January outside of the International Space Station to prepare for the installation of a roll-out solar array and complete other tasks. Experts from NASA will preview the spacewalks in a briefing at 2 p.m. EST Tuesday, Jan. 6, at NASA’s Johnson Space Center in Houston.
Watch NASA’s live coverage of the news conference on the agency’s YouTube channel. Learn how to stream NASA content through a variety of online platforms, including social media.
Participants include:
- Bill Spetch, operations integration manager, International Space Station Program
- Diana Trujillo, spacewalk flight director, Flight Operations Directorate
- Heidi Brewer, spacewalk flight director, Flight Operations Directorate
Media interested in participating in person or by phone must contact the NASA Johnson newsroom no later than 10 a.m., Monday, Jan. 5, by calling 281-483-5111 or emailing jsccommu@mail.nasa.gov. To ask questions by phone, reporters must dial into the news conference no later than 15 minutes prior to the start of the call. Questions may also be submitted on social media using #AskNASA. NASA’s media accreditation policy is available online.
On Thursday, Jan. 8, NASA astronauts Mike Fincke and Zena Cardman will exit the station’s Quest airlock to prepare the 2A power channel for future installation of International Space Station Roll-Out Solar Arrays. Once installed, the array will provide additional power for the orbital laboratory, including critical support of its safe and controlled deorbit. This spacewalk will be Cardman’s first and Fincke’s 10th, tying him for the most spacewalks by a NASA astronaut.
On Thursday, Jan. 15, two NASA astronauts will replace a high-definition camera on camera port 3, install a new navigational aid for visiting spacecraft, called a planar reflector, on the Harmony module’s forward port, and relocate an early ammonia servicer jumper — a flexible hose assembly that connects parts of a fluid system — along with other jumpers on the station’s S6 and S4 truss.
NASA will announce the astronauts planned for the second spacewalk and start times for both events closer to the operations.
The spacewalks will be the 278th and 279th in support of space station assembly, maintenance and upgrades. They also are the first two International Space Station spacewalks of 2026, and the first by Expedition 74.
Learn more about International Space Station research and operations at:
-end-
Josh Finch / Jimi Russell
Headquarters, Washington
202-358-1100
joshua.a.finch@nasa.gov / james.j.russell@nasa.gov
Sandra Jones / Joseph Zakrzewski
Johnson Space Center, Houston
281-483-5111
sandra.p.jones@nasa.gov / joseph.a.zakrzewski@nasa.gov
A Galactic Embrace
Mid-infrared data from NASA’s James Webb Space Telescope (in white, gray, and red) and X-ray data from NASA’s Chandra X-ray Observatory (in blue) come together in this photo of colliding spiral galaxies released on Dec. 1, 2025. The pair grazed one another millions of years ago; billions of years in the future, they will merge into a single galaxy.
Image credit: X-ray: NASA/CXC/SAO; Infrared: NASA/ESA/CSA/STScI/Webb; Image Processing: NASA/CXC/SAO/L. Frattare
I Am Artemis: Jen Madsen and Trey Perryman
Listen to this audio excerpt from Jen Madsen and Trey Perryman, leads of the Orion Mission Evaluation Room for the Artemis II mission:
0:00 / 0:00
Your browser does not support the audio element.During NASA’s Artemis II mission, Jen Madsen and Trey Perryman will be leading a team monitoring the Orion spacecraft as it carries four astronauts around the Moon. The team works in the Orion Mission Evaluation Room where they will monitor and analyze Orion’s systems and performance in real time to help ensure crew safety and mission success.
As the leaders of the Orion Mission Evaluation Room located inside the Mission Control Center at NASA’s Johnson Space Center in Houston, Madsen and Perryman are responsible for ensuring that the dozens of NASA, Lockheed Martin, ESA (European Space Agency), and Airbus expert engineers that staff the room’s consoles are ready for Artemis II.
Jen and I are responsible for the organization, training, and execution of the entire team. We’ll also play a key role in communicating the findings of the Mission Evaluation Room to our program and agency leadership.Trey Perryman
Lead for Orion Mission and Systems Integration
The flight control team operating Orion from mission control’s White Flight Control Room will rely on the Mission Evaluation Room’s crucial findings to help with unexpected spacecraft behaviors that may arise and help analyze Orion’s performance data during the mission.
With crew aboard Orion, Artemis II brings new challenges, new opportunities, and a new space in mission control for the Orion Mission Evaluation Room. More spacecraft systems will be put to the test, requiring more evaluation room expertise and new consoles to monitor systems not previously flown, like life support.
“There’s loads of excitement — for the new capabilities, the mission, and having a new, wonderful space to operate in,” said Perryman.
Besides leading the Mission Evaluation Room, Perryman is also the lead for Orion Mission and Systems Integration, and Madsen is deputy manager for Orion’s Avionics, Power, and Software. Their co-leadership styles complement each other — Perryman leads with energy and team spirit, while Madsen brings a steadiness and structure.
Artemis II Orion Mission Evaluation Room Leads Jen Madsen and Trey Perryman stand in the Orion Mission Evaluation Room in the Mission Control Center at NASA’s Johnson Space Center in Houston.NASA/Rad Sinyak“We balance each other out,” Madsen said. “And that balance is reflected in our team.”
For Perryman, a former flight controller with a background in space shuttle and space station operations, the MER represents the culmination of a career in human spaceflight that’s personal.
“I couldn’t imagine being anywhere else right now,” Perryman said. “My wife and I have four boys, and my boys are very excited about Artemis…that’s meaningful to me. And they like seeing a father who’s really connected to this mission.”
Madsen began her NASA career in engineering, designing and simulating Orion’s guidance, navigation, and control systems early on in the program.
I spent many years doing computer simulations, writing code, doing analysis… we designed, built, and tested Orion. So now it's amazing to me to get to be a part of the legacy of operating the vehicle.Jen Madsen
Deputy Manager for Orion’s Avionics, Power, and Software
For both leaders, the Artemis II mission is more than technical. With crew flying aboard the spacecraft, it’s deeply human.
“I do feel an extra sense of importance and mindfulness about what we’re doing in this building,” Perryman said, “making sure — specifically in the Orion MER — that we understand how the vehicle supports the crew, because it is so important to return them home safely.”
“We all feel like Reid, Victor, Christina, and Jeremy are part of the Orion family,” Madsen said. “When we have discussions about risk, from design all the way through operations, we’re thinking about our friends aboard the spacecraft.”
About the AuthorErika Peters Share Details Last Updated Dec 29, 2025 Related Terms Explore More 3 min read Get In, We’re Going Moonbound: Meet NASA’s Artemis Closeout Crew Article 6 days ago 4 min read Artemis II Flight Crew, Teams Conduct Demonstration Ahead of Launch Article 7 days ago 3 min read I Am Artemis: Grace Lauderdale Article 7 days ago Keep Exploring Discover More Topics From NASAMissions
Humans in Space
Climate Change
Solar System
Studying Physics in Microgravity
In this Oct. 20, 2025, photo, tiny ball bearings surround a larger central bearing during the Fluid Particles experiment, conducted inside the Microgravity Science Glovebox (MSG) aboard the International Space Station’s Destiny laboratory module. A bulk container installed in the MSG, filled with viscous fluid and embedded particles, is subjected to oscillating frequencies to observe how the particles cluster and form larger structures in microgravity. Insights from this research may advance fire suppression, lunar dust mitigation, and plant growth in space. On Earth, the findings could inform our understanding of pollen dispersion, algae blooms, plastic pollution, and sea salt transport during storms.
In addition to uncovering potential benefits on Earth, research done aboard the space station helps inform long-duration missions like Artemis and future human expeditions to Mars.
Image credit: NASA/Zena Cardman
Santa Visits Artemis II Rocket
Santa Claus (NASA engineer Guy Naylor) poses with NASA’s Artemis II Orion spacecraft and SLS (Space Launch System) rocket in the Vehicle Assembly Building at NASA’s Kennedy Space Center in Florida on Dec. 11, 2025. The Orion spacecraft was stacked atop the SLS in October 2025.
Set to launch in early 2026, the Artemis II test flight will be NASA’s first mission with crew under Artemis. Astronauts on their first flight aboard Orion will confirm all the spacecraft’s systems operate as designed with crew aboard in the actual environment of deep space. Through the Artemis campaign, NASA will send astronauts to explore the Moon for scientific discovery, economic benefits, and to build the foundation for the first crewed missions to Mars – for the benefit of all.
Image credit: NASA/Adeline Morgan
OPERA: Addressing Societal Needs with Satellite Data
5 min read
OPERA: Addressing Societal Needs with Satellite DataIntroduction
The Observational Products for End-Users from Remote Sensing Analysis (OPERA) project represents a strategic initiative designed to address critical satellite data needs identified by federal agencies. Established in 2021 by the NASA/Jet Propulsion Laboratory (JPL), OPERA responds to priorities identified by the Satellite Needs Working Group (SNWG), an interagency body convened by the White House Office of Management and Budget (OMB) and Office of Science and Technology Policy (OSTP). SNWG surveys federal agencies every two years to determine their top satellite data needs. This article summarizes OPERA, including its mandate, and then presents a case study demonstrating how the United States Department of Agriculture (USDA) Agricultural Research Service (ARS) is using OPERA to monitor agricultural health in the Midwestern United States.
OPERA Mandate and Approach
The core mandate for the OPERA project lies in its commitment to delivering data products in formats that are immediately usable and analysis-ready. Rather than providing raw satellite data that requires extensive processing expertise, OPERA transforms complex satellite observations into standardized, accessible products that federal agencies can quickly integrate into their existing workflows to support national security, environmental monitoring, disaster response, and infrastructure management. This approach eliminates the technical barriers that often prevent agencies from effectively using satellite data, allowing them to focus on their mission-critical applications rather than data processing challenges.
To achieve this goal at the scale required by federal agencies, OPERA has developed a sophisticated cloud-based production system capable of generating data products efficiently and consistently to meet the dynamic needs of federal users. As of 2025, OPERA has successfully released dynamic surface water extent, surface disturbance, and surface displacement data through various NASA Distributed Active Archive Centers (DAACs). The vertical land motion product will be OPERA’s next offering beginning in 2028 – see Figure 1.
Figure 1. As of 2025, OPERA has successfully released dynamic surface water extent, surface disturbance, and surface displacement data products that are available through various NASA Distributed Active Archive Centers. The vertical land motion product will be OPERA’s next offering beginning in 2028. Figure credit: Clockwise starting from bottom left. Firth River Yukon, Water Data. Credit: USGS/John Jones, Lava boiling out of the Kilauea Volcano, Volcano Data. Credit: ASI/NASA/JPL-Caltech, Subsidence and uplift over New York City, Vertical Land Motion Data. Credit: NASA/JPL-Caltech, Fire fighting helicopter carry water bucket to extinguish the forest fire, Fire Data. Credit: Hansen/UMD/Google/USGS/NASAOPERA Mission
OPERA delivers high-quality, ready-to-use satellite-derived information to enable federal agencies to better monitor environmental changes, respond to natural disasters, assess infrastructure risks, and make data-driven decisions. To illustrate this goal, OPERA’s 5th Annual Stakeholder Engagement Workshop detailed real-world applications of this approach on Sept. 11, 2025.
Case Study: Harnessing OPERA Data to Map Crop Health in Midwest United States
When water lingers on farmland, the consequences often ripple outward, resulting in crop losses, changes in soil health, and shifting carbon storage. In the rolling landscape of central Iowa’s South Fork watershed, these challenges are a daily reality for farmers, researchers, and crop insurance companies. To address these concerns, scientists at the U.S. Department of Agriculture–Agriculture Research Service’s (USDA–ARS) National Laboratory for Agriculture and the Environment (NLAE) are partnering with NASA’s OPERA project.
Using OPERA’s Dynamic Surface Water Extent (DSWx) and Surface Disturbance (DIST) product suites, USDA–NLAE researchers began the process of identifying depressions where water consistently ponds across fields – see Figure 2.
Figure 2. The map of maximum inundation combines individual Observational Products for End-Users from Remote Sensing Analysis (OPERA) Dynamic Surface Water Extent (DSWx) granules acquired over a month. Figure credit: NASA/JPL-Caltech, Dr. Renato Prata de Moraes FrassonThese sites are often more than nuisance puddles; they signal areas of reduced yield, risk for crop mortality, and hotspots for carbon and nutrient accumulation. By combining OPERA’s cloud-free, high-resolution mosaics with field-based measurements from USDA and university partners, the joint OPERA-NLAE team is producing actionable maps that pinpoint waterlogged zones – see Figure 3. Farmers can use these maps to improve soil health and guide land-management decisions.
Figure 3. The map depicts a field south of Iowa Falls in Hardin County, IA. The pixels are color-coded to indicate the number of times a region is inundated with water from May through October 2024. Larger numbers are associated with deeper depressions and with perennial lakes and rivers, including the Iowa River flowing west to east in the northern part of the image. Figure credit: NASA/JPL-Caltech, Dr. Renato Prata de Moraes FrassonThe OPERA products also support broader watershed management. Analyses of river migration, oxbow lake formation, and storm damage from powerful Midwestern derecho events show how OPERA data extend beyond field plots to larger areas. By detecting both persistent inundation and shifts in vegetation health, DSWx and DIST together provide synergistic information identifying areas where improved tile drainage may result in better crop health and increased yields. This approach can also be used to mitigate topsoil erosion and nutrient transport to control the development of harmful algal blooms and the occurrence of anoxic zones with implications far beyond the Mississippi Delta.
Conclusion
The use of OPERA data by USDA–ARS to map and monitor crop health in the Midwest United States highlights how this vital data product bridges the gap between Earth science and agricultural resilience. The outcome of this collaboration underscores OPERA’s mission – translating cutting-edge satellite observations into usable tools that support farmers, improve soil and water conservation, and strengthen the resilience of U.S. agriculture. This collaboration signifies the mandate of OPERA as an SNWG solution provider to fulfill the observation needs of federal users. All OPERA’s data products are freely available to the public from various NASA DAACs and are discoverable from the NASA Earthdata Search platform. The team welcomes direct engagement with individual federal, state, academic, and commercial stakeholders and can be reached via opera.sep@jpl.nasa.gov.
Steven K. Chan
Jet Propulsion Laboratory, California Institute of Technology
steven.k.chan@jpl.nasa.gov
Renato Prata de Moraes Frasson
Jet Propulsion Laboratory, California Institute of Technology
renato.prata.de.moraes.frasson@jpl.nasa.gov
Al Handwerger
Jet Propulsion Laboratory, California Institute of Technology
alexander.handwerger@jpl.nasa.gov
Get In, We’re Going Moonbound: Meet NASA’s Artemis Closeout Crew
For most, getting into a car is a task that can be done without assistance. Yet for those whose destination is the Moon, the process of getting inside and secured – in this case, in NASA’s Orion spacecraft – requires help. That’s the role of the Artemis closeout crew.
Trained to support Artemis II and future Moon missions, the five closeout crew members will be the last people to see NASA astronauts Reid Wiseman, Victor Glover, and Christina Koch, and CSA (Canadian Space Agency) astronaut Jeremy Hansen before their lunar journey.
The Artemis II closeout team consists of a lead, Taylor Hose; an astronaut support person, astronaut Andre Douglas; one technician specially trained on Orion crew survival system spacesuits, Bill Owens; and two Orion technicians, Christian Warriner and Ricky Ebaugh.
We are responsible for getting the astronauts strapped in their spacecraft, getting all their connections attached to their spacesuits, and then we close the hatch and close out Orion for launch.Taylor Hose
Artemis II Closeout Team Lead
Think of them like a pit crew for car races.
When the astronauts arrive on launch day at Launch Complex 39B at NASA’s Kennedy Space Center in Florida, the closeout crew will already be in place. First, the team will help the astronauts don their helmets and gloves before entering the Orion spacecraft.
Closeout Crew lead Taylor Hose, second from left, talks with NASA astronaut Andre Douglas, second from right as he and closeout crewmembers Will Sattler, left, and Christian Warriner prepare for the arrival of Artemis II crewmembers NASA astronauts Reid Wiseman, commander; Victor Glover, pilot; Christina Koch, mission specialist; and CSA (Canadian Space Agency) astronaut Jeremy Hansen, mission specialist; at the 275-foot level of the mobile launcher as they prepare to board their Orion spacecraft atop NASA’s Space Launch System rocket during the Artemis II countdown demonstration test, Saturday, Dec. 20, 2025, inside the Vehicle Assembly Building at NASA Kennedy. NASA/Joel KowskyOnce inside, Owens and Douglas will assist each crew member with buckling up – except instead of using just one seatbelt like in a car, the crew needs several more intricate connections. Each seat includes five straps to secure the astronauts inside the crew module and several additional connections to the environmental control and life support systems and communications system aboard.
After the astronauts are secured, the hatch technicians will begin closing the spacecraft hatch. Unlike a car door that easily opens and closes with the pull of a handle, Orion’s hatch requires more effort to securely close.
“The hatch is pneumatically driven so we have to have air lines hooked up to it, and we need the help of the ground support system to close it,” said Hose.
Bill Owens of the Closeout Crew is seen as he leads Artemis II crewmembers CSA (Canadian Space Agency) astronaut Jeremy Hansen, mission specialist; and NASA astronauts Reid Wiseman, commander; Victor Glover, pilot; and Christina Koch, mission specialist; out of at the elevator towards the crew access arm at the 275-foot level of the mobile launcher as they prepare to board their Orion spacecraft atop NASA’s Space Launch System rocket during the Artemis II countdown demonstration test, Saturday, Dec. 20, 2025, inside the Vehicle Assembly Building at NASA Kennedy. NASA/Joel KowskyOn launch day, it will take about four hours for the crew to get situated inside Orion and for the closeout process, including buttoning up both the crew module hatch and an exterior launch abort system hatch, to be complete. Even a single strand of hair inside the hatch doors could potentially pose issues with closing either hatch, so the process is carefully done.
“We have a lot of work to do with the seals alone – greasing, cleaning, taking the hatch cover off – and then we get into crew module hatch closure,” Hose said. “So after latching the hatch, we take window covers off, install thermal protection panels, and remove the purge barrier in between the vehicle and the ogive panels, which help protect the crew module during launch and ascent.”
The team then closes the launch abort system hatch and finishes final preparations before launch. Following the abort system hatch closure, the closeout crew departs the launch pad but stays nearby in case they need to return for any reason.
Taylor Hose prepares for the arrival of Artemis II crewmembers NASA astronauts Reid Wiseman, commander; Victor Glover, pilot; Christina Koch, mission specialist; and CSA (Canadian Space Agency) astronaut Jeremy Hansen, mission specialist; at the 275-foot level of the mobile launcher to board their Orion spacecraft atop NASA’s Space Launch System rocket during the Artemis II countdown demonstration test, Saturday, Dec. 20, 2025, inside the Vehicle Assembly Building at NASA Kennedy.NASA/Joel Kowsky My life goal was to be an astronaut. To help send people to the Moon for the first time since 1972 to not just go and visit, but this time to stay, I think that’s everything. That's our first steppingstone of going to Mars and expanding into the solar system.Taylor Hose
Artemis II Closeout Team Lead
After launch, several team members will head to San Diego, to help with post-splashdown efforts once the mission concludes.
As part of a Golden Age of innovation and exploration, the Artemis II test flight is the first crewed flight under NASA’s Artemis campaign. It is another step toward new U.S.-crewed missions on the Moon’s surface that will help the agency prepare to send the first astronauts – Americans – to Mars.
About the AuthorAntonia Jaramillo Share Details Last Updated Dec 23, 2025 Related Terms Explore More 4 min read Artemis II Flight Crew, Teams Conduct Demonstration Ahead of Launch Article 6 days ago 3 min read I Am Artemis: Grace Lauderdale Article 6 days ago 6 min read NASA Kennedy Top 20 Stories of 2025 Article 7 days ago Keep Exploring Discover More Topics From NASAMissions
Humans in Space
Climate Change
Solar System
Artemis II Crew Launch Day Rehearsal
From left to right, CSA (Canadian Space Agency) astronaut Jeremy Hansen and NASA astronauts Christina Koch, Victor Glover, and Reid Wiseman stand outside before boarding their Orion spacecraft inside the Vehicle Assembly Building at NASA’s Kennedy Space Center in Florida as part of the Artemis II countdown demonstration test, Saturday, Dec. 20, 2025. Because the SLS (Space Launch System) rocket upon which they will launch is not yet at the launch pad, the crew boarded Orion inside NASA Kennedy’s Vehicle Assembly Building, where engineers are conducting final preparations on the spacecraft, rocket, and ground systems. During the rehearsal, teams went through all the steps that will be taken on launch day, winding the clock down to just a few seconds before liftoff.
Through the Artemis campaign, NASA will send astronauts to explore the Moon for scientific discovery, economic benefits, and to build the foundation for the first crewed missions to Mars, for the benefit of all.
See more photos from the countdown demonstration test.
Image credit: NASA/Aubrey Gemignani
Artemis II Flight Crew, Teams Conduct Demonstration Ahead of Launch
NASA’s launch and mission teams, along with the Artemis II crew, completed a key test Dec. 20, a countdown demonstration test, ahead of the Artemis II flight around the Moon early next year. The astronauts, supported by launch and flight control teams, dressed in their launch and entry suits, boarded their spacecraft on top of its towering rocket at the agency’s Kennedy Space Center in Florida to validate their launch date timeline.
Winding the clock down to a point just before liftoff, the rehearsal enabled NASA teams to practice the exact steps teams will take as they move toward launch of the test flight.
This test marks the passage of a key milestone on America’s journey to the launchpad. We have many more to go, but I’m encouraged by the expertise and precision demonstrated by our teams as we continue NASA’s ambitious lunar exploration legacy.Jared Isaacman
NASA Administrator
While launch teams in the firing rooms of Kennedy’s Launch Control Center ran through procedures just as they would on launch day, the Artemis II crew members – NASA astronauts Reid Wiseman, Victor Glover, and Christina Koch, and CSA (Canadian Space Agency) astronaut Jeremy Hansen – donned their Orion crew survival system spacesuits in the Astronaut Crew Quarters inside Kennedy’s Neil A. Armstrong Operations and Checkout Building.
From left, NASA astronauts Victor Glover, Artemis II pilot, and Reid Wiseman, Artemis II commander, undergo spacesuit checks inside the crew quarters suit-up room in the Neil A. Armstrong Operations and Checkout Building part of the countdown demonstration test at NASA Kennedy on Saturday, Dec. 20, 2025. NASA/Glenn BensonOnce suited, the crew made the same walk taken by Gemini, Apollo, space shuttle, and Commercial Crew Program astronauts launching from Florida’s Space Coast during the last six decades. Through the suit-up room, down the hallway, and after a quick ride on an elevator, the Artemis II crew exited the building through the double doors featuring dozens of human spaceflight mission patch stickers.
The Artemis astronaut van waited outside to take the crew members to their SLS (Space Launch System) rocket. On the actual launch day, the four astronauts will complete a 20-minute ride to Kennedy’s Launch Complex 39B ahead of liftoff. But, for the countdown test the destination was High Bay 3 of Kennedy’s Vehicle Assembly Building, where the Artemis II Moon rocket is undergoing final processing and checkouts before rolling out to the launch pad. A convoy of support vehicles, as well as Artemis II backup crew members, NASA astronaut Andre Douglas and CSA astronaut Jenni Gibbons, escorted the crew to its destination.
From right to left, NASA astronauts Reid Wiseman, commander; Victor Glover, pilot; Christina Koch, mission specialist; and CSA (Canadian Space Agency) astronaut Jeremy Hansen, mission specialist are seen as they depart the Neil A. Armstrong Operations and Checkout Building to board their Orion spacecraft atop NASA’s Space Launch System rocket inside the Vehicle Assembly Building as part of the Artemis II countdown demonstration test, Saturday, Dec. 20, 2025, at NASA Kennedy.NASA/Aubrey GemignaniAfter a short trip to the building, the flight crew rode the mobile launcher’s elevator up nearly 300 feet to the crew access arm and the White Room, the enclosed area where the crew enters the spacecraft. The closeout crew, whose job it is to ensure the flight crew enters the spacecraft without issue, helped the astronauts enter Orion, which they have named Integrity. The closeout team assisted the astronauts by strapping them into their seats and closed the hatch once all closeout operations were completed. With the crew secured in Orion, teams conducted suit leak and communications checks, just as they will on launch day.
Artemis II crewmembers CSA astronaut Jeremy Hansen, mission specialist, right, and NASA astronauts Victor Glover, pilot; Christina Koch, mission specialist; after exiting the elevator at the 275-foot level of the mobile launcher as they walk towards the crew access arm prepare to board their Orion spacecraft atop NASA’s Moon rocket during the Artemis II countdown demonstration test, Saturday, Dec. 20, 2025, inside the Vehicle Assembly Building at NASA Kennedy. NASA/Joel KowskyThroughout the testing, teams ran through the final 5.5 hours of launch day procedures, completing the countdown test about 30 seconds before what will be the time of liftoff on launch day. As they may encounter on launch day, teams navigated through several real-time issues, including audio communications and environmental control and life support systems closeout activities during the test. All objectives were met, and the countdown demonstration provided a valuable opportunity to conduct operations in a day-of-launch configuration to minimize first-time learnings on launch day.
Charlie Blackwell-Thompson, NASA’s Artemis launch director, monitors the progress of Artemis II countdown demonstration test with Artemis II crew members onboard their Orion spacecraft from Firing Room 1 of the Rocco A. Petrone Launch Control Center at NASA Kennedy on Saturday, Dec. 20.NASA/Glenn BensonAlthough Artemis II teams have performed parts of the launch countdown testing previously, this test was the first full end-to-end rundown with the crew and Orion in the launch configuration. The crew will participate in additional countdown testing after the rocket arrives to the launchpad, focusing on emergency operations.
As part of a Golden Age of innovation and exploration, the Artemis II test flight is the first crewed mission under NASA’s Artemis campaign. It is another step toward new U.S.-crewed missions on the Moon’s surface that will help the agency prepare to land American astronauts on Mars.
About the AuthorJason Costa Share Details Last Updated Dec 23, 2025 Related Terms Explore More 3 min read Get In, We’re Going Moonbound: Meet NASA’s Artemis Closeout Crew Article 6 days ago 3 min read I Am Artemis: Grace Lauderdale Article 6 days ago 6 min read NASA Kennedy Top 20 Stories of 2025 Article 7 days ago Keep Exploring Discover More Topics From NASAMissions
Humans in Space
Climate Change
Solar System
NASA Astronaut Nick Hague Retires
NASA astronaut Brig. Gen. Nick Hague has retired from the agency, concluding a distinguished career that included two spaceflight missions, 374 days in space, and multiple spacewalks in support of the International Space Station. Hague continues service in the U.S. Space Force.
Hague launched aboard the Soyuz MS-12 spacecraft in March 2019 from the Baikonur Cosmodrome in Kazakhstan for his first long-duration mission, serving as a flight engineer during Expeditions 59/60. During this 203-day mission, he conducted three spacewalks to upgrade the station’s power systems and support ongoing maintenance of the orbiting laboratory. Hague also contributed to a wide range of scientific investigations, spanning biology, human physiology, materials science, and technology demonstrations.
Hague originally was assigned to fly in 2018 as part of the Soyuz MS-10 crew. The mission experienced a launch anomaly shortly after liftoff, and Hague and his crewmate executed a high-G ballistic abort. The two landed safely and Hague returned to flight status within months, ultimately completing his 2019 mission.
He flew again during NASA’s SpaceX Crew-9 mission, launching in September 2024 alongside Roscosmos cosmonaut Aleksandr Gorbunov. It was the first human spaceflight mission launched from Space Launch Complex 40 at Cape Canaveral Space Force Station in Florida, and it also marked the first time a Space Force Guardian launched to space. Hague then joined the Expedition 72 crew, spending 171 days aboard the station before returning in March 2025 along with NASA astronauts Butch Wilmore and Suni Williams. During the mission, he conducted another spacewalk, bringing his career total to 25 hours and 56 minutes across four spacewalks.
“Nick’s determination and dedication to human space exploration are truly phenomenal,” said Vanessa Wyche, director of NASA’s Johnson Space Center in Houston. “His leadership and commitment to mission excellence have supported progress aboard the International Space Station and prepared us for future missions as we continue to explore farther into the solar system.”
Beyond his flight experience, Hague served in several technical and leadership roles within NASA. He supported the development of future spacecraft operations, contributed to astronaut training, and played a key role in human spaceflight safety initiatives, drawing on his firsthand experience during the MS-10 launch abort.
“Nick brought calm, clarity, and a spirit of teamwork to every situation,” said Scott Tingle, chief of the Astronaut Office at NASA Johnson. “From his work in orbit to his support of crew operations here on Earth, he exemplified what it means to be an astronaut. His impact will continue to shape the missions and the astronauts who follow.”
A native of Hoxie, Kansas, Hague is a brigadier general in the U.S. Space Force where he is responsible for the development and implementation of policy for all U. S. Space Force global operations, sustainment, training and readiness. He earned a bachelor’s degree in astronautical engineering from the U.S. Air Force Academy in Colorado and a master’s degree in astronautical engineering from the Massachusetts Institute of Technology. Before joining NASA in 2013, he served in developmental and test engineer roles supporting advanced Air Force technologies and operations at home and abroad.
“It has been an honor to serve as a NASA astronaut,” said Hague. “Working alongside incredible teams, on the ground and in space, has been the privilege of a lifetime. The International Space Station represents the very best of what humanity can accomplish when we work together. I am grateful to have contributed to that mission, and I look forward to watching NASA, our partners, and the next generation of explorers push even farther as we return to the Moon and journey on to Mars.”
To learn more about NASA’s astronauts and their contributions to space exploration, visit:
https://www.nasa.gov/astronauts
-end-
Shaneequa Vereen
Johnson Space Center, Houston
281-483-5111
shaneequa.y.vereen@nasa.gov
NASA’s Hubble Reveals Largest Found Chaotic Birthplace of Planets
- Hubble Home
- Overview
- Impact & Benefits
- Science
- Observatory
- Team
- Multimedia
- News
- More
Astronomers using NASA’s Hubble Space Telescope have imaged the largest protoplanetary disk ever observed circling a young star. For the first time in visible light, Hubble has revealed the disk is unexpectedly chaotic and turbulent, with wisps of material stretching much farther above and below the disk than astronomers have seen in any similar system. Strangely, more extended filaments are only visible on one side of the disk. The findings, which published Tuesday in The Astrophysical Journal, mark a new milestone for Hubble and shed light on how planets may form in extreme environments, as NASA’s missions lead humanity’s exploration of the universe and our place in it.
Located roughly 1,000 light-years from Earth, IRAS 23077+6707, nicknamed “Dracula’s Chivito,” spans nearly 400 billion miles — 40 times the diameter of our solar system to the outer edge of the Kuiper Belt of cometary bodies. The disk obscures the young star within it, which scientists believe may be either a hot, massive star, or a pair of stars. And the enormous disk is not only the largest known planet-forming disk; it’s also shaping up to be one of the most unusual.
“The level of detail we’re seeing is rare in protoplanetary disk imaging, and these new Hubble images show that planet nurseries can be much more active and chaotic than we expected,” said lead author Kristina Monsch of the Center for Astrophysics | Harvard & Smithsonian (CfA). “We’re seeing this disk nearly edge-on and its wispy upper layers and asymmetric features are especially striking. Both Hubble and NASA’s James Webb Space Telescope have glimpsed similar structures in other disks, but IRAS 23077+6707 provides us with an exceptional perspective — allowing us to trace its substructures in visible light at an unprecedented level of detail. This makes the system a unique, new laboratory for studying planet formation and the environments where it happens.”
The nickname “Dracula’s Chivito” playfully reflects the heritage of its researchers—one from Transylvania and another from Uruguay, where the national dish is a sandwich called a chivito. The edge-on disk resembles a hamburger, with a dark central lane flanked by glowing top and bottom layers of dust and gas.
This Hubble Space Telescope image shows the largest planet-forming disk ever observed around a young star. It spans nearly 400 billion miles — 40 times the diameter of our solar system. Image: NASA, ESA, STScI, Kristina Monsch (CfA); Image Processing: Joseph DePasquale (STScI) Puzzling asymmetryThe impressive height of these features wasn’t the only thing that captured the attention of scientists. The new images revealed that vertically imposing filament-like features appear on just one side of the disk, while the other side appears to have a sharp edge and no visible filaments. This peculiar, lopsided structure suggests that dynamic processes, like the recent infall of dust and gas, or interactions with its surroundings, are shaping the disk.
“We were stunned to see how asymmetric this disk is,” said co-investigator Joshua Bennett Lovell, also an astronomer at the CfA. “Hubble has given us a front row seat to the chaotic processes that are shaping disks as they build new planets — processes that we don’t yet fully understand but can now study in a whole new way.”
All planetary systems form from disks of gas and dust encircling young stars. Over time, the gas accretes onto the star, and planets emerge from the remaining material. IRAS 23077+6707 may represent a scaled-up version of our early solar system, with a disk mass estimated at 10 to 30 times that of Jupiter — ample material for forming multiple gas giants. This, plus the new findings, makes it an exceptional case for studying the birth of planetary systems.
“In theory, IRAS 23077+6707 could host a vast planetary system,” said Monsch. “While planet formation may differ in such massive environments, the underlying processes are likely similar. Right now, we have more questions than answers, but these new images are a starting point for understanding how planets form over time and in different environments.”
Credit: NASA’s Goddard Space Flight Center; Lead Producer: Paul MorrisThe Hubble Space Telescope has been operating for over three decades and continues to make ground-breaking discoveries that shape our fundamental understanding of the universe. Hubble is a project of international cooperation between NASA and ESA (European Space Agency). NASA’s Goddard Space Flight Center in Greenbelt, Maryland, manages the telescope and mission operations. Lockheed Martin Space, based in Denver, also supports mission operations at Goddard. The Space Telescope Science Institute in Baltimore, which is operated by the Association of Universities for Research in Astronomy, conducts Hubble science operations for NASA.
Facebook logo @NASAHubble @NASAHubble Instagram logo @NASAHubble Related Images & Videos Dracula’s Chivito (IRAS 23077+6707)This Hubble Space Telescope image shows the largest planet-forming disk ever observed around a young star. It spans nearly 400 billion miles — 40 times the diameter of our solar system.
Dracula’s Chivito (IRAS 23077+6707) Compass Image
Image of Dracula’s Chivito captured by Hubble’s WFC3 instrument, with compass arrows, scale bar, and color key for reference.
Hubble Spots Giant Vampire Sandwich? Video
Dracula’s Chivito isn’t just the largest protoplanetary disk ever imaged, it’s also a window into how planets are born and how systems like our solar system may have formed.
Claire Andreoli
NASA’s Goddard Space Flight Center
Greenbelt, Maryland
claire.andreoli@nasa.gov
Christine Pulliam
Space Telescope Science Institute
Baltimore, Maryland
Amy Oliver
Center for Astrophysics | Harvard & Smithsonian
Cambridge, Massachusetts
- Science Paper: Hubble reveals complex multi-scale structure in the edge-on protoplanetary disk IRAS 23077+6707 by K. Monsch et al.
Keep Exploring Discover More Topics From Hubble Hubble Space Telescope
Since its 1990 launch, the Hubble Space Telescope has changed our fundamental understanding of the universe.
Hubble Science Highlights
Hubble Images
Hubble News
I Am Artemis: Grace Lauderdale
Listen to this audio excerpt from Grace Lauderdale, exploration project manager for the Training Systems Office at NASA Johnson:
0:00 / 0:00
Your browser does not support the audio element.In preparation for their mission around the Moon inside NASA’s Orion spacecraft, the Artemis II crew will spend countless hours training inside the Orion Mission Simulator. The simulator replicates what the crew will experience inside the spacecraft and allows the astronauts and flight controllers to rehearse every phase of the mission.
As the exploration project manager for the Training Systems Office at Johnson, Grace Lauderdale leads the team that develops and operates the Orion Mission Simulator at NASA’s Johnson Space Center in Houston, playing a key role in making sure astronauts and flight control teams are ready for the first crewed mission of the Artemis campaign.
"This simulator trains the flight control team and the crew all the way from launch to splashdown. Every button, every display, every view out the window is as lifelike as possible.”Grace Lauderdale
Exploration Project Manager for the Training Systems Office at NASA Johnson
The simulator is more than a mock-up. It connects directly to Johnson’s Mission Control Center, sending real-time data, audio, and video — just like the spacecraft will during flight. That means the flight control team trains in parallel, seeing and hearing exactly what they would throughout the mission.
“One of our major goals is to make the data they see on their displays look like the real vehicle,” Lauderdale said. “We also simulate the near space and deep space networks, including all the communication delays. It’s all about realism.”
That realism is powered by a complex software system developed in collaboration with partners like Lockheed Martin. Lauderdale’s team works behind the scenes to ensure the simulator runs smoothly — writing code, troubleshooting issues, and even creating custom malfunctions to challenge the crew during training.
Grace Lauderdale, exploration project manager for the Training Systems Office at NASA’s Johnson Space Center in Houston, sits inside the Orion Mission Simulator used for training the Artemis II crew and flight control team.Credits: NASA/Rad SinyakTo prepare astronauts for the unexpected, instructors work with Lauderdale’s team to simulate problems that could occur during the mission, some of which require creative solutions.
“There are times when the instructors will ask for malfunctions or capabilities that the sim doesn’t automatically do,” she said. “Part of our role is to come up with ways to make that happen.”
Her team plans, develops, and executes training scenarios in the Orion Mission Simulator across multiple Artemis missions, often simultaneously. “Currently, we’re planning for future crewed missions, developing Artemis III, and executing Artemis II,” she said.
The work is demanding, but deeply personal, according to Lauderdale.
“I’ve known I wanted to work at NASA since the seventh grade. Every class I took, the degree I earned — it was all to get here.”Grace Lauderdale
Exploration Project Manager for the Training Systems Office at NASA Johnson
That passion shows in her leadership. Her team often works nights, weekends, and holidays to ensure the simulator is ready. During a recent 30-hour simulation, they spent days preparing, fixing memory issues, and ensuring the system wouldn’t crash. It didn’t.
“I’m very proud of my team,” she said. “They’ve put in countless hours of work to make sure this simulator reacts exactly as it would in the real mission.”
For Lauderdale, helping send astronauts around the Moon isn’t just a job—it’s a dream realized.
“Being part of getting us back to the Moon is very personal to me,” she said. “And I’m proud to be part of the team that will help get our astronauts there.”
Reid Wiseman and Victor Glover train for the Artemis II mission inside the Orion Mission Simulator at NASA’s Johnson Space Center in Houston. NASA/Bill Stafford About the AuthorErika Peters Share Details Last Updated Dec 22, 2025 Related Terms Explore More 3 min read Get In, We’re Going Moonbound: Meet NASA’s Artemis Closeout Crew Article 6 days ago 4 min read Artemis II Flight Crew, Teams Conduct Demonstration Ahead of Launch Article 6 days ago 6 min read NASA Kennedy Top 20 Stories of 2025 Article 7 days ago Keep Exploring Discover More Topics From NASAMissions
Humans in Space
Climate Change
Solar System
Curiosity Blog, Sols 4750-4762: See You on the Other Side of the Sun
- Curiosity Home
- Science
- News and Features
- Multimedia
- Mars Missions
- Mars Home
3 min read
Curiosity Blog, Sols 4750-4762: See You on the Other Side of the Sun NASA’s Mars rover Curiosity acquired this image, with the boxwork terrain in the foreground and Gale crater rim in the far background, using its Right Navigation Camera. Curiosity captured the image on Dec. 21, 2025 — Sol 4755, or Martian day 4,755 of the Mars Science Laboratory mission — at 15:57:21 UTC. NASA/JPL-CaltechWritten by Lucy Thompson, Planetary Scientist and APXS team member, University of New Brunswick, Canada
Earth planning date: Monday, Dec. 22, 2025
As we all prepare for the holiday season here on Earth, we have been planning a few last activities before Curiosity and the team of scientists and engineers take a well-deserved, extended break. This holiday season coincides with conjunction — every two years, because of their different orbits, Earth and Mars are obstructed from one another by the Sun; this one will last from Dec. 27 to Jan. 20. We do not like to send commands through the Sun in case they get scrambled, so we have been finishing up a few last scientific observations before preparing Curiosity for its quiet conjunction break.
As part of a pre-planned transect between our two recent drill holes, “Valle de la Luna” (hollow) and “Nevado Sajama” (ridge), we successfully completed chemical analyses and imaging of a ridge wall. These observations were acquired to document changes in texture, structure, and composition between the two drill holes and to elucidate why we see such contrasting physical features of resistant ridges and eroded hollows in this region. Mastcam and ChemCam also imaged a little further afield. ChemCam continued observations of the “Mishe Mokwa” butte and captured textures in the north facing wall of the next, adjacent hollow. Mastcam imaged the central fracture along the “Altiplano” ridge above the wall we were parked at, as well as polygonal features in our previous workspace.
The rover engineers then successfully orchestrated Curiosity’s drive back up onto the nearby ridge to ensure a safe parking spot over conjunction. We documented the drive with a MARDI sidewalk video, tracking how the terrain beneath the rover changes as we drive. Although we could not use APXS and MAHLI on the robotic arm from Friday on, owing to constraints that need to be in place prior to conjunction, we were able to use the rover’s Mastcam to image areas of interest in the near field, which will help us with our planned activities when we return from conjunction. These will hopefully include getting chemistry (with APXS and ChemCam) and imaging (with MAHLI) of some freshly broken rock surfaces that we drove over.
The environmental scientists were also very busy. Navcam observations included: Navcam suprahorizon and zenith movies to monitor clouds; Navcam line-of-sight observations; and Navcam dust-devil movies and surveys as we enter the dust storm season on Mars. Mastcam tau observations were acquired to monitor the optical depth of the atmosphere, and APXS analyses of the atmosphere were also planned to monitor seasonal variations in argon.
Today we are uplinking the last plan before Mars disappears behind the Sun and we all take a break (the actual conjunction plan to take us through sols 4763-4787 was uplinked a couple of weeks ago). Because of constraints put in place to make sure Curiosity stays safe and healthy, we were limited to very few activities in today’s plan. These include more APXS atmospheric argon measurements and Hazcam and Navcam imaging including monitoring for dust-devil activity.
As usual, our plans also included background DAN, RAD, and REMS observations, which continue through conjunction.
It has been a pleasure to be a part of this amazing team for another year. We are all looking forward to coming back in January, when Mars reappears from behind the Sun, to another exciting year of roving in Gale crater.
-
Want to read more posts from the Curiosity team?
-
Want to learn more about Curiosity’s science instruments?
Article
3 days ago
3 min read Curiosity Blog, Sols 4743-4749: Polygons in the Hollow
Article
4 days ago
2 min read Hi ya! Hyha
Article
5 days ago
Keep Exploring Discover More Topics From NASA Mars
Mars is the fourth planet from the Sun, and the seventh largest. It’s the only planet we know of inhabited…
All Mars Resources
Explore this collection of Mars images, videos, resources, PDFs, and toolkits. Discover valuable content designed to inform, educate, and inspire,…
Rover Basics
Each robotic explorer sent to the Red Planet has its own unique capabilities driven by science. Many attributes of a…
Mars Exploration: Science Goals
The key to understanding the past, present or future potential for life on Mars can be found in NASA’s four…
Holidays in Space: 25 Years of Space Station Celebrations
In the quarter century that humans have lived and worked aboard the International Space Station, astronauts and visitors from around the world have celebrated countless holidays more than 250 miles above Earth while traveling 17,500 miles per hour. Crews have marked Thanksgiving, Christmas and Hanukkah, New Year’s, birthdays, and national holidays as they circle the planet every 90 minutes.
Holiday traditions in space often look familiar, just adapted for microgravity. NASA astronauts share special meals packed by the Space Food Systems Laboratory at the agency’s Johnson Space Center in Houston, where crews select their menus with help from nutritionists and food scientists before launch. Cargo launches arriving before special occasions often deliver Holiday Bulk Overwrapped Bags filled with foods like clams, oysters, turkey, green beans, and smoked salmon, along with shelf-stable treats such as candies, icing, almond butter, and hummus.
Crew members exchange small gifts that float through the modules, add festive decorations around the station, and connect with loved ones through video calls. Astronauts also send holiday greetings to Earth, a reminder that even in space, home is never far away.
The Expedition 73 crew share a holiday message aboard the International Space Station in Dec. 2025.Enjoy 25 years of celebrations below.
NASA astronauts Nick Hague and Suni Williams, Expedition 72 flight engineer and commander, share snacks and goodies on Christmas Eve in 2024 inside the gallery of the space station’s Unity module.NASA Four Expedition 70 crewmates join each other inside the space station’s Unity module for a Christmas Day meal in Dec. 2023. From left are, Flight Engineer Koichi Wakata from JAXA (Japan Aerospace Exploration Agency); Commander Andreas Mogensen from ESA (European Space Agency); and NASA Flight Engineers Loral O’Hara and Jasmin Moghbeli.NASA ESA astronaut Samantha Cristoforetti pictured aboard the space station on Dec. 20, 2014, during Expedition 42.NASA Expedition 4 crew members, former NASA astronauts Daniel Bursch and Carl Walz, along with Roscosmos cosmonaut Yuri Onufriyenko, pose for a Christmas photo in Dec. 2001. NASA The Expedition 64 crew celebrate Christmas in 2019 with a brunch inside the space station’s Unity module decorated with stockings, flashlight “candles” and a Christmas tree banner. Clockwise from bottom left are, NASA Flight Engineers Jessica Meir and Christina Koch, Roscosmos Flight Engineers Oleg Skripochka and Alexander Skvortsov, NASA Flight Engineer Drew Morgan, and Commander Luca Parmitano of ESA. Expedition 13 crew members, Roscosmos cosmonaut Valery I. Tokarev, left, and former NASA astronaut William McArthur, pose with Christmas stockings in Dec. 2005.NASA The six Expedition 30 crew members assemble in the U.S. Destiny laboratory aboard the space station for a Christmas celebration in Dec. 2011. NASA Four Expedition 70 crewmates join each other inside the space station’s Unity module for Christmas Eve festivities in 2023. From left are, NASA Flight Engineers Jasmin Moghbeli and Loral O’Hara; Flight Engineer Koichi Wakata from JAXA; and Commander Andreas Mogensen from ESA.NASA Expedition 22 crew members celebrate the holidays aboard the orbital outpost in Dec. 2009. In the front row are former NASA astronaut Jeffrey Williams, commander (right), and Russian cosmonaut Maxim Suraev, flight engineer. In the back row, from left, are Russian cosmonaut Oleg Kotov, former NASA astronaut T.J. Creamer, and JAXA astronaut Soichi Noguchi, all flight engineers. NASA Expedition 50 crew members celebrate the holidays aboard the orbiting laboratory in Dec. 2016.NASA NASA astronauts Don Pettit and Suni Williams, Expedition 72 flight engineer and commander, pose for a fun holiday season portrait while speaking on a ham radio inside the space station’s Columbus laboratory module.NASA NASA astronaut and Expedition 72 Commander Suni Williams shows off a holiday decoration of a familiar reindeer aboard the space station on Dec. 16, 2024. The decoration was crafted with excess hardware, cargo bags, and recently-delivered Santa hats.NASAThe space station remains a vital scientific platform, providing the foundation needed to survive and thrive as humanity ventures into the unexplored territories of our universe.
Learn more about the space station’s 25 years of continuous human presence and explore stories, images, and research at:
https://www.nasa.gov/international-space-station/iss25
Explore More 3 min read Get In, We’re Going Moonbound: Meet NASA’s Artemis Closeout Crew Article 2 days ago 4 min read Artemis II Flight Crew, Teams Conduct Demonstration Ahead of Launch Article 2 days ago 6 min read NASA Kennedy Top 20 Stories of 2025 Article 3 days agoSentinels in the Sky: 50 Years of GOES Satellite Observations
15 min read
Sentinels in the Sky: 50 Years of GOES Satellite ObservationsIntroduction
In an era where satellite observations of Earth are commonplace, it’s easy to forget that only a few decades ago, the amount of information available about the state of Earth’s environment was limited; observations were infrequent and data were sparsely located.
As far back as the late 1950s, there were primitive numerical weather prediction (NWP) models that could produce an accurate (or what a forecaster would call “skillful”) forecast given a set of initial conditions. However, the data available to provide those initial conditions at that time were limited. For example, the weather balloon network circa 1960 only covered about 10% of the troposphere and did not extend into the Southern Hemisphere, the tropics, or over the ocean.
Weather forecasters of the pre-satellite era typically relied upon manual analysis of plotted weather maps, cloud observations, and barometric pressure readings when making forecasts. They combined this limited dataset with their own experience issuing forecasts in a particular area to predict upcoming weather and storm events. While those pioneering forecasters made the most of the limited tools available to them, poor data – or simply the lack of data – inevitably led to poor forecasts, which usually weren’t accurate beyond two days. This time duration was even less than that in the Southern Hemisphere. As a result, the forecasts issued typically lacked the specificity and lead time required to adequately prepare a community before a snowstorm or hurricane.
Although the first satellite observations (e.g., from the Television Infrared Observation Satellite (TIROS) program or early Nimbus missions) whet forecasters’ appetites for what might be possible in terms of improving weather forecasting, polar orbiting satellites could only observe a given location twice a day. Those snapshots from above were insufficient for tracking rapidly evolving weather phenomena (e.g., thunderstorms, tornadoes, and intensification of hurricanes). Beyond cloud information, forecasters required data on temperature, moisture, and wind profiles in the atmosphere in addition to output from NWP models.
It was the advent of geostationary observations (also called geosynchronous) that truly led to revolutionary advances in weather forecasting. This approach enabled continuous monitoring of the atmosphere over a particular region on Earth. Hence, the development and evolution of NOAA’s Geostationary Operational Environmental Satellites (GOES) has been a major achievement for weather forecasting.
For 50 years, GOES have kept a constant vigil over the Western Hemisphere and monitored the Sun and the near-Earth environment – see Visualization 1. Since 1975, the National Oceanic and Atmospheric Administration (NOAA) and NASA have partnered to advance NOAA satellite observations from geostationary orbit. GOES satellites serve as sentinels in the sky, keeping constant watch for severe weather and environmental hazards on Earth as well as dangerous space weather. This narrative will focus on the development and evolutions of the Earth observing instruments on GOES with a mention of several of the space weather instruments.
Visualization 1. A YouTube video, created for the 50th anniversary of GOES, examines the partnership between the National Oceanic and Atmospheric Administration (NOAA) and NASA to advance NOAA satellite observations from geostationary orbit to monitor for weather and environmental hazards on Earth as well as dangerous space weather.Visualization credit: NOAA/NASA
Reaching a half-century of operation is a remarkable achievement for GOES, or any mission. The Earth Observer has published several articles chronicling the milestones of Earth observing missions, including The Vanguard of Earth-Observing Satellites [March–April 2019, 31:2, 7–18], Nimbus Celebrates Fifty Years [March–April 2015, 27:2, 18–31], and NASA Participates in Pecora 22 Symposium and Celebrates Landsat 50th Anniversary [Nov.–Dec. 2022, 34:6, 4–9]. This article, reflecting on GOES accomplishments, will join that list.
The article provides the history leading up to the development of GOES and traces the development of GOES from the earliest launch in 1975 to the last launch in late 2024, which completed the GOES–R series – see Figure 1. The article ends with a look at the plans for Geostationary Extended Observations (GeoXO), which seeks to extend the GOES legacy to the middle of the 21st century, followed by some concluding thoughts.
Figure 1. Timeline of GOES launches including key technological developments associated with each “generation” of satellites.Figure credit: NOAA/NASAGOES Heritage Missions: ATS and SMS
The heritage of GOES can be traced to the Applications Technology Satellite (ATS) series, which consisted of a set of six NASA spacecraft launched from December 7, 1966 to May 30, 1974. These missions were created to explore and flight-test new technologies and techniques for communications, meteorological, and navigation satellites. ATS was a multipurpose engineering satellite series, testing technology in communications and meteorological applications from geosynchronous orbit.
ATS satellites aimed to test the theory that gravity would anchor a satellite in a synchronous orbit, 22,300 statute miles (37,015 km) above the Earth. This orbit allowed the satellites to move at the same rate as the Earth, thus seeming to remain stationary. Although the ATS satellites were intended mainly as testbeds, they also collected and transmitted meteorological data and functioned at times as communications satellites. For example, ATS-6, the last in the series, was the first to use an education and experimental direct broadcast system, which is now commonplace on Earth observing satellites (e.g., Terra).
Also included in the ATS payload was a spin-scan camera that Verner Suomi and associates had developed in the early 1960s. The device was so named because it compensated for the motion of the satellite and still obtained clear visible (television-like) photographs. The University of Wisconsin, Madison’s (UWM) Space Science and Engineering Center (SSEC), which Suomi and colleagues at UWM had just recently established, funded the camera’s development and NASA approved its inclusion as part of the ATS payload. The spin-scan camera on ATS-1 produced spectacular full disk images of Earth; a few years later the camera on ATS-3 produced similar images, this time in color.
Although designed primarily to test and demonstrate new technologies, imagery captured by the ATS payload led to some serendipitous science. Analysis of spin-scan camera images, while labor intensive and expensive and not practical for use operationally, led to new discoveries about storm origins that had never before been available. For example, Tetsuya Fujita analyzed ATS camera images of storms in the Midwest United States in 1968 as part of his in-depth studies of tornadoes. This work led to the development of the Fujita Scale for tornado intensity. Also in 1968, “Hurricane Hunter” aircraft data and radar imagery, along with ATS images allowed meteorologists to observe the complete life cycle of Hurricane Gladys. Today, this approach is routine, but at the time it was groundbreaking.
Following the success of the ATS “technology demonstration” series, NASA and NOAA began to develop an operational prototype of the dedicated geosynchronous weather satellite, the Synchronous Meteorological Satellite (SMS). SMS-1 was launched in 1974, with SMS-2 following the next year. Owned and operated by NASA, the SMS satellites were the first operational satellites designed to sense meteorological conditions in geostationary orbit over a fixed location on the Earth’s surface. The ATS spin-scan camera manufacturers – SSEC and Santa Barbara Research – altered their ATS camera design, replacing the television-like photographic apparatus with an imaging radiometer with eight visible and three infrared channels. The revised instrument became known as the Visible and Infrared Spin-Scan Radiometer (VISSR). They also added a telescope that would allow for high-resolution imaging of smaller portions of Earth, allowing researchers to study storm formation in more detail.
First Generation: GOES 1–3
The GOES era began in October 1975 with the launch of GOES-1 (initially called SMS-3). The first three GOES missions were spin-stabilized satellites. The VISSR instrument, initially developed for the SMS missions, became the workhorse instrument for the first generation of GOES missions. VISSR provided high-quality day and night observations of cloud and surface temperatures, cloud heights, and wind fields – see Figure 2.
The early GOES missions also focused on monitoring space weather. The first generation of GOES featured a Space Environment Monitor (SEM) to measure proton, electron, and solar X-ray fluxes as well as magnetic fields around the satellites. This technology became standard on all subsequent GOES satellite missions.
Figure 2. First image from GOES-1 obtained on October 25, 1975.Figure credit: NOAAThe new satellites quickly began providing critical information about the location and trajectory of hurricanes. The earliest generation of GOES provided crucial data about Tropical Storm Claudette and Hurricane David in 1979 – both of which devastated regions of the United States.
Second Generation: GOES 4–7
The second generation of GOES began in 1980, with the launch of GOES-4. NASA, NOAA, and SSEC collaborated to make further enhancements to the VISSR instrument, adding temperature sounding capabilities. The development of the VISSR Atmospheric Sounder (VAS) was particularly helpful for the study and forecasting of severe storms. While there were sounders on polar orbiting satellites of this era (e.g., TIROS and Nimbus), polar orbiters, which take measurements of the same location twice daily, often missed events that occurred on shorter timescales, such as thunderstorms. By contrast, VAS on GOES could image the same area every half-hour, allowing for more detailed tracking of storms, leading to improved severe storm forecasting and enabling more advanced warning of the storm’s arrival. VAS became the basis for the establishment of an extensive severe storm research program during the 1980s.
The second generation GOES missions were capable of obtaining vertical profiles of temperature and moisture throughout the various layers of the atmosphere. This added dimension gave forecasters a more accurate picture of a storm’s extent and intensity, allowed them to monitor rapidly changing events, and helped to predict fog, frost, and freeze, as well as dust storms, flash floods, and even the likelihood of tornadoes.
The second generation of GOES helped forecasters track and forecast the impacts from the 1982–1983 El Niño event – one of the strongest El Niño–Southern Oscillation (ENSO) events on record that led to significant economic losses. This generation of GOES satellites also gave forecasters vital information about Hurricane Juan in 1985 and Hurricane Hugo in 1989, both destructive storms for areas of the United States – see Figure 3.
Figure 3. GOES-7 infrared image of Hurricane Hugo on September 22, 1989.Figure credit: NOAAGOES-7, launched in 1987, added the new capability of detecting distress signals from emergency beacons. These GOES satellites have helped to rescue thousands of people as part of the Search and Rescue Satellite-Aided Tracking (SARSAT) system developed to detect and locate mariners, aviators, and other recreational users in distress. This system uses a satellite network to detect and locate distress signals from emergency beacons on aircraft and vessels and from handheld personal locator beacons (PLBs) quickly. The SARSAT transponder on GOES immediately detects distress signals from emergency beacons and relays them to ground stations. In turn, this signal is routed to a SARSAT mission control center and then sent to a rescue coordination center, which dispatches a search and rescue team to the location of the distress call.
Third Generation: GOES 8–12
In 1994, advances in two technologies enabled another significant leap forward in capabilities for GOES: improved three-axis stabilization of the spacecraft and separating the imager and sounder into two distinct instruments with separate optics (e.g., GOES Imager and GOES Sounder). Simultaneous imaging and sounding gave forecasters the ability to use multiple measurements of weather phenomena, resulting in more accurate forecasts. Another improvement was flexible scanning, where the satellites could temporarily suspend their routine scans of the hemisphere to concentrate on a small area to monitor quickly evolving events. This capability allowed meteorologists to study local weather trouble spots, improving short-term forecasts.
In 2001, forecasters used GOES-8 to track the slow-moving remnants of Tropical Storm Allison, stalled over the Gulf Coast. During the next four days, Allison dropped more than three feet of rain across portions of coastal Texas and Louisiana, causing severe flooding, particularly in the Houston area.
GOES-12, the final satellite in the third generation, launched in 2001. It included a new Solar X-ray Imager (SXI) as part of its payload. SXI was the first X-ray telescope that could take a full-disk image of the Sun, which enabled forecasters to detect solar storms and better monitor and predict space weather that could affect Earth. Some geomagnetic storms can damage satellites, disrupting communications and navigation systems, impacting power grids, and harming astronauts in space.
Fourth Generation: GOES 13–15
By the mid-2000s, the fourth generation of GOES, known as the GOES-N series, enhanced the mission with improvements to the Image Navigation and Registration subsystem, including star-trackers, to better determine the coordinates of intense storms. Improvements in batteries and power systems allowed this generation to provide continuous imaging. GOES-13 also added an Extreme Ultraviolet Sensor, which monitored ultraviolet emissions from the Sun as well as the solar impact on satellite orbit drag and radio communications.
In April 2011, GOES-13 monitored the record-breaking tornado outbreak that hit the Southeastern United States – see Visualization 2. From April 25–28, 362 tornadoes carved a path across a dozen states, leaving an estimated 321 people dead. In 2012, NOAA operated GOES-14, the on-orbit backup satellite, in a special rapid-scan test mode, providing one-minute imagery of Tropical Storm Isaac and Hurricane Sandy, both destructive storms.
Visualization 2. GOES-13 visible imagery showing clusters of severe thunderstorms on April 27, 2011, that spawned several tornadoes.Visualization credit: NOAAThe GOES-R Series: GOES-16–19
NASA launched the first satellite in the GOES-R Series for NOAA in 2016. The GOES-R Series brought new state-of-the-art instruments into orbit, including the Advanced Baseline Imager (ABI), a high-resolution imager with 16 channels, and the Geostationary Lightning Mapper, the first lightning mapper flown in geostationary orbit. The satellites also gained the ability to concurrently provide a full-disk image every ten minutes, a contiguous United States image every five minutes, and two smaller localized images every 60 seconds (or one domain every 30 seconds). For the first time, meteorologists could see the big picture while simultaneously zooming in on a specific weather event or environmental hazard.
The latest GOES satellite series brought revolutionary improvements, providing minute-by-minute information to forecasters, decision-makers, and first responders to give early warning that severe weather is forming, monitor and track the movement of storms, estimate hurricane intensity, detect turbulence, and even spot fires before they are reported on the ground.
The GOES-R Series satellites also carry a suite of sophisticated solar imaging and space weather monitoring instruments. The final satellite in the series, GOES-19, is also equipped with NOAA’s first compact coronagraph (CCOR-1). This instrument images the solar corona (the outer layer of the Sun’s atmosphere) to detect and characterize coronal mass ejections, which can disrupt Earth’s magnetosphere, leading to geomagnetic storms, auroras, and potential disruptions to technology, including electricity and satellite communications.
In 2017, Hurricane Maria knocked out Puerto Rico’s radar just before landfall. With this critical technology disabled and a major hurricane approaching, forecasters used 30-second data from GOES-16 to track the storm in real-time – see Visualization 3. The satellite’s rapid scanning rate allowed forecasters to analyze cloud patterns and understand the evolution of Maria’s position and movement as well as discern the features within the hurricane’s eye to estimate intensity.
To view this video please enable JavaScript, and consider upgrading to a web browser that supports HTML5 video
Visualization 3. GOES-16 GeoColor image of Hurricane Maria over Puerto Rico as it made landfall on September 20, 2017. Visualization credit: NOAA/CIRAThe most recent generation of satellites also significantly improved fire detection and monitoring. During California’s Camp Fire in 2018, GOES-16 played a crucial role in monitoring the fire’s progression and smoke plumes, assisting the efforts to contain the fire – see Visualization 4. The satellite provided an extremely detailed picture of fire conditions, quick detection of hot spots, and the ability to track the fire’s progression and spread in real-time. Forecasters used ABI data from GOES-16 to track the fire’s movement and intensity even before ground crews could fully see it due to thick smoke. Not only did the data help firefighters fight the fire more effectively, but it also helped keep firefighters safe during the disaster.
To view this video please enable JavaScript, and consider upgrading to a web browser that supports HTML5 video
Visualization 4. Fire hot spots and a large plume of smoke are seen in this GOES-16 fire temperature red-green-blue imagery with GeoColor enhancement of the Camp Fire in northern California on November 8, 2018.Visualization credit: NOAA/CIRAWhat’s Next? GeoXO
NOAA, NASA, and industry partners are now developing the future generation of geostationary satellites. The Geostationary Extended Observations (GeoXO) will provide continuity of observation from geostationary orbit as the GOES-R series nears the end of its operational lifetime. The first GeoXO launch is planned for launch in the early 2030s.
GeoXO will prioritize and advance forecasting and warning of severe weather. Similar to GOES, the information GeoXO gathers will also be used to detect and monitor environmental hazards (e.g., wildfires, smoke, dust, volcanic ash, drought, and flooding).
The more advanced observing capabilities will allow forecasters to provide earlier warning to decision makers, improve the skillfulness of short-term forecasting, and allow for greater lead times for warnings of severe weather and other hazards that threaten the security and well-being of everyone in the Western Hemisphere well into the 2050s.
Conclusion
For 50 years, GOES satellites have provided the only continuous coverage of the Western Hemisphere. Their data have been the backbone of short-term forecasts and warnings of severe weather and environmental hazards. GOES detect and monitor events as they unfold, providing forecasters with real-time information to track hazards as they happen. They are also part of a global ring of satellites that contribute data to numerical weather prediction models. GOES also monitors the Sun and provides critical data for forecasts and warnings of space weather hazards.
Each successive generation of GOES has brought advancements and new capabilities that have improved the skill of short-term weather forecasts and our ability to prepare for and respond to severe weather and natural disasters. The information the satellites supply is essential for public safety, protection of property, and efficient economic activity. Meteorologists, emergency managers, first responders, local officials, aviators, mariners, researchers, and the general public depend on GOES. Everyone in the Western Hemisphere benefits from GOES data each and every day.
Acknowledgment
The primary source for the information provided in the section on “GOES Heritage Missions” was Conway, Eric: Atmospheric Science at NASA: A History (2008), pp. 140–41.
Michelle Smith
NOAA Satellite and Information Service
michelle.smith@noaa.gov
Alan Ward
NASA’s Goddard Space Flight Center/Global Science & Technology Inc.
alan.b.ward@nasa.gov
Keeping Up with PACE: Summary of the 2025 PAC3 Meeting
12 min read
Keeping Up with PACE: Summary of the 2025 PAC3 MeetingIntroduction
Launched in Feb. 2024, NASA’s Plankton, Aerosol, Cloud, ocean Ecosystem (PACE) mission is a cornerstone of Earth system science designed to deepen our understanding of how these environmental and biological components come together to influence our climate, carbon cycle, and ecosystems. PACE has funded three supporting components: the PACE Postlaunch Airborne eXperiment (PACE–PAX), the third PACE Science and Applications Team (SAT3), and the PACE Validation Science Team (PVST). Each group serves distinct but interdependent roles in advancing the scientific objectives of the mission through product development and rigorous assessment of data quality.
Recognizing the interconnected focus areas among these groups, the organizers consolidated this year’s separate gatherings into one comprehensive event – the “PAC3” meeting. The combined meeting took place from Feb. 18–21, 2025 at NASA’s Goddard Institute for Space Studies (GISS) in New York City, just 10 days after the first anniversary of the PACE launch – see Photo 1 and Photo 2.
Photo 1. Plankton, Aerosol, Cloud, ocean Ecosystem (PACE) scientists celebrated the one-year anniversary of the satellite’s orbit (February 8, 2025) during the PAC3 meeting. A “birthday” celebration took place during the meeting, complete with cake. Shown here are [left to right]: Ivona Cetinić [NASA’s Goddard Space Flight Center (GSFC)/Morgan State University, Ocean Ecology Laboratory (OEL)—PACE Validation Science Team lead, PACE-PAX Deputy Mission Scientist], Erin Urquhart Jephson [NASA Headquarters (HQ)—Program Manager of the NASA Earth Action Water Resources Program, PACE Program Applications Lead], Cecile Rousseaux [GSFC, OEL—PACE Science and Applications Team Lead], Kirk Knobelspiesse [GSFC, OEL—PACE Polarimeter Lead, PACE-PAX Mission Scientist], Jeremy Werdell [GSFC, OEL—PACE Project Scientist], Laura Lorenzoni [NASA HQ—Ocean Biology and Biogeochemistry Program Scientist, PACE Program Scientist], Brian Cairns [NASA Goddard Institute for Space Studies (GISS)—PACE Deputy Project Scientist, PACE-PAX Deputy Mission Scientist], and Bryan Franz [GSFC, OEL—PACE Science Data Segment Lead].Photo credit: Judy Alfter [NASA Ames Research Center (ARC)/Bay Area Environmental Research Institute (BAER)] Photo 2. With over 100 in-person and virtual attendees, the PAC3 meeting brought together representatives from each of the three overlapping activities for discussions on the status and plans for Plankton, Aerosol, Cloud, ocean Ecosystem (PACE) and related activities. The recently renovated meeting space at the NASA Goddard Institute for Space Studies (GISS) in New York City provided an ideal venue for interdisciplinary discussions and knowledge-sharing.Photo credit: Sabrina Hosein [NASA GISS/Adnet Systems]The PACE Mission and Payload
PACE’s long-term objectives focus on understanding ocean and terrestrial ecosystem productivity, detecting harmful algal blooms, exploring relationships between aerosols and clouds, and integrating these insights into Earth system science to enhance both research and decision-making capacities. These goals are accomplished by the advanced suite of three complementary instruments.
The Ocean Color Instrument (OCI) is a hyperspectral radiometer that measures ocean ecosystems’ biological, biogeochemical, and physical dynamics by capturing light over hundreds of narrow wavelengths from the deep ultraviolet to the infrared. Additionally, the broad spectral range and spectral resolution of the measurements allow the research community to characterize aerosols, clouds, land surfaces, and trace gases.
The Hyper-Angular Rainbow Polarimeter #2 (HARP2) is a multiangle polarimeter with a wide swath, four visible–near infrared (VIS–NIR) spectral channels, and between 10 and 60 viewing angles (i.e., the hyperangular capability) in each spectral channel. HARP2 is designed for retrieval of cloud and aerosol properties.
The Spectropolarimeter for Planetary Exploration (SPEXone) is also a multiangle polarimeter with different and complementary properties to HARP2. SPEXone has a narrow swath and five viewing angles with a spectral sensitivity of 100 bands from the ultraviolet to the near infrared. It is optimized for the retrieval of aerosol properties.
More details about the PACE mission can be found at its website.
PACE Mission Updates
The PAC3 meeting included a review of the PACE mission’s status and recent developments. This overview included meeting status updates on OCI, SPEXone, and HARP2 from their respective instrument scientists: Gerhard Meister [NASA’s Goddard Space Flight Center (GSFC)], Otto Hasekamp [Space Research Organization, Netherlands (SRON)], and Vanderlei Martins [University of Maryland, Baltimore County (UMBC)]. This section of the meeting covered updates on the early mission data availability and accessibility, including a review of the PACE data website. These details are summarized on the PACE data availability website and the ‘help hub’.
OCI
Meister reported that OCI has exceeded radiometric performance requirements, delivering highly accurate hyperspectral data. He noted that, with the release of Version 3 (V3) data reprocessing, OCI calibration now uses only on-orbit solar diffuser measurements to improve temporal stability. Key improvements of V3 include enhanced corrections for atmospheric absorbing gas effects and updated bidirectional reflectance distribution function (BRDF) parameters. Meister said that analysis of temporal trends has revealed solar diffuser degradation in the ultraviolet range, with ongoing corrections being made. For example, he cited how the team is using the solar diffuser that is only exposed once a month to correct the observations of the solar diffuser that is exposed daily. He also discussed other anomalies, including striping around 10° scan angle, reduced accuracy in the 590–610 nm region and implementation of crosstalk correction to compensate for reduced accuracy of wavelength measurements in the ultraviolet (i.e., for wavelengths shorter than 340 nm).
SPEXone
Hasekamp reported that SPEXone is delivering quality radiometric and polarimetric data. The team has developed the Remote Sensing of Trace Gases and Aerosol Products (RemoTAP) algorithm, an advanced aerosol retrieval algorithm that determines the total atmospheric column of aerosols, aerosol size distribution information, energy absorbed by aerosols, and vertical extent of the aerosol layer. Hasekamp showed that observations demonstrate minimal bias in size distribution retrievals across low aerosol optical depth (AOD) environments and these observations have good agreement with observations from ground-based Sun photometers that are part of the Aerosol Robotic Network (AERONET). He added that future updates will address radiometric calibration discrepancies with OCI.
HARP2
Martins reported that HARP2 continues to perform well and is delivering polarization-sensitive observations of aerosols and clouds. He noted that plans include making continued geolocation and calibration refinements, as well as cross-calibration with OCI and SPEXone to harmonize all the PACE radiometric data products.
PACE Data Access and Website Resources
Several presentations outlined the tools and platforms available to make data from the PACE mission accessible to the broader scientific community.
Alicia Scott [GSFC/Science Applications International Corporation (SAIC)] described capabilities provided by the Ocean Biology Distributed Active Archive Center (OB.DAAC). The OB.DAAC stores and processes data from all PACE instruments using tools, such as Earthdata Search and earthaccess Python libraries that enable user-friendly data retrieval pipelines. Training resources and tutorials are available to streamline usage.
Carina Poulin [GSFC/Science Systems and Applications, Inc (SSAI)] provided an overview of the PACE Data Website, which serves as a central hub for accessing datasets, reprocessing information, and product tutorials. The V3 landing page provides details on calibration updates, validation results, and pathways for integrating PACE data into user workflows.
EarthCARE Mission Updates
Many of PACE’s science objectives dovetail with that of the Earth Clouds, Aerosols, and Radiation Explorer (EarthCARE), a joint venture by the European Space Agency (ESA) and Japan Aerospace Exploration Agency (JAXA). Hence, the PAC3 meeting included participation from the EarthCARE teams. The EarthCARE observatory has four advanced instruments: a high spectral resolution ATmospheric LIDar (ATLID), a doppler capable Cloud Profiling Radar (CPR), a Multi-Spectral Imager (MSI), and a Broad-Band Radiometer (BBR). The measurements from EarthCARE complement those of PACE and enable cross validation, enriching scientific knowledge of complex Earth system processes. The synergistic nature of these missions also means that validation activities for one are well suited to both. For example, the Plankton, Aerosol, Cloud, ocean Ecosystem Postlaunch Airborne eXperiment (PACE-PAX) field campaign (discussed later in this article) incorporated validation activities for EarthCARE, and EarthCARE funded campaigns have made observations during PACE overpasses.
Rob Koopman [ESA] outlined progress on EarthCARE, including preparation for validation activities as part of ESA and JAXA’s joint efforts. He reported that the mission’s ATLID lidar data products are in excellent alignment with airborne High Spectral Resolution Lidar (HSRL) datasets (flown during PACE-PAX). Koopman showed preliminary results from underflights with NASA aircraft that demonstrate high accuracy for cloud and aerosol retrieval, albeit with some calibration challenges that will require further refinement. He also said that several EarthCARE–PACE mutual validation campaigns are planned to ensure inter-mission consistency across critical science products.
PACE–PAX Sessions
The first component of the PAC3 meeting focused on PACE–PAX, a field campaign conducted in California and adjacent coastal regions during Sept. 2024 – see Figure 1. Kirk Knobelspiesse [GSFC, OEL—PACE Polarimeter Lead, PACE-PAX Mission Scientist], Ivona Cetinić [NASA’s Goddard Space Flight Center (GSFC)/Morgan State University, Ocean Ecology Laboratory (OEL)—PACE Validation Science Team lead, PACE-PAX Deputy Mission Scientist], and Brian Cairns [NASA Goddard Institute for Space Studies (GISS)—PACE Deputy Project Scientist, PACE-PAX Deputy Mission Scientist] led the campaign, which, in addition to personnel from most NASA Centers, had participation from academia (e.g., University of Maryland, Baltimore County), other government agencies (e.g., Naval Postgraduate School and National Oceanic and Atmospheric Administration), and international space agencies (e.g., Space Research Organization, Netherlands).
Figure 1. Montage of activities during the Plankton, Aerosol, Cloud, ocean Ecosystem Postlaunch Airborne eXperiment (PACE–PAX) field campaign, which successfully concluded on Sept. 30, 2024. The campaign made atmospheric, ocean, and land surface measurements to validate observations from the recently launched NASA PACE and European Space Agency (ESA) and Japan Aerospace Exploration Agency (JAXA) Earth Clouds, Aerosols, and Radiation Explorer (EarthCARE) missions. Clockwise from top left: Mike Ondrusek [NOAA R/V Shearwater Mission Scientist] waves to the Naval Postgraduate School (NPS) Twin Otter as it performs a low altitude sample. Photo of the Bridge fire from Kirt Stallings [NASA ARC Earth Resources-2 (ER-2) Pilot]. Carl Goodwin [NASA/Jet Propulsion Laboratory] performs calibration at Ivanpah Playa, CA, the primary reference site for space-based remote sensing observations located in the Mojave Desert. Scott Freeman and Harrison Smith [both GSFC] deploy instrumentation from the R/V Shearwater in the Santa Barbara Channel. Instrument integration on the NASA ER-2 in preparation for PACE-PAX. San Francisco observed by the NPS Twin Otter as it samples at low altitude over the San Francisco Bay. The R/V Shearwater seen from the NPS Twin Otter. Figure credit(s): Clockwise from top left: NASA; Kirt Stallings; Regina Eckert [NASA/Jet Propulsion Laboratory]; Luke Dutton [National Oceanic and Atmospheric Administration]; Martijn Smit [Space Research Organization, Netherlands]; Luke Ziemba [NASA’s Langley Research Center (LaRC)]; Luke Ziemba.Campaign Overview
The PACE–PAX mission supported the PACE Science Data Product Validation Plan. This included validation of new PACE and EarthCARE products, data collection during instrument overpasses, verification of radiometric and polarimetric measurements, and targeted investigation of region-specific phenomena (e.g., multilayer aerosols and phytoplankton blooms).
Operational Highlights
PACE–PAX used a diverse array of platforms to collect atmospheric and oceanic data, including aircraft [e.g., NASA Earth Resources-2 (ER-2) and the Naval Postgraduate School’s Center for Interdisciplinary Remotely Piloted Aircraft Studies (CIRPAS) Twin Otter], research vessels (NOAA’s R/V Shearwater and the 30-foot sailboat R/V Blissfully), and ground-based instruments such as Sun photometers and lidars. Key achievements include 13 ER-2 and 17 Twin Otter science flights, 15 RV Shearwater and 9 R/V Blissfully day cruises. These flights and ocean surveys supported 16 days of observations during a PACE overpass, six days of observations during an EarthCARE overpass, ground vicarious calibration at Ivanpah Playa, CA, numerous overflights of AERONET ground sites. Beyond validation, several unique events were observed that may be of interest for scientific purposes. Intense wildfires (e.g., the Bridge, Airport, and Line fires in 2024) were observed in Southern California in mid-September, while a red tide outbreak was observed later in the month along the Northern California coast – see Figure 2. Additionally, elements of the PVST coordinated their own validation efforts with the PACE–PAX campaign.
Figure 2. Red tide blooms in Northern California as seen from three remote sensing tools on the Plankton, Aerosol, Cloud, ocean Ecosystem Postlaunch Airborne eXperiment (PACE–PAX). [Left] An image taken from the NPS Twin Otter on Sept. 24, 2024. [Right] The PACE Ocean Color Instrument (OCI) image collected on Sept. 27, 2024 with modified red-tide index applied to OCI data. [Center Inset] An Imaging FlowCytobot (IFCB) image taken on Sept. 27, 2024 at the Santa Cruz, CA pier.Figure Credits: [Left] Eddie Winstead [NASA’s Langley Research Center (LaRC)]; [right] NASA; [inset] Clarissa Anderson [University of California, San Diego]Preliminary Findings
Highlights of the PACE-PAX sessions demonstrated:
- validation of EarthCARE and PACE aerosol and cloud products using the HSRL2 on NASA ER-2,
- validation of PACE cloud products using polarimeters operating on the NASA ER-2 and in situ sensors on the CIRPAS Twin Otter,
- numerous successful matchups of hyperspectral data from OCI on PACE with field measurements of chlorophyll-a captured during ship campaigns, and
- observations of diverse phenomena (e.g., marine stratocumulus clouds and transported wildfire aerosols over clouds), which supported the testing of new retrieval algorithms.
The early results show the critical role that validation activities, such as PACE–PAX, play in creating a bridge between orbital science and ground truth.
PACE Science and Application Team (SAT3) Session
SAT3, with a focus on both science and applications, offered a compelling second component of the PAC3 meeting. The Earth Observer has previously reported on PACE applications, most recently in the 2023 article, Preparing for Launch and Assessing User Readiness: The 2023 PACE Applications Workshop [Nov–Dec 2023, 35:6, 25–32]. The SAT3 team convened during PAC3 to explore how PACE data could enhance research in diverse scientific fields and support applied uses for societal benefit. Dedicated sessions provided updates on ongoing NASA-funded projects to retrieve new geophysical variables, improve data assimilation, and refine product development pipelines.
SAT3 teams presented early results including studies that use PACE’s OCI to make pigment-specific absorption measurements, study diatom biomass retrieval, and gather chlorophyll concentration estimation. These studies emphasized new tools for tracking individual phytoplankton groups, such as diatoms and cyanobacteria that are vital for ecosystem research and understanding phytoplankton dynamics. Participants also showcased efforts to develop predictive models for the detection of harmful algal blooms (HABs) and improvement of early warning systems to mitigate public health impacts and economic consequences in both coastal regions and the Great Lakes. Several presentations highlighted new aerosol absorption and scattering measurements that are using polarimetry (i.e., SPEXone and HARP2) and how these findings are being incorporated into models of aerosol–cloud radiative forcing. Presenters also described how machine learning tools can integrate PACE measurements into Earth system models, through innovations in data assimilation, with promising results for global climate monitoring.
The SAT3 discussions highlighted PACE’s potential to impact disciplines ranging from oceanography to climate science.
PACE Validation Science Team Sessions
Sessions dedicated to the PACE PVST emphasized the ongoing role of PVST initiatives in confirming the reliability, accuracy, and long-term stability of PACE data products. Topics of focus for the PVST group included algorithm development and validation, cross-mission synergies, field-based campaign integration, and cloud products.
Some of the presenters shared updates on validation pipelines for radiometric and polarimetric products, with an emphasis on comparing against well-characterized datasets from AERONET Sun photometers, HSRL, and the Pan-and-Tilt Hyperspectral Radiometer (PANTHR) developed by Vlaams Instituut voor de Zee (VLIZ), or the Flanders Marine Institute, Belgium – see Photo 3. This radiometer was installed on a 30-m (~98-ft) tower in the Chesapeake Bay in May 2024 and is part of WATERHYPERNET network, which seeks to provide time series of hyperspectral water reflectance data from oceanic, coastal, and inland waters for the validation of satellite data at all wavelengths in the range 400–900 nm.
Photo 3. Inia Soto Ramos [Goddard Space Flight Center/Morgan State University] leads a Plankton, Aerosol, Cloud, ocean Ecosystem (PACE) Validation Science Team (PVST) breakout group discussion.Photo credit: Judy Alfter [NASA Ames Research Center (ARC)/ Bay Area Environmental Research Institute (BAER)]Reports from PVST members highlighted how data from PACE–PAX campaigns and satellite overpasses are contributing to the validation of error budgets developed prelaunch and refined uncertainty characterization. Other presentations highlighted the development of validation strategies for PACE-derived cloud properties, including cloud optical thickness, top height, and droplet size distributions with significant contributions from EarthCARE observations. Ocean observation validation was represented as well, with presentations from many groups that are focusing on retrieval of not only oceanic optical properties but biological components. This data offers crucial validation for the advanced phytoplankton composition and general ocean productivity products from PACE.
The PVST’s work continues to provide the foundation for confidence in PACE data products. Their accuracy ensures broad usability of those products across global science applications.
Conclusion
The PAC3 meeting, held at NASA’s GISS, highlighted the collective efforts of the PACE mission’s diverse teams to address a broad range of Earth system science challenges. By combining the meetings for PACE–PAX, SAT3, and PVST, participants were able to strengthen collaborations, align ongoing efforts, and lay the groundwork for future research and validation activities.
Roundtable discussions and team updates also revealed the critical role of PACE in addressing long-standing Earth system science questions, such as understanding the influence of aerosols on cloud formation and characterizing the impacts of oceanic changes on global biogeochemical cycles at a global scale. The meeting concluded with participants compiling action items for further exploration. Topics identified for future efforts included strategies for ensuring long-term data calibration, improving data delivery pipelines, and refining algorithm development processes.
This meeting was one of the last significant events hosted at GISS before the facility’s closure at the end of May 2025. The findings and outcomes from PAC3 continue to inform and inspire PACE mission science, further enhancing its importance in advancing our understanding of the Earth system.
Kirk Knobelspiesse
NASA’s Goddard Space Flight Center
kirk.d.knobelspiesse@nasa.gov
Cecile S. Rousseaux
NASA’s Goddard Space Flight Center
cecile.s.rousseaux@nasa.gov
Ivona Cetinić
NASA’s Goddard Space Flight Center/Morgan State University
ivona.cetinic@nasa.gov
Andrew Sayer
NASA’s Goddard Space Flight Center
andrew.sayer@nasa.gov
Sentinel-6B Extends Global Ocean Height Record
7 min read
Sentinel-6B Extends Global Ocean Height RecordIntroduction
On November 16, 2025, the Sentinel-6B satellite launched from Vandenberg Space Force Base (VSFB) in California. The mission is a partnership between NASA, the National Oceanic and Atmospheric Administration (NOAA), and several European partners – the European Space Agency (ESA), the European Organisation for the Exploitation of Meteorological Satellites (EUMETSAT), the French Centre National d’Études Spatiales (CNES), and the European Commission. Its objective is to continue collecting data to extend the ocean height record, which was started in 1992 with the U.S./French TOPEX/Poseidon satellite mission. During the past three decades, NASA and its partners have operated a satellite in the same orbit, precisely tracking the height of the oceans across the globe, once every 10 days.
Sentinel-6B took to the skies almost five years to the day after its twin, Sentinel-6A, which launched November 20, 2020, also from VSFB, and was renamed Sentinel–6 Michael Freilich, honoring the former head of NASA’s Earth Science Division – see The Editor’s Corner [March–April 2020, 32:1, 1–2]. Together, the two missions comprise the international Sentinel-6/Jason – Continuity of Service (CS) mission, which will provide continuity with past missions from TOPEX/Poseidon through Jason-3. Sentinel-6B will continue to measure sea level to about one inch (2.5 cm), extend the record of atmospheric temperatures, and continue sea level observations through the end of the 2020s.
The article that follows briefly introduces Sentinel-6B’s payload (which is the same as Sentinel–6 Michael Freilich). It then describes the planned science applications of the mission, followed by a brief conclusion.
Sentinel-6B Payload
The Sentinel-6B satellite carries several instruments to support the mission’s science goals – see Figure 1. A Radar Altimeter bounces signals off the ocean surface to determine the distance to the ocean. An Advanced Microwave Radiometer (AMR) retrieves the amount of water vapor between the satellite and ocean, which affects the travel speed of radar pulses, providing a critical correction to the distance measured by the radar. Other onboard instruments are used to precisely determine the satellite’s position [e.g., Doppler Orbitography by Radiopositioning Integrated on Satellite (DORIS) and Laser Retroreflector Array]. The height of the ocean surface can be calculated by combining the satellite’s position with the distance to the ocean. In addition, S- and X-band antennas perform data downlinks, and a solar array supplies power.
Beyond these instruments, Sentinel-6B contains Global Navigation Satellite System Radio Occultation (GNSS-RO) instrument that will aid with weather prediction. Observations made between the spacecraft instrument and other GNSS satellites as they disappear over Earth’s limb, or horizon, will provide detailed information about variations in the layers of the atmosphere. This information will contribute to computer models that predict the weather and enhance forecasting capabilities.
Figure 1. Sentinel-6B contains an array of instruments to continue to measure ocean height and gather other integral information about the global ocean.Figure credit: NASA/JPLSentinel-6B Science
The subsections that follow give a short preview of Sentinel-6B’s science capabilities, which are identical to those of Sentinel-6 Michael Freilich and similar – albeit enhanced – to the capabilities of previous satellite altimetry missions.
Measuring Ocean Height
Ocean height is a critical measurement because it provides a host of information about the movement of surface currents, transfer of energy around the planet, and an early warning system for large-scale climate phenomena, like El Niño–Southern Oscillation (ENSO) – see further discussion of ENSO below. Satellites obtain this data using altimeters, which send a radar pulse to the ocean surface every second and measure the time it takes to return. Pairing these data with the satellite’s precise location provides a measure of the height of the ocean water with an accuracy of within a few centimeters.
But the simplicity of the measurement belies the volumes of information that can be gleaned from the height of the oceans. As water moves from one place to another, it tilts the surface of the ocean, and by measuring this tilt the sea level satellites allow scientists to calculate ocean currents – see Figure 2.
Figure 2. Surface current estimates calculated using the Ocean Surface Current Analyses Real-time (OSCAR) global surface current database – which is made based on input from satellites that measure ocean height. Sentinel-6B will be the latest satellite to provide real-time data that are accurate enough for OSCAR to compute these currents. This will allow forecasters to accurately predict ocean currents and marine weather conditions globally, every single day.Figure credit: Severine Fournie [JPL]Tracking the Expansion and Contraction of Water in the Ocean
Ocean height data also provide information about ocean water temperature. Since water expands as it warms, a warm patch of ocean measures several inches taller than a cold patch – see Figure 3. Ocean height measurements thus can be used to reveal how the ocean stores and redistributes heat and energy, which are key drivers of Earth’s climate.
By observing ocean heights, Sentinel-6B will help improve forecasters’ ability to predict storm intensity and scientists’ ability to track long-term trends in heat storage. Information on ocean height also outlines ocean currents, eddies, and tides, which helps scientists understand how heat, nutrients, carbon, and energy are transported around Earth. These observations are essential for understanding Earth’s energy balance, ocean circulation, and the role of the ocean in shaping weather and climate patterns.
Figure 3. Ocean height data obtained on September 8, 2025, from Sentinel-6 Michael Freilich for the Pacific Ocean, where blue shows lower than normal heights along the equator in the east associated with a mild to moderate La Niña event.Figure credit: NASAUsing Ocean Height Measurements to Track ENSO
The movement of heat within the ocean is linked to weather and climate conditions across the globe. For reasons not completely understood, the waters of the Pacific Ocean experience a periodic fluctuation between warm and cool in the eastern tropical Pacific; this cycle is called ENSO. During an El Niño event in the Pacific Ocean, unusually warm water (which is visible in the satellite data as higher than normal sea levels) builds up along the equator in the east. The pool of warm water shifts rainfall patterns across the United States and Canada. This change is telescoped around the globe, altering normal weather patterns. Conversely, La Niña events develop when cooler waters accumulate along the eastern Pacific (and hence, lower than normal sea levels). In this way, the satellite observations of sea level help scientists and forecasters better see how the ocean is changing and the type of weather conditions to expect in the coming months – see Figure 4.
Higher sea levels usually mean warmer waters, not just at the surface, but over a range of depths. This means that high sea levels can also herald rapidly intensifying storms. Meteorologists can use this information when tracking tropical storms that gain energy from warm patches of ocean water and intensify into hurricanes – often rapidly.
Figure 4. As Hurricane Milton passed over the warm waters of the Gulf of Mexico on its approach to Florida in October 2024, the storm experienced a period of rapid intensification. This image pair shows ocean heat estimates based on observations from Jason-CS on October 7, 2024 [top] and October 9, 2024 [bottom]. Red and yellow indicate warmer than normal temperatures, where blue and green represent cooler than normal temperatures. A satellite image of the hurricane is overlaid to indicate the storm’s position as it moved toward Florida’s west coast. Notice that the period of rapid intensification corresponds to the storm moving over the patch of anomalously warm water that can be seen in the center of the image [red].Figure credit: NOAAMonitoring Ocean Changes
Sentinel-6B can also monitor changes in sea level. Over 90% of the heat trapped by the Earth is stored in the oceans. That heat warms the water, which takes up more space and accounts for about one-third of the observed global rise in sea level. The remainder is driven by melting glaciers and ice sheets, which add water to the oceans as well. The result is a long-term rise in sea level by more than 10 cm (4 in) since the early 1990s, when TOPEX/Poseidon was launched.
A record of global mean sea level change for the past three decades reveals an annual oscillation that reflects the natural movement of water between the ocean and the land, much like the heartbeat of the planet – see Figure 5. The rate of rise is not steady. The change in sea level in the 1990s was less than half the rate of rise in the most recent decade.
Figure 5. Sentinel-6B will continue to monitor the rise of the oceans. This record is composed of data from several different satellite altimetry missions dating back to TOPEX/Poseidon in 1992.Figure credit: NASA’s Scientific Visualization StudioConclusion
This unbroken record of sea level change stands as a crowning achievement to the accuracy, stability, and consistency of a series of satellite missions across more than three decades. This approach remains one of the most successful international collaborations to study our ever-changing Earth from space, and the launch of Sentinel-6B will stretch the record to nearly 40 years. With a vibrant international community of several hundred scientists and expert users, the discoveries made, and the value created by these observations will no doubt extend through 2030 and beyond. Although Sentinel-6B is nearly identical to its predecessor, a broad community of scientists, forecasters, operational users, and policymakers anxiously await its observations and the discoveries and utility they will bring through the remainder of this decade.
Joshua Willis
NASA/Jet Propulsion Laboratory
joshua.k.willis@jpl.nasa.gov
Severine Fournier
NASA/Jet Propulsion Laboratory
severine.fournier@jpl.nasa.gov

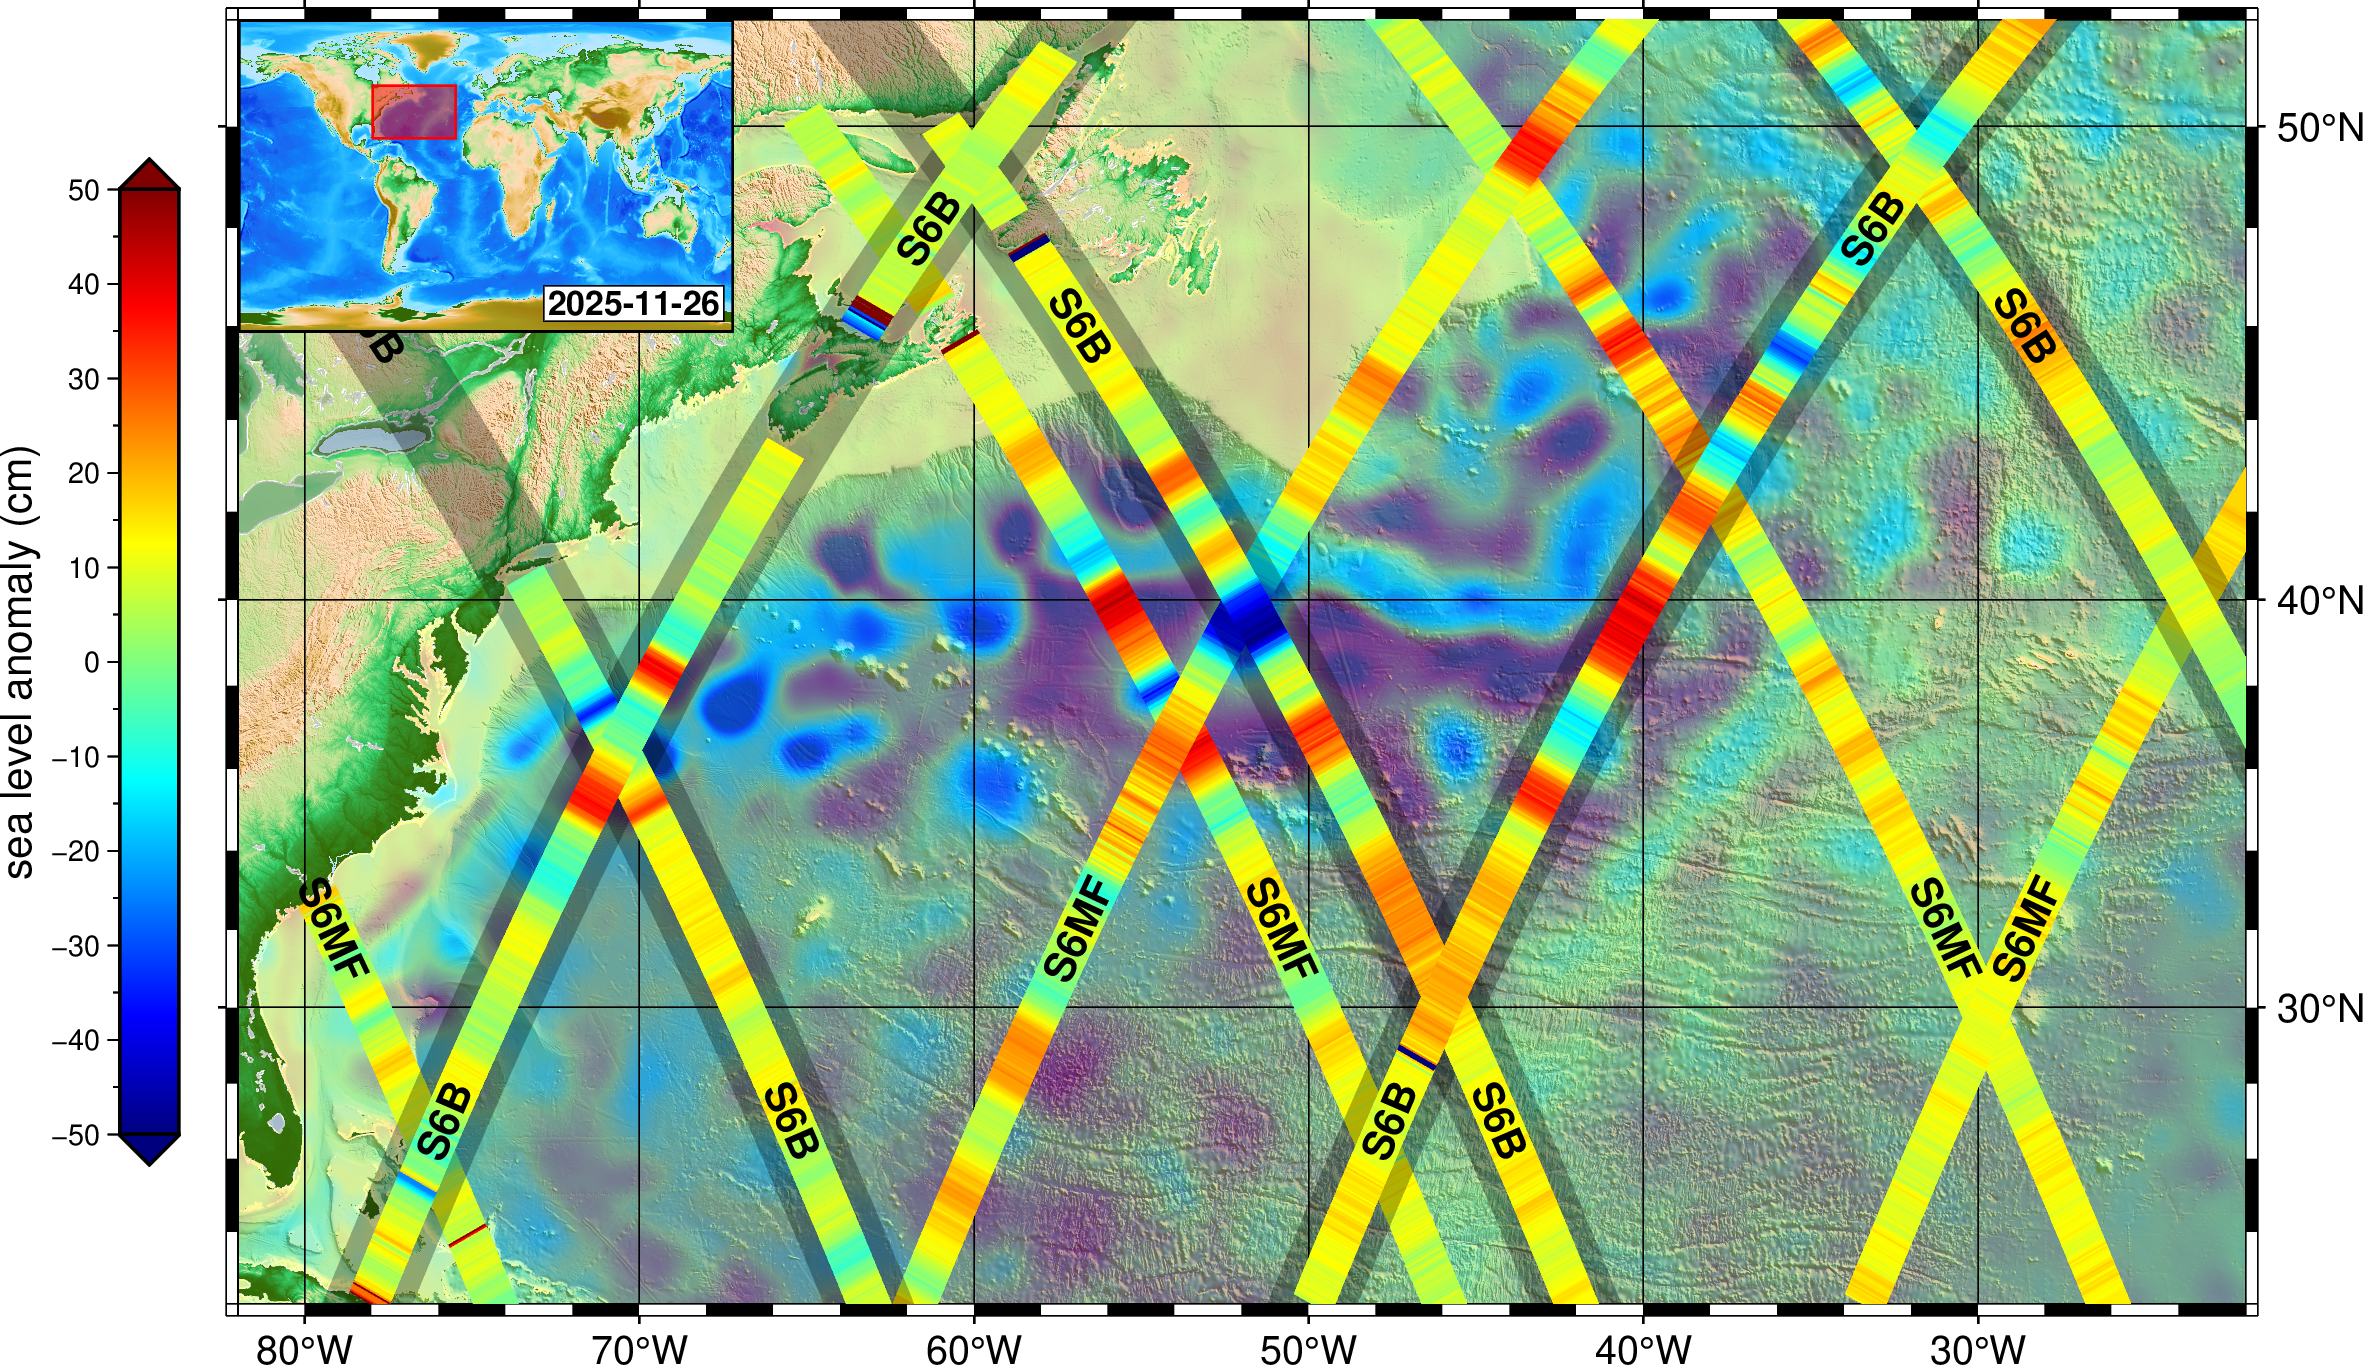
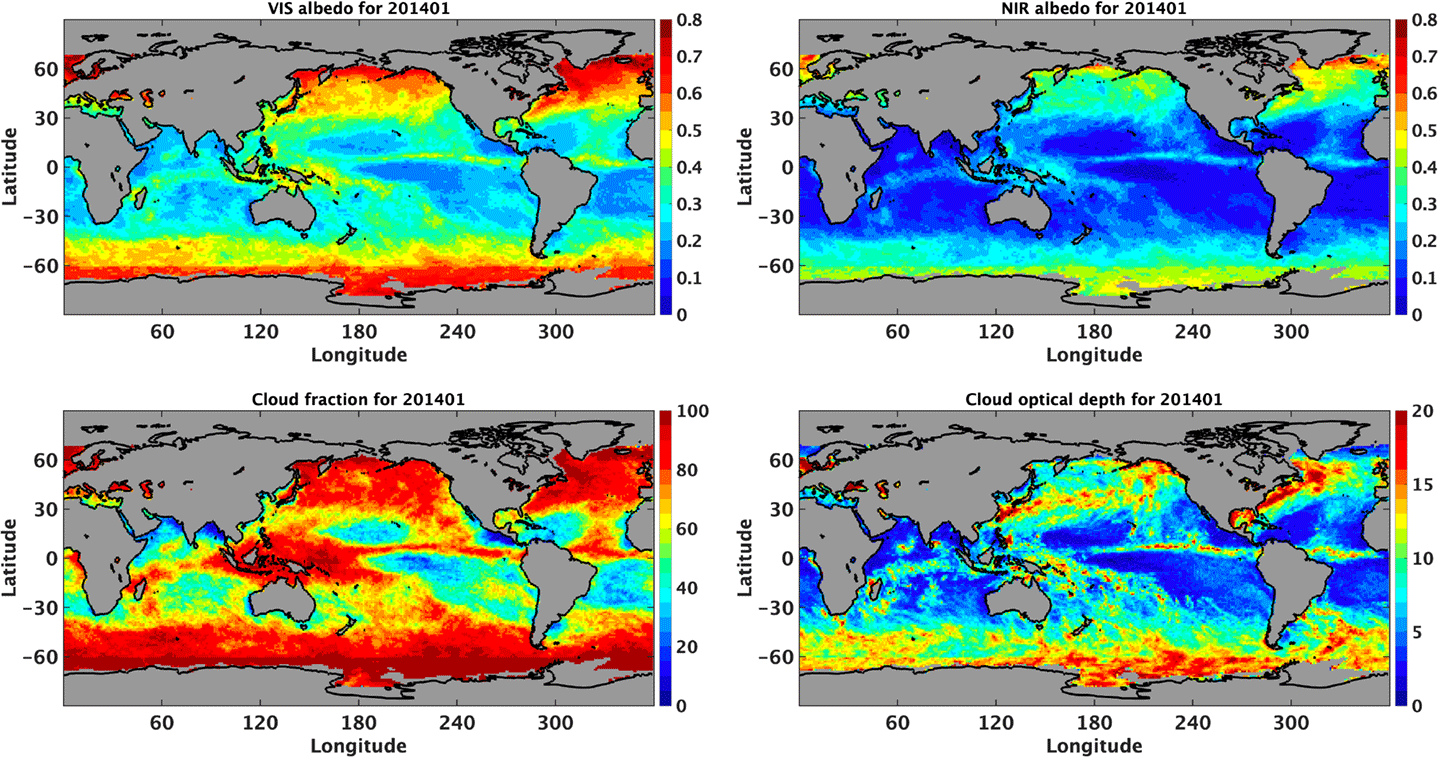
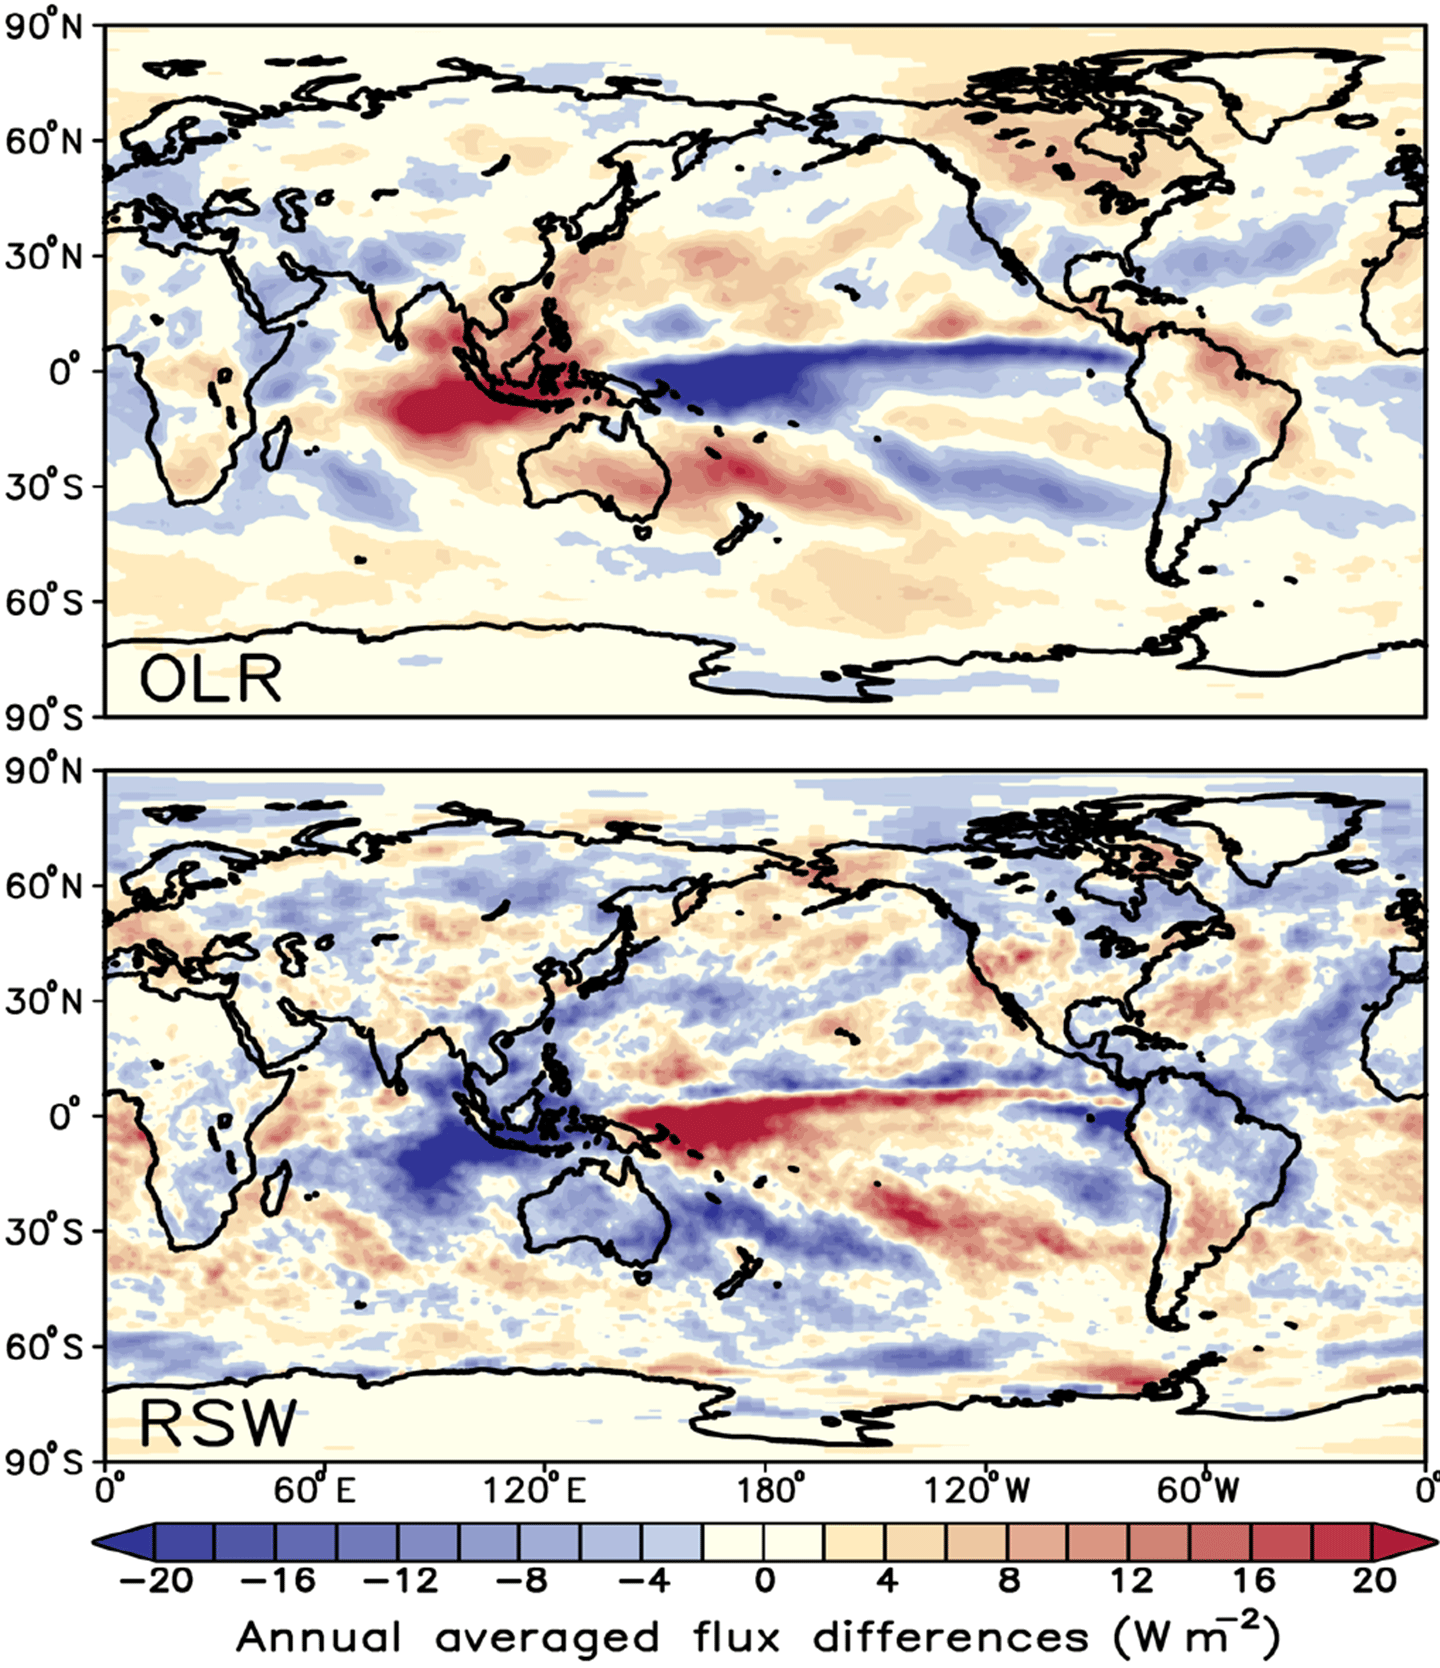
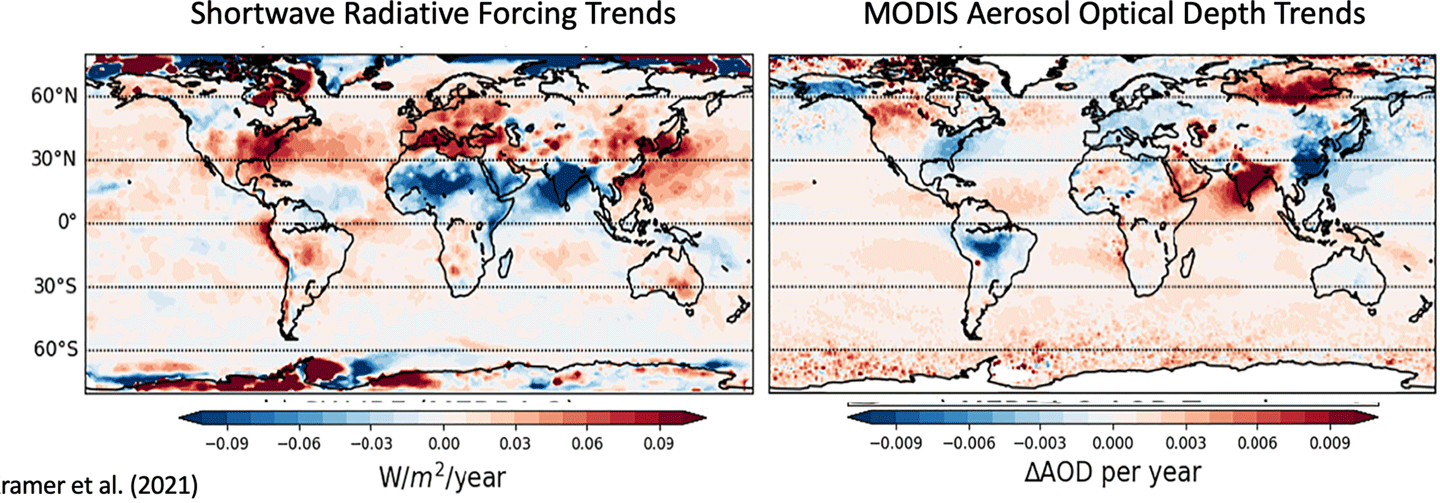
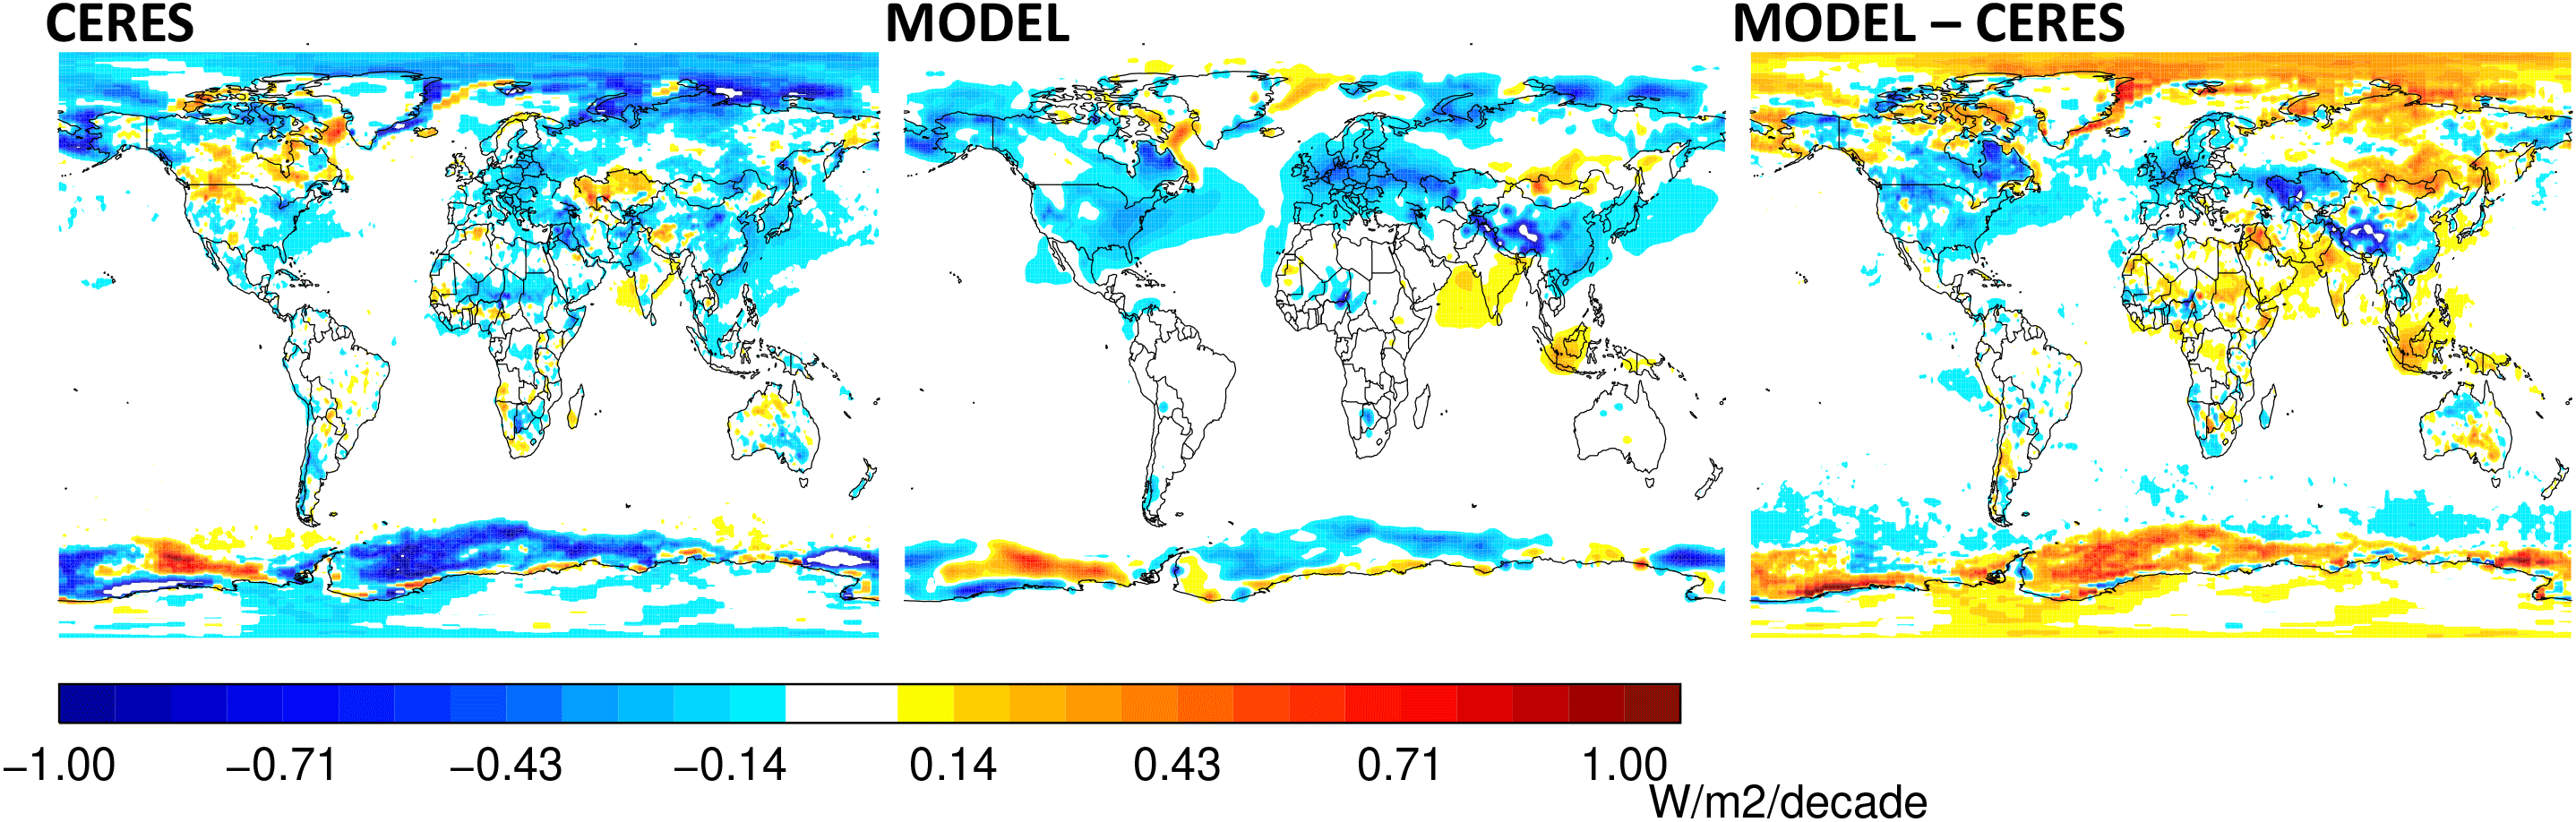
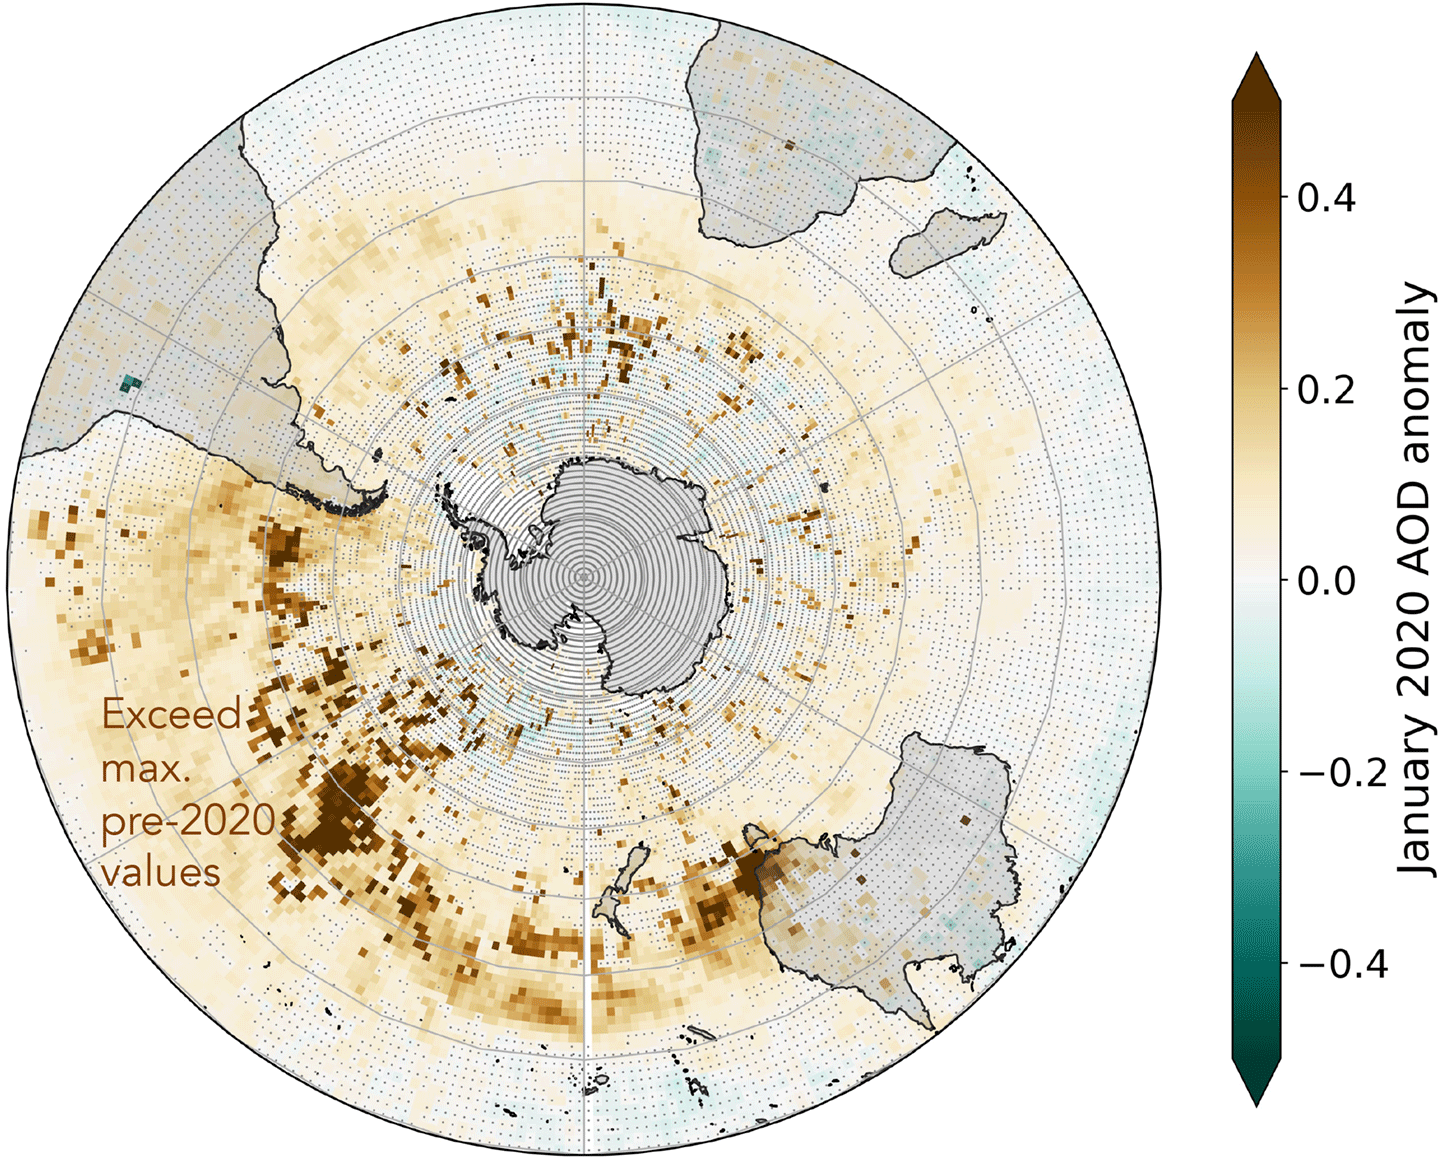
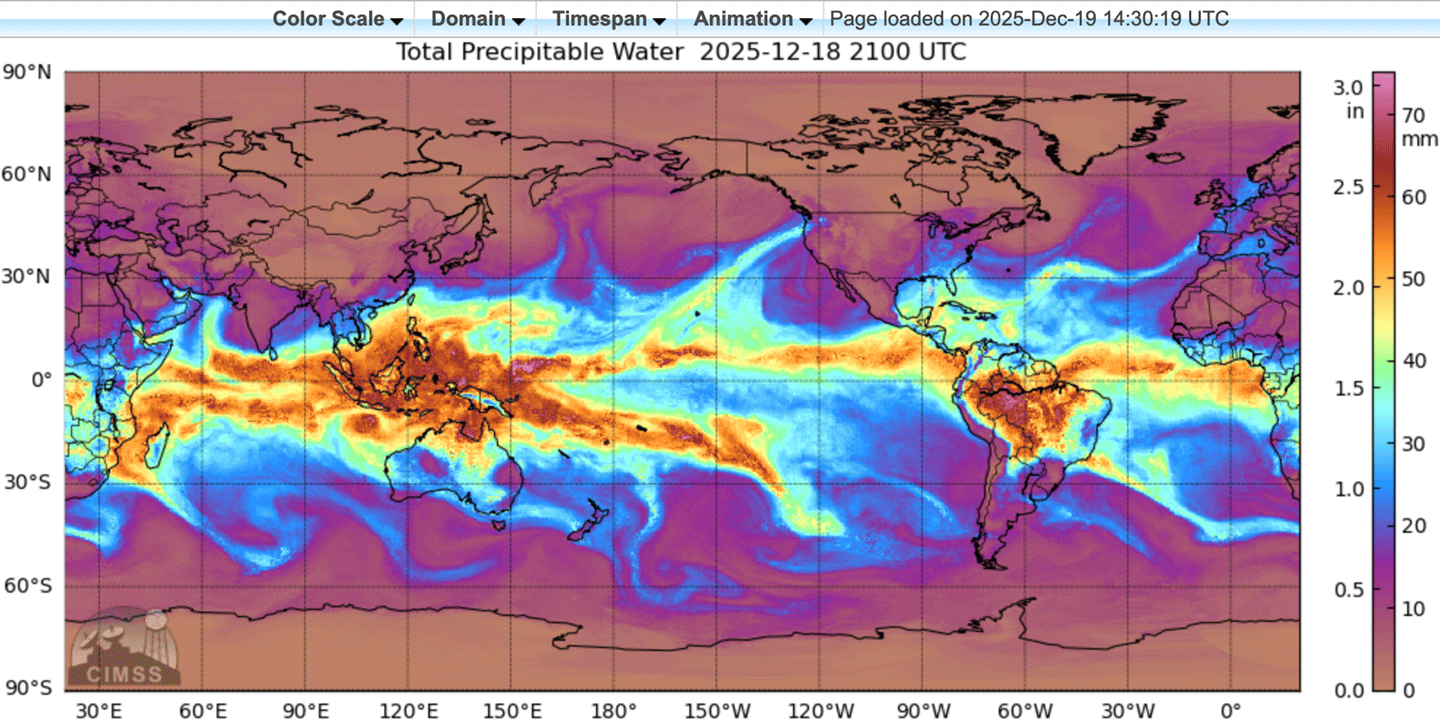
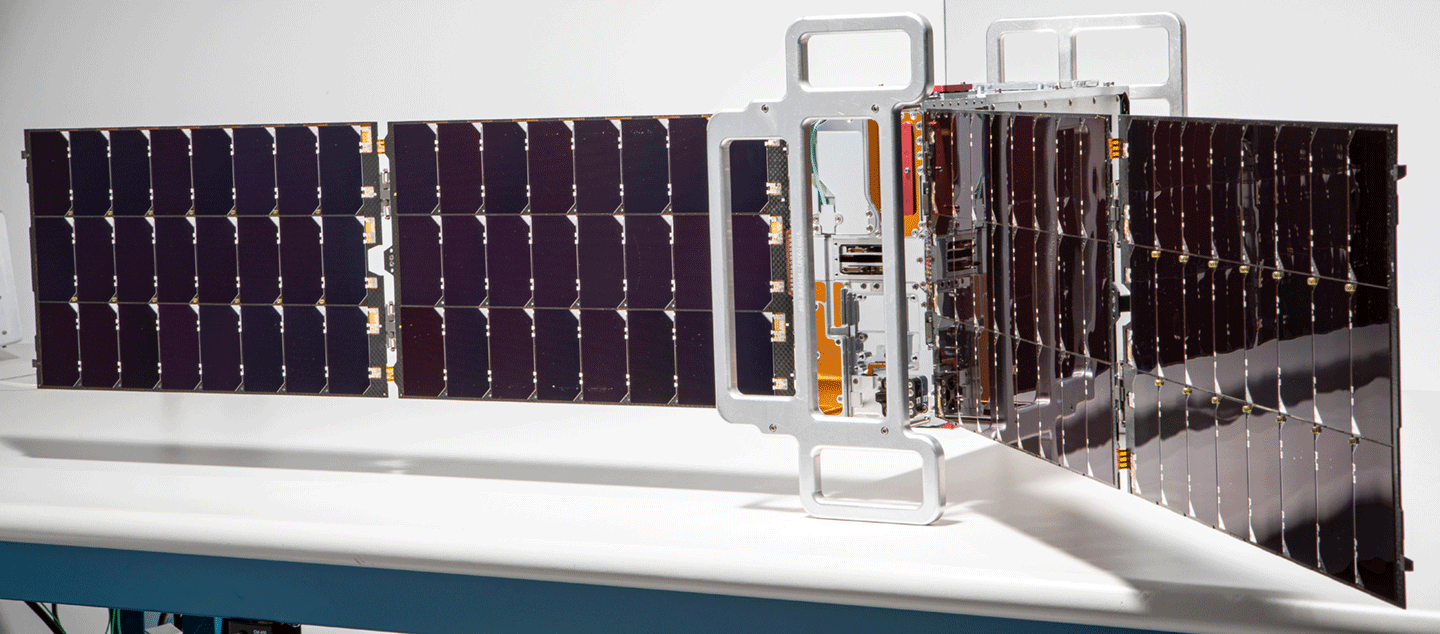
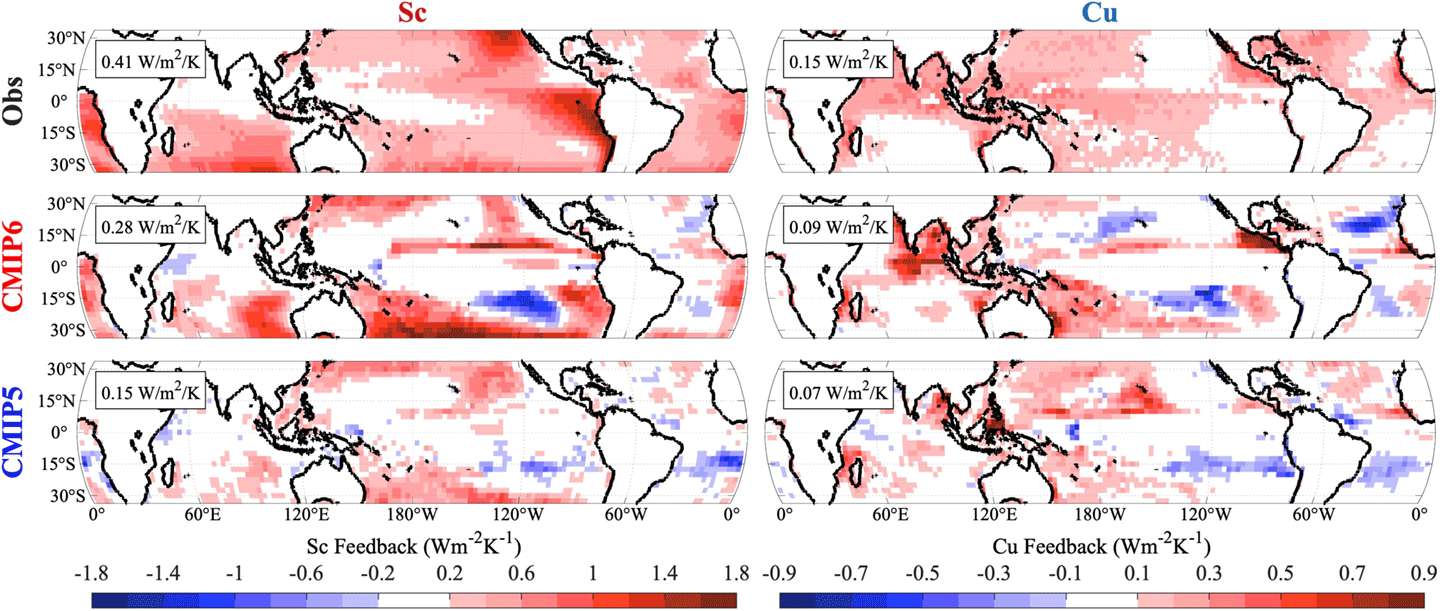
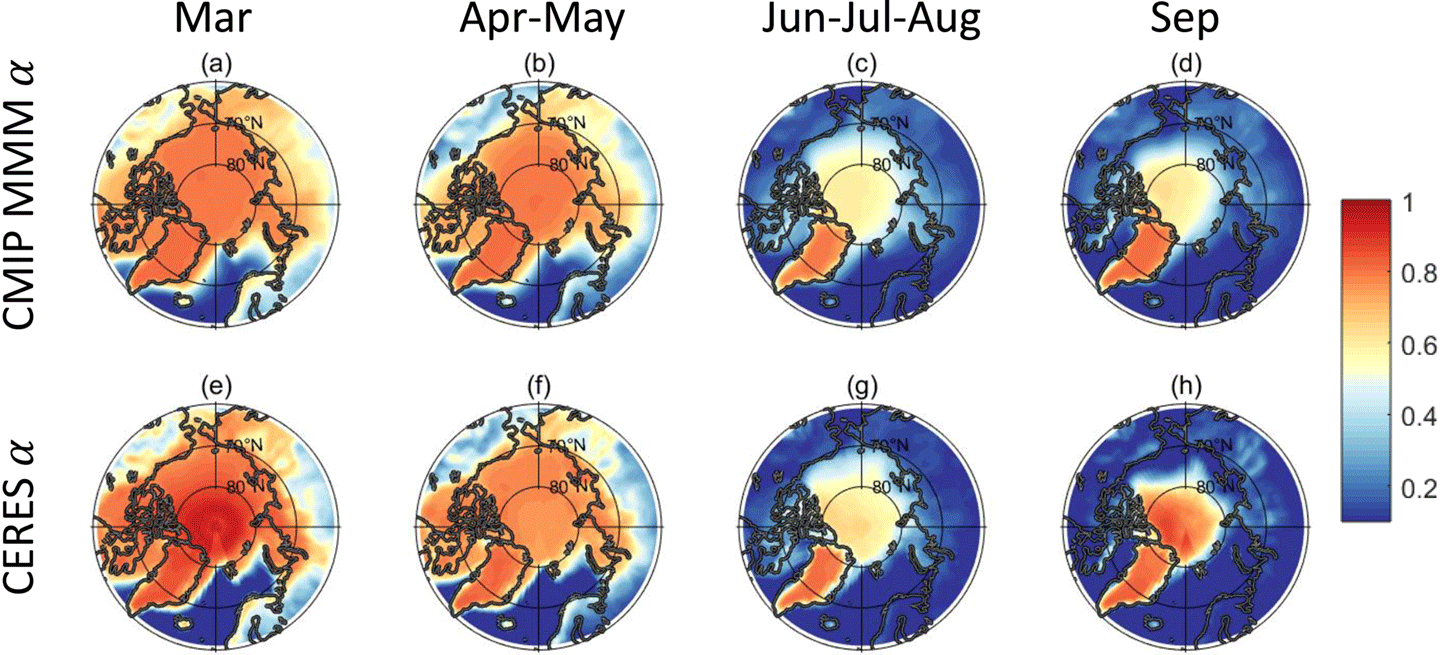
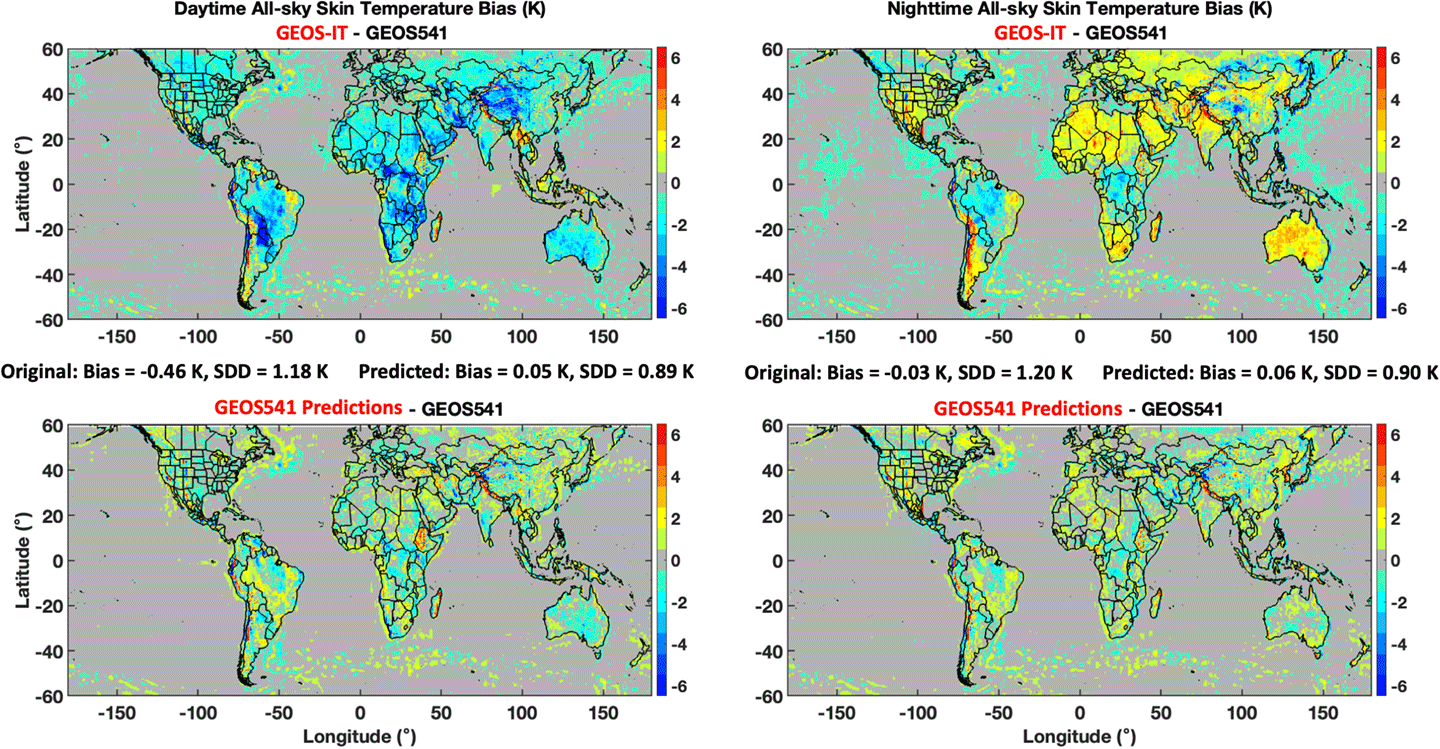
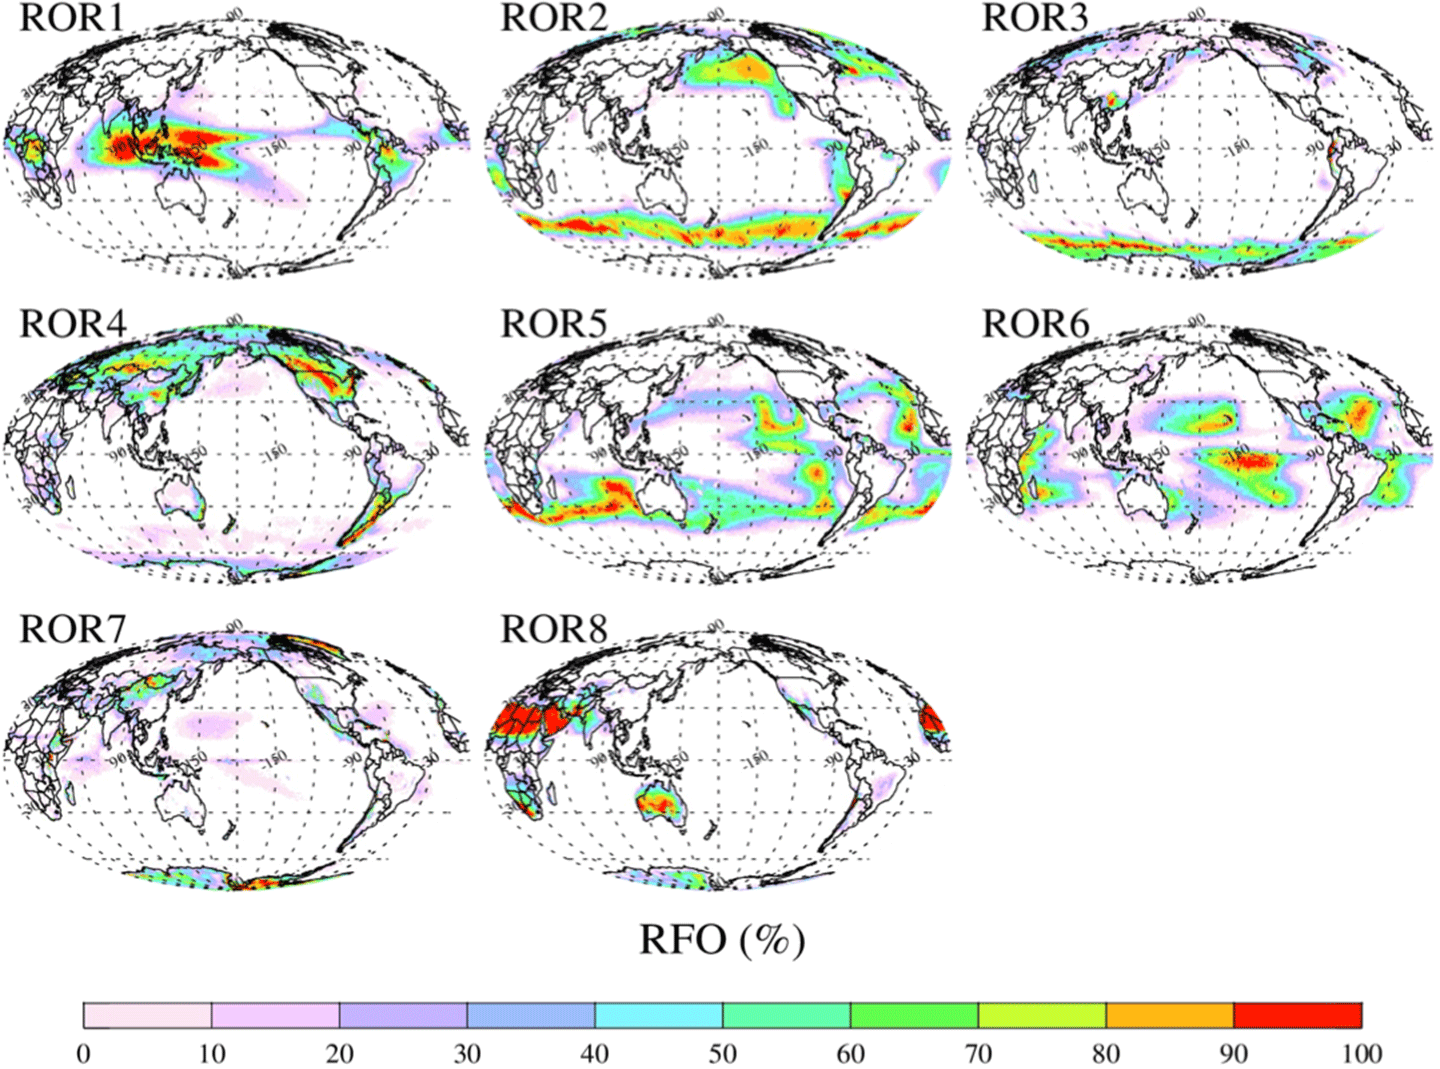
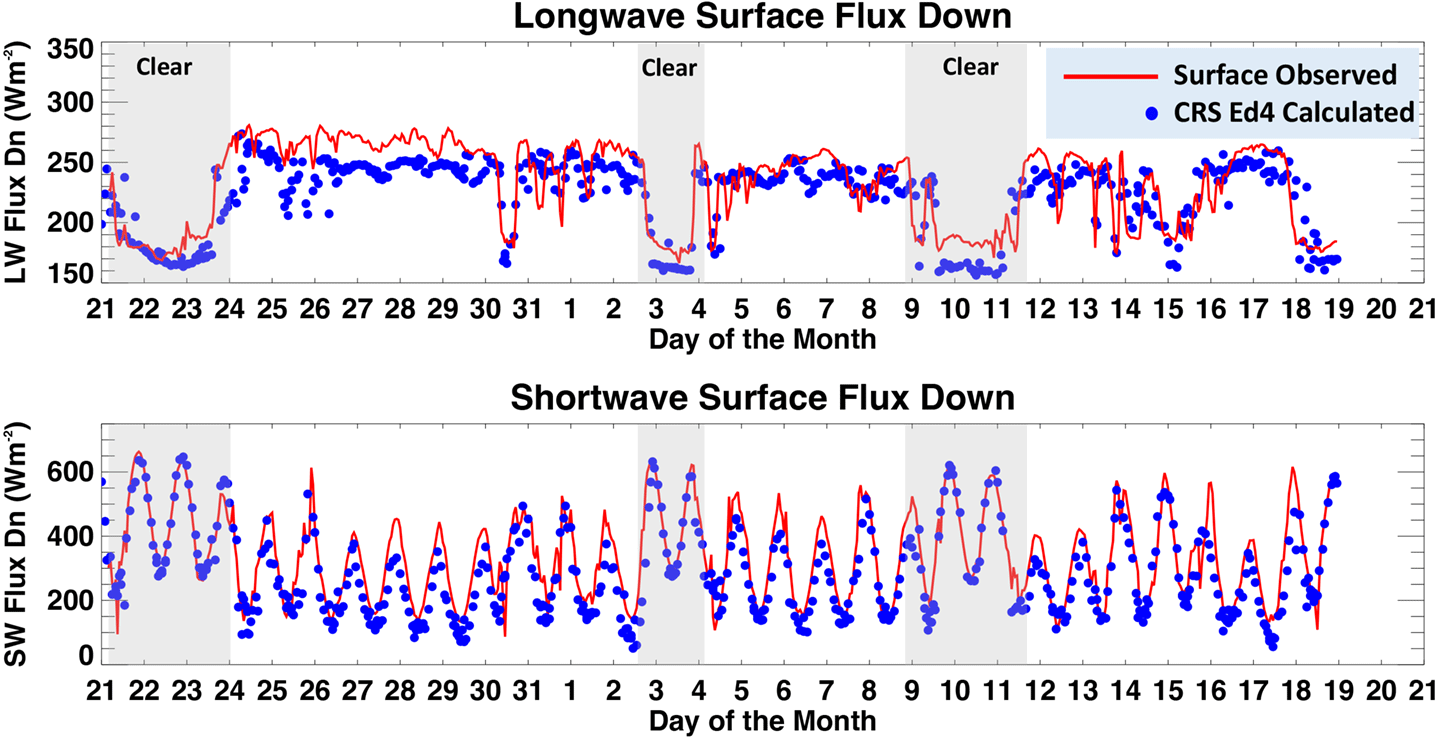
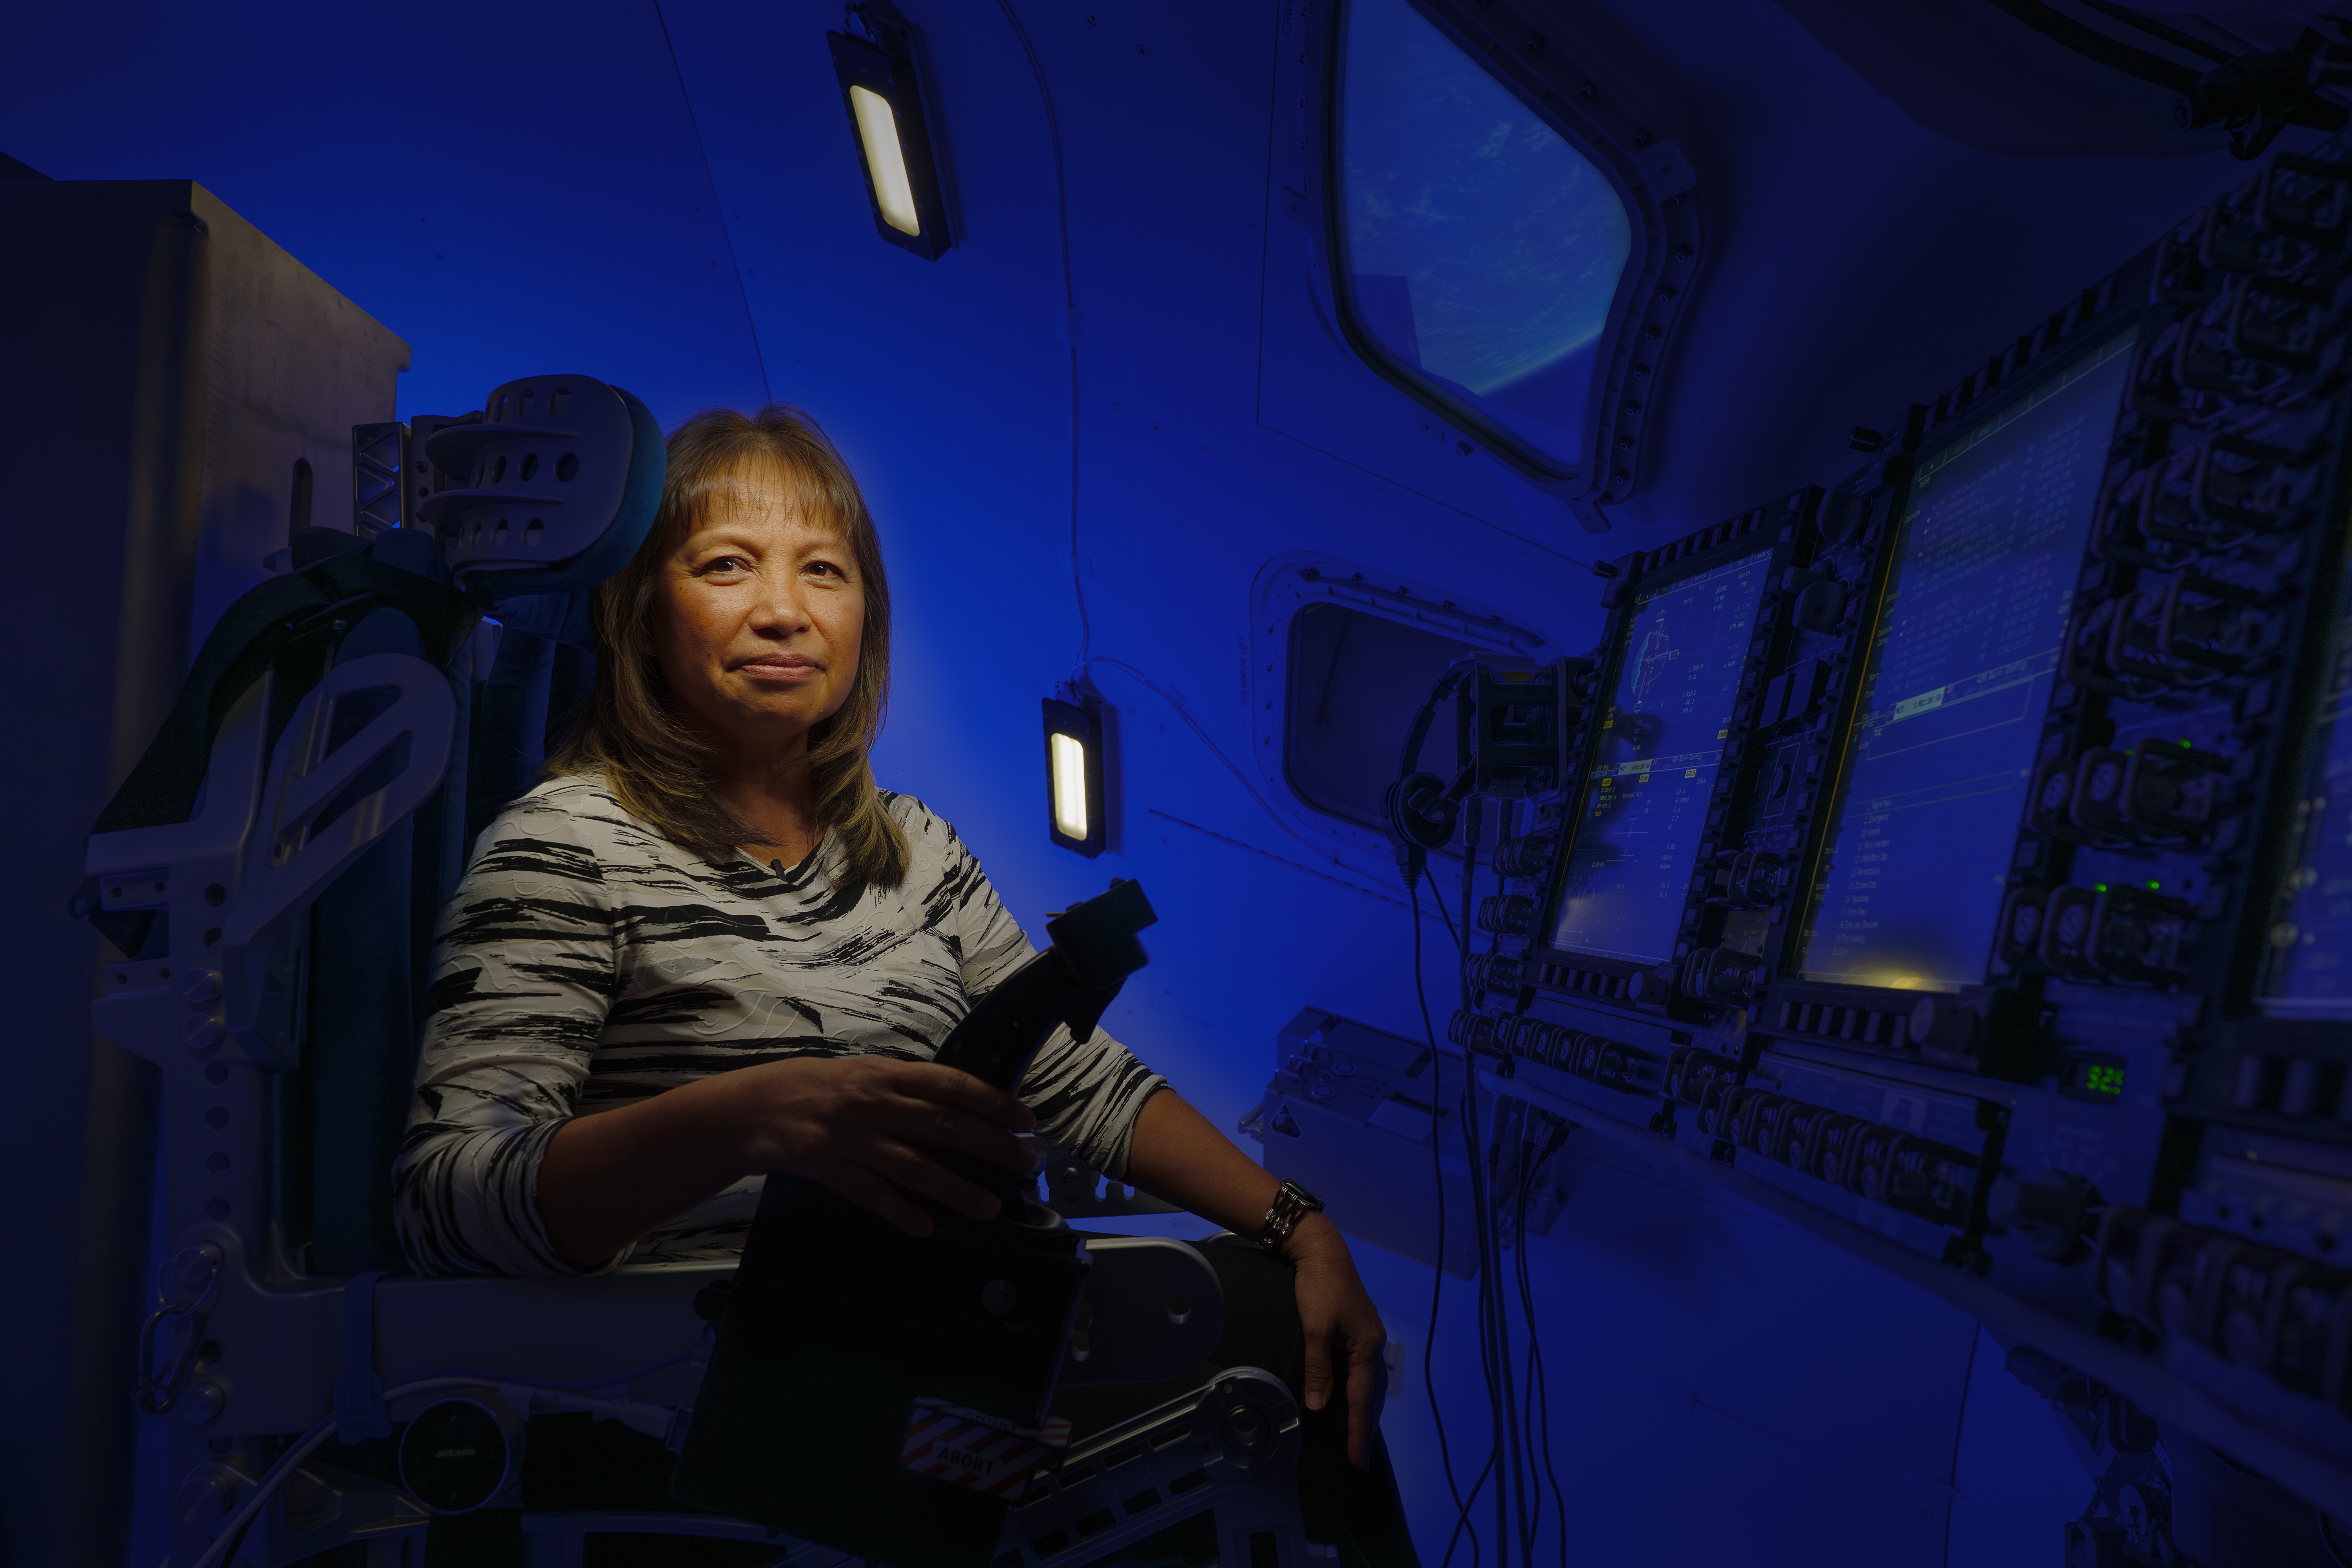
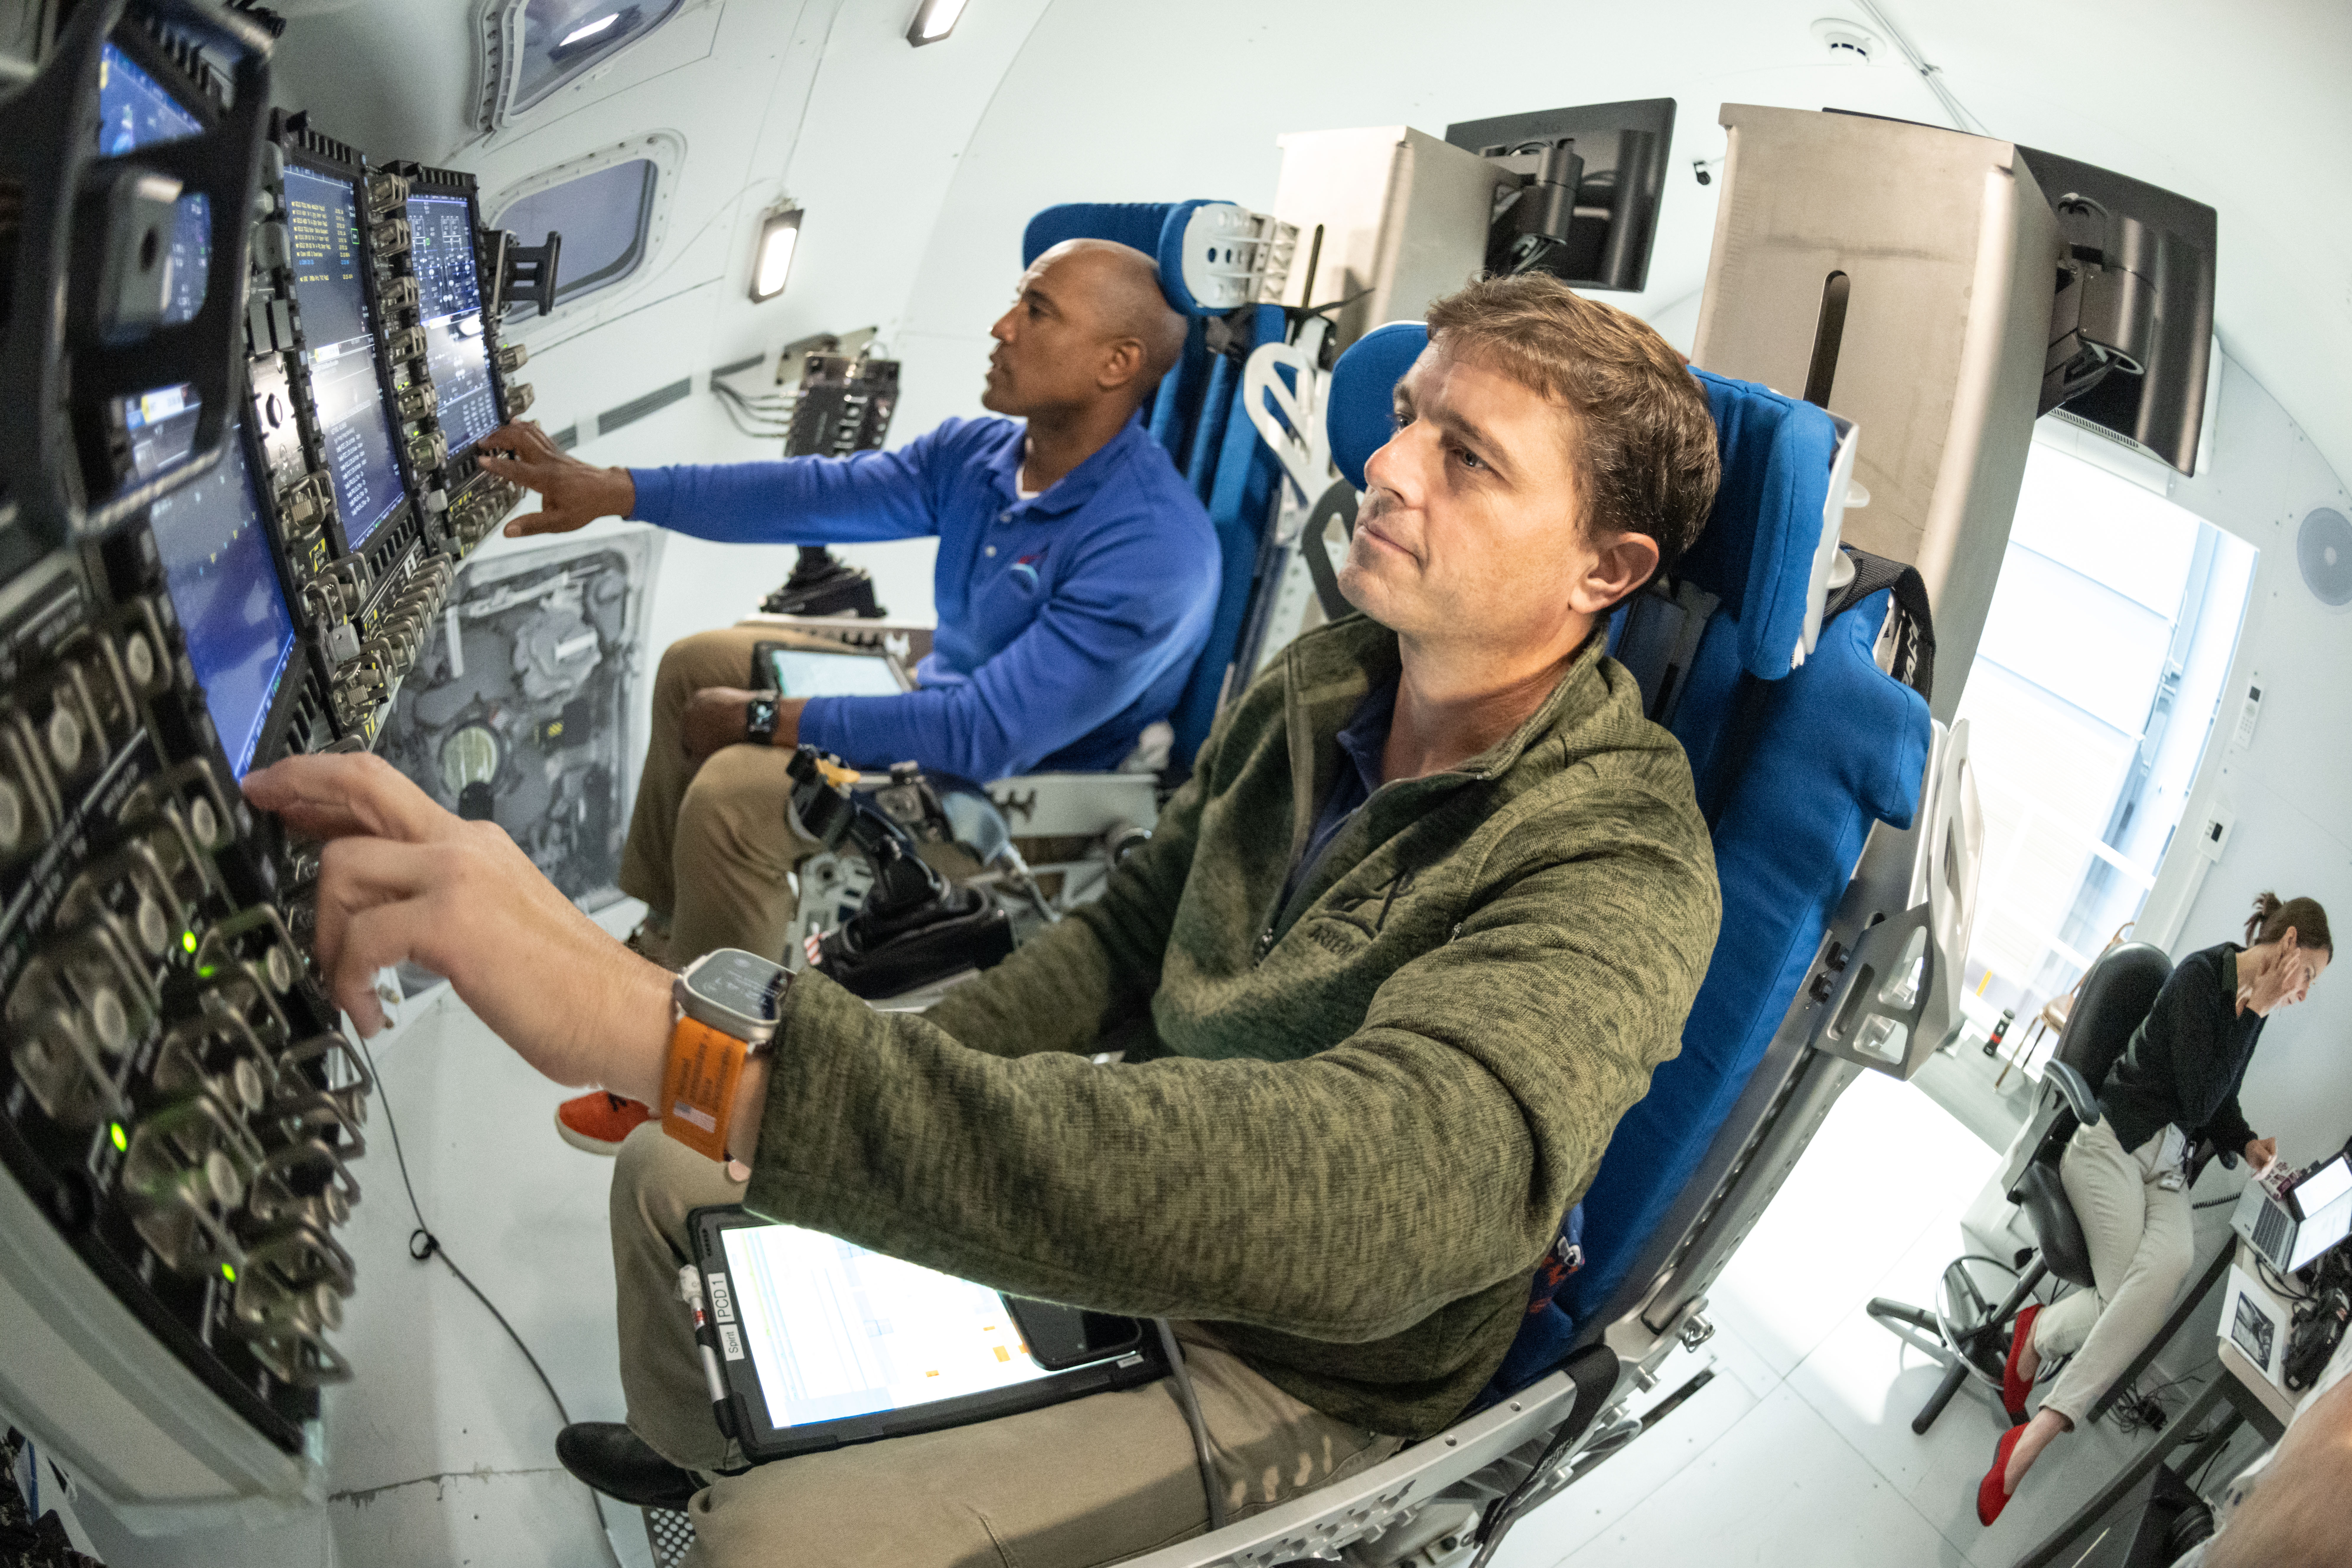
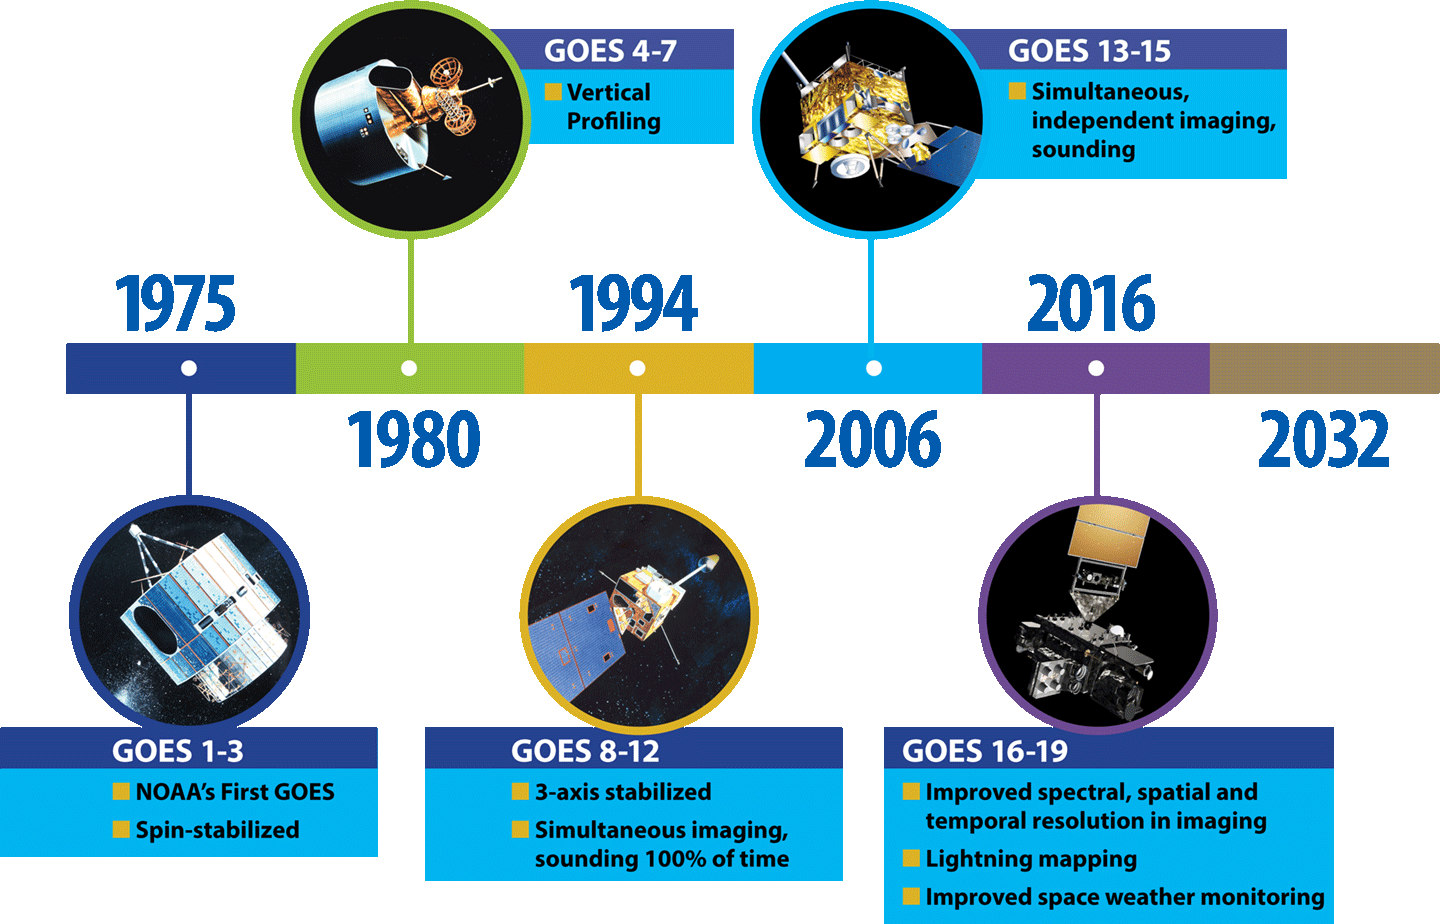
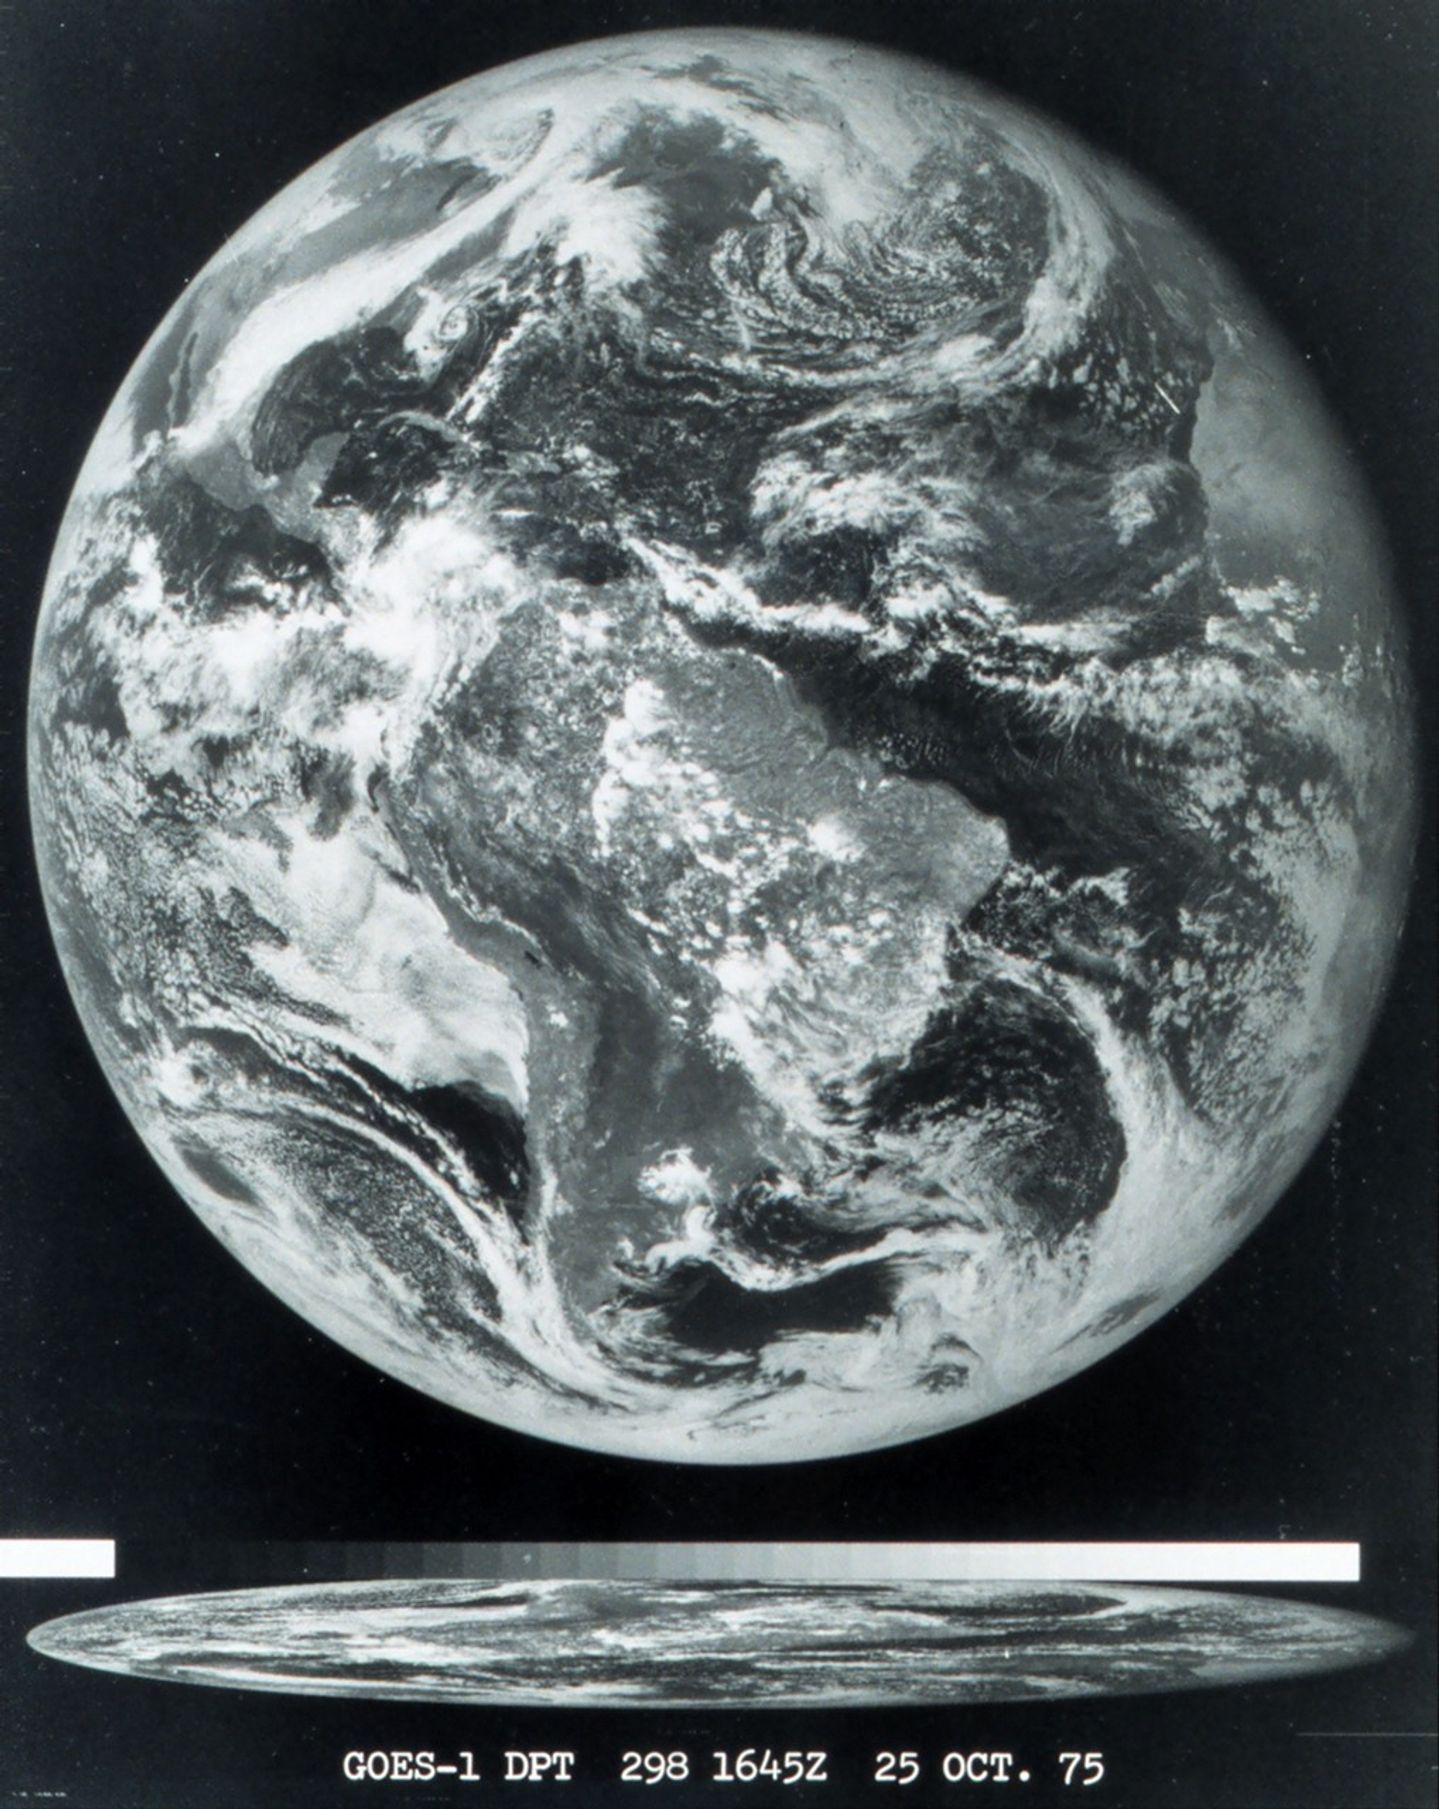
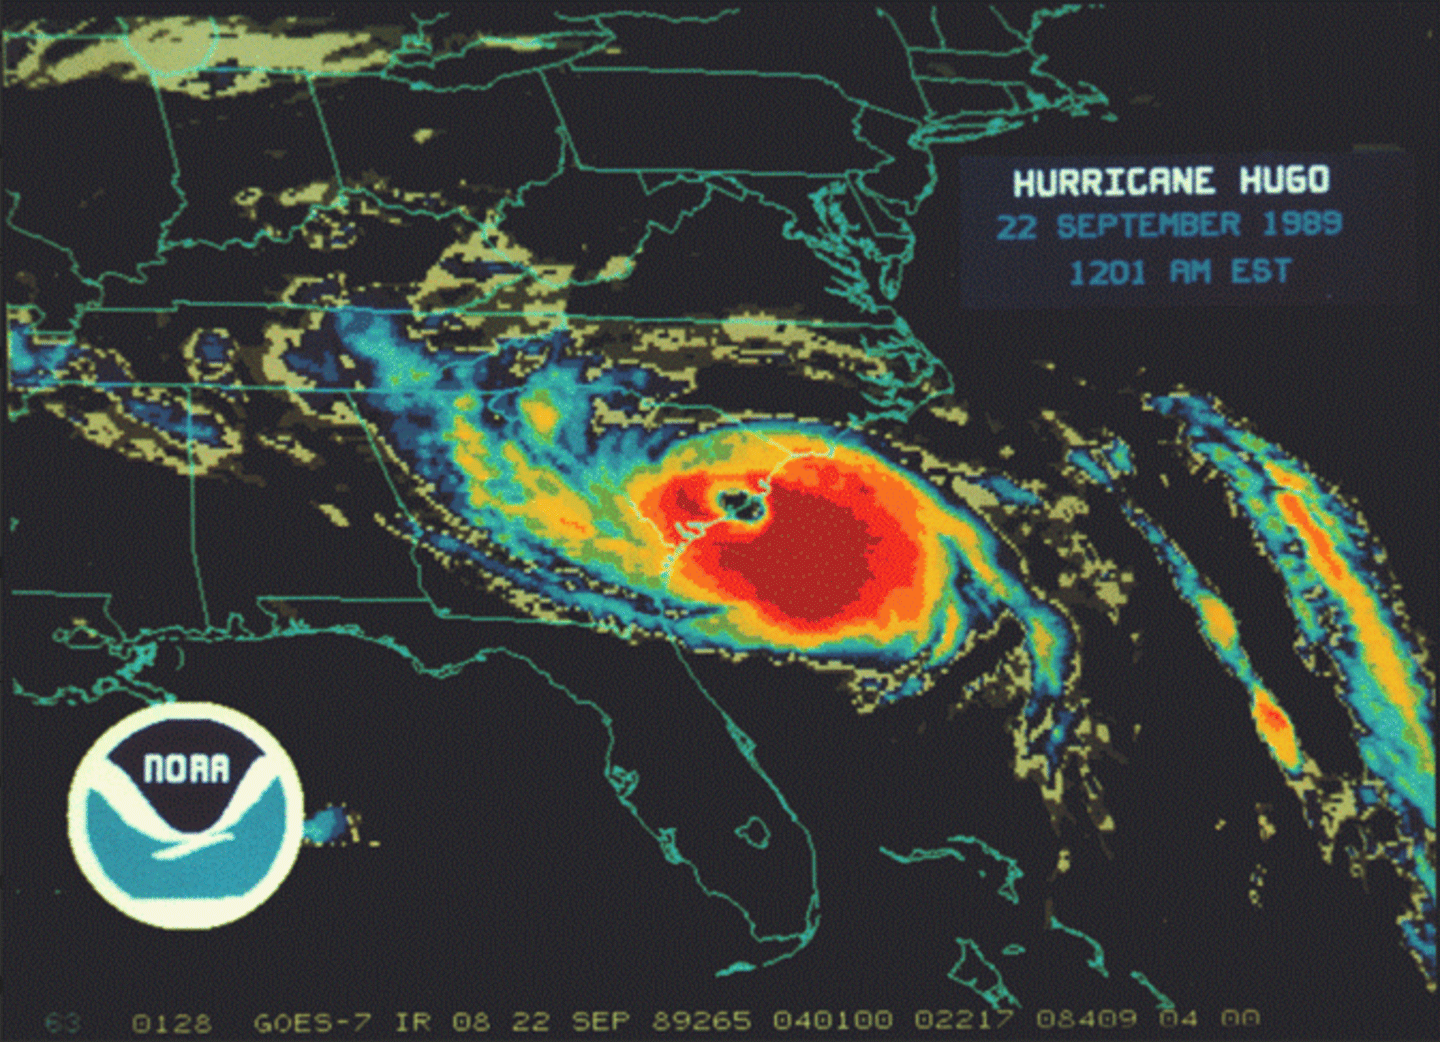
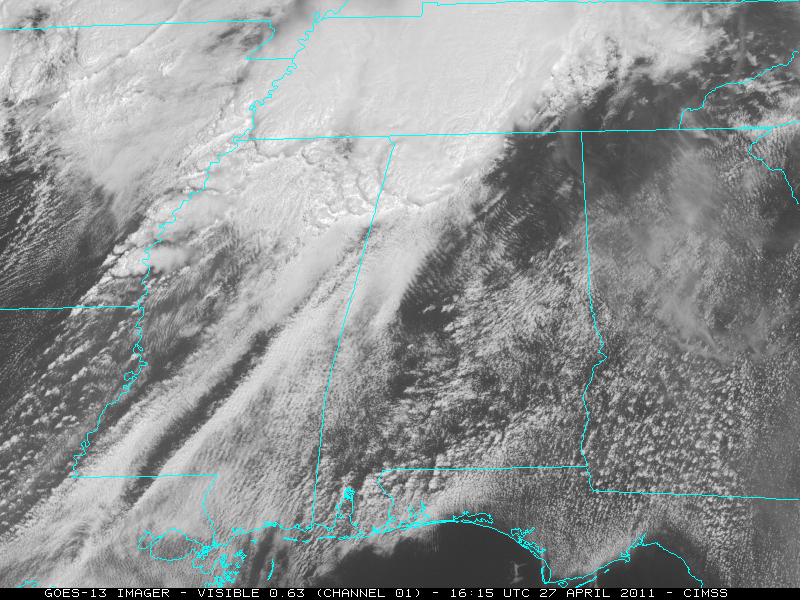
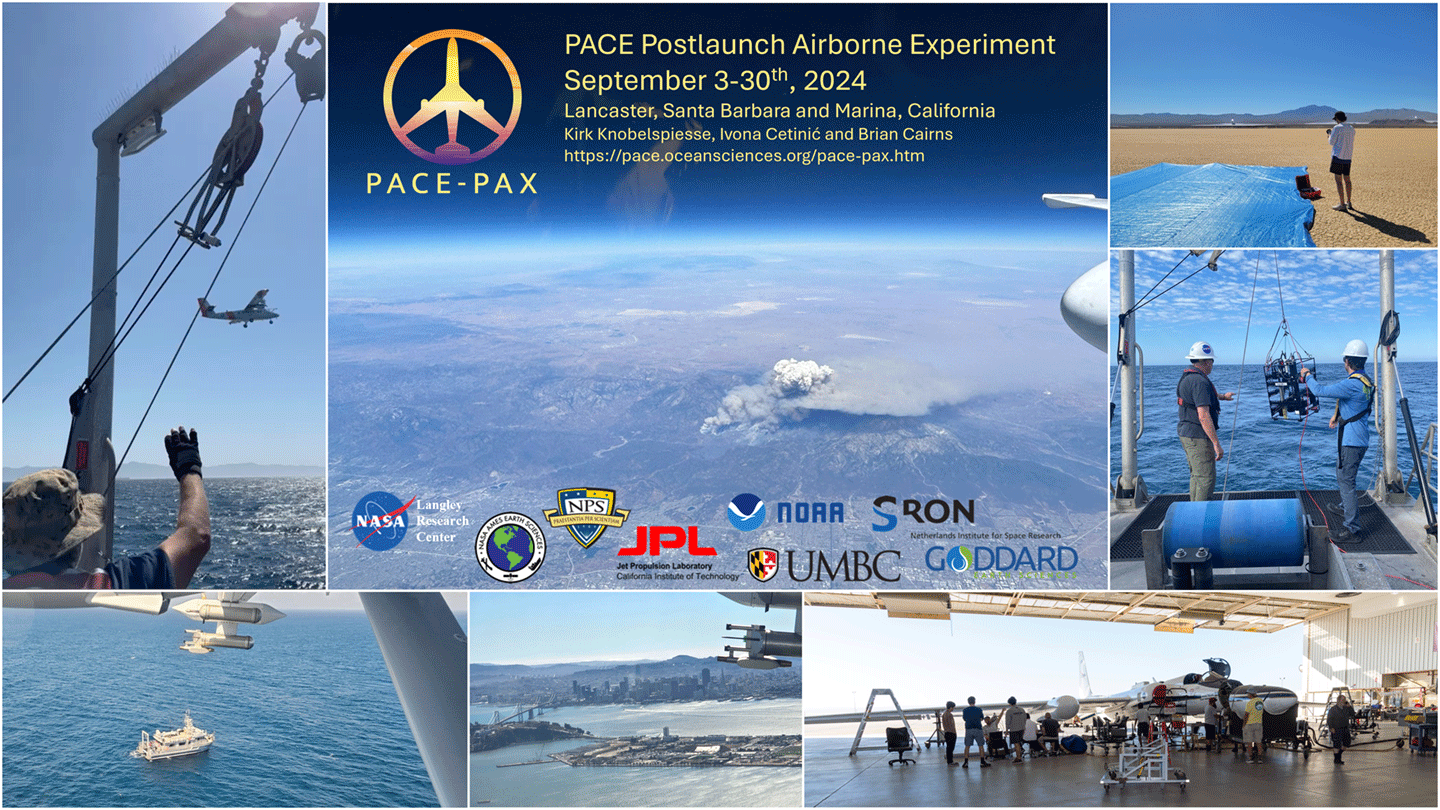
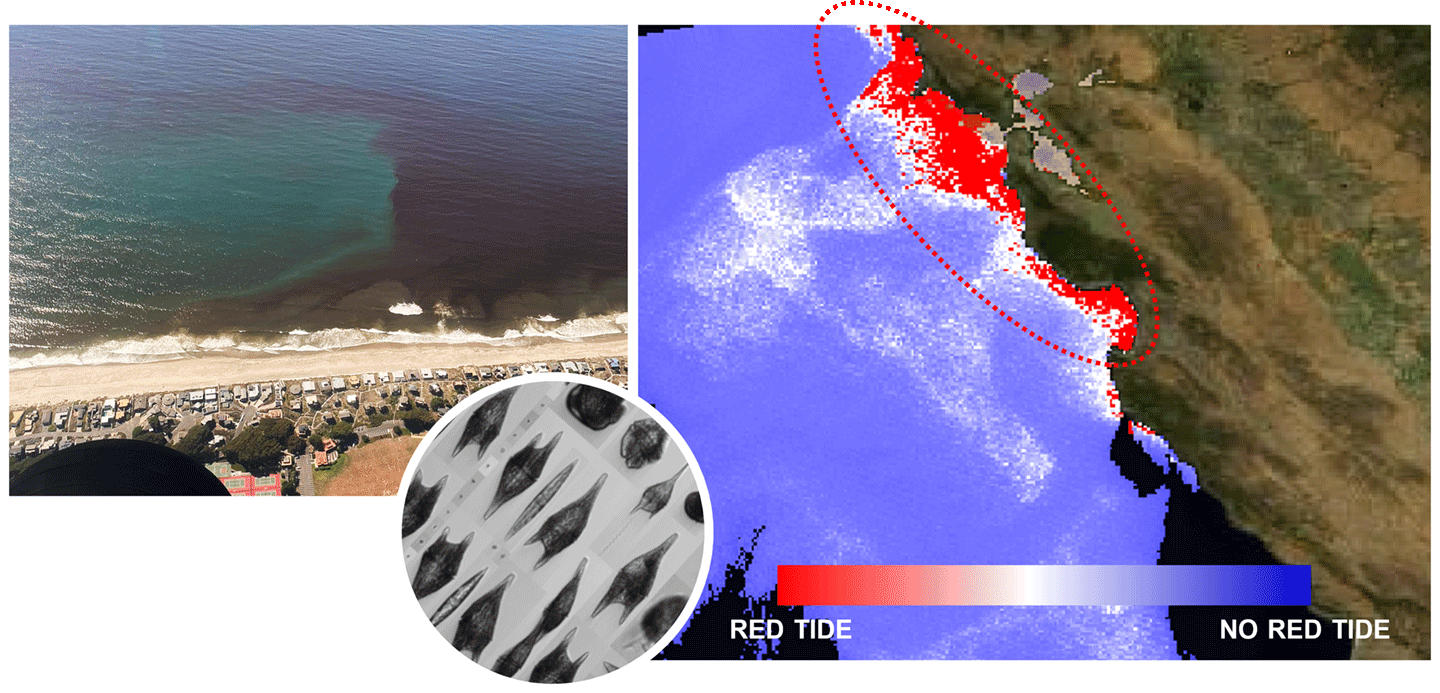
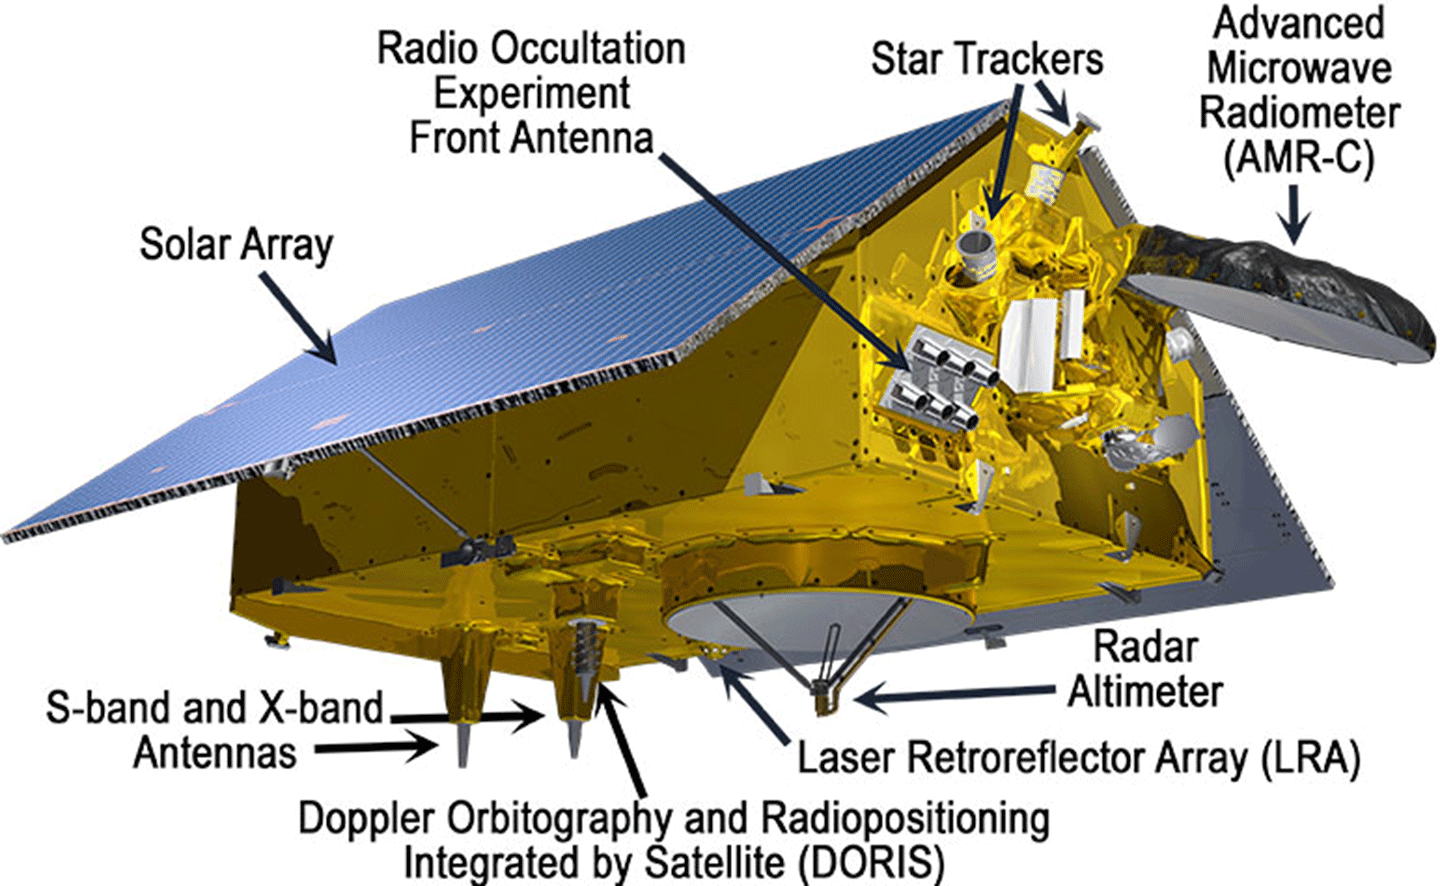
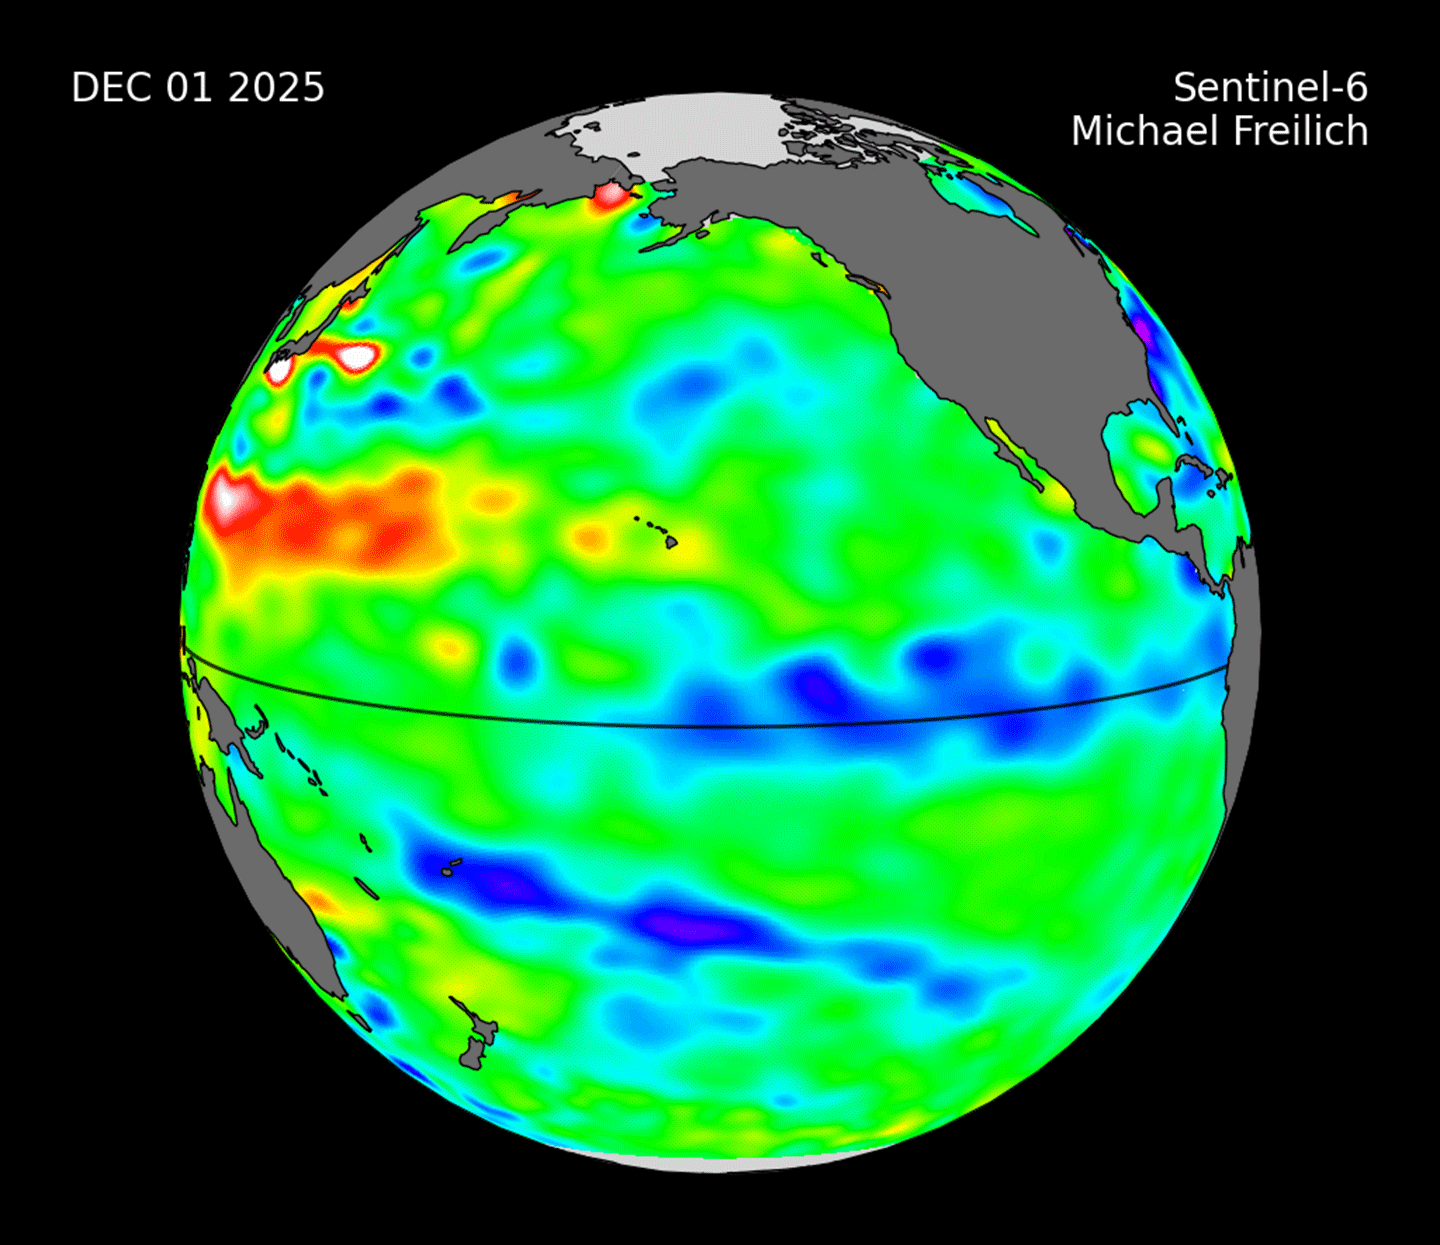
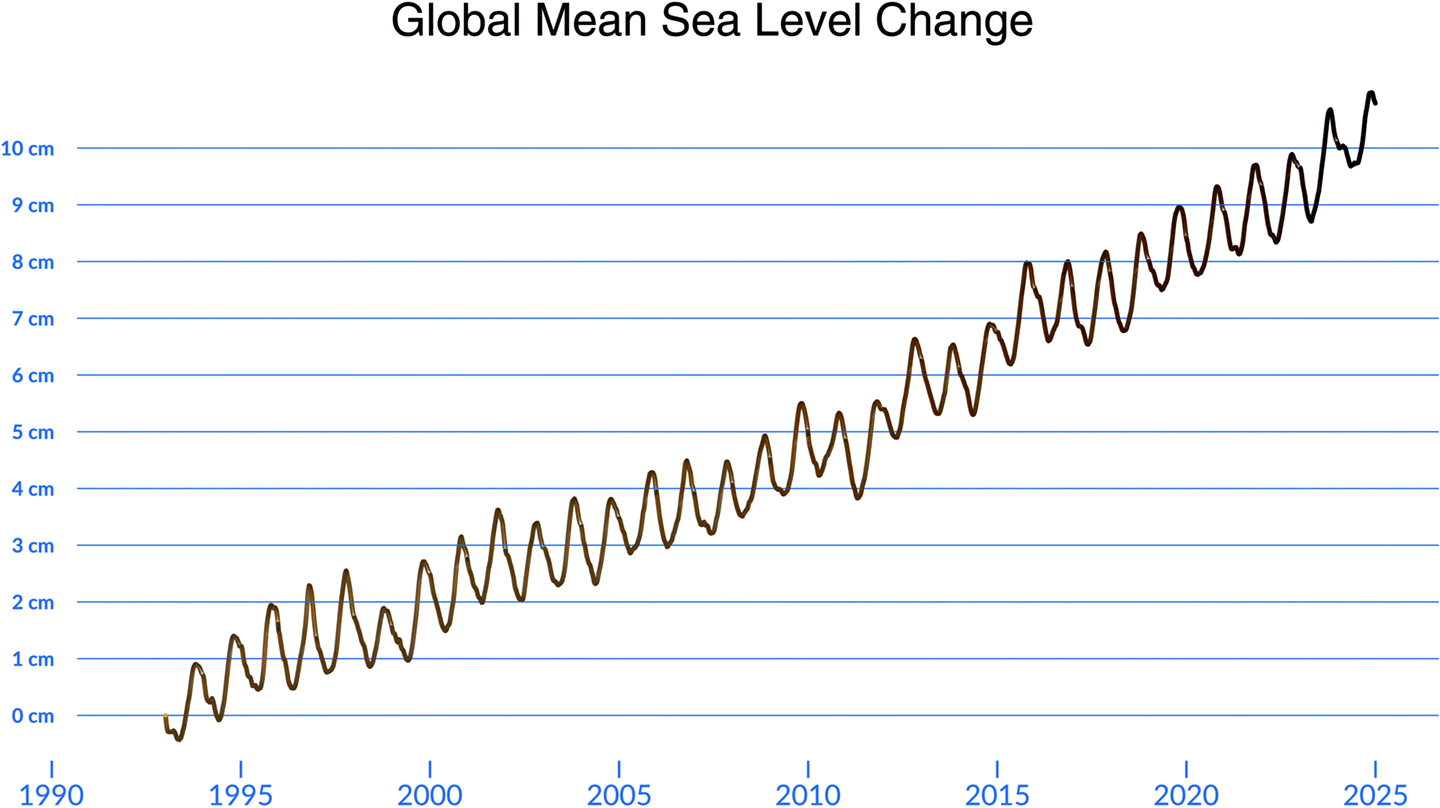