
NASA - Breaking News
Hubble Observes Stars Flaring to Life in Orion
- Hubble Home
- Overview
- Impact & Benefits
- Science
- Observatory
- Team
- Multimedia
- News
- More
3 min read
Hubble Observes Stars Flaring to Life in Orion Protostar HOPS 181 is buried in layers of dusty gas clouds, but its energy shapes the material that surrounds it. NASA, ESA, and T. Megeath (University of Toledo); Processing: Gladys Kober (NASA/Catholic University of America) A protostar wrapped in obscuring dust creates a cavity with glowing walls while its jet streams into space. NASA, ESA, and T. Megeath (University of Toledo); Processing: Gladys Kober (NASA/Catholic University of America) A curving cavity in a cloud of gas has been hollowed out by a protostar in this Hubble image. NASA, ESA, and T. Megeath (University of Toledo); Processing: Gladys Kober (NASA/Catholic University of America)
Just-forming stars, called protostars, dazzle a cloudy landscape in the Orion Molecular Cloud complex (OMC). These three new images from NASA’s Hubble Space Telescope were taken as part of an effort to learn more about the envelopes of gas and dust surrounding the protostars, as well as the outflow cavities where stellar winds and jets from the developing stars have carved away at the surrounding gas and dust.
Scientists used these Hubble observations as part of a broader survey to study protostellar envelopes, or the gas and dust around the developing star. Researchers found no evidence that the outflow cavities were growing as the protostar moved through the later stages of star formation. They also found that the decreasing accretion of mass onto the protostars over time and the low rate of star formation in the cool, molecular clouds cannot be explained by the progressive clearing out of the envelopes.
The OMC lies within the “sword” of the constellation Orion, roughly 1,300 light-years away.
Protostar HOPS 181 is buried in layers of dusty gas clouds, but its energy shapes the material that surrounds it. NASA, ESA, and T. Megeath (University of Toledo); Processing: Gladys Kober (NASA/Catholic University of America)This Hubble image shows a small group of young stars amidst molecular clouds of gas and dust. Near the center of the image, concealed behind the dusty clouds, lies the protostar HOPS 181. The long, curved arc in the top left of the image is shaped by the outflow of material coming from the protostar, likely from the jets of particles shot out at high speeds from the protostar’s magnetic poles. The light of nearby stars reflects off and is scattered by dust grains that fill the image, giving the region its soft glow.
Download this image (5.7 MB)
A protostar wrapped in obscuring dust creates a cavity with glowing walls while its jet streams into space. NASA, ESA, and T. Megeath (University of Toledo); Processing: Gladys Kober (NASA/Catholic University of America)
Download this image (6 MB)
The bright star in the lower right quadrant called CVSO 188 might seem like the diva in this image, but HOPS 310, located just to the left of center behind the dust, is the true hidden star. This protostar is responsible for the large cavity with bright walls that has been carved into the surrounding cloud of gas and dust by its jets and stellar winds. Running diagonally to the top right is one of the bipolar jets of the protostar. These jets consist of particles launched at high speeds from the protostar’s magnetic poles. Some background galaxies are visible in the upper right of the image.
A curving cavity in a cloud of gas has been hollowed out by a protostar in this Hubble image. NASA, ESA, and T. Megeath (University of Toledo); Processing: Gladys Kober (NASA/Catholic University of America)Download this image (5.7 MB)
The bright protostar to the left in this Hubble image is located within the Orion Molecular Clouds. Its stellar winds — ejected, fast-flowing particles that are spurred by the star’s magnetic field — have carved a large cavity in the surrounding cloud. In the top right, background stars speckle the image.
New images added every day between January 12-17, 2026! Follow @NASAHubble on social media for the latest Hubble images and news and see Hubble’s Stellar Construction Zones for more images of young stellar objects.
Facebook logo @NASAHubble @NASAHubble Instagram logo @NASAHubble Explore MoreExploring the Birth of Stars
Hubble’s Nebulae
Media Contact:
Claire Andreoli
NASA’s Goddard Space Flight Center, Greenbelt, MD
claire.andreoli@nasa.gov
Since its 1990 launch, the Hubble Space Telescope has changed our fundamental understanding of the universe.
Hubble’s Stellar Construction Zones
Explore the Night Sky
Hubble News
Fire on Ice: The Arctic’s Changing Fire Regime
- Earth
- Earth Observatory
- Image of the Day
- EO Explorer
- Topics
- More Content
- About
Fires on the Rise in the Far North
- Earth
- Earth Observatory
- Image of the Day
- EO Explorer
- Topics
- More Content
- About
La NASA transmitirá en directo el regreso y el amerizaje de Crew 11
Read this press release in English here.
La NASA y SpaceX prevén que, si las condiciones meteorológicas lo permiten, el desacoplamiento de la misión SpaceX Crew 11 de la agencia espacial estadounidense de la Estación Espacial Internacional se produzca no antes de las 5:05 p.m. EST (hora del este) del miércoles 14 de enero.
El 8 de enero, la NASA anunció su decisión de traer de vuelta a la Tierra antes de lo previsto a los integrantes de la misión SpaceX Crew 11 de la agencia desde la estación espacial, mientras los equipos técnicos siguen de cerca un problema médico que afecta a un miembro de la tripulación que actualmente vive y trabaja a bordo del laboratorio orbital. Debido a la confidencialidad médica, no es apropiado que la NASA comparta más detalles sobre el miembro de la tripulación, quien se encuentra estable.
Está planeado que los astronautas de la NASA Zena Cardman y Mike Fincke, el astronauta de JAXA (Agencia Japonesa de Exploración Aeroespacial) Kimiya Yui y el cosmonauta de Roscosmos Oleg Platonov americen frente a la costa de California a las 3:41 a.m. del jueves 15 de enero.
Los responsables de la misión continúan supervisando las condiciones en la zona de recuperación, ya que el desacoplamiento de la nave Dragon de SpaceX depende de las condiciones operativas de la nave espacial, la preparación del equipo de recuperación, las condiciones meteorológicas, el estado del mar y otros factores. La NASA y SpaceX seleccionarán una hora y un lugar concretos para el amerizaje cuando se acerque la fecha del desacoplamiento de la nave espacial de Crew 11.
La cobertura en directo (en inglés) de la NASA del regreso y las actividades relacionadas se retransmitirá en NASA+, Amazon Prime, y el canal de YouTube de la agencia. Aprenda cómo transmitir contenido de la NASA a través de diversas plataformas en línea, incluidas las redes sociales.
La cobertura de la NASA es la siguiente (todas las horas son del este y están sujetas a cambios en función de las operaciones en tiempo real):
Miércoles, 14 de enero
3 p.m. – Comienza la cobertura del cierre de escotilla en NASA+, Amazon Prime, y YouTube.
3:30 p.m. – Cierre de escotilla
4:45 p.m. – Comienza la cobertura del desacoplamiento en NASA+, Amazon Prime, y YouTube.
5:05 p.m. – Desacoplamiento
Tras la finalización de la cobertura del desacoplamiento, la NASA distribuirá las conversaciones (solo en formato audio) entre la tripulación Crew 11, la estación espacial y los controladores de vuelo durante el tránsito de la nave Dragon alejándose del complejo orbital.
Jueves, 15 de enero
2:15 a.m. – Comienza la cobertura del regreso en NASA+, Amazon Prime, y YouTube.
2:51 a.m. – Encendido de desorbitado
3:41 a.m. – Amerizaje
5:45 a.m. – El administrador de la NASA, Jared Isaacman, liderará una rueda de prensa sobre el regreso a la Tierra que se transmitirá en directo a través de NASA+, Amazon Prime, y el canal de YouTube de la agencia.
Para participar virtualmente en la conferencia de prensa, los medios de comunicación deben ponerse en contacto con la sala de prensa del Centro Espacial Johnson de la NASA para obtener los detalles de la llamada antes de las 5 p.m. CST (hora del centro) del 14 de enero, enviando un correo electrónico a jsccommu@mail.nasa.gov o llamando al +1 281-483-5111. Para hacer preguntas, los medios de comunicación deben llamar al menos 10 minutos antes del inicio de la conferencia. La política de acreditación de medios de comunicación de la agencia está disponible en línea (en inglés).
Encuentre la cobertura completa de la misión, el blog de tripulaciones comerciales de la NASA y más información sobre la misión Crew 11 (todo en inglés) en:
https://www.nasa.gov/commercialcrew
-fin-
Joshua Finch / Jimi Russell / María José Viñas
Sede central, Washington
+1 202-358-1100
joshua.a.finch@nasa.gov / james.j.russell@nasa.gov / maria-jose.vinasgarcia@nasa.gov
Sandra Jones / Joseph Zakrzewski
Centro Espacial Johnson, Houston
+1 281-483-5111
sandra.p.jones@nasa.gov / joseph.a.zakrzewski@nasa.gov
Steve Siceloff
Centro Espacial Kennedy, Fla.
+1 321-867-2468
steven.p.siceloff@nasa.gov
NASA to Provide Live Coverage of Crew-11 Return, Splashdown
Editor’s note: This advisory was updated on Wednesday, Jan. 14 to update the undocking time and coverage
Lee este comunicado de prensa en español aquí.
NASA and SpaceX are targeting no earlier than 5:20 p.m. EST, Wednesday, Jan. 14, for the undocking of the agency’s SpaceX Crew-11 mission from the International Space Station, pending weather conditions.
On Jan. 8, NASA announced its decision to return the agency’s SpaceX Crew-11 mission to Earth from the space station earlier than originally planned as teams monitor a medical concern with a crew member currently living and working aboard the orbital laboratory, who is stable. Due to medical privacy, it is not appropriate for NASA to share more details about the crew member.
NASA astronauts Zena Cardman and Mike Fincke, JAXA (Japan Aerospace Exploration Agency) astronaut Kimiya Yui, and Roscosmos cosmonaut Oleg Platonov are targeted to splash down off the coast of California at 3:41 a.m. on Thursday, Jan. 15.
Mission managers continue monitoring conditions in the recovery area, as undocking of the SpaceX Dragon depends on spacecraft readiness, recovery team readiness, weather, sea states, and other factors. NASA and SpaceX will select a specific splashdown time and location closer to the Crew-11 spacecraft undocking.
NASA’s live coverage of return and related activities will stream on NASA+, Amazon Prime, and the agency’s YouTube channel. Learn how to stream NASA content through a variety of online platforms, including social media.
NASA’s coverage is as follows (all times Eastern and subject to changed based on real-time operations):
Wednesday, Jan. 14
3 p.m. – Hatch closure coverage begins on NASA+, Amazon Prime, and YouTube.
3:30 p.m. – Hatch closing
5 p.m. – Undocking coverage begins on NASA+, Amazon Prime, and YouTube.
5:20 p.m. – Undocking
Following the conclusion of undocking coverage, NASA will distribute audio-only communications between Crew-11, the space station, and flight controllers during Dragon’s transit away from the orbital complex.
Thursday, Jan. 15
2:15 a.m. – Return coverage begins on NASA+, Amazon Prime, and YouTube.
2:51 a.m. – Deorbit burn
3:41 a.m. – Splashdown
5:45 a.m. – NASA Administrator Jared Isaacman will lead a Return to Earth news conference streaming live on NASA+, Amazon Prime, and the agency’s YouTube channel.
To participate virtually in the news conference, media must contact the NASA Johnson newsroom for call details by 5 p.m. CST, Jan. 14, at: jsccommu@mail.nasa.gov or 281-483-5111. To ask questions, media must dial in no later than 10 minutes before the start of the call. The agency’s media credentialing policy is available online.
Find full mission coverage, NASA’s commercial crew blog, and more information about the Crew-11 mission at:
https://www.nasa.gov/commercialcrew
-end-
Joshua Finch / Jimi Russell
Headquarters, Washington
202-358-1100
joshua.a.finch@nasa.gov / james.j.russell@nasa.gov
Sandra Jones / Joseph Zakrzewski
Johnson Space Center, Houston
281-483-5111
sandra.p.jones@nasa.gov / joseph.a.zakrzewski@nasa.gov
Steve Siceloff
Kennedy Space Center, Fla.
321-867-2468
steven.p.siceloff@nasa.gov
NASA’s Pandora Small Satellite Launched
In this photo from early January 2026, teams prepare to encapsulate NASA’s Pandora small satellite, NASA-sponsored Star-Planet Activity Research CubeSat (SPARCS), and the Black Hole Coded Aperture Telescope (BlackCAT) CubeSat, inside a SpaceX Falcon 9 payload fairing.
A SpaceX Falcon 9 rocket carrying NASA’s Pandora small satellite lifted off at 5:44 a.m. PST Sunday, Jan. 11, from Space Launch Complex 4 East at Vandenberg Space Force Base located on California’s central coast.
During its initial year, Pandora will provide an in-depth study of at least 20 known planets orbiting distant stars to determine the composition of their atmospheres — especially the presence of hazes, clouds, and water.
Image credit: SpaceX
NASA, Department of Energy to Develop Lunar Surface Reactor by 2030
NASA, along with the U.S. Department of Energy (DOE), announced Tuesday a renewed commitment to their longstanding partnership to support the research and development of a fission surface power system for use on the Moon under the Artemis campaign and future NASA missions to Mars.
A recently signed memorandum of understanding between the agencies solidifies this collaboration and advances President Trump’s vision of American space superiority by deploying nuclear reactors on the Moon and in orbit, including the development of a lunar surface reactor by 2030. This effort ensures the United States leads the world in space exploration and commerce.
“Under President Trump’s national space policy, America is committed to returning to the Moon, building the infrastructure to stay, and making the investments required for the next giant leap to Mars and beyond,” said NASA Administrator Jared Isaacman. “Achieving this future requires harnessing nuclear power. This agreement enables closer collaboration between NASA and the Department of Energy to deliver the capabilities necessary to usher in the Golden Age of space exploration and discovery.”
NASA and DOE anticipate deploying a fission surface power system capable of producing safe, efficient, and plentiful electrical power that will be able to operate for years without the need to refuel. The deployment of a lunar surface reactor will enable future sustained lunar missions by providing continuous and abundant power, regardless of sunlight or temperature.
“History shows that when American science and innovation come together, from the Manhattan Project to the Apollo Mission, our nation leads the world to reach new frontiers once thought impossible,” said U.S. Secretary of Energy Chris Wright. “This agreement continues that legacy. Thanks to President Trump’s leadership and his America First Space Policy, the department is proud to work with NASA and the commercial space industry on what will be one of the greatest technical achievements in the history of nuclear energy and space exploration.”
The agencies’ joint effort to develop, fuel, authorize, and ready a lunar surface reactor for launch builds upon more than 50 years of successful collaboration in support of space exploration, technology development, and the strengthening of our national security.
For more about NASA’s Moon to Mars exploration plans, visit:
https://www.nasa.gov/moontomarsarchitecture
-end-
Bethany Stevens
Headquarters, Washington
771-216-2606
bethany.c.stevens@nasa.gov
NASA Back for Seconds with New Food System Design Challenge
4 min read
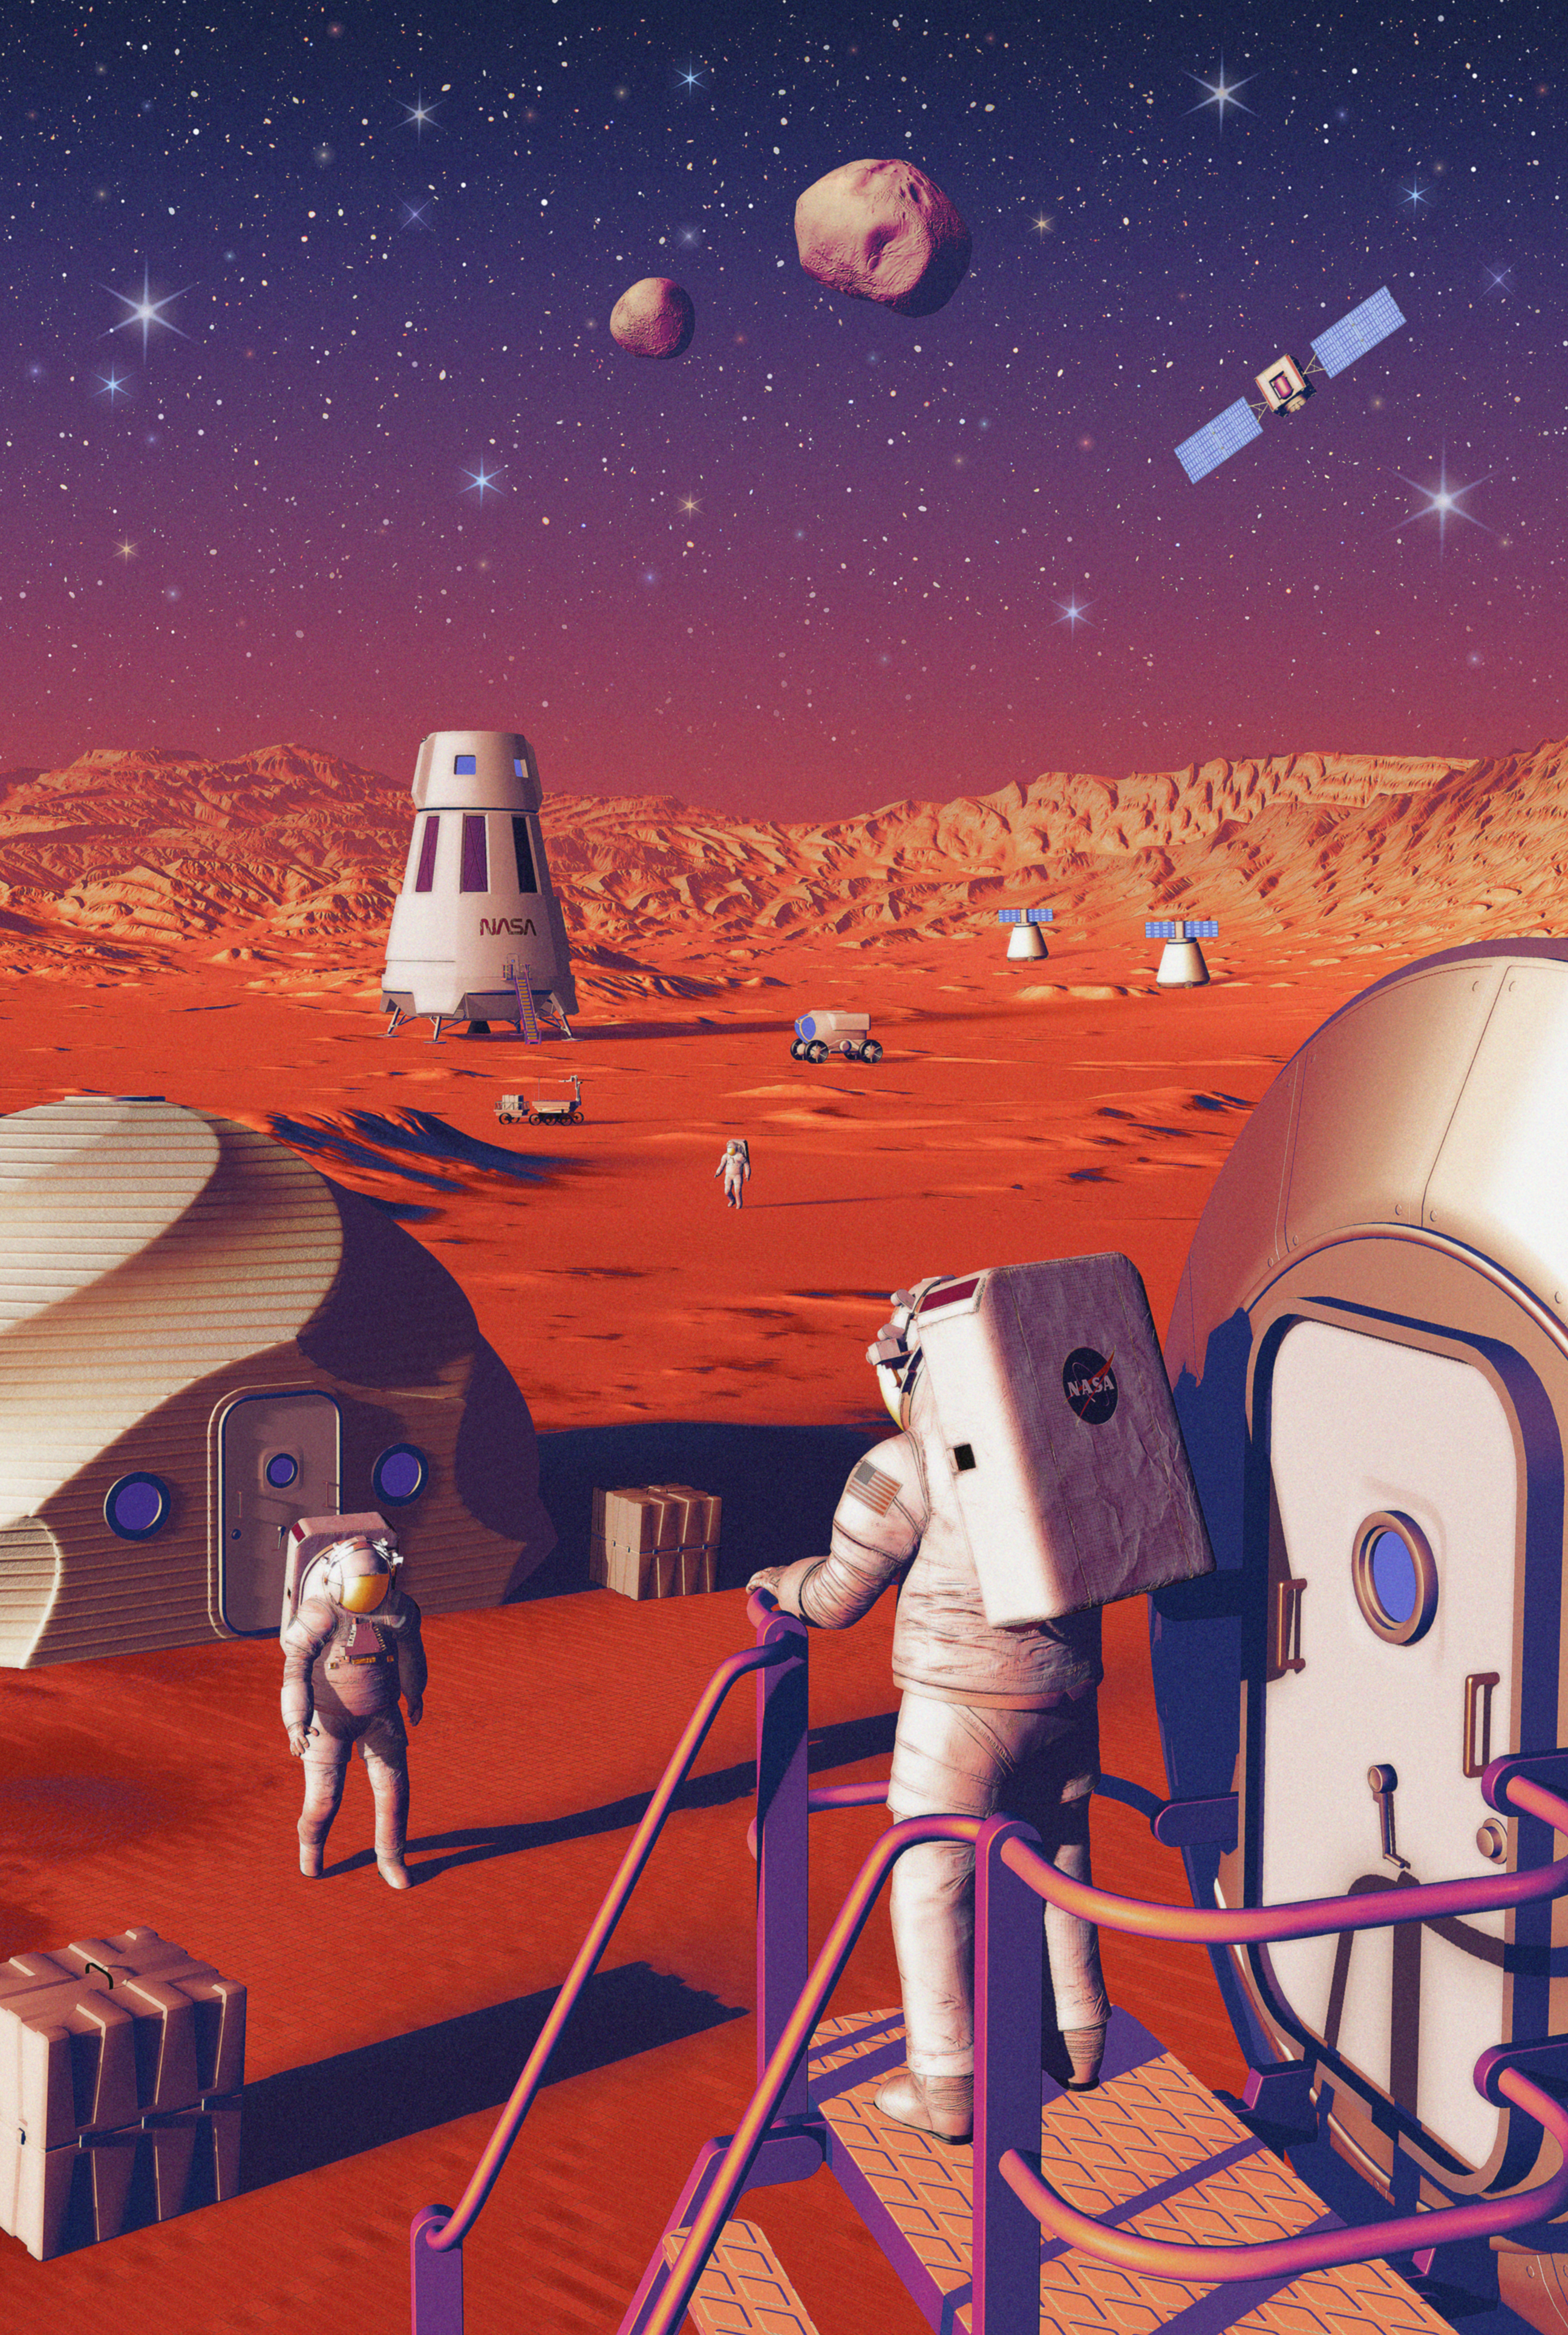
Preparations for Next Moonwalk Simulations Underway (and Underwater) This illustration of Moon to Mars infrastructure shows astronauts living and working on the surface of Mars. NASA’s Moon to Mars Objectives establish an objectives-based approach to the agency’s human deep space exploration efforts; NASA’s Moon to Mars Architecture approach distills the objectives into operational capabilities and elements.NASA is getting ready to send four astronauts around the Moon with Artemis II, laying the foundation for sustainable missions to the lunar surface and paving the way for human exploration on Mars. As the agency considers deep space endeavors that could last months or years, it must develop ways to feed astronauts beyond sending supplies from Earth.
That is why NASA is launching the Deep Space Food Challenge: Mars to Table, a new global competition inviting chefs, innovators, culinary experts, higher-education students, and citizen scientists to design a complete, Earth-independent food system for long-duration space missions.
“In the future, exploration missions will grow in both duration and distance from Earth. This will make the critical question of feeding our astronauts more complex, requiring innovative solutions to allow for long-term human exploration of space,” said Greg Stover, acting associate administrator of NASA’s Space Technology Missions Directorate at NASA Headquarters in Washington. “Opening the door to ideas from beyond the agency strengthens NASA’s ability to operate farther from Earth with greater independence.”
Mars to Table builds on NASA’s first Deep Space Food Challenge by seeking to integrate multiple food production and preparation methods into a holistic, self-sustaining system designed for use on Mars. This new challenge is open now until July 31 to the global public and carries a prize purse of up to $750,000.
“Future crews on the Moon and Mars will need food systems that are nutritious, sustainable, and fully independent from Earth,” said Jarah Meador, program executive for NASA’s Prizes, Challenges, and Crowdsourcing Program at NASA Headquarters. “Food will play a pivotal role in the overall health and happiness of future deep space explorers. The Mars to Table Challenge is about bringing all those pieces together into one comprehensive design.”
Solvers are tasked with creating a complete meal plan suitable for astronauts living on Mars, using a NASA-created mission scenario as their guide. Each team will design a full food system concept, including a detailed operations plan and system design layout that supports a surface mission. Teams must consider every detail – from nutritional balance and taste to safety, usability, and integration with NASA’s Environmental Control and Life Support Systems.
Participants in the Mars to Table Challenge are also encouraged to address food security on Earth. Innovative growth systems designed for space could make fresh food production possible in harsh, remote, or resource-limited areas, such as research stations located at Earth’s poles or in rural areas with limited access to traditional supply chains.
“This challenge isn’t just about feeding astronauts; it’s about feeding people anywhere,” said Jennifer Edmunson, acting program manager for NASA’s Centennial Challenges at NASA’s Marshall Spaceflight Center in Huntsville, Alabama. “Novel meals that are compact, shelf-stable, and nutrient-rich could expand culinary options for groups like military personnel or disaster relief responders. By solving for Mars and future planetary expeditions, we can also find solutions for Earth.”
NASA’s Centennial Challenges have a 20-year legacy of engaging the public to solve complex problems that benefit NASA’s broader initiatives. Past challenges have spurred advances in robotics, additive manufacturing, power and energy, textiles, chemistry, and biology.
Mars to Table is a collaborative, cross-program Centennial Challenge with support from NASA’s Division of Biological and Physical Sciences, Heliophysics Division, Planetary Science Program, Human Research Program, and Mars Campaign Office. Subject matter experts at the agency’s Johnson Space Center in Houston and Kennedy Space Center in Florida support the challenge. This challenge is part of the Prizes, Challenges and Crowdsourcing program within NASA’s Space Technology Mission Directorate. NASA has partnered with the Methuselah Foundation and contracted Floor23 Digital to support the administration and management of this challenge.
To learn more about the challenge, including timelines, submission requirements, and future webinar dates, visit:
https://www.deepspacefood.org/marstotable
By Savannah Bullard
Facebook logo @NASATechnology @NASA_Technology Keep Exploring Discover More Topics From NASASpace Technology Mission Directorate
STMD Solicitations and Opportunities
NASA Prizes, Challenges, and Crowdsourcing
CoECI
Share Details Last Updated Jan 13, 2026 EditorLoura Hall Related TermsHubble Nets Menagerie of Young Stellar Objects
- Hubble Home
- Overview
- Impact & Benefits
- Science
- Observatory
- Team
- Multimedia
- News
- More
3 min read
Hubble Nets Menagerie of Young Stellar Objects A bright reflection nebula shares the stage with a protostar and planet-forming disk in this Hubble image. NASA, ESA, K. Stapelfeldt (Jet Propulsion Laboratory) and D. Watson (University of Rochester); Processing: Gladys Kober (NASA/Catholic University of America)Download this image (58.3 MB)
A disparate collection of young stellar objects bejewels a cosmic panorama in the star-forming region NGC 1333 in this new image from NASA’s Hubble Space Telescope. To the left, an actively forming star called a protostar casts its glow on the surrounding gas and dust, creating a reflection nebula. Two dark stripes on opposite sides of the bright point (upper left) are its protoplanetary disk, a region where planets could form, and the disk’s shadow, cast across the large envelope of material around the star. Material accumulates onto the protostar through this rotating disk of gas and dust, a product of the collapsing cloud of gas and dust that gave birth to the star. Where the shadow stops and the disk begins is presently unknown.
To the center right, an outflow cavity reveals a fan-shaped reflection nebula. The two stars at its base, HBC 340 (lower) and HBC 341 (upper), unleash stellar winds, or material flowing from the surface of the star, that clear out the cavity from the surrounding molecular cloud over time. A reflection nebula like this one is illuminated by light from nearby stars that is scattered by the surrounding gas and dust.
This reflection nebula fluctuates in brightness over time, which researchers attribute to variations in brightness of HBC 340 and HBC 341. HBC 340 is the primary source of the fluctuation as the brighter and more variable star.
HBC 340 and HBC 341 are Orion variable stars, a class of forming stars that change in brightness irregularly and unpredictably, possibly due to stellar flares and ejections of matter from their surfaces. Orion variable stars, so named because they are associated with diffuse nebulae like the Orion Nebula, eventually evolve into non-variable stars.
In this image, the four beaming stars near the bottom of the image and one in the top right corner are also Orion variable stars. The rest of the cloudscape is studded with other young stellar objects.
NGC 1333 lies about 950 light-years away in the Perseus molecular cloud, and was imaged by Hubble to learn more about young stellar objects, such as properties of circumstellar disks and outflows in the gas and dust created by these stars.
New images added every day between January 12-17, 2026! Follow @NASAHubble on social media for the latest Hubble images and news and see Hubble’s Stellar Construction Zones for more images of young stellar objects.
Facebook logo @NASAHubble @NASAHubble Instagram logo @NASAHubble Explore MoreExploring the Birth of Stars
Hubble’s Nebulae
Media Contact:
Claire Andreoli
NASA’s Goddard Space Flight Center, Greenbelt, MD
claire.andreoli@nasa.gov
Since its 1990 launch, the Hubble Space Telescope has changed our fundamental understanding of the universe.
Hubble’s Stellar Construction Zones
Explore the Night Sky
Hubble News
NASA’s Webb Delivers Unprecedented Look Into Heart of Circinus Galaxy
- Webb
- News
- Overview
- Science
- Observatory
- Multimedia
- Team
- More
Artwork: NASA, ESA, CSA, Ralf Crawford (STScI)
The Circinus Galaxy, a galaxy about 13 million light-years away, contains an active supermassive black hole that continues to influence its evolution. The largest source of infrared light from the region closest to the black hole itself was thought to be outflows, or streams of superheated matter that fire outward.
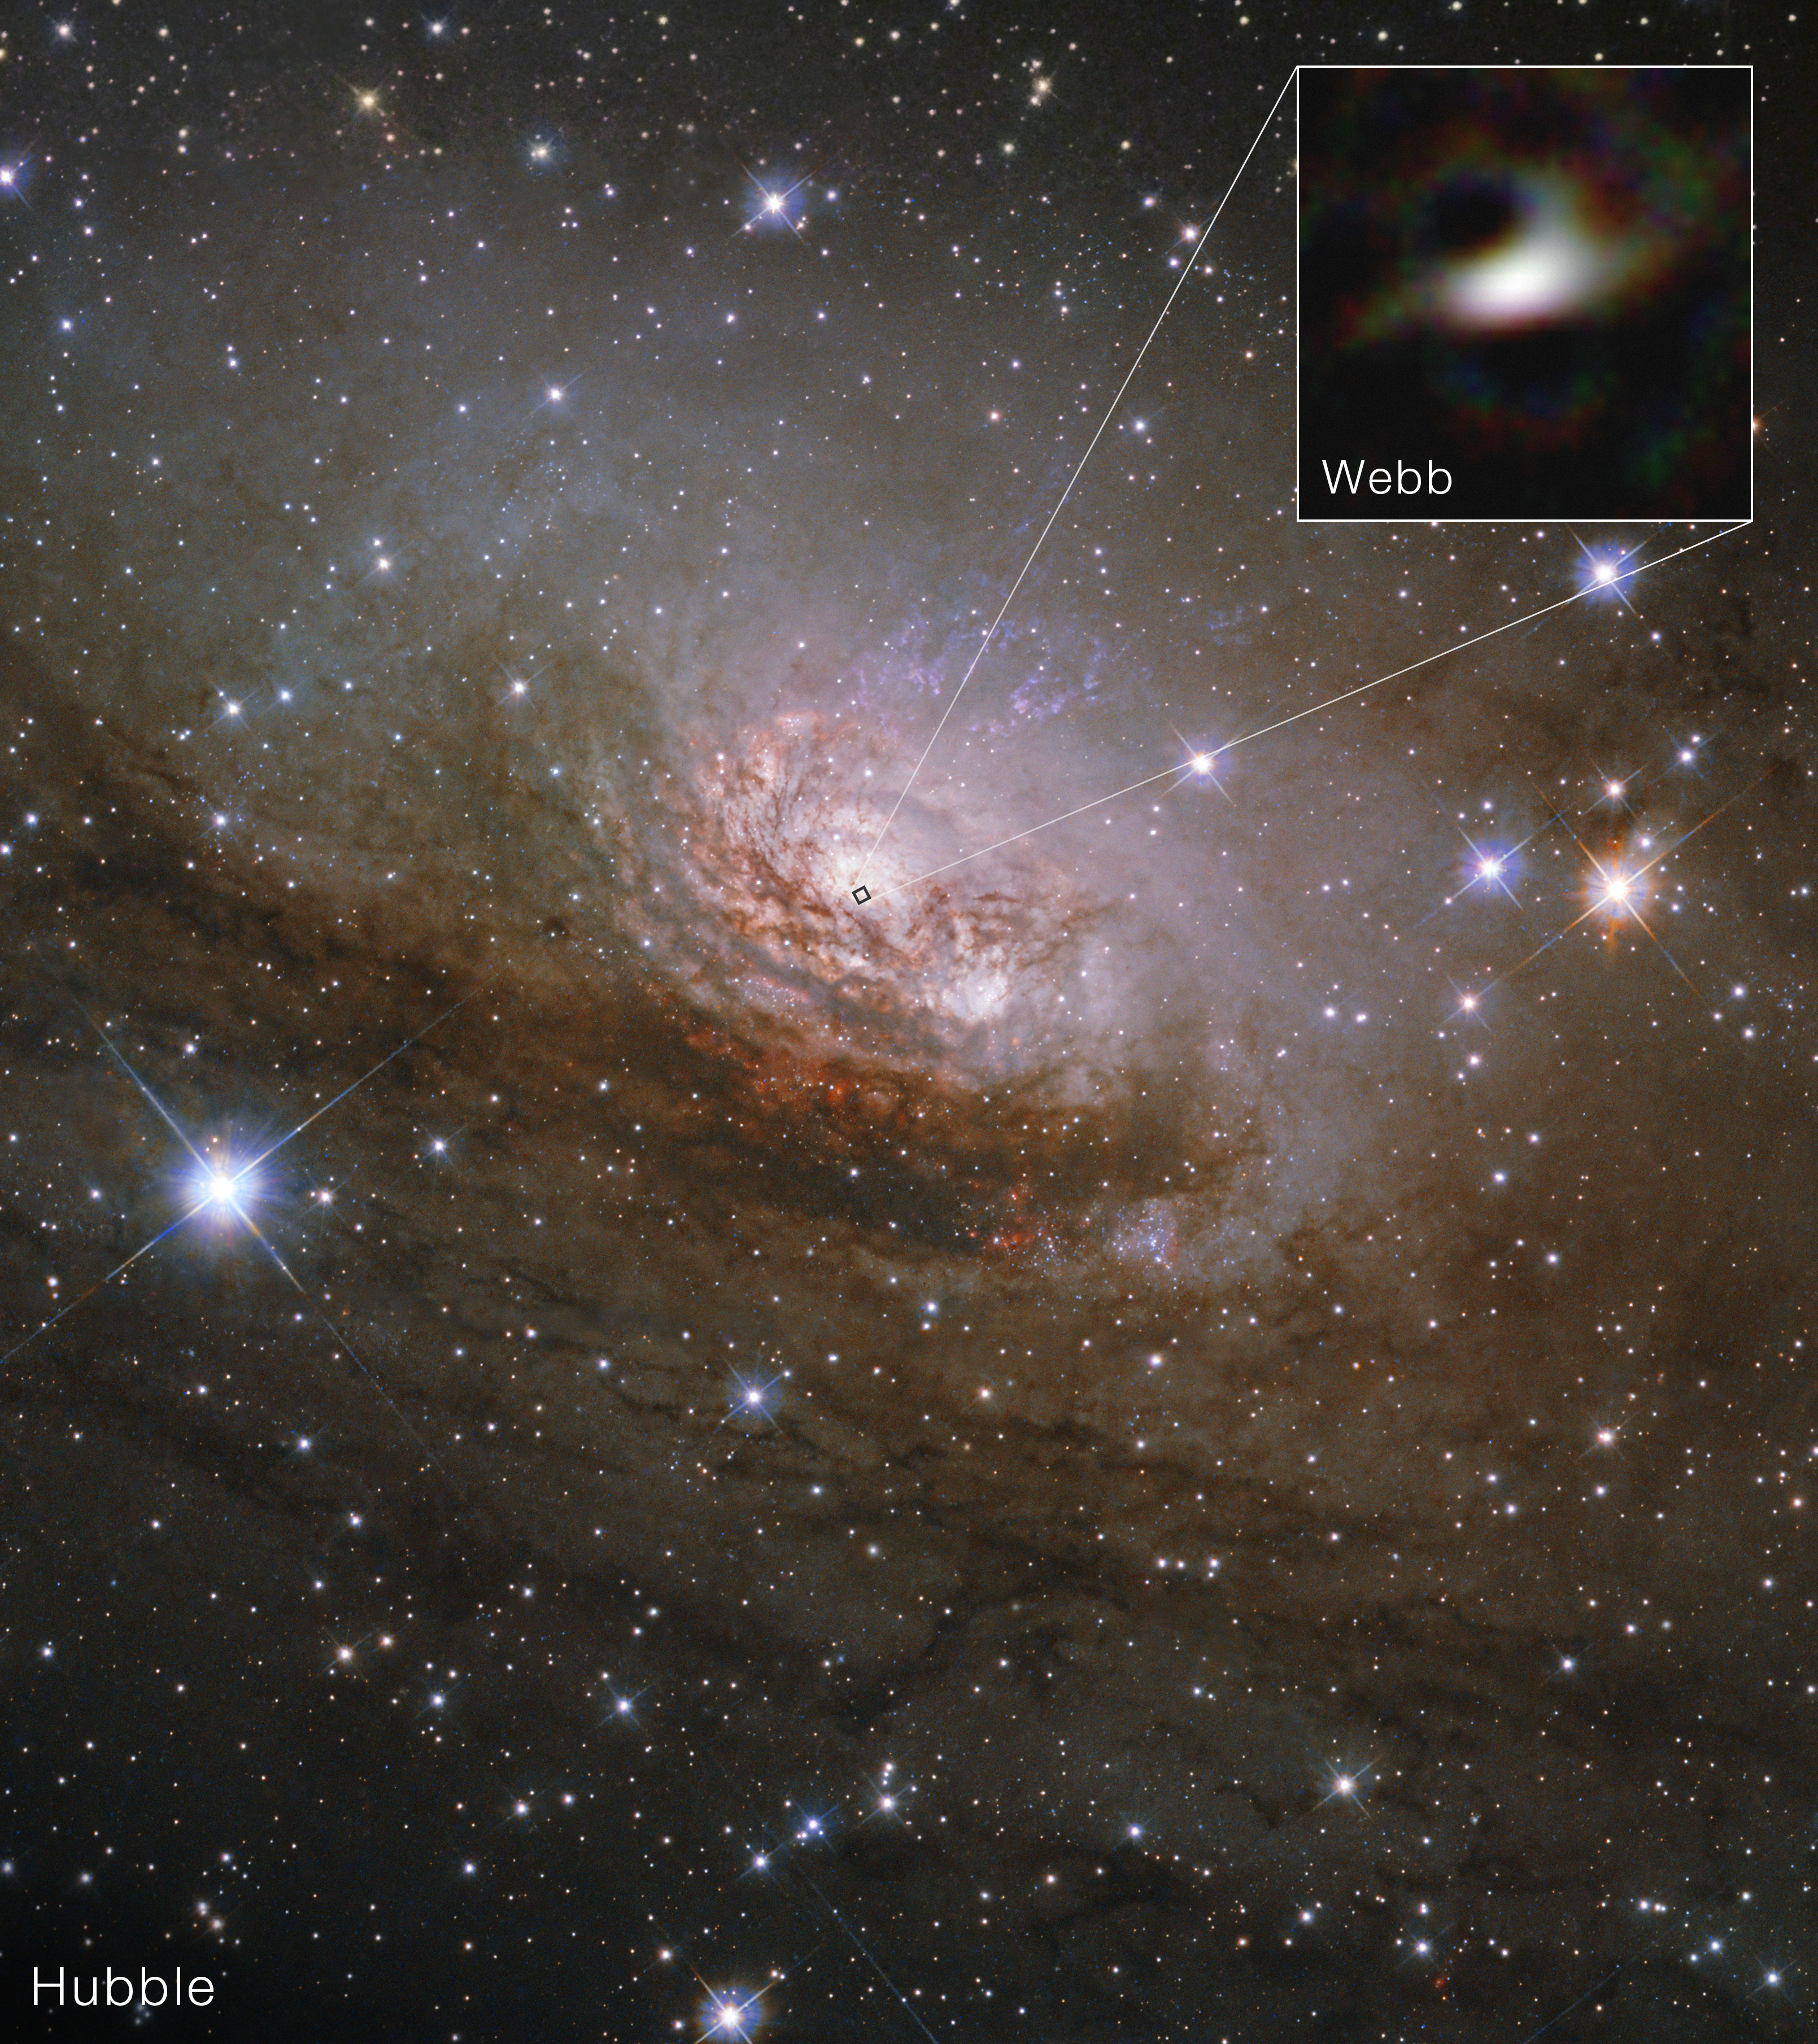
Image: Circinus Galaxy (Hubble and Webb) This image from NASA’s Hubble Space Telescope shows the Circinus galaxy. A close-up of its core from NASA’s James Webb Space Telescope shows the inner face of the hole of the donut-shaped disk of gas disk glowing in infrared light. The outer ring appears as dark spots. Image: NASA, ESA, CSA, Enrique Lopez-Rodriguez (University of South Carolina), Deepashri Thatte (STScI); Image Processing: Alyssa Pagan (STScI); Acknowledgment: NSF’s NOIRLab, CTIONow, new observations by NASA’s James Webb Space Telescope, seen here with a new image from NASA’s Hubble Space Telescope, provide evidence that reverses this thinking, suggesting that most of the hot, dusty material is actually feeding the central black hole. The technique used to gather this data also has the potential to analyze the outflow and accretion components for other nearby black holes.
The research, which includes the sharpest image of a black hole’s surroundings ever taken by Webb, published Tuesday in Nature.
Outflow questionSupermassive black holes like those in Circinus remain active by consuming surrounding matter. Infalling gas and dust accumulates into a donut-shaped ring around the black hole, known as a torus. As supermassive black holes gather matter from the torus’ inner walls, they form an accretion disk, similar to a whirlpool of water swirling around a drain. This disk grows hotter through friction, eventually becoming hot enough to emit light.
This glowing matter can become so bright that resolving details within the galaxy’s center with ground-based telescopes is difficult. It’s made even harder due to the bright, concealing starlight within Circinus. Further, since the torus is incredibly dense, the inner region of the infalling material, heated by the black hole, is obscured from our point of view. For decades, astronomers contended with these difficulties, designing and improving models of Circinus with as much data as they could gather.
Image: Circinus Galaxy Center (Artist’s Concept) This artist’s concept depicts the central engine of the Circinus galaxy, visualizing the supermassive black hole fed by a thick, dusty torus that glows in infrared light. Artwork: NASA, ESA, CSA, Ralf Crawford (STScI)“In order to study the supermassive black hole, despite being unable to resolve it, they had to obtain the total intensity of the inner region of the galaxy over a large wavelength range and then feed that data into models,” said lead author Enrique Lopez-Rodriguez of the University of South Carolina.
Early models would fit the spectra from specific regions, such as the emissions from the torus, those of the accretion disk closest to the black hole, or those from the outflows, each detected at certain wavelengths of light. However, since the region could not be resolved in its entirety, these models left questions at several wavelengths. For example, some telescopes could detect an excess of infrared light, but lacked the resolution to determine where exactly it was coming from.
“Since the ‘90s, it has not been possible to explain excess infrared emissions that come from hot dust at the cores of active galaxies, meaning the models only take into account either the torus or the outflows, but cannot explain that excess,” said Lopez-Rodriguez.
Such models found that most of the emission (and, therefore, mass) close to the center came from outflows. To test this theory, then, astronomers needed two things: the ability to filter the starlight that previously prevented a deeper analysis, and the ability to distinguish the infrared emissions of the torus from those of the outflows. Webb, sensitive and technologically sophisticated enough to meet both challenges, was necessary to advance our understanding.
Webb’s innovative techniqueTo look into the center of Circinus, Webb needed the Aperture Masking Interferometer tool on its NIRISS (Near-Infrared Imager and Slitless Spectrograph) instrument.
On Earth, interferometers usually take the form of telescope arrays: mirrors or antennae that work together as if they were a single telescope. An interferometer does this by gathering and combining the light from whichever source it is pointed toward, causing the electromagnetic waves that make up light to “interfere” with each other (hence, “interfere-ometer”) and creating interference patterns. These patterns can be analyzed by astronomers to reconstruct the size, shape, and features of distant objects with much greater detail than non-interferometric techniques.
The Aperture Masking Interferometer allows Webb to become an array of smaller telescopes working together as an interferometer, creating these interference patterns by itself. It does this by utilizing a special aperture made of seven small, hexagonal holes, which, like in photography, controls the amount and direction of light that enters the telescope’s detectors.
“These holes in the mask are transformed into small collectors of light that guide the light toward the detector of the camera and create an interference pattern,” said Joel Sanchez-Bermudez, co-author based at the National University of Mexico.
With new data in hand, the research team was able to construct an image from the central region’s interference patterns. To do so, they referenced data from previous observations to ensure their data from Webb was free of any artifacts. This resulted in the first extragalactic observation from an infrared interferometer in space.
“By using an advanced imaging mode of the camera, we can effectively double its resolution over a smaller area of the sky,” Sanchez-Bermudez said. “This allows us to see images twice as sharp. Instead of Webb’s 6.5-meter diameter, it’s like we are observing this region with a 13-meter space telescope.”
The data showed that contrary to the models predicting that the infrared excess comes from the outflows, around 87% of the infrared emissions from hot dust in Circinus come from the areas closest to the black hole, while less than 1% of emissions come from hot dusty outflows. The remaining 12% comes from distances farther away that could not previously be told apart.
“It is the first time a high-contrast mode of Webb has been used to look at an extragalactic source,” said Julien Girard, paper co-author and senior research scientist at the Space Telescope Science Institute. “We hope our work inspires other astronomers to use the Aperture Masking Interferometer mode to study faint, but relatively small, dusty structures in the vicinity of any bright object.”
Video: Circinus Galaxy ZoomTo view this video please enable JavaScript, and consider upgrading to a web browser that
supports HTML5 video
While the mystery of Circinus’ excess emissions has been solved, there are billions of black holes in our universe. Those of different luminosities, the team notes, may have an influence on whether most of the emissions come from a black hole’s torus or their outflows.
“The intrinsic brightness of Circinus’ accretion disk is very moderate,” Lopez-Rodriguez said. “So it makes sense that the emissions are dominated by the torus. But maybe, for brighter black holes, the emissions are dominated by the outflow.”
With this research, astronomers now have a tested technique to investigate whichever black holes they want, so long as they are bright enough for the Aperture Masking Interferometer to be useful. Studying additional targets will be essential to building a catalog of emission data to figure out if Circinus’ results were unique or characteristic of a pattern.
“We need a statistical sample of black holes, perhaps a dozen or two dozen, to understand how mass in their accretion disks and their outflows relate to their power,” Lopez-Rodriguez said.
The James Webb Space Telescope is the world’s premier space science observatory. Webb is solving mysteries in our solar system, looking beyond to distant worlds around other stars, and probing the mysterious structures and origins of our universe and our place in it. Webb is an international program led by NASA with its partners, ESA (European Space Agency) and CSA (Canadian Space Agency).
To learn more about Webb, visit:
Downloads & Related InformationThe following sections contain links to download this article’s images and videos in all available resolutions followed by related information links, media contacts, and if available, research paper and spanish translation links.
Related Images & Videos Circinus Galaxy Center (Artist’s Concept)This artist’s concept depicts the central engine of the Circinus galaxy, visualizing the supermassive black hole fed by a thick, dusty torus that glows in infrared light.
Circinus Galaxy (Hubble and Webb)
This image from NASA’s Hubble Space Telescope shows the Circinus galaxy. A close-up of its core from NASA’s James Webb Space Telescope shows the inner face of the hole of the donut-shaped disk of gas disk glowing in infrared light. The outer ring appears as dark spots.
Circinus Galaxy (Hubble and Webb Compass Image)
This image shows two views of the Circinus galaxy, one captured by the Hubble Space Telescope and the other by the James Webb Space Telescope’s NIRISS (Near-Infrared Imager and Slitless Spectrograph. It shows compass arrows, scale bar, and color key for reference.
Circinus Galaxy Zoom
This zoom-in video shows the location of the Circinus galaxy on the sky. It begins with a ground-based photo of the constellation Circinus by the late astrophotographer Akira Fujii. The video closes in on the Circinus galaxy, using views from the Digitized Sky Survey and the Dark…
Related Links
Read more: The Modes of Webb’s NIRISS
Explore more: Black Hole Resources from NASA’s Universe of Learning
Read more: Webb’s Scientific Instruments
Video: NASA Animation Sizes Up the Universe’s Biggest Black Holes
Laura Betz
NASA’s Goddard Space Flight Center
Greenbelt, Maryland
laura.e.betz@nasa.gov
Matthew Brown
Space Telescope Science Institute
Baltimore, Maryland
Hannah Braun
Space Telescope Science Institute
Baltimore, Maryland
Science Paper: “JWST interferometric imaging reveals the dusty disk obscuring the supermassive black hole of the Circinus galaxy” by E. Lopez Rodriguez et al.
Keep Exploring Discover More Topics From Webb James Webb Space Telescope
Webb is the premier observatory of the next decade, serving thousands of astronomers worldwide. It studies every phase in the…
Science Overview
Webb Observatory
Webb Image Galleries
A Plume of Bright Blue in Melissa’s Wake
- Earth
- Earth Observatory
- Image of the Day
- EO Explorer
- Topics
- More Content
- About
NASA, SpaceX Invite Media to Watch Crew-12 Launch to Space Station
Media accreditation is open for the launch of NASA’s 12th rotational mission of a SpaceX Falcon 9 rocket and Dragon spacecraft carrying astronauts to the International Space Station for a science expedition from Space Launch Complex 40 at Cape Canaveral Space Force Station in Florida.
NASA announced it is targeting no earlier than Thursday, Jan. 15, for a splashdown of its Crew-11 mission. The agency also is working with SpaceX and international partners to advance the launch of Crew-12, which is currently slated for Sunday, Feb. 15.
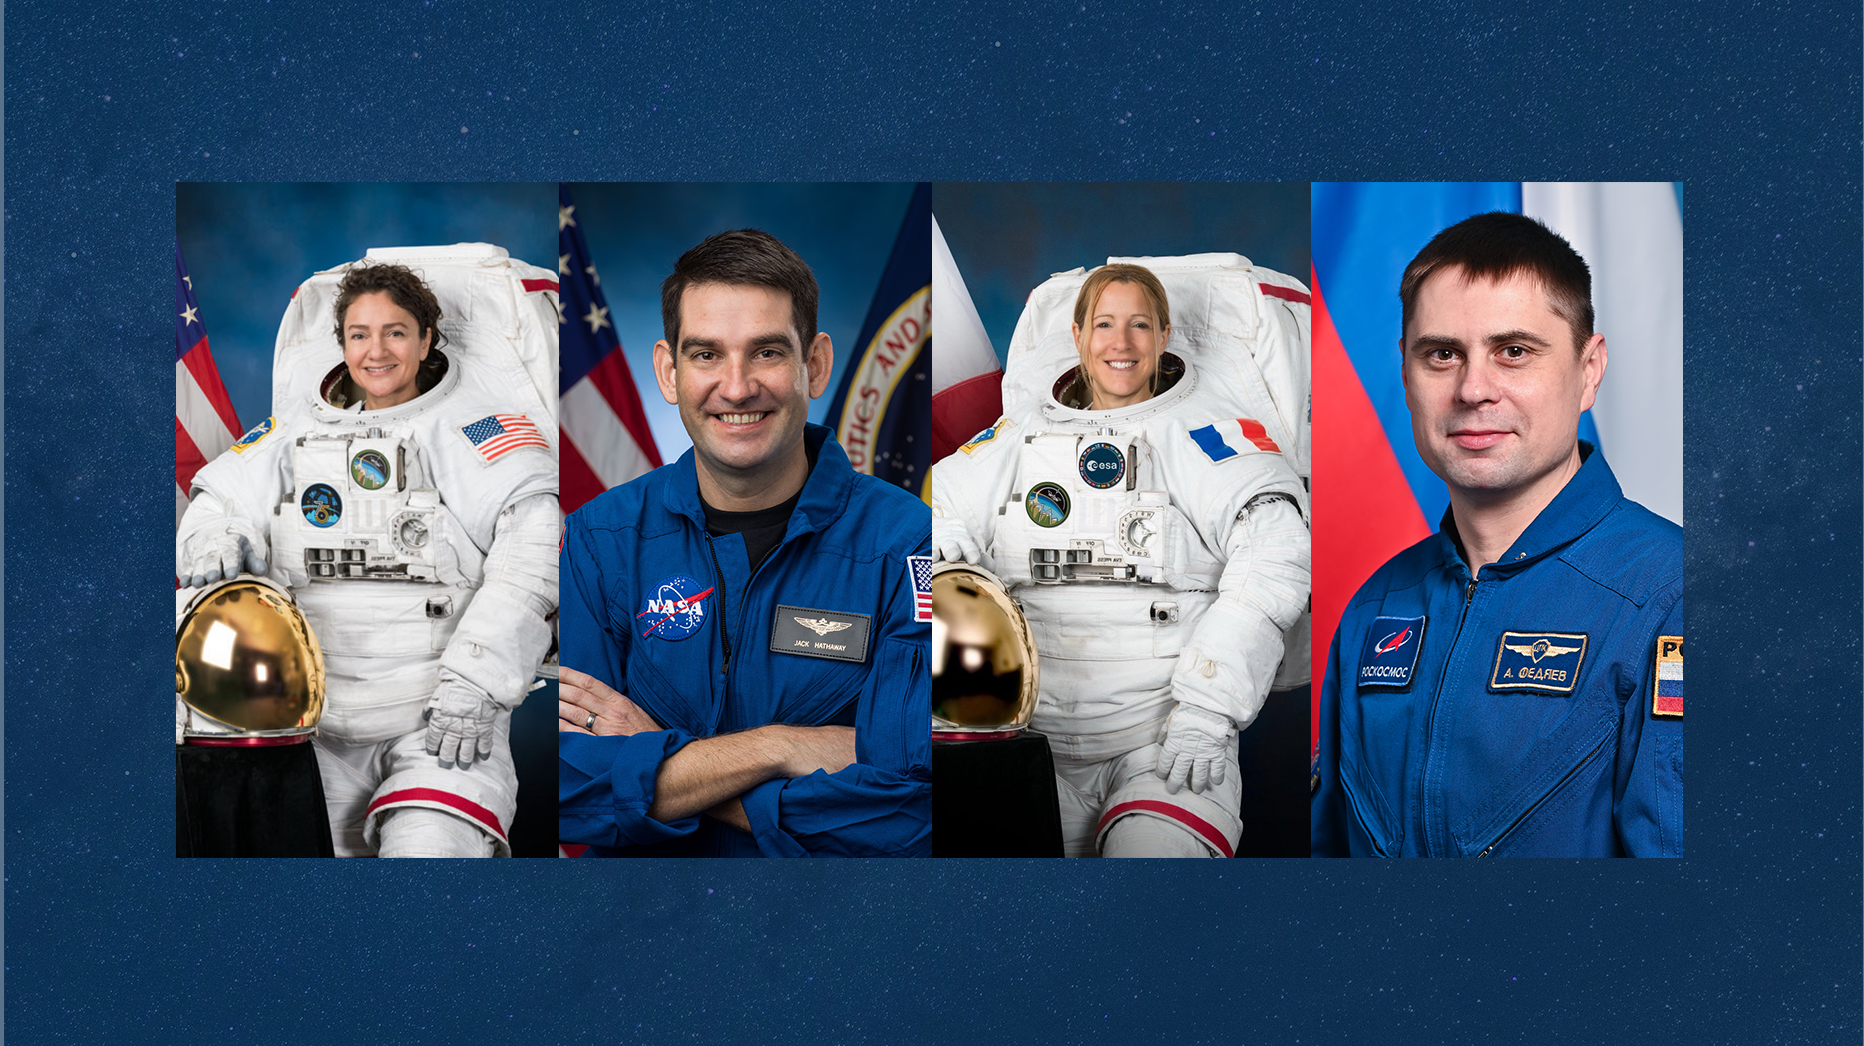
The crew includes NASA astronauts Jessica Meir, commander, Jack Hathaway, pilot; ESA (European Space Agency) astronaut Sophie Adenot, mission specialist; and Roscosmos cosmonaut Andrey Fedyaev, mission specialist. This will be the second spaceflight for Meir and Fedyaev, and the first for Hathaway and Adenot to the orbiting laboratory.
Media accreditation deadlines for the Crew-12 launch as part of NASA’s Commercial Crew Program are as follows:
- International media without U.S. citizenship must apply by 11:59 p.m. EST on Thursday, Jan. 15.
- U.S. media and U.S. citizens representing international media organizations must apply by 11:59 p.m. on Sunday, Jan. 18.
All accreditation requests must be submitted online at:
NASA’s media accreditation policy is online. For questions about accreditation or special logistical requests, email: ksc-media-accreditat@mail.nasa.gov. Requests for space for satellite trucks, tents, or electrical connections are due by Friday, Jan. 23.
For other questions, please contact NASA Kennedy’s newsroom at: 321-867-2468.
Para obtener información sobre cobertura en español en el Centro Espacial Kennedy o si desea solicitar entrevistas en español, comuníquese con Antonia Jaramillo: 321-501-8425, o Messod Bendayan: 256-930-1371.
For launch coverage and more information about the mission, visit:
https://www.nasa.gov/commercialcrew
-end-
Joshua Finch / Jimi Russell
Headquarters, Washington
202-358-1100
joshua.a.finch@nasa.gov / james.j.russell@nasa.gov
Steve Siceloff
Kennedy Space Center, Fla.
321-867-2468
steven.p.siceloff@nasa.gov
Joseph Zakrzewski
Johnson Space Center, Houston
281-483-5111
Joseph.a.zakrzewski@nasa.gov
A Quarter Century in Orbit: Science Shaping Life on Earth and Beyond
For more than 25 years, humans have lived and worked continuously aboard the International Space Station, conducting research that is transforming life on Earth and shaping the future of exploration. From growing food and sequencing DNA to studying disease and simulating Mars missions, every experiment aboard the orbiting laboratory expands our understanding of how humans can thrive beyond Earth while advancing science and technology that benefit people around the world.
Unlocking new cancer therapies from space NASA astronaut Christina Koch works on MicroQuin’s protein crystallization research aboard the International Space Station.NASAThe space station gives scientists a laboratory unlike any on Earth. In microgravity, cells grow in three dimensions, proteins form higher-quality crystals, and biological systems reveal details hidden by gravity. These conditions open new ways to study disease and develop treatments.
Astronauts and researchers have used the orbiting laboratory to observe how cancer cells grow, test drug delivery methods, and examine protein structures linked to diseases such as Parkinson’s and Alzheimer’s. One example is the Angiex Cancer Therapy study, which tested a drug designed to target blood vessels that feed tumors. In microgravity, endothelial cells survive longer and behave more like they do in the human body, giving researchers a clearer view of how the therapy works and whether it is safe before human trials.
Protein crystal growth (PCG) is another major area of cancer-related study. The NanoRacks-PCG Therapeutic Discovery and On-Orbit Crystals investigations have advanced research on leukemia, breast cancer, and skin cancers. Protein crystals grown in microgravity produce larger, better-organized structures that allow scientists to determine fine structural details that guide the design of targeted treatments.
Studies in orbit have also provided insights about cardiovascular health, bone disorders, and how the immune system changes in space—knowledge that informs medicine on Earth and prepares astronauts for long missions in deep space.
By turning space into a research lab, scientists are advancing therapies that benefit people on Earth and laying the foundation for ensuring crew health on future journeys to the Moon and Mars.
Farming for the future NASA astronauts Jessica Watkins and Bob Hines work on the eXposed Root On-Orbit Test System (XROOTS) space botany investigation, which used the station’s Veggie facility to test soilless hydroponic and aeroponic methods to grow plants. The space agricultural study could enable production of crops on a larger scale to sustain crews on future space explorations farther away from Earth.NASA
Feeding astronauts on long-duration missions requires more than packaged meals. It demands sustainable systems that can grow fresh food in space. The Vegetable Production System, known as Veggie, is a garden on the space station designed to test how plants grow in microgravity while adding fresh produce to the crew’s diet and improving well-being in orbit.
To date, Veggie has produced three types of lettuce, Chinese cabbage, mizuna mustard, red Russian kale, and even zinnia flowers. Astronauts have eaten space-grown lettuce, mustard greens, radishes, and chili peppers using Veggie and the Advanced Plant Habitat, a larger, more controlled growth chamber that allows scientists to study crops in greater detail.
These plant experiments pave the way for future lunar and Martian greenhouses by showing how microgravity affects plant development, water and nutrient delivery, and microbial interactions. They also provide immediate benefits for Earth, advancing controlled-environment agriculture and vertical farming techniques that help make food production more efficient and resilient in challenging environments.
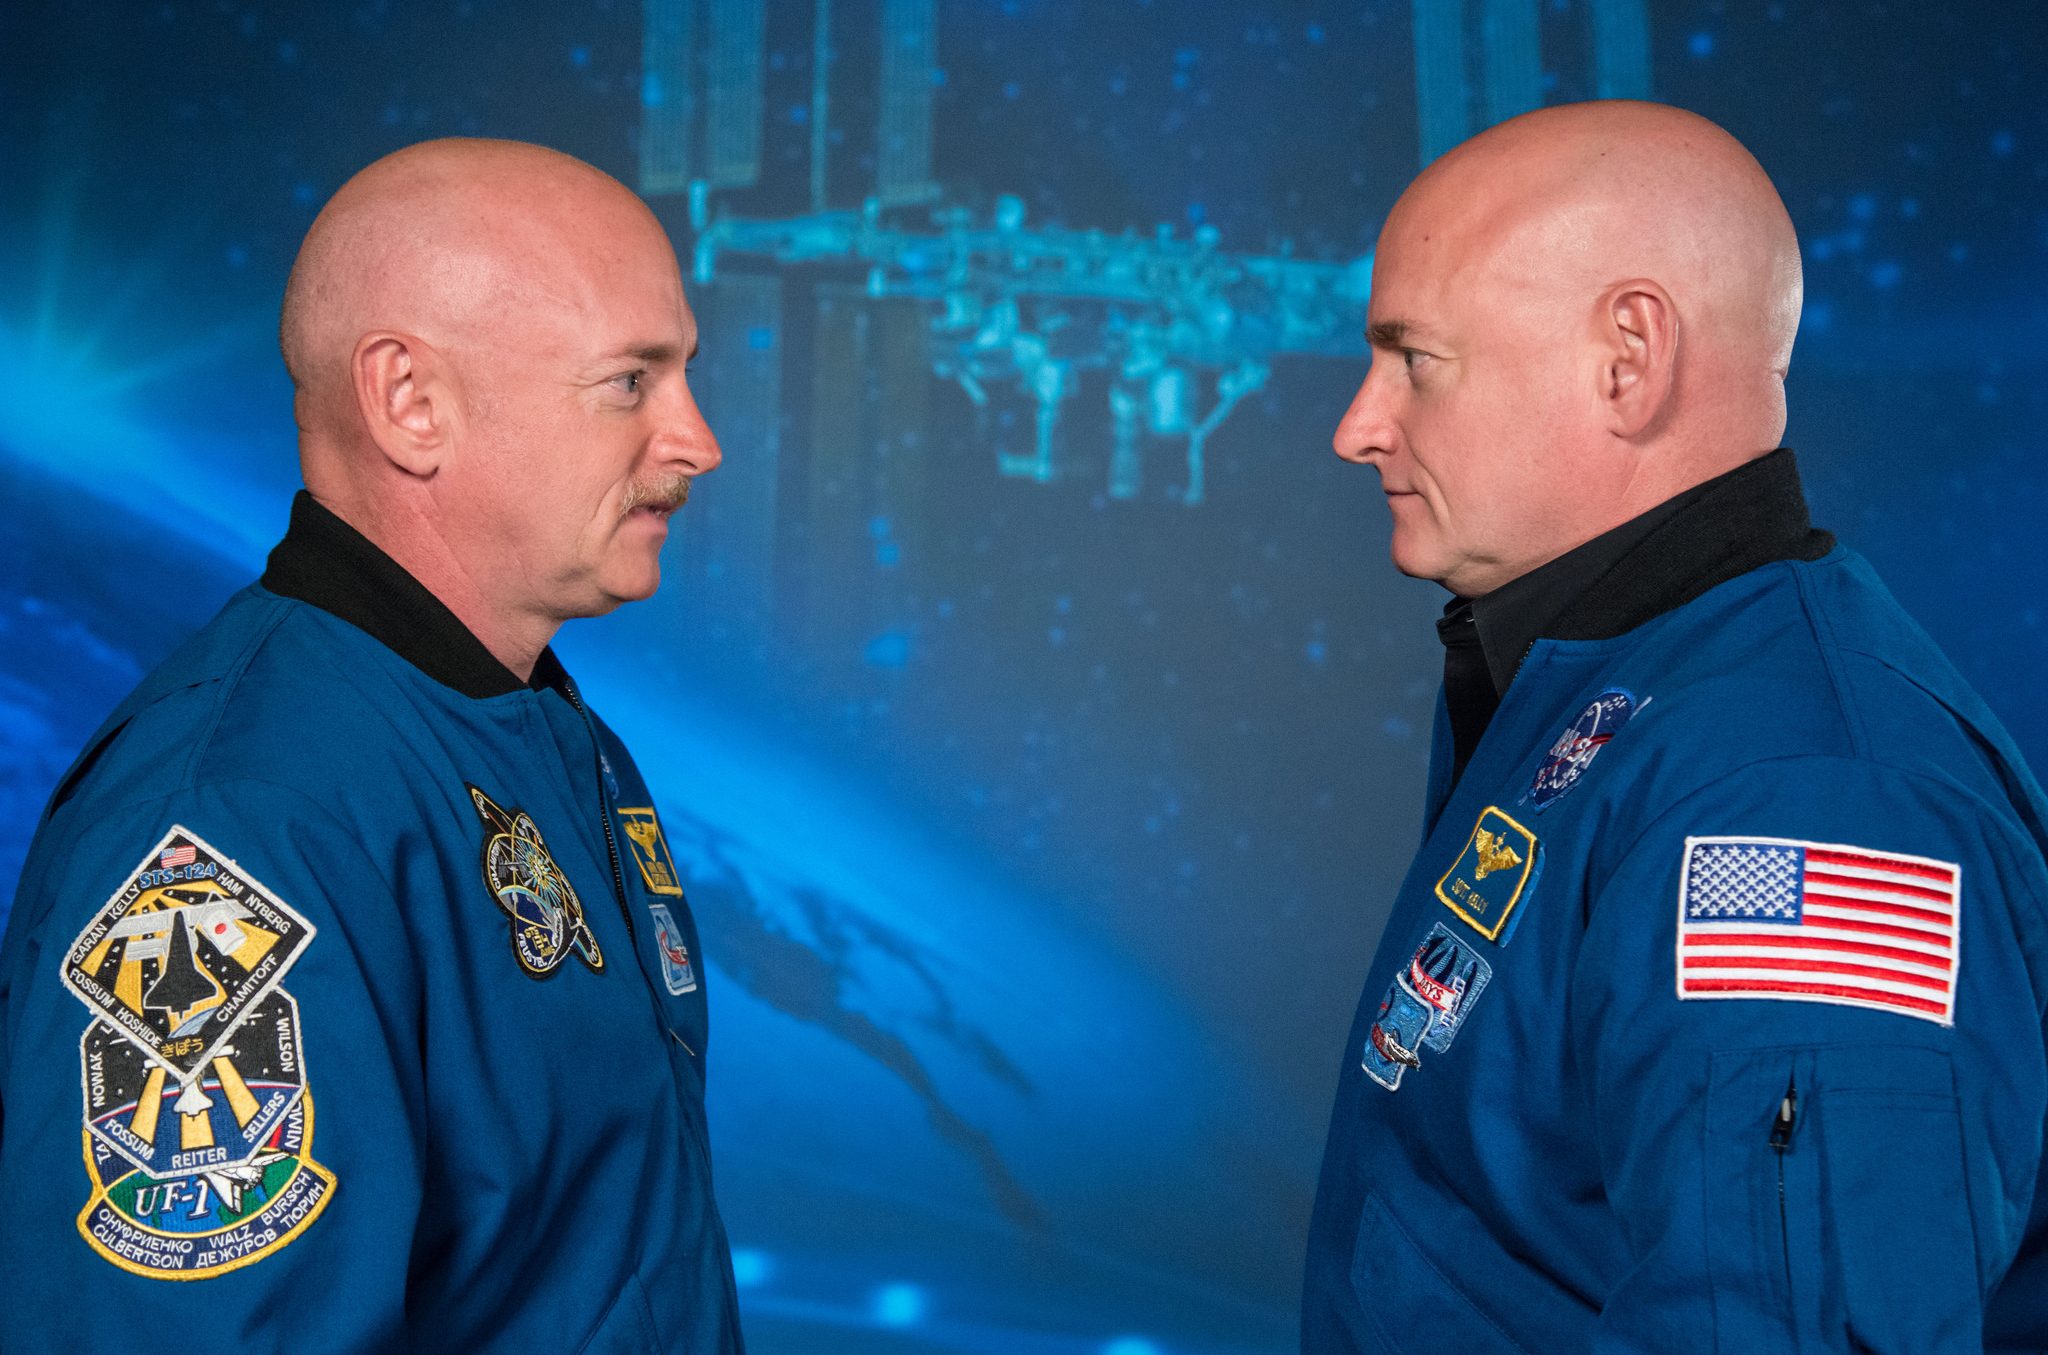
First year-long twin study Mark and Scott Kelly, both former NASA astronauts, are photographed as part of NASA’s Twins Study.NASAUnderstanding how the human body changes in space is critical for planning long-duration missions. NASA’s Twins Study offered an unprecedented opportunity to investigate nature vs. nurture in orbit and on Earth. NASA astronaut Scott Kelly spent nearly a year aboard the space station while his identical twin, retired astronaut Mark Kelly, remained on Earth.
By comparing the twins before, during, and after the mission, researchers examined changes at the genomic, physiological, and behavioral levels in one integrated study. The results showed most changes in Scott’s body returned to baseline after his return, but some persisted—such as shifts in gene expression, telomere length, and immune system responses.
The study provided the most comprehensive molecular view to date of how a human body adapts to spaceflight. Its findings may guide NASA’s Human Research Program for years to come, informing countermeasures for radiation, microgravity, and isolation. The research may have implications for health on Earth as well—from understanding aging and disease to exploring treatments for stress-related disorders and traumatic brain injury.
The Twins Study demonstrated the resilience of the human body in space and continues to shape the medical playbook for the Artemis campaign to the Moon and future journeys to Mars.
Simulating deep space A view inside the sandbox portion of the Crew Health and Performance Analog, where research volunteers participate in simulated walks on the surface of Mars.NASA/Bill StaffordThe space station, which is itself an analog for deep space, complements Earth-based analog research simulating the spaceflight environment. Space station observations, findings, and challenges, inform the research questions and countermeasures scientists explore on Earth.
Such work is currently underway through CHAPEA (Crew Health and Performance Exploration Analog), a mission in which volunteers live and work inside a 1,700-square-foot, 3D-printed Mars habitat for about a year. The first CHAPEA crew completed 378 days in isolation in 2024, testing strategies for maintaining health, growing food, and sustaining morale under delayed communication.
NASA recently launched CHAPEA 2, with a four-person crew who began their 378-day simulated Mars mission at Johnson on October 19, 2025. Building on lessons from the first mission and decades of space station research, they will test new technologies and behavioral countermeasures that will help future explorers thrive during long-duration missions, preparing Artemis astronauts for the journey to the Moon and laying the foundation for the first human expeditions to Mars.
Keeping crews healthy in low Earth orbit NASA astronaut Nick Hague pedals on the Cycle Ergometer with Vibration Isolation and Stabilization (CEVIS), an exercise cycle located aboard the space station’s Destiny laboratory module. CEVIS provides aerobic and cardiovascular conditioning through recumbent or upright cycling activities.NASAStaying healthy is a top priority for all NASA astronauts, but it is particularly important while living and working aboard the orbiting laboratory.
Crews often spend extended periods of time aboard the orbiting laboratory, with the average mission lasting about six months or more. During these long-duration missions, without the continuous load of Earth’s gravity, there are many changes to the human body. Proper nutrition and exercise are some of the ways these effects may be mitigated.
NASA has a team of medical physicians, psychologists, nutritionists, exercise scientists, and other specialized medical personnel who collaborate to ensure astronauts’ health and fitness on the station. These teams are led by a NASA flight surgeon, who regularly monitors each crew member’s health during a mission and individualizes diet and fitness routines to prioritize health and safety while in space.
Crew members are also part of the ongoing health and performance research being conducted to advance understanding of long-term spaceflight’s effects on the human body. That knowledge is applied to any crewed mission and will help prepare humanity to travel farther than ever before, including the Moon and Mars.
Sequencing the future NASA astronaut Kate Rubins checks a sample for air bubbles prior to loading it in the biomolecule sequencer. When Rubins’ expedition began, zero base pairs of DNA had been sequenced in space. Within just a few weeks, she and the Biomolecule Sequencer team had sequenced their one billionth base of DNA aboard the orbiting laboratory.JAXA (Japan Aerospace Exploration Agency)/Takuya OnishiIn 2016, NASA astronaut Kate Rubins made history aboard the orbital outpost as the first person to sequence DNA in space. Using a handheld device called the MinION, she analyzed DNA samples in microgravity, proving that genetic sequencing could be performed in low Earth orbit for the first time.
Her work advanced in-flight molecular diagnostics, long-duration cell culture, and molecular biology techniques such as liquid handling in microgravity.
The ability to sequence DNA aboard the orbiting laboratory allows astronauts and scientists to identify microbes in real time, monitor crew health, and study how living organisms adapt to spaceflight. The same technology now supports medical diagnostics and disease detection in remote or extreme environments on Earth.
This research continues through the Genes in Space program, where students design DNA experiments that fly aboard NASA missions. Each investigation builds on Rubins’ milestone, paving the way for future explorers to diagnose illness, monitor environmental health, and search for signs of life beyond Earth.
Explore the timeline of space-based DNA sequencing.
Explore More 4 min read Susan Schuh: Supporting the Humans in Human Spaceflight Article 2 days ago 1 min read NASA Marshall Removes 2 Historic Test Stands Article 3 days ago 4 min read Shaken, Not Stirred: NASA’s StarBurst Aces Extreme Temperature Tests Article 4 days agoNASA Invites Media to Cover Artemis Mission from Johnson Space Center
Media accreditation is open to attend Artemis II mission activities at NASA’s Johnson Space Center in Houston. Johnson is where flight controllers in mission control will manage the test flight after liftoff of the first crewed Moon mission under the agency’s Artemis campaign.
Targeted to launch no earlier Friday, Feb. 6, the Artemis II mission will send NASA astronauts Reid Wiseman, Victor Glover, Christina Koch, and CSA (Canadian Space Agency) astronaut Jeremy Hansen on an approximately 10-day journey around the Moon and back to test the systems and hardware, which will return humanity to the lunar surface.
After launch day, NASA will host daily briefings at Johnson throughout the mission with agency managers and mission experts. The briefings will be streamed on NASA’s YouTube channel.
International media without U.S. citizenship must apply to cover the mission in person at Johnson by 5 p.m. CST Friday, Jan. 16. U.S. media must apply by Friday, Jan. 30. Media representatives must apply by contacting the NASA Johnson newsroom at jsccommu@mail.nasa.gov. NASA’s media accreditation policy is available online.
Due to high interest, in-person space is limited. Credentialed media will receive a confirmation email if approved. Those who are accredited to attend the Artemis II launch at NASA’s Kennedy Space Center in Florida are not automatically accredited to attend events at Johnson and must receive a separate confirmation for activities in-person at NASA Johnson.
As part of a Golden Age of innovation and exploration, Artemis will pave the way for new U.S.-crewed missions on the lunar surface in preparation to send the first astronauts to Mars.
To learn more about the Artemis II mission, visit:
https://www.nasa.gov/mission/artemis-ii
-end-
Rachel Kraft / Lauren Low
Headquarters, Washington
202-358-1600
rachel.h.kraft@nasa.gov / lauren.e.low@nasa.gov
Chelsey Ballarte
Johnson Space Center, Houston
281-483-5111
chelsey.n.ballarte@nasa.gov
2026 Civil Space Shortfall Ranking
NASA has identified a list of 32 technology shortfalls and invites you to give input on your critical technology needs using this feedback mechanism. Whether you’re part of the space technology community or an interested member of the public, your input is invaluable. By registering and providing your feedback, you could help inform of national space technology priorities. NASA will analyze and aggregate the rankings to produce priority lists for each stakeholder group, which will be made publicly available for continued collaboration.
This prioritization framework will guide the Space Technology Mission Directorate’s evaluation of current development efforts to identify necessary adjustments within its existing portfolios. The shortfall prioritization process may inspire new investments or spark innovative partnerships with stakeholders. This initiative also has the potential to unlock emerging commercial opportunities and accelerate growth in the U.S. space economy.
Understanding and prioritizing the most important and impactful efforts allows STMD to appropriately direct available resources to best support mission needs for NASA and the nation.
Open Date: January 12, 2026
Close Date: February 20, 2026
For more information, visit: https://www.spacetechpriorities.org/
NASA Welcomes Portugal as 60th Artemis Accords Signatory
Portugal is the latest nation to sign the Artemis Accords alongside 59 other countries in a commitment to advancing principles for the responsible exploration of the Moon, Mars, and beyond with NASA.
“Portugal joins a cadre of nations building the framework for safe, transparent, and prosperous activity in space,” said NASA Administrator Jared Isaacman in recorded remarks. “This is our generation’s Golden Age of Exploration. Together, we are advancing innovation, driving international collaboration, and discovering the secrets of the universe.”
Portugal’s Secretary of State for Science and Innovation Helena Canhão signed the Artemis Accords on behalf of the country on Jan. 11.
“2026 is the year in which humans will return to the Moon. It will mark the beginning of a new era of space exploration, reminiscent of the Portuguese explorers of the past, such as Magellan and his circumnavigation of our planet,” said Hugo Costa, executive director of the recently established Portuguese Space Agency, about the signing. “As a nation that approaches space sustainability with great care and responsibility, Portugal and the Portuguese Space Agency are proud to join the Artemis Accords and contribute to the sustainable, beneficial, and peaceful use of space for all humankind.”
A ceremony to recognize the signing was held on Monday in the capital city Lisbon, during a semi-annual meeting between the United States and Portugal to discuss cooperation between the two governments.
“This is a meaningful step forward for responsible space exploration,” said U.S. Ambassador to Portugal John J. Arrigo, who participated in the event. “Shared principles like those in the Artemis Accords are essential to ensuring that space remains a domain of stability, safety, and opportunity for all nations.”
In 2020, during the first Trump Administration, the United States, led by NASA and the U.S. Department of State, joined with seven other founding nations to establish the Artemis Accords, responding to the growing interest in lunar activities by both governments and private companies.
The accords introduced the first set of practical principles aimed at enhancing the safety, transparency, and coordination of civil space exploration on the Moon, Mars, and beyond.
Signing the Artemis Accords means to explore peaceably and transparently, to render aid to those in need, to ensure unrestricted access to scientific data that all of humanity can learn from, to ensure activities do not interfere with those of others, to preserve historically significant sites and artifacts, and to develop best practices for how to conduct space exploration activities for the benefit of all.
More countries are expected to sign the Artemis Accords in the months and years ahead.
Learn more about the Artemis Accords at:
https://www.nasa.gov/artemis-accords
-end-
Bethany Stevens / Elizabeth Shaw
Headquarters, Washington
202-358-1600
bethany.c.stevens@nasa.gov / elizabeth.a.shaw@nasa.gov
NASA Stennis Engineer Proud to Serve During NASA’s Return to the Moon
Richard Wear calls it an honor to be working at NASA’s Stennis Space Center near Bay St. Louis, Mississippi, during a historic time as NASA prepares to send astronauts around the Moon for the first time in more than 50 years on the Artemis II mission.
“I have not stopped learning in the 15 years that I have been here,” Wear said.
As acting chief of the Mechanical Engineering Branch, the Slidell, Louisiana, resident primarily supports testing at the E Test Complex, where NASA and commercial companies carry out propulsion test operations.
The complex features four stands with 12 test cells capable of supporting a range of component and engine test activities. The versatility of the complex infrastructure and test team allows it to support projects for commercial aerospace companies, large and small.
“The unique high pressure systems bring customers from all over the country,” Wear said. “I am proud to have been a part of testing for our commercial partners over the years, some of which have become successful and recognized across the world.”
From Alabama to NASA StennisEducation was always a priority in Wear’s household. His mom taught math, and his dad majored in chemistry. It influenced the Tuscaloosa, Alabama, native’s decision to pursue engineering.
After earning bachelor’s and master’s degrees in mechanical engineering from the University of Alabama, Wear began his career in 2006 at NASA’s Michoud Assembly Facility in New Orleans as a contractor for Lockheed Martin. He worked in the thermal analysis group to support the space shuttle external tank program. His role focused on studying how heat moved through the tank’s structure and its thermal protection systems.
When NASA needed to fill a thermal analysis role at NASA Stennis in 2010, Wear applied and quickly embraced the challenge. Initially hired to focus on thermal analysis, he soon expanded his expertise to include fluid analysis and thermodynamics. Even in his current supervisory role, Wear continues to contribute technical analysis and support testing.
Life at NASA StennisWear describes NASA Stennis as a “hands-on, get-it-done center” with a culture that is serious, yet fun.
As a smaller NASA center, everyone has the chance to make a difference.
Wear believes the work environment provides new employees the opportunity to meet developmental goals faster.
“I think that is also true for our test customers and tenants,” Wear said. “Sometimes with our customers at the E Test Complex, they are just starting out, so we can guide them to a successful outcome by sharing our knowledge. We want all our employees and customers to be successful and I think that really shows.”
The mission-focused culture has shaped Wear’s own career.
Since joining NASA Stennis in 2010 as a junior analyst, he advanced to senior analyst, then lead project fluid systems analyst, before being named thermal-fluid subject matter expert in 2018. In 2022, he accepted the deputy chief position in the Mechanical Engineering Branch and has served as acting chief since March 2025.
Even in a supervisor role, Wear continues to find inspiration in the teamwork around him.
“The focus here is always on the mission, not on whose job it is,” he said. “That true team effort motivates me to do my best every day.”
Advice for Future EngineersOne part of Wear’s role he enjoys is training students. Inspiration came to him during recent interviews with students for the Pathways Internship. The conversations were with several students that have a passion for NASA, its mission, and for space exploration.
“Working hard in school and getting good grades is part of it, but I think persistence and attitude plays a huge part,” Wear said. “For example, we have told our prospective Pathways Interns multiple times that attitude is one of the most important parts of getting a job at NASA Stennis after an internship.”
Wear recommends all students do their research, figure out what he or she does not know, and then find someone who can help fill the gap.
This approach of staying curious and persistent is what put Wear in the right place at the right time as NASA writes a new chapter of space history that will return America to the Moon and beyond.
Learn More About Careers at NASA Stennis Explore More 5 min read A Look Back at NASA Stennis in 2025 Article 4 weeks ago 2 min read NASA Makes Webby 30s List of Most Iconic, Influential on Internet Article 4 months ago 5 min read Crossroads to the Future – NASA Stennis Grows into a Model Federal City Article 4 months agoWhite Dwarf Star (Artist’s Concept)
A smaller white dwarf star (left) pulls material from a larger star into a swirling accretion disk in this artist’s concept released Nov. 19, 2025, to illustrate the first use of NASA’s IXPE (Imaging X-ray Polarization Explorer) to study a white dwarf star.
IXPE spent nearly one week focused on EX Hydrae, a white dwarf star system located in the constellation Hydra, approximately 200 light-years from Earth. Using IXPE’s unique X-ray polarization capability, astronomers examined the star, unlocking the geometry of energetic binary systems.
Read more about EX Hydrae and IXPE.
Image credit: MIT/Jose-Luis Olivares
Últimos preparativos para la primera misión tripulada a la Luna con la campaña Artemis de la NASA
Read this article in English here.
Conforme la NASA se acerca al lanzamiento del vuelo de prueba Artemis II, la agencia pronto llevará por primera vez su cohete Sistema de Lanzamiento Espacial (SLS, por sus siglas en inglés) y la nave espacial Orion a la plataforma de lanzamiento en el Centro Espacial Kennedy de la agencia en Florida para comenzar la integración final, las pruebas y los ensayos para el lanzamiento.
La NASA tiene como objetivo comenzar desde el sábado 17 de enero su traslado desde el Edificio de Ensamblaje de Vehículos hasta la Plataforma de Lanzamientos 39B, lo que tardará varias horas. El viaje de casi 6,5 kilómetros (cuatro millas) en el vehículo transportador oruga 2 podría durar hasta 12 horas. Los equipos técnicos están trabajando día y noche para dar por terminadas todas las tareas antes del transporte del cohete. Sin embargo, esta fecha objetivo está sujeta a cambios si fuera necesario tiempo adicional para los preparativos técnicos o debido a las condiciones meteorológicas.
“Nos estamos acercando a la misión Artemis II, y tenemos su lanzamiento a la vuelta de la esquina”, dijo Lori Glaze, administradora asociada interina para la Dirección de Misiones de Desarrollo de Sistemas de Exploración de la NASA. “Nos quedan pasos importantes en nuestro camino hacia el lanzamiento, y la seguridad de la tripulación seguirá siendo nuestra principal prioridad en todo momento, a medida que nos acercamos al regreso de la humanidad a la Luna”.
Al igual que con todos los nuevos desarrollos de sistemas complejos, los ingenieros han estado solucionando varios problemas en los últimos días y semanas. Durante las comprobaciones finales antes del traslado, los técnicos detectaron que un cable relacionado con el sistema de terminación de vuelo estaba doblado en contra de las especificaciones. El personal técnico lo está reemplazando y hará pruebas con el nuevo cable durante el fin de semana. Además, una válvula relacionada con la presurización de la escotilla de Orion presentó problemas que hicieron necesario llevar a cabo pruebas de demostración de la cuenta regresiva el 20 de diciembre pasado. El 5 de enero, el equipo reemplazó la válvula e hizo pruebas de su funcionamiento que resultaron exitosas. Los ingenieros también trabajaron para resolver fugas en el hardware de soporte en tierra que es necesario para cargar oxígeno gaseoso en Orion a fin de proporcionar aire respirable.
Traslado
Una vez que el cohete y la nave espacial integrados lleguen a la plataforma de lanzamiento, la NASA comenzará inmediatamente una larga lista de verificación para los preparativos en la plataforma de lanzamiento, incluyendo la conexión de equipos mecánicos de apoyo en tierra, como líneas eléctricas, conductos del sistema de control ambiental de combustible y tomas de surtido de combustible criogénico. Los equipos de personal técnico encenderán todos los sistemas integrados en la plataforma por primera vez para garantizar que los componentes del hardware de vuelo funcionen correctamente entre sí, con el lanzador móvil y con los sistemas de infraestructura terrestre.
Una vez que esté todo completado, los astronautas de Artemis II, Reid Wiseman, Victor Glover y Christina Koch de la NASA, y el astronauta de la CSA (Agencia Espacial Canadiense) Jeremy Hansen, llevarán a cabo una caminata final en la plataforma.
Ensayo general con circulación de combustible y llenado de tanques
A finales de enero, la NASA llevará a cabo un ensayo general con circulación de combustible, el cual es una prueba previa al lanzamiento para llenar los tanques de combustible en el cohete. Durante este ensayo general, el personal técnico hace una demostración de la capacidad de cargar más de 700.000 galones de combustible criogénico en el cohete, lleva a cabo una cuenta regresiva para el lanzamiento y practica la extracción segura del combustible del cohete sin tripulación presente en el sitio.
Durante el lanzamiento, el equipo de cierre, o de tareas finales, será responsable de asegurar a los astronautas en Orion y cerrar sus escotillas. El personal de cierre también utilizará este ensayo para practicar sus procedimientos de forma segura sin tener tripulación a bordo de la nave espacial.
El ensayo general con circulación de combustible incluirá varios “encendidos”, o pruebas de funcionamiento, para demostrar la capacidad del equipo de lanzamiento para detener, reanudar y reiniciar operaciones en varios momentos diferentes de los últimos 10 minutos de la cuenta regresiva, conocida como conteo terminal.
La ejecución del primer encendido comenzará aproximadamente en las 49 horas antes del lanzamiento, cuando los equipos encargados de lanzamiento son llamados a sus estaciones, hasta 1 minuto y 30 segundos antes del lanzamiento, seguido de una pausa planificada de tres minutos y luego la reanudación de la cuenta regresiva hasta 33 segundos antes del lanzamiento, el punto en el que el secuenciador de lanzamiento automático del cohete controlará los últimos segundos de la cuenta regresiva. Luego, los equipos técnicos volverán a reiniciar a T-10 minutos y detendrán el conteo, y luego reanudarán los procedimientos hasta 30 segundos antes del lanzamiento como parte de una segunda ejecución.
Si bien la NASA ha integrado las lecciones aprendidas con Artemis I en los procedimientos de la cuenta regresiva para el lanzamiento, la agencia hará una pausa para abordar cualquier problema durante la prueba o en cualquier otro momento si surgen retos técnicos. Los ingenieros vigilarán de cerca la carga de combustible de hidrógeno líquido y oxígeno líquido en el cohete, después de los desafíos que se encontraron con la carga de hidrógeno líquido durante los ensayos generales con circulación de combustible de Artemis I. Los equipos técnicos también prestarán mucha atención a la efectividad de los procedimientos recientemente actualizados para limitar la cantidad de nitrógeno gaseoso que se acumula en el espacio que está entre el módulo de tripulación de Orion y las escotillas del sistema de cancelación de lanzamiento, lo que podría representar un problema para el personal de cierre.
Es posible que se requieran ensayos generales con circulación de combustible adicionales para garantizar que el vehículo esté completamente revisado y apto para el vuelo.
De ser necesario, la NASA podría trasladar al cohete SLS y la nave Orion de vuelta al Edificio de Ensamblaje de Vehículos para realizar trabajos adicionales antes del lanzamiento después del ensayo general con circulación de combustible.
Próximos pasos para el lanzamiento
Después de un exitoso ensayo general con circulación de combustible, la NASA convocará una revisión de aptitud para el vuelo en la cual el equipo de gestión de la misión evaluará la aptitud de todos los sistemas, incluyendo el hardware de vuelo, la infraestructura y el personal de lanzamiento, vuelo y recuperación antes de comprometerse con una fecha de lanzamiento.
Aunque la ventana para el lanzamiento de Artemis II se podría iniciar tan pronto como el viernes 6 de febrero, el equipo de gestión de la misión evaluará la aptitud para el vuelo después del ensayo general con toda la nave espacial, la infraestructura de lanzamiento, y la tripulación y el personal de operaciones antes de seleccionar una fecha para el lanzamiento.
A fin de determinar las posibles fechas de lanzamiento, los ingenieros identificaron las restricciones clave necesarias para cumplir la misión y mantener a salvo a la tripulación dentro de Orion. Los períodos de lanzamiento resultantes son los días o las semanas en los que la nave espacial y el cohete pueden cumplir los objetivos de la misión. Estos períodos de lanzamiento explican la compleja mecánica orbital relacionada con el lanzamiento en una trayectoria precisa hacia la Luna mientras la Tierra rota sobre su eje y la Luna orbita la Tierra cada mes en su ciclo lunar. Esto da como resultado un patrón de alrededor de una semana de oportunidades de lanzamiento, seguido de tres semanas sin oportunidades de lanzamiento.
Existen varios parámetros principales que establecen la disponibilidad del lanzamiento dentro de estos períodos. Debido a su trayectoria única en relación con las misiones de alunizaje posteriores, estas limitaciones clave son exclusivas del vuelo de prueba de la misión Artemis II.
- El día y la hora de lanzamiento deben permitir que SLS pueda llevar a Orion a una órbita terrestre alta, donde la tripulación y los equipos técnicos en tierra evaluarán los sistemas de soporte vital de la nave espacial antes de que la tripulación emprenda su viaje con rumbo a la Luna.
- Orion también debe estar en la alineación adecuada con la Tierra y la Luna en el momento del encendido de motores con inyección translunar. El encendido de motores con inyección translunar de Artemis II pone a Orion en rumbo de sobrevolar la Luna, y también lo pone en una trayectoria de retorno libre, en la cual la nave espacial utiliza la gravedad de la Luna para enviar la nave espacial de regreso a la Tierra sin maniobras adicionales importantes de propulsión.
- La trayectoria para un día determinado debe garantizar que Orion no esté en la oscuridad durante más de 90 minutos a la vez para que las alas de los paneles solares puedan recibir y convertir la luz solar en electricidad, y la nave espacial pueda mantener un rango de temperatura óptimo. Los planificadores de la misión eliminan las posibles fechas de lanzamiento que llevarían a Orion a eclipses prolongados durante el vuelo.
- La fecha de lanzamiento debe sustentar una trayectoria que permita el perfil de entrada adecuado planificado durante el regreso de Orion a la Tierra.
Los períodos a continuación muestran la disponibilidad de llevar a cabo el lanzamiento hasta abril de 2026. Los planificadores de la misión mejoran estos períodos en función de un análisis actualizado más o menos dos meses antes de que estos comiencen, y ellos están sujetos a cambios.
Período de lanzamiento del 31 de enero al 14 de febrero
- Oportunidades de lanzamiento los días 6, 7, 8, 10 y 11 de febrero
Período de lanzamiento del 28 de febrero al 13 de marzo
- Oportunidades de lanzamiento los días 6, 7, 8, 9, 11 de marzo
Período de lanzamiento del 27 de marzo al 10 de abril
- Oportunidades de lanzamiento los días 1, 3, 4, 5, 6 de abril
Además de las oportunidades de lanzamiento basadas en la mecánica orbital y los requisitos de desempeño, también existen restricciones sobre qué días dentro de un período de lanzamiento pueden ser viables en función de la reposición de productos básicos, las condiciones meteorológicas y las operaciones de otros usuarios en el cronograma del Área Este. Como regla general, se pueden hacer hasta cuatro intentos de lanzamiento dentro de la semana aproximada de oportunidades que existen dentro de un período de lanzamiento.
Mientras la agencia se prepara para su primera misión tripulada más allá de la órbita terrestre en más de 50 años, la NASA espera aprender durante los procesos, tanto en tierra como en vuelo, y dejará que la aptitud y el desempeño de sus sistemas indiquen el momento en que la agencia está lista para el lanzamiento.
Como parte de una edad de oro de innovación y exploración, el vuelo de prueba de Artemis II, el cual tendrá una duración aproximada de 10 días, es el primer vuelo tripulado para la campaña Artemis de la NASA. Este es otro paso hacia nuevas misiones tripuladas de Estados Unidos en la superficie de la Luna, lo que llevará a una presencia sostenida en la Luna que ayudará a la agencia a prepararse para enviar a los primeros astronautas estadounidenses a Marte.
Encuentra más información sobre la campaña Artemis de la NASA en el siguiente sitio web (en inglés):
Share Details Last Updated Jan 12, 2026 LocationNASA Headquarters Related TermsComplement-ARIE NAMs Reduction to Practice Challenge
Recent technological advances have set the stage for a renewed focus on human-based solutions called new approach methodologies (NAMs) that can complement, and in some cases replace, animal models in research and regulatory testing. These NAMs generally span advanced cell-tissue-organoid (in vitro), computational modeling (in silico), and cell-free biochemical analysis (in chemico) techniques, with each type of NAM offering different advantages. A combination and integration of multiple NAMs elements into a synergistic approach that augments gaps and/or deficiencies in individual NAMs approaches is a “combinatorial NAM” and could ultimately allow for improved predictions of human clinical response. Although many combinatorial NAMs are still early in development, not validated and standardized, nor available to the market broadly, combinatorial NAMs can potentially transform the way biomedical research, drug development, and clinical trials are conducted. To accelerate development and validation of combinatorial NAMs for human-based scientific and regulatory purposes, the National Institutes of Health (NIH) Common Fund’s Complement-Animal Research In Experimentation (Complement-ARIE) program in collaboration with the Food and Drug Administration (FDA) and Environmental Protection Agency (EPA), is launching the Reduction to Practice (RTP) Challenge. This challenge invites innovative combinatorial NAMs solutions from multidisciplinary teams who can successfully demonstrate implementation of their human-based solution in a practical and usable form within a 3-year period. Solvers will have the chance to win up to $1,430,000 in cumulative cash prizes and have their solution provided validation and/or qualification support by the Complement-ARIE Validation and Qualification Network (VQN). This Challenge is open to the public.
Award: $7,000,000 in total prizes
Open Date: Phase 1 – September 30, 2025, Phase 2 – July 2, 2026; Phase 3 – August 1, 2027
Close Date: Phase 1 – March 1, 2026
For more information, visit: https://www.herox.com/Complement-ARIE-RTP