
NASA - Breaking News
NASA Welcomes Slovakia as New Artemis Accords Signatory
Slovakia signed the Artemis Accords Thursday during a ceremony hosted by NASA Administrator Bill Nelson at the agency’s headquarters in Washington, becoming the 42nd nation to join an international community in a commitment to peaceful, transparent, and responsible exploration of space for the benefit of all.
“NASA welcomes Slovakia as the newest signatory of the Artemis Accords,” said Nelson. “The United States and Slovakia share a deep understanding of the power of exploration. Through this new chapter in our nations’ partnership, we will further this global coalition to explore the cosmos openly, responsibly, in peace.”
Tomáš Drucker, Minister of Education, Research, Development, and Youth signed the Accords on behalf of Slovakia. Sonata Coulter, deputy assistant secretary for the Bureau of European and Eurasian Affairs, U.S. State Department, and Radovan Javorcik, ambassador of the Slovak Republic to the U.S., also participated in the signing ceremony.
“Slovakia perceives the Artemis Accords as a great opportunity for this generation to positively define guidelines and principles for the responsible and sustainable exploration and use of outer space,” said Drucker.
Earlier Thursday, Peru became the 41st country to sign the Artemis Accords. The United States and seven other nations were the first to sign the Artemis Accords in 2020, which identified an early set of principles promoting the beneficial use of space for all humanity. The accords are grounded in the Outer Space Treaty and other agreements including the Registration Convention, the Rescue and Return Agreement, as well as best practices and norms of responsible behavior that NASA and its partners have supported, including the public release of scientific data.
Several accords signatories also met face-to-face for a workshop in May to continue implementing the principles. The commitments of the Artemis Accords, and the efforts by the signatories to advance implementation of these principles, support NASA’s Artemis campaign with its partners, as well as for the success of the safe and sustainable exploration activities of the other Accords signatories.
For more information on the Artemis Accords, visit:
https://www.nasa.gov/artemis-accords
-end-
Faith McKie / Jennifer Dooren
Headquarters, Washington
202-358-1600
faith.d.mckie@nasa.gov / jennifer.m.dooren@nasa.gov
What’s Up: June 2024 Skywatching Tips from NASA
Planets rule the a.m., and what’s that bright light?
Saturn and Mars meet up with the Moon, Jupiter returns at dawn, and tips for identifying some common objects seen in the sky.
Highlights- All month – All the planetary action continues to be in the morning sky, with Saturn and Mars rising in the early morning hours. They are joined later in the month by Jupiter.
- June 2 – In the hour before sunrise, reddish Mars hangs just beneath the crescent Moon. Find the pair low in the east with Saturn lurking nearby, toward the south.
- June 3 – The crescent Moon sits beneath Mars in morning twilight. Look for them low in the eastern sky.
- June 6 – New moon
- June 21 – Full moon
- June 24 – Jupiter is now visible low in the east before sunrise. Look for the bright planet around 10 degrees above the horizon this final week of June, forming a line with Mars and Saturn that stretches toward the south.
- June 27 – Look for the Moon rising in the east with Saturn around midnight. By dawn this morning, you’ll find them high in the southern sky. They appear super close together – close enough to appear in the same field of view through binoculars.
“Planet Parade” note: Some online sources have shared excitement about a “parade of planets” visible in the morning sky in early June (June 3 in particular). In reality, only two of the six planets supposedly on display (Saturn and Mars) will actually be visible. In early June, Jupiter and Mercury will be at or below the horizon in morning twilight and not visible; Uranus and Neptune are far too faint to see without a telescope, especially as the morning sky brightens. The closest thing to a planet parade will be June 29, when Saturn, the Moon, Mars, and Jupiter will line up across the morning sky. This arrangement persists into July, and we’ll talk more about that lineup in the next “What’s Up” video.
Sky chart showing the planets’ Saturn, Mars, and Jupiter forming a diagonal line across the morning sky in late June. TranscriptWhat’s Up for June? Saturn and Mars meet up with the Moon, Jupiter returns at dawn, and tips for identifying some common objects seen in the sky.
On June 2nd in the hour before sunrise, reddish Mars hangs beneath the crescent Moon. Find the pair low in the east with Saturn lurking nearby. The following morning, on June 3rd, the Moon has moved so that it sits beneath Mars.
During the last week of June, giant Jupiter re-emerges as a morning planet, after passing behind the Sun, from our point of view on Earth, over the past couple of months. By June 24th, you can find it about 10 degrees above the horizon as the morning sky begins to brighten. It climbs a little higher each morning after that as July approaches.
Then on June 27th, look for the Moon with Saturn. The pair rise around midnight, and by dawn you’ll find them high in the southern sky. They appear super close together this morning – close enough to appear in the same field of view through binoculars.
Sky chart showing the pre-dawn sky on June 3, with Saturn, Mars, and the crescent Moon. NASA/JPL-CaltechWhen you spot bright or moving objects in the night sky, it might not be immediately clear what you’re looking at. Is that a planet, or just a bright star? Is it a satellite, or maybe just an airplane? Here are a few quick tips on how to tell the difference.
First, there are five planets that are easily observed with the unaided eye. Of these, two planets – Venus and Jupiter – can sometimes appear incredibly bright, like shining beacons in the sky. The other planets are much less bright, but still generally shine as brightly as bright stars.
The big tipoff that you’re looking at a star and not a planet is that planets tend to shine steadily, whereas stars twinkle. Stars are so far away that they’re just points of light,
and ripples in our atmosphere easily distort them, causing the familiar flicker. The planets are relatively closeby, being here in our solar system. Through binoculars or a telescope, instead of a single point, planets show us a tiny disk or crescent that’s illuminated by the Sun. So even though they appear star-like to the eye, the light from a planet is coming from a slightly more spread-out area, making planets appear more constant in brightness. Both planets and stars rise in the east and set in the west, and they move very slowly across the sky during the night.
But what if you see an object that’s moving? Distant aircraft are usually pretty easy to identify, because they follow a slow, steady path that’s straight or gently curving. They have exterior lights that flash in a regular pattern, often including a red beacon.
Satellites tend to be most visible in the hour or so after dark or before dawn, when it’s night here on the surface, but the satellites are high enough in the sky to be illuminated by sunlight. They’re generally fainter than aircraft, and move in slow, very steady, very straight paths. They might briefly flare in brightness, but they don’t have lights that blink.
The International Space Station traces its path across the twilight sky over a California desert landscape. NASA/Preston DychesThe International Space Station is an exception, because it’s very bright, and is often visible for long enough to observe the curving path of its orbit. But it doesn’t have flashing lights you can see from the ground, and it does something else satellites do: Satellites often fade out of view as they travel into Earth’s shadow, or fade into view as they emerge. And occasionally you might see a train of satellites moving slowly and silently in formation.
One other sight that’s sometimes confusing is rocket launches that happen soon after sunset or before sunrise. Similar to spotting satellites, this is when it’s darker here on the ground, but launching rockets climb high enough to be illuminated by sunlight. When rockets launching at these times of day get really high in altitude, their exhaust can be brilliantly illuminated, and sometimes you might even see spiral or circular shapes that slowly grow and then dissipate, as a spent rocket stage empties its propellant into space.
With so much to see in the night sky, it’s helpful to be familiar with some of these common sights, so you can get on with your skywatching and investigate whatever mysteries and wonders you’re in search of.
Here are the phases of the Moon for June.
The phases of the Moon for June 2024. NASA/JPL-CaltechStay up to date on NASA’s missions exploring the solar system and beyond at science.nasa.gov. I’m Preston Dyches from NASA’s Jet Propulsion Laboratory, and that’s What’s Up for this month.
NASA Releases New High-Quality, Near Real-Time Air Quality Data
NASA has made new data available that can provide air pollution observations at unprecedented resolutions – down to the scale of individual neighborhoods. The near real-time data comes from the agency’s TEMPO (Tropospheric Emissions: Monitoring of Pollution) instrument, which launched last year to improve life on Earth by revolutionizing the way scientists observe air quality from space. This new data is available from the Atmospheric Science Data Center at NASA’s Langley Research Center in Hampton, Virginia.
“TEMPO is one of NASA’s Earth observing instruments making giant leaps to improve life on our home planet,” said NASA Administrator Bill Nelson. “NASA and the Biden-Harris Administration are committed to addressing the climate crisis and making climate data more open and available to all. The air we breathe affects everyone, and this new data is revolutionizing the way we track air quality for the benefit of humanity.”
To view this video please enable JavaScript, and consider upgrading to a web browser that supports HTML5 video
The TEMPO instrument measured elevated levels of nitrogen dioxide (NO2) from a number of different areas and emission sources throughout the daytime on March 28, 2024. Yellow, red, purple, and black clusters represent increased levels of pollutants from TEMPO’s data and show drift over time. Credit: Trent Schindler/NASA’s Scientific Visualization StudioThe TEMPO mission gathers hourly daytime scans of the atmosphere over North America from the Atlantic Ocean to the Pacific Coast, and from Mexico City to central Canada. The instrument detects pollution by observing how sunlight is absorbed and scattered by gases and particles in the troposphere, the lowest layer of Earth’s atmosphere.
“All the pollutants that TEMPO is measuring cause health issues,” said Hazem Mahmoud, science lead at NASA Langley’s Atmospheric Science Data Center. “We have more than 500 early adopters using these datasets right away. We expect to see epidemiologists and health experts using this data in the near future. Researchers studying the respiratory system and the impact of these pollutants on people’s health will find TEMPO’s measurements invaluable.”
To view this video please enable JavaScript, and consider upgrading to a web browser that supports HTML5 video
NO2 levels are elevated along major traffic corridors including I-35 in Texas with the highest levels between 9:00 a.m. and 12:00 p.m. Elevated NO2 levels are shown across cities including Houston, Dallas, and San Antonio, with the highest levels persisting across Houston from morning to evening. Credit: Trent Schindler/NASA’s Scientific Visualization StudioAn early adopter program has allowed policymakers and other air quality stakeholders to understand the capabilities and benefits of TEMPO’s measurements. Since October 2023, the TEMPO calibration and validation team has been working to evaluate and improve TEMPO data products.
We have more than 500 early adopters that will be using these datasets right away.hazem mahmoud
NASA Data Scientist
“Data gathered by TEMPO will play an important role in the scientific analysis of pollution,” said Xiong Liu, senior physicist at the Smithsonian Astrophysical Observatory and principal investigator for the mission. “For example, we will be able to conduct studies of rush hour pollution, linkages of diseases and health issues to acute exposure of air pollution, how air pollution disproportionately impacts underserved communities, the potential for improved air quality alerts, the effects of lightning on ozone, and the movement of pollution from forest fires and volcanoes.”
Measurements by TEMPO include air pollutants such as nitrogen dioxide, formaldehyde, and ground-level ozone.
To view this video please enable JavaScript, and consider upgrading to a web browser that supports HTML5 video
High NO2 levels associated with prescribed burns are seen popping up across East Texas, Oklahoma, Louisiana, Arkansas, and Mississippi, beginning around 1:00 p.m. and extending into the evening. Elevated NO2 levels are visible in cities from El Paso to Memphis.Credit: Trent Schindler/NASA’s Scientific Visualization Studio“Poor air quality exacerbates pre-existing health issues, which leads to more hospitalizations,” said Jesse Bell, executive director at the University of Nebraska Medical Center’s Water, Climate, and Health Program. Bell is an early adopter of TEMPO’s data.
Bell noted that there is a lack of air quality data in rural areas since monitoring stations are often hundreds of miles apart. There is also an observable disparity in air quality from neighborhood to neighborhood.
“Low-income communities, on average, have poorer air quality than more affluent communities,” said Bell. “For example, we’ve conducted studies and found that in Douglas County, which surrounds Omaha, the eastern side of the county has higher rates of pediatric asthma hospitalizations. When we identify what populations are going to the hospital at a higher rate than others, it’s communities of color and people with indicators of poverty. Data gathered by TEMPO is going to be incredibly important because you can get better spatial and temporal resolution of air quality across places like Douglas County.”
Determining sources of air pollution can be difficult as smoke from wildfires or pollutants from industry and traffic congestion drift on winds. The TEMPO instrument will make it easier to trace the origin of some pollutants.
To view this video please enable JavaScript, and consider upgrading to a web browser that supports HTML5 video
TEMPO observes the northerly transport of NO2 from the Permian basin, a large oil and natural gas producing area spanning parts of West Texas and southeastern New Mexico, with the highest levels measured during the morning over the basin. NO2 plumes from coal-fired power plants are visible in the rural areas far west and northwest of Houston and far east of Dallas between 8:00 a.m. and 2:00 p.m.Credit: Trent Schindler/NASA’s Scientific Visualization Studio“The National Park Service is using TEMPO data to gain new insight into emerging air quality issues at parks in southeast New Mexico,” explained National Park Service chemist, Barkley Sive. “Oil and gas emissions from the Permian Basin have affected air quality at Carlsbad Caverns and other parks and their surrounding communities. While pollution control strategies have successfully decreased ozone levels across most of the United States, the data helps us understand degrading air quality in the region.”
The TEMPO instrument was built by BAE Systems, Inc., Space & Mission Systems (formerly Ball Aerospace) and flies aboard the Intelsat 40e satellite built by Maxar Technologies. The TEMPO Ground System, including the Instrument Operations Center and the Science Data Processing Center, are operated by the Smithsonian Astrophysical Organization, part of the Center for Astrophysics | Harvard & Smithsonian.
Read MoreTo learn more about TEMPO visit: https://nasa.gov/tempo
Facebook logo @NASA@nasalarc @NASA@NASA_Langley Instagram logo @NASA@NASA_Langley Linkedin logo @NASA@company/nasa-langley-research-center Share Details Last Updated May 31, 2024 Related Terms Explore More 4 min read NASA Mission Flies Over Arctic to Study Sea Ice Melt Causes Article 35 mins ago 5 min read Twin NASA Satellites Ready to Help Gauge Earth’s Energy Balance Article 24 hours ago 2 min read Tech Today: Measuring the Buzz, Hum, and RattleNASA-supported wireless microphone array quickly, cheaply, and accurately maps noise from aircraft, animals, and more.
Article 2 days agoNASA Updates Coverage for Boeing’s Starliner Launch, Docking
NASA will provide live coverage of prelaunch and launch activities for the agency’s Boeing Crew Flight Test, which will carry NASA astronauts Butch Wilmore and Suni Williams to and from the International Space Station.
Launch of the ULA (United Launch Alliance) Atlas V rocket and Boeing Starliner spacecraft is targeted for 12:25 p.m. EDT Saturday, June 1, from Space Launch Complex-41 at Cape Canaveral Space Force Station in Florida. Starliner will dock to the forward-facing port of the station’s Harmony module at approximately 1:50 p.m., Sunday, June 2.
Wilmore and Williams will remain at the space station for about a week to test the Starliner spacecraft and its subsystems before NASA works to complete final certification of the transportation system for rotational missions to the orbiting laboratory as part of the agency’s Commercial Crew Program.
NASA, Boeing, and ULA scrubbed the previous launch opportunity on May 6 due to a suspect oxygen relief valve on the Atlas V rocket’s Centaur second stage. Since, teams have removed and replaced the valve, and completed an assessment of Starliner’s performance and redundancy after discovering a small helium leak in the spacecraft’s service module.
As part of the helium leak investigation, NASA and Boeing conducted a follow-on propulsion system assessment to understand potential helium system impacts to some Starliner return scenarios. NASA also completed a Delta-Agency Flight Test Readiness Review on May 29 to evaluate all work performed and flight rationale before proceeding toward launch.
The deadline for media accreditation for in-person coverage of this launch has passed. The agency’s media credentialing policy is available online. For questions about media accreditation, please email: ksc-media-accreditat@mail.nasa.gov.
NASA’s mission coverage is as follows (all times Eastern and subject to change based on real-time operations):
Friday, May 31
1 p.m. – Prelaunch briefing with the following participants:
- NASA Associate Administrator Jim Free
- Steve Stich, manager, NASA’s Commercial Crew Program
- Dana Weigel, manager, NASA’s International Space Station Program
- NASA astronaut Mike Fincke
- Mark Nappi, vice president and program manager, Commercial Crew Program, Boeing
- Gary Wentz, vice president, Government and Commercial Programs, ULA
- Mark Burger, launch weather officer, 45th Weather Squadron, Cape Canaveral Space Force Station
Coverage of the briefing will stream live on NASA+, NASA Television, the NASA app, YouTube, and the agency’s website.
Media may ask questions in person and via phone. Limited auditorium space will be available for in-person participation. For the dial-in number and passcode, media should contact the newsroom at NASA’s Kennedy Space Center in Florida no later than one hour before the start of the event at ksc-newsroom@mail.nasa.gov.
Saturday, June 1
8:15 a.m. – Launch coverage begins on NASA+, NASA Television, the NASA app, YouTube, and the agency’s website.
12:25 p.m. – Launch
Launch coverage on NASA+ will end shortly after Starliner orbital insertion. NASA Television will provide continuous coverage leading up to docking and through hatch opening and welcome remarks.
2 p.m. – Postlaunch news conference with the following participants:
- NASA Administrator Bill Nelson
- Ken Bowersox, associate administrator, NASA’s Space Operations Mission Directorate
- Steve Stich, manager, NASA’s Commercial Crew Program
- Dana Weigel, manager, NASA’s International Space Station Program
- Mark Nappi, vice president and program manager, Commercial Crew Program, Boeing
- Tory Bruno, president and CEO, ULA
Coverage of the postlaunch news conference will air live on NASA+, NASA Television, the NASA app, YouTube, and the agency’s website.
Media may ask questions in person and via phone. Limited auditorium space will be available for in-person participation. For the dial-in number and passcode, media should contact the Kennedy newsroom no later than three hours before the start of the event at ksc-newsroom@mail.nasa.gov.
NASA+ will resume coverage and NASA Television’s public channel will break from in-orbit coverage to carry the postlaunch news conference. Mission operational coverage will continue on NASA Television’s media channel and the agency’s website. Once the postlaunch news conference is complete, NASA+ coverage will end, and mission coverage will continue on both NASA channels.
Sunday, June 2
11:15 a.m. – Arrival coverage resumes on NASA+, the NASA app, and YouTube, and continues on NASA Television and the agency’s website.
1:50 p.m. – Targeted docking to the forward-facing port of the station’s Harmony module
3:35 p.m. – Hatch opening
3:55 p.m. – Welcome remarks
5 p.m. – Post-docking news conference at NASA’s Johnson Space Center with the following participants:
- NASA Associate Administrator Jim Free
- Steve Stich, manager, NASA’s Commercial Crew Program
- Dana Weigel, manager, NASA’s International Space Station Program
- Mark Nappi, vice president and program manager, Commercial Crew Program, Boeing
Coverage of the post-docking news conference will air live on NASA+, NASA Television, the NASA app, YouTube, and the agency’s website.
All times are estimates and could be adjusted based on operations after launch. Follow the space station blog for the most up-to-date operations information.
Audio Only Coverage
Audio only of the news conferences and launch coverage will be carried on the NASA “V” circuits, which may be accessed by dialing 321-867-1220, -1240 or -7135. On launch day, “mission audio,” countdown activities without NASA Television launch commentary, will be carried on 321-867-7135.
Launch audio also will be available on Launch Information Service and Amateur Television System’s VHF radio frequency 146.940 MHz and KSC Amateur Radio Club’s UHF radio frequency 444.925 MHz, FM mode, heard within Brevard County on the Space Coast.
Live Video Coverage Prior to Launch
NASA will provide a live video feed of Space Launch Complex-41 approximately 48 hours prior to the planned liftoff of the mission. Pending unlikely technical issues, the feed will be uninterrupted until the prelaunch broadcast begins on NASA Television, approximately four hours prior to launch. Once the feed is live, find it on NASA Kennedy’s YouTube: http://youtube.com/kscnewsroom.
NASA Website Launch Coverage
Launch day coverage of the mission will be available on the agency’s website. Coverage will include live streaming and blog updates beginning no earlier than 8:15 a.m., June 1, as the countdown milestones occur. On-demand streaming video and photos of the launch will be available shortly after liftoff.
For questions about countdown coverage, contact the Kennedy newsroom at 321-867-2468. Follow countdown coverage on the commercial crew or the Crew Flight Test blog.
Attend Launch Virtually
Members of the public can register to attend this launch virtually. NASA’s virtual guest program for this mission also includes curated launch resources, notifications about related opportunities or changes, and a stamp for the NASA virtual guest passport following launch.
Watch, Engage on Social Media
Let people know you’re following the mission on X, Facebook, and Instagram by using the hashtags #Starliner and #NASASocial. You can also stay connected by following and tagging these accounts:
X: @NASA, @NASAKennedy, @NASASocial, @Space_Station, @ISS_Research, @ISS National Lab, @BoeingSpace, @Commercial_Crew
Facebook: NASA, NASAKennedy, ISS, ISS National Lab
Instagram: @NASA, @NASAKennedy, @ISS, @ISSNationalLab
Coverage en Espanol
Did you know NASA has a Spanish section called NASA en Espanol? Check out NASA en Espanol on X, Instagram, Facebook, and YouTube for additional mission coverage.
Para obtener información sobre cobertura en español en el Centro Espacial Kennedy o si desea solicitar entrevistas en español, comuníquese con Antonia Jaramillo: 321-501-8425;antonia.jaramillobotero@nasa.gov.
NASA’s Commercial Crew Program has delivered on its goal of safe, reliable, and cost-effective transportation to and from the International Space Station from the United States through a partnership with American private industry. This partnership is changing the arc of human spaceflight history by opening access to low-Earth orbit and the International Space Station to more people, science, and commercial opportunities. The space station remains the springboard to NASA’s next great leap in space exploration, including future missions to the Moon and, eventually, to Mars.
For NASA’s launch blog and more information about the mission, visit:
https://www.nasa.gov/commercialcrew
-end-
Jimi Russell / Claire O’Shea
Headquarters, Washington
202-358-1100
james.j.russell@nasa.gov / claire.a.o’shea@nasa.gov
Steven Siceloff / Danielle Sempsrott / Stephanie Plucinsky
Kennedy Space Center, Florida
321-867-2468
steven.p.siceloff@nasa.gov / danielle.c.sempsrott@nasa.gov / stephanie.n.plucinsky@nasa.gov
Leah Cheshier
Johnson Space Center, Houston
281-483-5111
leah.d.cheshier@nasa.gov
The Moon and Amaey Shah
NASA/JPL-Caltech
Sometimes a story about a NASA volunteer just grabs your heart and won’t let go. NASA Scientist Dr. Brian Day shared with us the incredible story of what first ignited his passion for involving the public in his scientific research. It’s a story about a boy named Amaey Shah.
Amaey Shah’s passion for science helped inspire NASA’s MoonDiff Project. Credit: Purvi Shah“Through the NASA Speakers Bureau, I was paired with a local teacher, Leslie Herleikson, and her after-school science program for K-12 students” Brian began. “I’d talk to the students in the program periodically and take them on tours of the NASA Ames facilities.”
“One of the kids in Leslie’s elementary program, a young boy named Amaey Shah, was recovering from treatment for childhood leukemia when I first met him. He was feeling fatigued from the treatment. As we did the tours of Ames he sometimes had to rest. But he was a very precocious kid. He remained very excited about science, posing a rapid stream of very insightful questions, and always full of joyous enthusiasm for the new things that he would learn.
Over time, Amaey rallied and his strength improved, fueled by his insatiable curiosity. I continued to meet with Amaey and his fellow students, with our discussions spanning the Solar System and beyond.
Then, one day, I showed up at the after-school program and Amaey was not there. Leslie took me aside after my presentation and let me know that Amaey had had a relapse which seemed pretty serious. He was going to need a bone marrow transplant. This news hit me especially hard. Shortly before the class meeting, I had been diagnosed with cancer myself. Just as Amaey was going to be heading in for whole body radiation as part of his bone marrow transplant, I was going to be going in for radiation for my own cancer treatment.
Leslie shared my situation with Amaey and his parents. She also asked if I would be willing to come talk with him about our upcoming shared experience. The idea seemed strangely comforting and healthy. So I showed up at his house. Amaey and I sat down together, with his parents and older brother sitting off to the side in the same room.
I said: Well, I understand we have something in common.
He said, Well, we both like science!
I said: That’s true.
He said: And we both wear glasses.
I said: Yes.
Then, I said: And we’re both incredibly handsome!
We all had a good laugh. But then he looked at me and got serious.
He said: And we both have cancer.
I said: Yes, and we’re both going to get radiation.
And he said: Yeah.
So I said: How do we feel about that?
He told me what was bothering him most. He said that in his case, the radiation was to kill all of his bone marrow, and hopefully the cancer that was within it. Then he would get a transplant of new bone marrow. But during the period of time in between losing his old bone marrow and when his new bone marrow kicked in, he would essentially be without an immune system. He would become a bubble boy—confined to a room for a very long period of time. He expressed that he was really going to miss going out and exploring, going out and looking up at the night sky, because one of the things he really, really wanted to do was explore space.
I’d been given a warning about this from his parents, so I’d come prepared with my laptop. I pulled up MoonZoo. MoonZoo was a citizen science application that asked people to look at pieces of lunar real estate and identify and count craters. Crater counts are the primary way of estimating the ages of various lunar terrains. If we want to understand the history and evolution of the lunar surface, getting these crater counts and the ages they represent is a really critical endeavor.
Amaey was quite excited to work on MoonZoo. We played with that for a long while! Then I pulled up GalaxyZoo, another Zooniverse project.
We reviewed the fact that galaxies come in a great variety of sizes and shapes. And we see a mind-bending number of galaxies out there. To understand their formation and evolution, we must first understand what kinds of galaxies they are. So, we need people to help classify these galaxies—which involves looking at a lot of galaxies. Amaey really liked that too.
We went into our respective cancer treatments. Amaey did indeed become confined in isolation after his irradiation and transplant—but I heard from his teacher Leslie that from his room he was keeping himself busy exploring the Moon, counting craters with MoonZoo, and classifying galaxies with GalaxyZoo. Even though Amaey was physically confined to his room, his intellect and curiosity were free to roam the Solar System and the Universe, exploring limitless expanses, thanks to the citizen science tools that he put to such good use. Soon, I got distracted with my own treatment, and I wasn’t online as much as I would have liked to have been.
Amaey with his brother Arjun. Credit: Purvi ShahAs I was going through my own treatment, I didn’t get the news. Amaey’s treatment didn’t work. His parents and teachers opted not to tell me that he had passed away while I was in the midst of fighting my own battle.
The day after I successfully finished my final radiation treatment, I remember talking to Leslie on the phone. I told her that I was done, and I wanted to come talk to the kids again as soon as I was feeling a bit stronger. She said she had something to tell me. She let me know that Amaey had passed away. I was devastated.
Leslie also told me that Amaey’s funeral service was coming up soon. Amaey’s parents then contacted me, asking me if I might be feeling well enough to come speak at the service. I had to go. There was no way I could not be there!
There were many people gathered together at the service and several speakers. At one point, Amaey’s grandfather got up and in a quiet, sorrowful way, explained how Amaey’s desire had always been to be a scientist. Amaey had wanted to study the stars, do research, and contribute. One of the great sadnesses of the grandfather’s own life was that Amaey never had the opportunity to become a scientist, to explore the Universe, and to contribute to the science like he had so loved.
Then it was my turn to speak. I stood up, and I said that I mean no disrespect—I fully understood the sorrow that the family was feeling. But the very important fact of the matter was that Amaey did not miss this opportunity! Amaey HAD realized his dream. He DID become a scientist. From his isolation room, Amaey DID explore. He DID do research. He DID make contributions. Amaey’s ambitions had been realized, and his discoveries had been added to the scientific record.
I said we can all take heart in knowing that under very difficult circumstances Amaey had achieved his dream. That seemed to become a source of comfort to Amaey’s family. And that’s because he stepped up to the role and adventure of being a citizen scientist.”
Brian Day is the staff scientist at NASA’s Solar System Exploration Research Virtual Institute, headquartered at NASA’s Ames Research Center in California. His duties include serving as science lead for NASA’s Solar System Treks Project a family of open science online portals that make it easy to analyze the surfaces of the Moon and other planetary bodies in our Solar System. The project has a citizen science component called MoonDiff, which invites you to help search for changes and newly formed features on the Moon.
You can make your own contributions to science! Check out Brian’s project, MoonDiff. And if you know any other children like Amaey, please share it with them.
Share Details Last Updated May 30, 2024 Related Terms Explore More 2 min read Arizona Students Go on an Exoplanet WatchArticle
2 days ago
4 min read NASA’s OSIRIS-APEX Unscathed After Searing Pass of Sun
Article
2 days ago
2 min read Aurorasaurus Roars During Historic Solar Storm
The largest geomagnetic storm in 21 years lit up the sky last weekend, and NASA’s volunteers were ready.…
Article
1 week ago
Webb Spots a Starburst
The James Webb Space Telescope observed “starburst” galaxy NGC 4449, seen in this image released on May 29, 2024. Starbursts are intense periods of star formation usually concentrated at a galaxy’s core, but NGC 4449’s activity is much more widespread — likely due to past interactions with its galactic neighbors. Astronomers can study this galaxy to look into the past: NGC 4449 is similar to early star-forming galaxies, which also grew by merging with other systems.
See more Webb images from this year.
Image Credit: ESA/Webb, NASA & CSA, A. Adamo (Stockholm University) and the FEAST JWST team
NASA Welcomes Peru as 41st Artemis Accords Signatory
NASA Administrator Bill Nelson welcomed Peru as the newest nation to sign the Artemis Accords Thursday during a ceremony with the U.S. State Department at NASA Headquarters in Washington. Peru joins 40 other countries in a commitment to advancing principles for the safe, transparent, and responsible exploration of the Moon, Mars and beyond.
“NASA is proud to welcome Peru to the Artemis Accords family,” said Nelson. “This giant leap forward for our countries is a result of decades of work Peru has done to further its reach in the cosmos. We live in the golden era of space exploration. Together, we will continue to explore the cosmos openly, responsibly, as partners, for all.”
Javier González-Olaechea, foreign minister, signed the Artemis Accords on behalf of Peru. Alfredo Ferrero Diez Canseco, ambassador of Peru to the U.S. and Jennifer R. Littlejohn, acting assistant secretary, Bureau of Oceans and International Environmental and Scientific Affairs, Department of State, also participated in the signing ceremony.
“Peru, by joining the Artemis Accords, seeks not only to express a common vision with the other member countries but also to establish cooperation mechanisms with these countries, especially with the United States, to participate in activities of exploration and sustainable use of resources found in space, as well as to promote aerospace scientific development in our country,” said González-Olaechea.
The United States and seven other nations were the first to sign the Artemis Accords in 2020, which identified an early set of principles promoting the beneficial use of space for all humanity. The accords are grounded in the Outer Space Treaty and other agreements including the Registration Convention, the Rescue and Return Agreement, as well as best practices and norms of responsible behavior that NASA and its partners have supported, including the public release of scientific data. More countries are expected to sign the Artemis Accords in the months and years to come.
The commitments of the Artemis Accords, and efforts by the signatories to advance implementation of these principles, support NASA’s Artemis campaign with its partners, as well as for the success of the safe and sustainable exploration activities of the other accords signatories.
For more information about the Artemis Accords, visit:
https://www.nasa.gov/artemis-accords/
-end-
Faith McKie / Jennifer Dooren
Headquarters, Washington
202-358-1600
faith.d.mckie@nasa.gov / jennifer.m.dooren@nasa.gov
Travel
The NSSC provides travel reimbursement services for all authorized Agency travel including: domestic, foreign, local, ETDY, and Change of Station (COS).
Federal Travel Regulations (FTR)
Traveler Extended TDY and Taxes
Domestic Per Diem Rates
Foreign Per Diem Rates
NSSC Travel now has another way that a transferee Traveler may submit his or her vouchers. Please see, submitting Change of Station Process Steps
If traveling CONUS, review: NASA’s Guide to a Successful Move (CONUS)
If traveling OCONUS, review: NASA’s Guide to a Successful Move (OCONUS)
Change of Station References
Change of Station Voucher Information And Samples
GSA Smart Pay State Tax Information
Change of Station ServiceNow Instructions
Change of Station Forms
SF 1038 Advance of Funds Application and Account
NASA Form 1815 Tax Exemption Certificate (Tax on Occupancy of Hotel Rooms)
NF420 Service Agreement-First Duty Station Appointment
NF513 Service Agreement and Duplicate Reimbursement Disclosure Statement OCONUS Employment
NF1204 Employee’s Claim for Damage to, or Loss of, Personal Property Incident to Service
NF1337 Service Agreement-Transferred Employee
NF1449C CONUS-Information Covering Persons Transferred or Appointed to First Duty Station
NF1449O OCONUS-Information Covering Persons Transferred or Appointed to First Duty Station
NF1450C CONUS Change of Station Authorization
NF1450O OCONUS Change of Station Authorization
NF1807 Househunting Trip Binding Decision
NF1808 Property Management Binding Decision
NF1809 Temporary Quarters Subsistence Expenses (TQSE) Binding Decision
NF1810 Employee Agreement to Repay Withholding Tax Allowance (WTA)
NF 1811 Temporary Quarters Subsistence Allowance (TQSA)
NF1812 Temporary Quarters Subsistence Allowance (TQSA) Preceding Final Departure
NF1813 Temporary Change of Station (TCS) Duplicate Reimbursement Disclosure Statement
NF1814 Temporary Quarters Subsistence Allowance (TQSA) Predeparture Binding Decision
Related Tax Information:
Check out the latest Taxability Change Notice for Change of Station travelers.
To learn more, see: Relocation Income Tax Allowance Information
POV Mileage for NASA Travelers
For Privately Owned Vehicle (POV) Mileage Reimbursement Rates for TDY and ETDY Travel please refer to the GSA Web site: http://www.gsa.gov/mileage
NASA Domestic Travel: Day that Travel Ends
For the day travel ends (the day a traveler returns to the PDS, home, or other authorized point), the per diem allowance is 75% of M&IE.
NASA Domestic Travel Rental Car Liability
When making a reservation for a rental car, please remember the Government is only responsible to pay for rental car charges for official travel time. If a traveler decides to take annual leave in conjunction with official travel and keeps the rental car during annual leave, the portion of the rental rate applicable to annual leave is the responsibility of the traveler. Please refer to 41 CFR 301-10.453
What is my liability for unauthorized use of a rental automobile obtained with Government funds?
You are responsible for any additional cost resulting from the unauthorized use of a commercial rental automobile for other than official travel-related purposes.
NASA Domestic Travel: Tax Exemption
Prior to traveling, refer to the GSA State Tax Information webpage: https://smartpay.gsa.gov/smarttax. Select your State/US territory of interest to see the exemption status and download the appropriate form, if required.
Extended Temporary Duty (ETDY)Reduced Per Diem rate
NASA’s standard reduced per diem rate for ETDY travel is 65 percent under the current policy as defined in the NASA Procedural Requirements (NPR) 9750.1-3.1.2.
a. Consistent with 41 CFR 301-11.200, an ETDY authorization can include reasonable further reductions from this standard rate or limitations on approved lodging for unique circumstances, to the extent it can be determined in advance that such will substantially lower costs without mission impact. For example, if lodging is obtained at 50 percent per diem, the ETDY authorization should be adjusted to authorize a lower rate.
b. The reduced rate of reimbursement begins on the first day of travel regardless of the mode of transportation, except as noted in 3.1.3. Allowances are covered by the reduced per diem rate; therefore, NASA will authorize the employee a per diem rate (up to 65 percent) to reasonably cover expenses for a one bedroom furnished apartment. For ETDY greater than 90 days, first consideration should be given to long-term lodging facilities. Long-term lodging facilities are available on the GSA schedule at http://www.gsa.gov. If a long-term facility is not selected, proper justification should be provided.
Find more about Allowable ETDY Expenses Included in Reduced Per Diem Rate, please see the following document:
Allowable ETDY Expenses Included in Reduced Per Diem Rate
GSA Long-term Lodging (Schedule 48)
GSA’s Schedule 48 is designed for lodging needs of 30 days or more. This program provides housing accommodations for temporary or permanent relocation. Typical facilities include apartment or condominium type properties that may be furnished with all the amenities of a regular home. The current list of vendors is available by clicking on the link above. Most of these properties will accommodate NASA Extended TDY travelers within the 65% reduce per diem rate and will allow use of the government charge card.
Foreign TravelPlease consult the Code of Federal Regulations (CFR), NPR 9710.1, and NPR 9750.1. Please call the NSSC Contact Center at 1-877-NSSC-123 (1-877-677-2123) for additional information.
Twin NASA Satellites Ready to Help Gauge Earth’s Energy Balance
5 min read
Preparations for Next Moonwalk Simulations Underway (and Underwater) Earth’s polar regions radiates much of the heat initially absorbed at the tropics out to space, mostly in the form of far-infrared radiation. Clouds in the Arctic — like these seen over a Greenland glacier — and Antarctic can trap far-infrared radiation on Earth, increasing global temperatures.NASA/GSFC/Michael StudingerInformation from the PREFIRE mission will illuminate how clouds and water vapor in the Arctic and Antarctic influence the amount of heat the poles radiate into space.
A pair of new shoebox-size NASA satellites will help unravel an atmospheric mystery that’s bedeviled scientists for years: how the behavior of clouds and water vapor at Earth’s polar regions affects our planet’s climate.
The first CubeSat in NASA’s Polar Radiant Energy in the Far-InfraRed Experiment (PREFIRE) mission launched from New Zealand on Saturday, May 25. The second PREFIRE CubeSat is targeted to lift off on Saturday, June 1, with a launch window opening at 3 p.m. NZST (11 p.m. EDT, Friday, May 31).
The mission will measure the amount of heat Earth emits into space from the two coldest, most remote regions on the planet. Data from PREFIRE will improve computer models that researchers use to predict how Earth’s ice, seas, and weather will change in a warming world.
This video gives an overview of the PREFIRE mission, which aims to improve global climate change predictions by expanding scientists’ understanding of heat radiated from Earth at the polar regions. NASA/JPL-CaltechEarth absorbs a lot of the Sun’s energy in the tropics, and weather and ocean currents transport that heat toward the poles (which receive much less sunlight). Ice, snow, and clouds, among other parts of the polar environment, emit some of that heat into space, much of it in the form of far-infrared radiation. The difference between the amount of heat Earth absorbs at the tropics and that radiated out from the Arctic and Antarctic is a key influence on the planet’s temperature, helping to drive dynamic systems of climate and weather.
But far-infrared emissions at the poles have never been systematically measured. This is where PREFIRE comes in. The mission will help researchers gain a clearer understanding of when and where Earth’s polar regions emit far-infrared radiation to space, as well as how atmospheric water vapor and clouds influence the amount that escapes.
One of the two shoebox-size CubeSats that make up NASA’s PREFIRE mission sits on a table at Blue Canyon Technologies. The company built the satellite bus and integrated the JPL-provided thermal infrared spectrometer instrument.NASA/JPL-CaltechClouds and water vapor can trap far-infrared radiation on Earth, thereby increasing global temperatures — part of the greenhouse effect.
“It’s critical that we get the effects of clouds right if we want to accurately model Earth’s climate,” said Tristan L’Ecuyer, a professor at the University of Wisconsin-Madison and PREFIRE’s principal investigator.
Clouds in Climate ModelingClouds and water vapor at Earth’s poles act like windows on a summer day: A clear, relatively dry day in the Arctic is like opening a window to let heat out of a stuffy room. A cloudy, relatively humid day traps heat like a closed window.
The types of clouds — and the altitude at which they form — influence how much heat the polar atmosphere retains. Like a tinted window, low-altitude clouds, composed mainly of water droplets, tend to have a cooling effect. High-altitude clouds, made mainly of ice particles, more readily absorb heat, generating a warming effect. Because clouds at mid-altitudes can have varying water-droplet and ice-particle contents, they can have either a warming or cooling effect.
But clouds are notoriously difficult to study: They’re made up of microscopic particles that can move and change in a matter of seconds to hours. When it rains or snows, there’s a great reshuffling of water and energy that can alter the character of clouds entirely. These ever-changing factors complicate the task of realistically capturing cloud behavior in climate models, which try to project global climate scenarios.
Inconsistencies in how various climate models represent clouds can mean the difference between predicting 5 or 10 degrees Fahrenheit (3 or 6 degrees Celsius) of warming. The PREFIRE mission aims to reduce that uncertainty.
The thermal infrared spectrometer on each spacecraft will make crucial measurements of wavelengths of light in the far-infrared range. The instruments will be able to detect clouds largely invisible to other types of optical instruments. And PREFIRE’s instruments will be sensitive enough to detect the approximate size of particles to distinguish between liquid droplets and ice particles.
“PREFIRE will give us a new set of eyes on clouds,” said Brian Kahn, an atmospheric scientist at NASA’s Jet Propulsion Laboratory and a member of the PREFIRE science team. “We’re not quite sure what we’re going to see, and that’s really exciting.”
More About the MissionPREFIRE was jointly developed by NASA and the University of Wisconsin-Madison. A division of Caltech in Pasadena, California, JPL manages the mission for NASA’s Science Mission Directorate and provided the spectrometers. Blue Canyon Technologies built the CubeSats, and the University of Wisconsin-Madison will process and analyze the data the instruments collect.
NASA’s Launch Services Program selected Rocket Lab to launch both spacecraft as part of the agency’s Venture-class Acquisition of Dedicated and Rideshare (VADR) contract. CubeSats like PREFIRE serve as an ideal platform for technical and architecture innovation, contributing to NASA’s science research and technology development.
To learn more about PREFIRE, visit:
https://science.nasa.gov/mission/prefire/
5 Things to Know About NASA’s Tiny Twin Polar Satellites Get the PREFIRE fact sheet Meet NASA’s Twin Spacecraft Headed to the Ends of the Earth News Media ContactsJane J. Lee / Andrew Wang
Jet Propulsion Laboratory, Pasadena, Calif.
818-354-0307 / 626-379-6874
jane.j.lee@jpl.nasa.gov / andrew.wang@jpl.nasa.gov
2024-076
Share Details Last Updated May 30, 2024 Related Terms Explore More 6 min read NASA to Measure Moonquakes With Help From InSight Mars Mission Article 1 day ago 6 min read Ongoing Venus Volcanic Activity Discovered With NASA’s Magellan Data Article 3 days ago 6 min read New Images From Euclid Mission Reveal Wide View of the Dark Universe Article 1 week ago Keep Exploring Discover Related TopicsMissions
Humans in Space
Climate Change
Solar System
Summary of the 2023 GRACE Follow-On Science Team Meeting
28 min read
Summary of the 2023 GRACE Follow-On Science Team MeetingFelix Landerer, NASA/Jet Propulsion Laboratory, felix.w.landerer@jpl.nasa.gov
Introduction
In October 2023, the annual gathering of the Gravity Recovery and Climate Experiment (GRACE) and GRACE Follow-On [G-FO] Science Team took place in Boulder, CO, hosted at University Corporation for Atmospheric Research’s (UCAR) Center Green campus. The event had 70 in-person participant and an additional 52 online participants – see Photo. G-FO is a U.S.–German collaboration between NASA and the Helmholtz Centre Potsdam GeoForschungsZentrum (GFZ) [German Research Centre for Geosciences].
Photo: Pictured here are the in-person attendees of the 2023 GRACE-FO Science Team. Another 52 people participated online. Image credit: Felix Landerer/JPLThe meeting agenda featured 15-minute presentations over three days, describing new findings from G-FO observations and the combined GRACE and GRACE-FO [G/G-FO] climate data record that now spans over 21 years (2002–2023).
The meeting began with the customary G-FO project status session, covering programmatic mission and flight segment technical updates, future mission plans, and descriptions of the latest data released from the GRACE Science Data System (SDS) centers. Subsequent sessions featured more than 53 contributed presentations covering analyses, algorithms, and science results by Science Team members and attendees, totaling 57 oral and 5 poster presentations. Many of the presentations are posted on the GRACE website. While this summary will cover all the content on the agenda of the meeting – it does do so in an exact linear fashion. It begins with a G-FO mission status update, followed by key highlights from the contributed analysis and science presentations.
Status of GRACE Follow-On
Since their launch on May 22, 2018, the twin G-FO satellites have been tracking Earth’s water movements and global surface mass changes that arise from climatic, anthropogenic, and tectonic changes. G-FO also enables new insights into variations of ice sheet and glacier mass, land water storage, as well as changes in sea level and ocean currents. These measurements have important applications and implications for everyday life. The impact of these data is underscored by the publication of over 6000 scientific papers – an average of 5 new publications per week – that have established G/G-FO as a leading Earth Science mission.
In May 2023, G-FO successfully completed its Prime Mission phase that lasted five years after launch. G-FO was among the missions that went through the 2023 NASA Earth Science Senior Review. The NASA project team submitted its response in spring of 2023 to extend mission operations through 2026. The proposal received overall Excellent score, highlighting the unique utility the data provide for Earth Science research and societal applications. However, the G-FO project’s NASA budget will be reduced (compared to the previous baseline) by 15% in fiscal year (FY) 2024 and 24% in FY 2025 and 2026 due to the overall budget constraints that NASA is facing. The G-FO team remains confident in its ability to continue delivering high-value and high-impact science data products – prioritizing science operations management and data latency over data reprocessing campaigns. Both NASA and GFZ had already formally committed to extending their collaboration on G-FO mission operations and data processing through the end of 2026 via a Memorandum of Understanding.
As of December 2023, the G-FO project team has processed and released 62 monthly gravity fields – the most recent being for October 2023 (at the time of this writing). The primary mission objective for G-FO is to provide continuity for the monthly GRACE mass-change observations (2002–2017) via its Microwave Interferometer (MWI) intersatellite range-change observations. G-FO also demonstrated a novel technology demonstration Laser-Ranging Interferometer (LRI) for more accurate satellite-to-satellite ranging observations for future GRACE-like missions. The LRI has been successfully operated in parallel with the MWI for most of the mission, delivering excellent quality data. LRI-based monthly gravity and mass change fields covering the period from mid-2018 to mid-2023 have been made available by the SDS teams for further analysis and study by the science community.
Programmatic, Mission, and Operations Updates
The meeting began with Frank Flechtner [GFZ–German G-FO Project Manager] and Felix Landerer [NASA/Jet Propulsion Laboratory (JPL)—U.S. G-FO Project Scientist] giving welcoming remarks, followed by detailed assessments of the G-FO mission and operations status from the core SDS centers and flight operations teams.
GRACE Follow-On Project Status
Felix Landerer gave an overview of the G-FO satellites and the science data system performance. He reported that G-FO continues to meet its goal of extending the GRACE mass-change and gravity data record at equivalent precision and spatiotemporal sampling.
Since the previous STM in October 2022, the overall G-FO science instrument performance has been stable, and the SDS team continued to deliver a gapless monthly data record to users ahead of schedule (on average, within 43 days instead of the 60-day requirement). Improving the data calibrations of the accelerometer measurements – which are noise contaminated on one of the two G-FO spacecraft – remains a core focus of the project SDS team. To this end, an improved calibration approach that reduced data errors by 10–20% has been developed and will be operationalized by the team in the coming months.
Landerer reported that, as forecasted, the current Solar Cycle 25 has gained in strength through 2023 and will continue to do so through 2024 before subsiding again. The resulting higher non-gravitational forces acting on the satellites need to be properly accounted for in the accelerometer data processing.
He also noted that small thruster leaks in the satellites cold gas propulsion system have been closely monitored since 2021. To ensure stable data collection and sufficient lifetime margin to achieve continuity with the proposed successor mission GRACE-Continuity, or GRACE-C (which is the new name for the Earth System Observatory Mass Change mission scheduled for launch no earlier than 2028), the G-FO project team, in conjunction with guidance from the satellite manufacturer Airbus and the German Space Operations Center, decided to adjust the operational data collection mode of G-FO to a wide pointing mode – which means that the two spacecraft are allowed to deviate from their relative line-of-sight pointing by up to 2°, whereas the previous pointing angles were 100 times smaller. This operational change necessitates fewer thruster firings, which in turn reduces leaks and improves accelerometer calibrations – and thus leads to better overall science data quality. Due to the wide pointing, the LRI intersatellite ranging data collection has been suspended in this operational mode. However, the LRI instruments are still activated and fully functional. Landerer emphasized that reducing the leak ensures that the GRACE-FO mission will have sufficient fuel to remain operational up until GRACE-C launches.
Despite these operational challenges, Landerer said that the science data delivered by G-FO continues to provide excellent utility and insights into a rapidly changing Earth system. He briefly highlighted a few scientific and decision-support contributions and achievements of G-FO over the last year. These included:
- Monitoring California Groundwater. G-FO recorded the largest seasonal total water storage gains over California after the multiple atmospheric rivers made landfall during the 2022/2023 winter. Yet, peak water storage in May was below values observed 15–20 years ago – due to long-term, sustained groundwater declines. Going forward, the data will be invaluable to assess groundwater recharge rates and processes.
- Observing Water Cycle Extremes: Droughts and Pluvials. The G-GFO 20-year data record has been analyzed to show the increasing intensity of wet and dry extremes of the global water cycle, which increased as global temperatures rose.
- Tracking Polar Ice Mass Loss. G/G-FO measured net ice mass gains over Antarctica that began around 2021 due to snow accumulation mainly in East Antarctica, which offset the unabated mass loss of the West Antarctic ice sheet.
Subsequent science presentations presented in-depth analyses of these and other findings in the dedicated science sessions, some of which are summarized below.
Landerer also highlighted the expanding portfolio of open science contributions that the project team is supporting: Jupyter notebooks are part of an expanding GRACE Open Science toolbox with the goal to expand this toolbox with input from the Science Team and user community in the coming years. In addition, easy-to-use browser data portals at JPL and GFZ have been key to expand the science and applications user community that increasingly use the Level-3 and higher data products in decision support contexts (e.g., for drought monitoring and water resources management).
A series of status reports on programmatic G-FO mission operations, science operations, and SDS processing followed the opening presentations. Krzysztof Snopek [GFZ] reported on the ground and mission operations at the German Space Operations Center (GSOC), which is responsible for G-FO spacecraft operations. All essential flight operations, software updates, and planned calibrations were successfully scheduled and carried out by GSOC. Himanshu Save [University of Texas, Center for Space Research (CSR)] provided the science operations assessment. He described the evolving Solar Cycle 25 and its influence on the G-FO spacecraft, the mission’s fuel budget, and adjusted operational procedures and modes (such as the already-mentioned ‘wide’ pointing mode). Christopher McCullough [JPL] reviewed the status of G/G-FO Level 1 processing at JPL, detailing additional improvements made in the accelerometer calibrations. The team is using the noisy accelerometer data on one satellite and retrieving improved science information from it.
A representative from each of the G-FO mission SDS centers – which includes JPL, GFZ, CSR, and GSFC – summarized the status of the latest gravity-field and mass change data products [RL06.X L2], including an overview of background dealiasing models and the GFZ GravIS portal, the updated JPL mascon data product, new data-processing strategies, e.g., via range acceleration [CSR], and the status of ancillary Satellite-Laser-Ranging (SLR) data processing and dedicated G/G-FO products [GSFC].
Following the project team’s status presentations, there was a 30-minute session to answer questions from the science community and discuss in more detail the mission performance, near-term operations and data processing plans, as well as to gather suggestions and feedback from the community.
Science Presentations
The remainder of the sessions in the meeting were open-submission science sessions, each of which centered around different thematic topics, including: G/G-FO analysis techniques and next generation gravity mission (NGGM) concept studies, and science analysis of mass-transport data in the fields of glaciology, oceanography, hydrology, and solid-Earth physics. As has been the case in previous years, the presenters underscored the value of interdisciplinary and multi-instrument analyses that utilize the unique complementary value of G/G-FO mass-change observations in combination with other remote sensing data (e.g., satellite altimetry or precipitation observations) and in situ data (e.g., surface deformation or ocean temperature profiles). Such hydrogeodetic combinations yield improved spatial and temporal resolutions that enable advances in Earth system process understanding, which increasingly advance societal applications of science results in support of NASA’s programmatic focus on Earth Science to Action, which seeks to “advance and integrate Earth science knowledge to empower humanity to create a more resilient world.”
Section A: GRACE and GRACE-FO Geodesy
The project status reports presented under the previous heading were part of the first section of the agenda (Session A1) as were two additional sessions: Analysis Techniques and Intercomparisons (Session A2) and NGGM and Bridging the Gap (Session A3), which focused on plans, concepts, and technologies being developed for future gravity missions. Highlights from each of these two sessions follow in the next two subsections.
Analysis Techniques and Inter-comparisons
This session featured 15 presentations by the SDS centers and ST members on progress in instrument data calibrations and novel data processing algorithms and methods, including data-fusion with other observations.
Representatives from G/G-FO processing centers presented updated gravity-field time-series data, which capitalize on improved parameterizations, better instrument error characterizations (e.g., from star cameras, accelerometers, or ranging instruments) and background models (e.g., for tides) for improved monthly mass change data and uncertainty quantification. The highly accurate LRI data provides further opportunities to identify and characterize measurement system errors, which can be exploited for G-FO data processing but is also informative in the development of the future GRACE-C mission. However, it was also shown that several metrics used in identifying gravitational errors are sensitive to the estimated satellite trajectory, and consequently a sufficient understanding of the orbital trajectory is necessary to make accurate adjustments to the gravity field based on satellite observations.
The G/G-FO data products make use of ground-based geodetic observations, such as satellite laser-ranging (SLR) to a network of dedicated SLR satellites, which can be used to extend the G/G-FO interannual data record back to ~1994 – albeit at a much-reduced spatial resolution. Additionally, SLR data provide an important validation and performance assessment opportunity for G/G-FO observations. In that regard one presenter showed results indicating the recent G-FO accelerometer updates have indeed resulted in better gravity and mass change fields. Other speakers discussed the value and potential for improvement that could be achieved by combining G-FO and SLR observations more formally to exploit the data strengths of the different observation types in an optimal way. Such approaches could reduce uncertainties in global ocean and land ice mass changes. Furthermore, deployment of stable, long-term ocean bottom pressure (OBP) recorders in the Arctic Ocean in 2022 has enabled progress on G/G-FO OBP data validation. The data from these OBP recorders are entirely independent of G/G-FO observations and are thus very valuable to assess the satellite data record. An initial comparison between 1.5 years of OBP data and various G-FO OBP products suggest excellent agreement.
The data collected from G/G-FO has a native resolution of about 300 km (~186 mi). By jointly analyzing these G/G-FO data with higher-resolution surface elevation changes from a multimission synthesis of radar and laser satellite altimeters, net mass changes can be effectively downscaled (within a Bayesian framework) to less than 20 km (~12 mi) resolution, which is sufficiently high resolution to resolve individual ice streams in Antarctica that cannot be separated using G/G-FO data alone.
NGGM and Bridging the Gap
The presenters in this session provided status-update on the GRACE-C mission, a joint project between NASA and the Deutsches Zentrum für Luft- und Raumfahrt (DLR) [German Aerospace Center], as well as on future instrument developments and mission concepts.
The 2017 NASA Earth Science Decadal Survey Report highlighted mass-transport monitoring through gravity change as one of five designated observables (i.e., top priorities for study) in Earth observations for the next decade in collaboration with international partners. The GRACE-C project successfully passed the NASA/JPL Mission Concept Review in June 2022, and the NASA Key Decision Point B review in September 2023 and is currently in its Phase B project definition phase. GRACE-C will be a single satellite pair based on a fully redundant LRI (as demonstrated on GRACE-FO) in a polar orbit at 500 km (~311 mi) altitude. To avoid a data gap after GFO, a launch date of no later than 2028 is targeted for GRACE-C.
Similarly, GFZ has been conducting model simulation studies to determine the value of adding a second satellite pair, dubbed Next-Generation Gravity Mission (NGGM) in Europe. The experiments reveal that advanced parameterization techniques for improved de-aliasing of short-term mass variations can significantly reduce data errors and open the possibility for higher spatial and temporal resolution data products and science applications.
The technology demonstration LRI on G-FO has surpassed its performance requirements. With a LRI expected to be the primary instrument for the GRACE-C mission as well as other future GRACE-like missions, development of a new technique is required to provide long-term laser frequency knowledge to provide a scale correction factor to the geodesy measurement. The LRI-team presented updated results of a so-called scale factor measurement technique that allows the accurate determination of the laser frequency on-orbit that can meet the stringent GRACE-C mission requirements. This was achieved with a dual frequency modulation scheme, and a prototype electronics unit has been developed and tested, demonstrating performance better than the expected mission requirements.
There were also reports on progress in technology development of low-frequency optomechanical accelerometers for geodetic applications. These highly-sensitive, compact, portable – and cost-effective – optomechanical inertial sensors build upon recent advances in optomechanics to measure accelerations with small form factors. The development of a sensor with lower cost, size, weight, and power – yet with GRACE-like performance – is a major achievement as these could be integrated into cost-effective mission designs, spacecraft miniaturization, simplified architectures, as well as for the deployment of constellations of satellite pairs flying at lower altitudes.
Section B: Geophysics and Climate Science
There were five sessions included in this section of the agenda, which are summarized in the subsections below as follows: Hydrology (Session B4), Cryosphere (Session B2), Solid Earth Sciences (Session B1), Oceanography (Session B3), and Multidisciplinary Science (Session B5).
Hydrology
This session, with 12 presentations, highlighted advances in hydrology research and applications using G/G-FO data enabled by the unique value of long, uninterrupted mass change climate data record.
The topic of terrestrial water storage variations in California came up in several presentations, focusing on the see-saw swings between very wet and very dry years and the early impacts on groundwater recharge after the record-breaking snow accumulation during the 2022/2023 winter. The process of groundwater recharge – an important objective in the 2017 Earth Science Decadal Survey – is not well understood because of the challenges in observing infiltration of new water supply into the ground and the effects of rate of input, amount of input, and various aquifer characteristics. By combining observations of precipitation, snow water equivalent, surface water storage, ground surface deformation, and groundwater storage from G/G-FO, recharge behavior can be characterized in a natural experiment where source inputs are effectively not limited, but recharge capacity is limited. Results of studies shown during the meeting reveal that only a fraction of total available potential recharge can enter the aquifer, and that G/G-FO observations allow us to measure the effective aggregated recharge capacity and how it varies with several predictors. Another paper reported that subsurface water increases in California’s Sierra Nevada by 0.6 m (~2 ft) from October 2022 to June 2023, which represents 43% of the cumulative precipitation.
Several presenters reported on efforts to advance concepts to downscale G/G-FO data to bring the information closer to decision-making scales and expand water-related applications, as well as to fill gaps and expand the data record with multisensor observations. One presenter described a new spectral approach that employs wavelet multiresolution analysis to combine seasonal terrestrial water storage change data from G/G-FO with those from global navigation satellite system (GNSS) ground station networks to downscale the observations to smaller hydrological basins and to better separate processes over complex topographical terrain. This method can also be used by fusing G/G-FO and hydrological model data [e.g., from NASA’s Global Land Data Assimilation System (GLDAS) models at continental scales]. Importantly, the method yields trends and long-term signals that match G/G-FO observations – a strength of the observing system. Another approach used a statistical Bayesian framework to incorporate G/G-FO observations and Soil Moisture Change data from different available sources [e.g., NASA’s Soil Moisture Active Passive (SMAP) mission] to obtain nonparametric likelihood functions that allow for downscaling. A statistical technique called cyclostationary empirical orthogonal function (CSEOF) analysis – which is used to interpret space-time variability in a large dataset – allowed researchers to fill short data gaps (~1 year) in G/G-FO record (e.g., between 2017 and 2018 – the gap between GRACE and GRACE–FO) without having any additional data. With the support of physically-related data (e.g., precipitation and temperature), CSEOFs can be used to reconstruct water changes into the past or fill larger data gaps. Such datasets improve understanding of trends and natural variability and anticipate future trends in response to climatic changes.
Another presenter described a science study that found an apparent abrupt decline in temperate (non-ice) Terrestrial Water Storage (TWS) in 2015 to a new, lower regime that appears to be unique in the past 33 years. The triggering event for this new lower TWS regime appears to be the massive drought in Brazil in 2015. Subsequent droughts around the world (e.g., Europe, the western U.S., Canada, central Africa, and southern Brazil) have helped to keep TWS values depressed. Warm global sea surface temperatures, prevalent since 2015, have decreased rain accumulation over the continents, reducing TWS.
In the European Alps region, a G/G-FO data analysis found that glacier and ice changes are the major contributors to the observed signals. Overall, glaciers here have lost ice mass at rates between 1.4 to 2.2 Gt/year since 2002. Advances in spatial downscaling and data combinations are expected to allow for improved estimates and applications, including geological hazard monitoring.
In Northern Italy, accelerated groundwater loss has been detected using G/G-FO, well measurements, and vertical land motion observations. Since 2015, the groundwater loss has accelerated. Assuming a best-case scenario (conditions similar to 2007–2014), it could take 13–28 years for ground water storage to recover from recent long-term period of decline, thus setting the stage for prolonged drought conditions.
Since a pioneering study in 2014, it is well-established that G/G-FO observations of TWS are an effective means to estimate flood potential and flood risks due to water-saturated soil. Novel G/G-FO data processing schemes that exploit sub-monthly variations of total water storage enabled researchers to delineate basin-specific storage-discharge dynamics more accurately. They found that at submonthly timescales in many global basins, water storage (i.e., saturated soil) has more impact on whether a flood will occur than the amount of precipitation that falls.
Along the Nile River, G/G-FO data were used to monitor water changes in crucial artificial reservoirs. These data indicate that water losses through underground-seepage over the geologically highly fractured region via a complex network of shear systems, faults, and fractures, are significant and could impact the delicate water balance in the region. A separate study focusing on nearby Southern Arabia found that intense tropical cyclones (wind speeds > 64 kph or ~40 mph) have doubled in the past decade compared to the preceding two, which resulted in significant recharge of the aquifers in the study area. The findings demonstrate the ability of G/G-FO to capture recharge signals and monitor aquifer systems in poorly gauged basins and highlight the significant role of tropical cyclones in recharging aquifers in arid Arabia.
Cryosphere
The five contributions in this session reported on new ice mass balance results of the Earth’s land-ice, as well as on novel data-combinations approaches that can improve the spatial resolution over G/G-FO-only data.
The Antarctica Ice Sheet contributes to the largest sea level rise potential and remains as the largest uncertainty source in the prediction of future sea levels. Data from G-FO and the Ice, Clouds and land Elevation Satellite–2 (ICESat-2) mission have been used to track ice sheet mass and height changes in Greenland and Antarctica, respectively. By combining the strengths of G-FO (gravity or mass change) and ICESat-2, (laser altimetry) data, a more accurate and less uncertain estimate of ice sheet mass changes can be achieved. This combination has led to a proposal for an enhanced iterative algorithm for deriving Antarctic mass balance, incorporating key technologies such as altimetry, gravity measurements, Global Positioning System (GPS) satellite data, and surface mass balance models. The study utilizes an effective density map derived from ICESat-2 and tests the algorithm’s sensitivity and uncertainty with synthetic data, considering realistic physical processes and variability. This approach aims to address discrepancies in estimating ice mass loss in East Antarctica and provides important guidance for optimizing future ground measurements (i.e., GPS station positions). Another presentation focused on understanding the differences in mass change recovered by the G/G-FO and IceSat-2 missions – both in terms of spatial distributions and total magnitudes – to ultimately determine a best combined estimate of ice sheet mass change leveraging the strengths of each mission.
Temporal gravity field estimates from G/G-FO data reveal that the Antarctic ice sheet contributed approximately 6.1 mm (~0.2 in) to global sea level rise from 2002–2022, with a net loss of ~2150 GT of mass. While mass change accelerated during the GRACE era, it has decelerated during the GRACE-FO era – due to increased mass gain in East Antarctica. The deceleration is attributed to surface mass balance processes: annual precipitation and increased incidences of extreme weather events in East Antarctica, challenging predictions based on correlations with climate indices like Southern Annular Mode and El Niño Southern Oscillation.
A related study confirmed a pause in Antarctica’s mass loss, a non-accelerating mass loss in Greenland, and a steady loss from glaciers and ice caps away from the poles. The use of the LRI observations enabled novel submonthly analysis in key regions (including the Amundsen Sea Embayment of West Antarctica and the Pine Island/Thwaites basins) to gain more understanding of fast ice dynamics and their spatial extent.
While G/G-FO data span two decades, estimates of Earth’s oblateness from other satellite observations that date back to 1976 and provide a much longer data record – albeit at much coarser spatial resolution. This half-century long timeseries provides important constraints on ice mass change prior to the launch of GRACE in 2002. The data suggest that ice mass loss had already begun to accelerate by the 1990s. Recent progress in Earth system models, in conjunction with the long satellite data record, are being used to isolate trends in glacial isostatic adjustment (GIA) – which is the vertical movement of the Earth’s surface after the weight of glaciers is removed from them – and to improved estimates of ice mass loss prior to GRACE.
Solid Earth Sciences
Two presenters in this session described their efforts to evaluate signals in the G/G-FO data record associated with earthquakes. The G/G-FO data provide a unique opportunity to observe the Earth’s response to great earthquakes across diverse tectonic settings at time scales from days to decades. Using 13 earthquakes of magnitude (Mw)>8.0 over the last 20 years, it was found that elastic bulk modulus and viscosity govern large-scale coseismic and postseismic gravimetric changes, respectively. By constraining the solid Earth’s viscosity structure, improved physics-based models of long-term postseismic changes can be developed that incorporate observations from G/G-FO. The portion of the long-term gravity change signal that can be attributed to these earthquakes can then be removed from the G/G-FO data to better quantify processes related to ocean mass and hydrology changes. When physics-based models are not available, alternative statistic-based approaches can be used to remove the co- and post-seismic signature of large earthquakes (e.g., 2004 Andaman-Sumatra and 2011 Tohoku, Japan quakes) from the G/G-FO data.
As the G/G-FO data record extends into its third decade, the long time series of Earth gravity changes requires careful consideration of the solid-Earth response to contemporary surface mass changes. To isolate the gravity signature of any surface mass signal, it is becoming evident that simple elastic loading corrections are no longer sufficient. Recent advances in mantle rheology – describing and understanding the nature of Earth’s mantle – derived in mineral laboratory experiments, tidal modeling, and seismic imaging provide unequivocal evidence of anelastic contributions to solid-Earth deformation on time-scales ranging from hours to decades. New developments in the solid-Earth capabilities of JPL’s Ice-sheet and Sea-level System Model (ISSM) in the form of viscoelastic solvers for Love numbers and sea-level change was used to implement and explore the so-called Extended Burgers Material (EBM) and so resulting viscoelastic deformations between the seismic and GIA time scales. Preliminary testing with EBM rheology shows potential for a ~15–20% increase in mass change trends for some regions.
A subdecadal variation of large-scale (i.e., spanning over continental scales) gravity signals with a period of approximately six years has attracted intense interest in the geodesy and geodynamic communities. Earth’s fluid core motions, magnetic field, Earth rotation, and crustal deformations have been invoked as causes for this signal. An analysis of G/G-FO data showed that a significant part of the approximately six-year signals is in fact due to climate-related oscillation of ocean-atmosphere coupling in the Pacific and Atlantic and variations in the land water storage over Africa.
Oceanography
In the oceanography session, five presenters reported on the combination of G/G-FO, satellite altimeters (e.g., from the joint NASA–European Sentinel-6 Michael Freilich mission), and in situ ocean floats (e.g., Argo) to investigate variations in sea level and ocean circulations – e.g., see Figure 1. Other presenters discussed improvements in data processing by reducing errors in atmospheric tides that could lead to spurious trends or double-counting a subset of ocean tides and by incorporating new dedicated ocean data grids that remove geodetic signals not related to ocean dynamics (e.g., global ocean mass; large earthquake signals).
Figure 1. The top row of maps show estimates of individual components of the observed sea level trend in the northwestern Pacific from 2003 to 2016 including contributions from: land ice melt [top row, left], non-ice land water storage [top row, middle], and stereodynamic effects [top row right], which are estimated by directly combining in situ-based steric sea level (i.e., based on Argo ocean profiling floats) with the GRACE-derived ocean mass changes. The bottom row shows the sum of all of the components of sea level trend on the top two rows [bottom row, left], compared the same measurement using satellite-altimetry [bottom row, right]. These data clearly show the strong earthquake-related signature of ocean mass change east of Japan. Image credit: Felix Landerer/updated from a similar figure published in Nature’s Communications Earth & Environment.Another presenter described how ocean mass redistribution and regional sea-level rise in the North-West Pacific marginal seas (i.e., around Japan and north of the Philippines) is impacted by seafloor deformation from earthquakes, which alter the ocean bathymetry. G/G-FO data are key to isolating these deformation effects, which in turn allows better sea level projections that can be used for planning purposes.
While long-term sea level trends are of major concern, the seasonal cycle is the dominating climate signal in ocean bottom pressure variability. Accurate representation of seasonal cycle is thus key to efforts to improve observations and models of ocean bottom pressure. Examining differences between models and observations elucidates remaining uncertainty in observations and missing physics in the models (e.g., lack of intrinsic variability due to coarse resolution, no accounting of gravitational and loading effects). This allows researchers to advance the quality of ocean mass change observations and unravel underlying dynamics.
Lastly, ocean bottom pressure observations from G/G-FO have been used to monitor transport variability of deep currents associated overturning circulation in the Northern Hemisphere (the Labrador Current) and Southern Hemisphere (Weddell Sea Bottom Water). This deepwater transport provides an important pathway for the sequestration of excess atmospheric heat and carbon from locations of water mass formation. Continuous observations of deep ocean currents provide valuable insight into Earth’s climate system. However, harsh conditions and complex recirculation transport pathways make in-situ observations of these deep flowing currents challenging.
Interdisciplinary Science
Six presenters contributed to this session. The first study revisited geodetic assumptions about measuring so-called Earth Center-of-Mass (CM) motions that can be traced to planetary-scale seasonal and long-term variations of water cycling between the land the oceans. Differences in SLR and G/G-FO estimates of CM estimates can be helpful to refining global circulation models. In a related study, G/G-FO and SLR data have been used to pin down the causes and origin of polar motion, particularly the mass component related to gravity changes. A novel hybrid SLR/GRACE time-variable gravity approach closely aligned well with the hydrological excitation in independently polar motion.
Errors in GIA corrections impact altimeter estimates of sea level and ocean mass estimates and the so-called sea level budget. Choices in modeling GIA, particularly based on paleoshoreline sites, affect Earth’s viscosity structure and GIA response, influencing global mean sea level (GMSL) budget closure. Even minor Earth model changes can have notable effects on the alignment of GMSL (altimetry), ocean mass (GRACE), and steric sea level change (Argo). Thus, future research needs to focus on accounting for the complex three-dimensional structure of the solid Earth to improve GIA corrections and more accurately isolate contemporary mass change in the G/G-FO data record.
Despite GIA uncertainties, G/G-FO, in combination with sea level measurements from altimetry, provide a unique capability to measure changes in ocean heat content. The ocean takes up nearly 90% of Earth’s current energy imbalance, signifying their important role in overall planetary heating. Two presenters reported consistent findings of ocean heat uptake rates of 0.9 W/m2 based on the indirect geodetic satellite measurements of sea level and ocean mass – a value that is entirely independent of other techniques and thus provides crucial validation – see Figure 2. In addition, the results indicated the overall heating rate over the last decade has increased, which means heat accumulation is accelerating.
Figure 2. This graph shows different estimates of ocean heat uptake (OHU), measured with in-situ ocean floats (orange curve), from top-of-the-atmosphere radiance satellite measurements of Earth energy imbalance (EEi) (black curve), and from geodetic satellites, i.e., G/G-FO and altimeters (blue curve). The satellite measurements agree well and show an increasing energy imbalance over the last 20 years. Image credit: Felix Landerer/originally in Geophysical Research Letters.Summary
The hybrid 2023 G-FO STM brought together over 120 international participants and showcased a broad range of science results and applications that are supported and uniquely enabled by the satellite gravimetry-based mass change observations. The G-FO data now span nearly six years and continue to provide crucial insights into how Earth’s hydrosphere, including sea level, ocean currents, and water distribution over land, is changing. The G/G-FO data are extending important climate data records (e.g., the Greenland and Antarctic ice mass time-series, ocean mass sea level data, and TWS over land) into their third decade. The upcoming GRACE-C mission will build on and expand this mature data record, which is increasingly enabling important applications in support of water-related decision making and planning.
The G-FO project team remains focused on providing the mass-change data record at a level of performance consistent with that of GRACE. As the current Solar Cycle 25 increases towards its anticipated maximum in 2024, the team continues to improve the mission’s accelerometer data products in support of that goal. Corresponding data improvements in the monthly gravity and mass change products will be released early 2024.
The next G-FO STM will be held from October 8–10, 2024 in Potsdam, Germany, organized by GFZ. Check the GRACE website for specific details as the date gets closer.
Spaceflight affects tumor-bearing fruit fly hosts and their parasites
Blade Shape: The kona mutant has an angular wing shape in contrast to wild-type’s rounded wing blade (vertical arrows in D–F).S. Govind.
Background: Like humans, fruit flies (a model organism for spaceflight research) also exhibit immune system dysfunction in space. Despite decades of studies on fruit flies and wasps, little was known about how their immune systems interact with natural parasites in space. Drosophila parasitoid wasps modify blood cell function to suppress host immunity. In this spaceflight study (the Fruit Fly-03 Lab flown to the ISS on SpaceX-14), naive and parasitized ground and space flies from a tumor-free control and a blood tumor-bearing mutant strain were examined.
Main Findings: Surprisingly, the flies without tumors were more sensitive to space than the flies with tumors. Spaceflight increased immune gene activity and made tumors grow more in the flies. The wasps remained harmful in space, but some developed inheritable physical changes. These changes included “aurum” (altered wing color and veins) and “kona” (altered wing shape). Female wasps with two copies of the “kona” mutation could not lay eggs because of defective egg-laying organs.
Ovipositors from wild-type and mutant wasps.Homozygous kona females with defective ovipositors (used for egg laying) how areas of compromised integrity or have branched ends (arrows) compared to the continuous ovipositors with sharp ends from wild-type control wasps.S. Govind
Impact: This study will Improve our knowledge of how parasites and hosts interact. The results show that we need to study more types of organisms, including plants and their natural parasites, in space. This will help us learn more about how hosts defend themselves and how dangerous parasites can be in space, which is important for astronaut health. Gene expression data from fruit flies (OSD-588) and two types of wasps (OSD-609 & OSD-610) are publicly available on NASA’s Open Science Data Repository. This data is available for anyone to use and compare with other spaceflight studies.
Reference: Chou, J., Ramroop, J., Saravia-Butler, A., Wey, B., Lera, M., Torres, M., Heavner, M., Iyer, J., Mhatre, S,. Bhattacharya, S., Govind, S. Drosophila parasitoids go to space: Unexpected effects of spaceflight on hosts and their parasitoids. iScience, Volume 27, Issue 1, 2024, 108759, ISSN 2589-0042, https://doi.org/10.1016/j.isci.2023.108759
The Marshall Star for May 29, 2024
By Wayne Smith
NASA’s Marshall Space Flight Center will celebrate its 65th birthday next summer, and while there are plans to honor the center’s rich history, there is also More to Marshall ahead.
Team members at NASA’s Marshall Space Flight Center listen to Center Director Joseph Pelfrey, background center, share updates on culture and strategy during the spring all-hands meeting May 20 in Activities Building 4316. NASA/Danielle BurlesonThat was part of the message Center Director Joseph Pelfrey delivered during the spring all-hands meeting May 20 in Activities Building 4316. He highlighted Marshall’s transformative shift to more strategic partnerships across NASA and with industry, with the center continuing to serve as a technical solutions provider.
“More to Marshall is a systematic approach that will reinforce our center’s strategy and our role in space exploration,” Pelfrey said. “We align this vision with the core values of our Marshall fabric. We are not replacing our roots; we are fostering them to grow stronger and reach farther.”
Pelfrey also discussed the center’s evolving culture, highlighting April outreach activities, including the Total Solar Eclipse event in Russellville, Arkansas, First Robotics, Student Launch, and the Human Exploration Rover Challenge.
Marshall Deputy Director Rae Ann Meyer, second from right, responds to an audience question during a question-and-answer panel the May 20 all-hands meeting. At left, Lance D. Davis, Marshall’s public affairs and news chief, moderates the panel, while Pelfrey, center left, and Larry Leopard, Marshall’s associate director, technical, far right, listen in.NASA/Danielle Burleson“These events emulate the Marshall culture,” Pelfrey said. “I am proud of the impact you have on the community, the Artemis Generation, and across the globe.”
New Deputy Director Rae Ann Meyer followed Pelfrey’s opening remarks, focusing on the center’s newest culture initiatives. Meyer also invited Trace Turner, management assistant in the Office of the Director, to highlight the efforts of three Center Action Teams leading the charge on Marshall’s culture initiatives. Team leaders Rocio Garcia, Benjamin Ferrell, and Mason Quick each shared more about their respective team’s projects, including the development of a user-friendly app that will share information on Marshall, NASA’s Michoud Assembly Facility, Redstone Arsenal, and the community.
Larry Leopard, Marshall’s associate director, technical, provided an update on the center’s efforts to address knowledge management concerns, starting with events like Meals with Mentors, Center Strategy Brown Bags and Tech Talk presentations, and after-action reviews.
Center Action Team leader Rocio Garcia shares plans to develop a user-friendly app for Marshall team members and the public, which will serve as a one-stop shop for information on Marshall, NASA’s Michoud Assembly Facility, Redstone Arsenal, and the community.NASA/Danielle BurlesonFinally, before Marshall leadership participated in a question-and-answer panel, Pelfrey shared updates on center strategy, infrastructure, NASA’s budget, and NASA 2040.
“We will build on the success of our center strategy,” Pelfrey said. “We will continue to implement and mature our pursuits culture, always seeking challenging and exciting opportunities, using our skills, expertise, capabilities, and infrastructure while continuing to build partnerships with industry and academia. Marshall has a tremendous role in returning humans to the Moon, reaching Mars, and exploring the cosmos.”
Team members can watch a recording of the all-hands meeting on Inside Marshall.
Smith, a Media Fusion employee and the Marshall Star editor, supports the Marshall Office of Communications.
Les Johnson Named Center Chief Technologist at MarshallLes Johnson has been named center chief technologist at NASA’s Marshall Space Flight Center, effective June 2.
Johnson will provide expert advice on technology initiatives to center leadership and to Marshall team members. He will lead the Marshall team on matters involving center-wide technology development. Johnson also will represent Marshall on NASA’s Center Technology Council and serves as the center’s focal point for Center Innovation Fund activities.
Les Johnson has been named center chief technologist at NASA’s Marshall Space Flight Center.NASAHe has been a principal technologist for several of NASA’s advanced in-propulsion and power technology developments during his 33-year career at Marshall. Johnson served as the principal investigator of the Propulsive Small Expendable Deployer System (ProSEDS) tether propulsion project and Near-Earth Asteroid Scout solar sail mission. He was a co-investigator (Co-I) of the JAXA T-Rex tether propulsion demonstration, the European Union’s InflateSail, and NASA’s Lightweight Integrated Solar Array and anTenna (LISA-T) missions, as well as a Co-I on multiple NASA Innovative Advanced Concepts (NIAC) studies.
Johnson began his NASA career in 1990 working in the Program Development Directorate formulating new space science mission concepts. Shortly thereafter, he became the manager for NASA’s Interstellar Propulsion Technology Project that transitioned into the In-Space Propulsion Technology Program, which he managed on behalf of the Office of Space Science. He then served as the formulation manager for the Nuclear Systems Initiative, which became Project JIMO. Johnson served as deputy manager and technical assistant for the Advanced Concepts Office, before being selected to lead the development of the Solar Cruiser solar sail propulsion system in the Science and Technology Office.
Prior to NASA, he worked three years for General Research Corp. on directed energy systems in support of the Strategic Defense Initiative.
Johnson holds three patents. His awards include NASA’s Exceptional Technology Achievement Medal, NASA’s Exceptional Achievement Medal (twice), Marshall’s Technology Transfer and Innovation Awards, and he has been a Rotary Stellar Award finalist two times. As an outside activity, he is also an award-winning author.
A native of Ashland, Kentucky, Johnson earned his bachelor’s degree from Transylvania University and his master’s degree from Vanderbilt University.
Take 5 with Jose MatienzoBy Wayne Smith
Growing up in the small village of Luquillo, Puerto Rico, Jose Matienzo would fly paper airplanes and launch model rockets from atop the building he lived in with his family.
“I knew then that I wanted to be some sort of engineer, I just didn’t know what it was called,” Matienzo said. “I never imagined that I actually would work for NASA, but I thought I could design cars or planes. I liked drawing them.”
Jose Matienzo began his NASA career in 1983 at the agency’s Marshall Space Flight Center.Photo courtesy of Jose MatienzoFlash forward more than five decades later. Matienzo is in his 42nd year working with NASA and the agency’s Marshall Space Flight Center as he nears retirement in December. Center team members will remember him as manager of the Marshall Exchange for the past 12 years, enjoying his witty daily email from the Exchange.
“Literally every day was fun trying to make life better for our team members,” Matienzo said of his team with the Exchange. “That includes bringing the food truck court, being able to have employee clothing of all styles and types, creating new clubs, and expanding facilities.”
He is currently assigned to a position with NASA’s Source Evaluation Board.
As he approaches retirement, Matienzo still finds it difficult to fathom his many milestones working with NASA and Marshall, where he began his career in 1983 as a co-op student in the structural dynamics division and worked on the Space Shuttle Program for 12 years. Matienzo followed that with a year at NASA Headquarters before returning to Marshall as lead engineer on several projects related to the International Space Station, such as the space station element transportation system.
His other assignments have included managing the NASA office at the Naval Research Center; the Marshall lead for supporting the Launch Services Program, including the office at the United Launch Alliance rocket plant in Decatur; technical assistant for former Marshall Director Robert Lightfoot; and more.
“There have been so many memories over the years,” Matienzo said. “Six months after becoming a full-time employee, the Challenger accident happened. At the time I had no idea what the possible impact of that accident would be. We all had a little part on returning to flight, so watching the first launch afterwards was a fantastic moment.
“We delivered space station hardware in partnership with the Italians and the European Space Agency, helped train the astronauts who performed the Hubble Telescope repair, and most recently, we made improvements to the Exchange services to make life at work better for our employees.”
Question: What excites you most about the future of human space exploration, or your NASA work, and your team’s role it?
Matienzo: I’ve been here for a long time and our future missions and goals have changed over the years. But no matter what, there’s always been excitement about meeting the agency’s goals and Marshall’s role in providing space transportation, lunar landers, and even Mars sample return vehicles. That and all of the support and testing work that comes with it is fun!
Question: Who or what drives/motivates you?
Matienzo: I’ve been lucky that my job assignments have always been fun and self-motivating, but certainly dealing and coordinating with colleagues in accomplishing a mutual goal, test, or assignment is very rewarding.
Question: What advice do you have for employees early in their NASA career or those in new leadership roles?
Matienzo: Network! As you get to know others and learn what they do, you will find out how everything comes together at NASA and where other opportunities may be out there for you. For our leaders: keep encouraging, mentoring, and creating opportunities for the employees to experience, learn, and grow.
Question: What do you enjoy doing with your time while away from work?
Matienzo: My kids are older now so keeping in touch is fun. But I do have grandkids to play with. Otherwise, I play congas with my bandmates, love to do social dancing, play lots of pickleball, and enjoy mountain and road bike riding.
Question: What plans do you have for retirement?
Matienzo: I want to move closer to the beach. I love Huntsville, so I want to keep a presence here. I also plan to bike all over the USA!
Smith, a Media Fusion employee and the Marshall Star editor, supports the Marshall Office of Communications.
Marshall Team Supports Safe Travels for Space Station ScienceBy Jessica Barnett
During the International Space Station’s more than 25 years of operation, there have been more than 3,000 experiments conducted aboard the microgravity laboratory, and making sure scientific samples are kept safe through launch, spaceflight, experimentation, and the return trip to Earth takes a great deal of planning, testing, and preparation across NASA.
In February, team members at NASA’s Marshall Space Flight Center handled the de-integration of zinc selenide-based crystals grown on the space station as part of an experiment to study how a lack of gravity might affect the crystals’ growth and structure. The experiment was conducted using six sample cartridge assemblies heated up to 1,200 degrees Celsius (2,192 degrees Fahrenheit) inside the Materials Science Laboratory of the Materials Science Research Rack on the space station.
NASA Marshall Space Flight Center’s payload technician Chris Honea, left, and quality assurance specialist Keith Brandon, right, on Feb. 29 carefully inspect the temperature sensors that help gather data and monitor progress during a crystals experiment. The zinc selenide-based crystals were grown on the International Space Station as part of an experiment to see how gravity affects their structure or growth, then de-integrated and inspected in Marshall’s Space Systems Integration & Test Facility.NASAJohn Luke Bili, lead systems test engineer for the sample cartridge assemblies within Marshall’s Instrument Development, Integration, and Test Branch, begins the process by working with engineers, scientists, project personnel, and the experiment’s principal investigator to create an ampoule, or sealed glass vial, to use as a sample container.
“We’ll take the ampoule and do some ground testing, like a normal flight integration,” Bili said. “We’ll assemble it with the hardware we have, then we are responsible for completing different mitigation efforts to prepare for sealing the ampoule up and processing it at the required high temperatures.”
The team exposes the test article to extreme heat and pressure using a duplicate of the furnace on the space station, allowing them to also test the experiment’s software.
The zinc selenide-based crystal experiment required six sample cartridge assemblies. After a month of preparation from Marshall’s team, the assemblies traveled to NASA’s Johnson Space Center for a final round of packing before arriving at the agency’s Kennedy Space Center for launch.
The assemblies launched on NASA’s SpaceX 24th commercial resupply services mission in December 2021 and NASA’s Northrop Grumman 19th commercial resupply services mission in August 2023. Each sample took about a week to process through the space station’s lab furnace. The samples were then brought back to Earth, with three of the six arriving at Marshall on Feb. 9.
An ampoule containing zinc selenide-based crystals rests on a table in Marshall Space Flight Center’s Space Systems Integration & Test Facility. The ampoule was part of the sixth sample cartridge assembly retrieved from the International Space Station as part of an experiment to see how gravity affects the crystals’ structure or growth.NASAWhile unpacking the crystal samples, team members took photos and notes of the tubes throughout the de-integration process in Marshall’s Space Systems Integration & Test Facility. The team includes technicians with 20 to 30 years of experience, ensuring samples safely travel to and from the station and helping expand access for researchers to explore microgravity, space exposure, and future missions in low Earth orbit.
“It’s really nice having that kind of experience when we’re working on the hardware that’s going in space,” he said. “We’ve got a lot of people that are very skilled machinists that are able to help us in a moment’s notice, we have people with a really good understanding of technical tolerances and stuff like that, and we have people with a lot of varying experience doing flight hardware integration and tests.”
For more than two decades, humans have lived and worked continuously aboard the International Space Station, advancing scientific knowledge and making research breakthroughs that are not possible on Earth. The station is a critical testbed for NASA to understand and overcome the challenges of long-duration spaceflight and to expand commercial opportunities in low Earth orbit.
Learn more about the space station.
Barnett, a Media Fusion employee, supports the Marshall Office of Communications.
Spotted: ‘Death Star’ Black Holes in ActionA team of astronomers have studied 16 supermassive black holes that are firing powerful beams into space, to track where these beams, or jets, are pointing now and where they were aimed in the past, as reported in a press release. Using NASA’s Chandra X-ray Observatory and the U.S. National Science Foundation (NSF) National Radio Astronomical Observatory’s (NRAO) Very Large Baseline Array (VLBA), they found that some of the beams have changed directions by large amounts.
These two Chandra images show hot gas in the middle of the galaxy cluster Abell 478, left, and the galaxy group NGC 5044, right.X-ray: NASA/CXC/Univ. of Bologna/F. Ubertosi; Insets Radio: NSF/NRAO/VLBA; Wide field Image: Optical/IR: Univ. of Hawaii/Pan-STARRS; Image Processing: NASA/CXC/SAO/N. WolkThese two Chandra images show hot gas in the middle of the galaxy cluster Abell 478 (left) and the galaxy group NGC 5044 (right). The center of each image contains one of the sixteen black holes firing beams outwards. Each black hole is in the center of a galaxy embedded in the hot gas.
In the images below, labels and the radio images appear. Ellipses show a pair of cavities in the hot gas for Abell 478, left, and ellipses show two pairs of cavities for NGC 5044, right. These cavities were carved out by the beams millions of years ago, giving the directions of the beams in the past. An X shows the location of each supermassive black hole.
The VLBA images are shown as insets, which reveal where the beams are currently pointing, as seen from Earth. The radio images are both much smaller than the X-ray images. For Abell 478 the radio image is about 3% of the width of the Chandra image and for NGC 5044 the radio image is about 4% of the Chandra image’s width.
A labeled version of the image.X-ray: NASA/CXC/Univ. of Bologna/F. Ubertosi; Insets Radio: NSF/NRAO/VLBA; Wide field Image: Optical/IR: Univ. of Hawaii/Pan-STARRS; Image Processing: NASA/CXC/SAO/N. WolkA comparison between the Chandra and VLBA images shows that the beams for Abell 478 changed direction by about 35 degrees and the beams for NGC 5044 changed direction by about 70 degrees.
Across the entire sample the researchers found that about a third of the 16 galaxies have beams that are pointing in completely different directions than they were before. Some have changed directions by nearly 90 degrees in some cases, and over timescales between one million years and a few tens of millions of years. Given that the black holes are of the order of 10 billion years old, this represents a relatively rapid change for these galaxies.
Black holes generate beams when material falls onto them via a spinning disk of matter and some of it then gets redirected outward. The direction of the beams from each of these giant black holes, which are likely spinning, is thought to align with the rotation axis of the black hole, meaning that the beams point along a line connecting the poles.
These beams are thought to be perpendicular to the disk. If material falls towards the black holes at a different angle that is not parallel to the disk, it could affect the direction of the black hole’s rotation axes, changing the direction of the beams.
Wide field views of Abell 478, left, and NGC 5044, right.X-ray: NASA/CXC/Univ. of Bologna/F. Ubertosi et al.; Optical/IR: Univ. of Hawaii/Pan-STARRS; IR: NASA/ESA/JPL/CalTech/Herschel Space TelescopeScientists think that beams from black holes and the cavities they carve out play an important role in how many stars form in their galaxies. The beams pump energy into the hot gas in and around the galaxy, preventing it from cooling down enough to form huge numbers of new stars. If the beams change directions by large amounts, they can tamp down star formation across much larger areas of the galaxy.
The paper describing these results was published in the January 20th, 2024 issue of The Astrophysical Journal, and is available here. The authors are Francesco Ubertosi (University of Bologna in Italy), Gerritt Schellenberger (Center for Astrophysics | Harvard & Smithsonian), Ewan O’Sullivan (CfA), Jan Vrtilek (CfA), Simona Giacintucci (Naval Research Laboratory), Laurence David (CfA), William Forman (CfA), Myriam Gitti (University of Bologna), Tiziana Venturi (National Institute of Astrophysics—Institute of Radio Astronomy in Italy), Christine Jones (CfA), and Fabrizio Brighenti (University of Bologna).
NASA’s Marshall Space Flight Center manages the Chandra program. The Smithsonian Astrophysical Observatory’s Chandra X-ray Center controls science from Cambridge Massachusetts and flight operations from Burlington, Massachusetts.
Read more from NASA’s Chandra X-ray Observatory.
NASA, IBM Research to Release New AI Model for Weather, ClimateBy Jessica Barnett
Working together, NASA and IBM Research have developed a new artificial intelligence model to support a variety of weather and climate applications. The new model – known as the Prithvi-weather-climate foundational model – uses artificial intelligence (AI) in ways that could vastly improve the resolution we’ll be able to get, opening the door to better regional and local weather and climate models.
Foundational models are large-scale, base models which are trained on large, unlabeled datasets and can be fine-tuned for a variety of applications. The Prithvi-weather-climate model is trained on a broad set of data – in this case NASA data from NASA’s Modern-Era Retrospective analysis for Research and Applications (MERRA-2)– and then makes use of AI learning abilities to apply patterns gleaned from the initial data across a broad range of additional scenarios.
With the Prithvi-weather-climate foundational model, researchers will be able to support many climate applications that can be used throughout the science community. These applications include detecting and improving models for severe weather patterns or natural disasters such as hurricanes. NASA’s Terra satellite acquired this image of Idalia in August 2023. NASA Earth Observatory“Advancing NASA’s Earth science for the benefit of humanity means delivering actionable science in ways that are useful to people, organizations, and communities. The rapid changes we’re witnessing on our home planet demand this strategy to meet the urgency of the moment,” said Karen St. Germain, director of the Earth Science Division of NASA’s Science Mission Directorate. “The NASA foundation model will help us produce a tool that people can use: weather, seasonal and climate projections to help inform decisions on how to prepare, respond and mitigate.”
With the Prithvi-weather-climate model, researchers will be able to support many different climate applications that can be used throughout the science community. These applications include detecting and predicting severe weather patterns or natural disasters, creating targeted forecasts based on localized observations, improving spatial resolution on global climate simulations down to regional levels, and improving the representation of how physical processes are included in weather and climate models.
“These transformative AI models are reshaping data accessibility by significantly lowering the barrier of entry to using NASA’s scientific data,” said Kevin Murphy, NASA’s chief science data officer, Science Mission Directorate at NASA Headquarters. “Our open approach to sharing these models invites the global community to explore and harness the capabilities we’ve cultivated, ensuring that NASA’s investment enriches and benefits all.”
Prithvi-weather-climate was developed through an open collaboration with IBM Research, Oak Ridge National Laboratory, and NASA, including the agency’s Interagency Implementation and Advanced Concepts Team (IMPACT) at NASA’s Marshall Space Flight Center.
Prithvi-weather-climate can capture the complex dynamics of atmospheric physics even when there is missing information thanks to the flexibility of the model’s architecture. This foundational model for weather and climate can scale to both global and regional areas without compromising resolution.
“This model is part of our overall strategy to develop a family of AI foundation models to support NASA’s science mission goals,” said Rahul Ramachandran, who leads IMPACT at Marshall. “These models will augment our capabilities to draw insights from our vast archives of Earth observations.”
Prithvi-weather-climate is part of a larger model family– the Prithvi family – which includes models trained on NASA’s Harmonized LandSat and Sentinel-2 data. The latest model serves as an open collaboration in line with NASA’s open science principles to make all data accessible and usable by communities everywhere. It will be released later this year on Hugging Face, a machine learning and data science platform that helps users build, deploy, and train machine learning models.
“The development of the NASA foundation model for weather and climate is an important step towards the democratization of NASA’s science and observation mission,” said Tsendgar Lee, program manager for NASA’s Research and Analysis Weather Focus Area, High-End Computing Program, and Data for Operation and Assessment. “We will continue developing new technology for climate scenario analysis and decision making.”
Along with IMPACT and IBM Research, development of Prithvi-weather-climate featured significant contributions from NASA’s Office of the Chief Science Data Officer, NASA’s Global Modeling and Assimilation Office at Goddard Space Flight Center, Oak Ridge National Laboratory, the University of Alabama in Huntsville, Colorado State University, and Stanford University.
Learn more about Earth data and previous Prithvi models.
Barnett, a Media Fusion employee, supports the Marshall Office of Communications.
Psyche Fires Up Its Sci-Fi-Worthy ThrustersNASA’s Psyche spacecraft passed its six-month checkup with a clean bill of health, and there’s no holding back now. Navigators are firing its futuristic-looking electric thrusters, which emit a blue glow, nearly nonstop as the orbiter zips farther into deep space.
The spacecraft launched from NASA’s Kennedy Space Center atop a SpaceX Falcon Heavy on Oct. 13, 2023. After leaving Earth’s atmosphere, Psyche made the most of its rocket boost and coasted beyond the orbit of Mars.
For the next year, the spacecraft will be in what mission planners call “full cruise” mode, when its electric thrusters take over and propel the orbiter toward the asteroid belt. The thrusters work by expelling charged atoms, or ions, of xenon, emitting a brilliant blue glow that trails behind the spacecraft.
This artist’s concept depicts NASA’s Psyche spacecraft headed to the metal-rich asteroid Psyche in the main asteroid belt between Mars and Jupiter. The spacecraft launched in October 2023 and will arrive at its destination in 2029.NASA/JPL-Caltech/ASUThey are part of Psyche’s incredibly efficient solar electric propulsion system, which is powered by sunlight. The thrust created by the ionized xenon is gentle, but it does the job. Even in full cruise mode, the pressure exerted by the thrusters is about what you’d feel holding three quarters in your hand.
The orbiter is now more than 190 million miles away and moving at a clip of 23 miles per second, relative to Earth. That’s about 84,000 mph. Over time, with no atmospheric drag to slow it down, Psyche will accelerate to speeds of up to 124,000 mph.
The spacecraft will arrive at the metal-rich asteroid Psyche in 2029 and will make observations from orbit for about two years. The data it collects will help scientists better understand the formation of rocky planets with metallic cores, including Earth. Scientists have evidence that the asteroid, which is about 173 miles across at its widest point, may be the partial core of a planetesimal, the building block of an early planet.
The flight team used Psyche’s first 100 days in space to conduct a full checkout of all spacecraft systems. All of the engineering systems are working just as expected, and the three science instruments have been operating without a hitch. The magnetometer is working so well that it was able to detect an eruption of charged particles from the Sun, as did the gamma-ray and neutron spectrometer. And this past December, the twin cameras on the imaging instrument captured their first images.
This photo captures an operating electric thruster identical to those being used to propel NASA’s Psyche spacecraft. The blue glow comes from the charged atoms, or ions, of xenon.NASA/JPL-Caltech“Until this point, we have been powering on and checking out the various pieces of equipment needed to complete the mission, and we can report they are working beautifully,” said Henry Stone, Psyche project manager at NASA’s Jet Propulsion Laboratory, which manages the mission. “Now we are on our way and looking forward to an upcoming close flyby of Mars.”
That’s because the spacecraft’s trajectory will bring it back toward the Red Planet in the spring of 2026. The spacecraft will power down the thrusters as it coasts toward Mars, using the planet’s gravity to slingshot itself out. From there, the thrusters return to full cruise mode. Next stop: the asteroid Psyche.
In the meantime, the Deep Space Optical Communications technology demonstration aboard the spacecraft will keep on testing its mettle. The experiment already surpassed expectations when, in April, it transmitted test data from over 140 million miles away at a rate of 267 megabits per second to a downlink station on Earth – a bit rate comparable to broadband internet download speeds.
Arizona State University leads the Psyche mission. A division of Caltech in Pasadena, JPL is responsible for the mission’s overall management, system engineering, integration and test, and mission operations. Maxar Technologies in Palo Alto, California, provided the high-power solar electric propulsion spacecraft chassis.
JPL manages DSOC for the Technology Demonstration Missions program within NASA’s Space Technology Mission Directorate and the Space Communications and Navigation program within the Space Operations Mission Directorate.
Psyche is the 14th mission selected as part of NASA’s Discovery Program, which is managed by the agency’s Marshall Space Flight Center. NASA’s Launch Services Program, based at Kennedy, managed the launch service.
NASA’s OSIRIS-APEX Unscathed After Searing Pass of SunMission engineers were confident NASA’s OSIRIS-APEX (Origins, Spectral Interpretation, Resource Identification – Apophis Explorer) spacecraft could weather its closest ever pass of the Sun on Jan. 2. Their models had predicted that, despite traveling 25 million miles closer to the heat of the Sun than it was originally designed to, OSIRIS-APEX and its components would remain safe.
The mission team confirmed that the spacecraft indeed had come out of the experience unscathed after downloading stored telemetry data in mid-March. The team also tested OSIRIS-APEX’s instruments in early April, once the spacecraft was far enough from the Sun to return to normal operations. Between December 2023 and March, OSIRIS-APEX was inactive, with only limited telemetry data available to the team on Earth.
Both these images from a camera called StowCam aboard OSIRIS-APEX show the same view taken six months apart, before, left, and after, right, the Jan. 2, 2024, perihelion. Notably, there is no observable difference on spacecraft surfaces, a good indication that the higher temperatures faced during perihelion didn’t alter the spacecraft. Another insight gleaned from the identical view in the two images is that the camera’s performance was also not affected by perihelion. NASA/University of Arizona/Lockheed MartinThe spacecraft’s clean bill of health was due to creative engineering. Engineers placed OSIRIS-APEX in a fixed orientation with respect to the Sun and repositioned one of its two solar arrays to shade the spacecraft’s most sensitive components during the pass.
The spacecraft is in an elliptical orbit around the Sun that brings it to a point closest to the Sun, called a perihelion, about every nine months. To get on a path that will allow it to meet up with its new target Apophis in 2029, the spacecraft’s trajectory includes several perihelions that are closer to the Sun than the spacecraft’s components were originally designed to withstand.
“It’s phenomenal how well our spacecraft configuration protected OSIRIS-APEX, so I’m really encouraged by this first close perihelion pass,” said Ron Mink, mission systems engineer for OSIRIS-APEX, based at NASA’s Goddard Space Flight Center.
Besides confirming that the January perihelion worked out according to predictions, engineers found surprises while testing spacecraft components. A couple of instruments came out better than expected after exposure to higher temperatures.
A camera that helped map asteroid Bennu and will do the same at Apophis, saw a 70% reduction in “hot pixels” since April 13, 2023, the last time it was tested. Hot pixels, which are common in well-used cameras in space, show up as white spots in images when detectors accumulate exposure to high-energy radiation, mostly from our Sun.
“We think the heat from the Sun reset the pixels through annealing,” said Amy Simon, OSIRIS-APEX project scientist, based at NASA Goddard. Annealing is a heat process that can restore function of instruments and is often done intentionally through built-in heaters on some spacecraft.
Another welcome surprise, said Simon, came from the spacecraft’s visible and near-infrared spectrometer. Before perihelion, the spectrometer, which mapped the surface composition of Bennu, and will do the same at Apophis, seemed to have a rock from Bennu stuck inside its calibration port. Scientist suspected that some sunlight was blocked from filtering through the instrument after the spacecraft, then called OSIRIS-REx, grabbed a sample from asteroid Bennu on Oct. 20, 2020. By picking up the sample and then firing its engines to back away from Bennu, the spacecraft stirred up dust and pebbles that clung to it.
“But, with enough spacecraft maneuvers and engine burns after sample collection,” Simon said, the rock in the calibration port appears to have been dislodged. Scientists will check the spectrometer again when OSIRIS-APEX swings by Earth on Sept. 25, 2025, for a gravitational boost.
OSIRIS-APEX is now operating normally as it continues its journey toward asteroid Apophis for a 2029 rendezvous. Its better-than-expected performance during the first close perihelion is welcome news. But engineers caution that it doesn’t mean it’s time to relax. OSIRIS-APEX needs to execute five more exceptionally close passes of the Sun – along with three Earth gravity assists – to get to its destination. It’s unclear how the cumulative effect of six perihelions at a closer distance than designed will impact the spacecraft and its components.
The second OSIRIS-APEX perihelion is scheduled for Sept. 1. The spacecraft will be 46.5 million miles away from the Sun, which is roughly half the distance between Earth and the Sun, and well inside the orbit of Venus.
OSIRIS-APEX (previously named OSIRIS-REx) is the third mission in NASA’s New Frontiers Program, managed by NASA’s Marshall Space Flight Center in for the agency’s Science Mission Directorate.
NASA Goddard, Maryland Sign Memo to Boost State’s Aerospace Sector
2 min read
Preparations for Next Moonwalk Simulations Underway (and Underwater)To foster growth in Maryland’s aerospace industry, the state’s Department of Commerce signed a Memorandum of Understanding with NASA at the agency’s Goddard Space Flight Center in Greenbelt Wednesday, May 28, 2024.
Center Director Dr. Makenzie Lystrup, Secretary of the Maryland Department of Commerce Kevin Anderson signed a Memorandum of Understanding with Maryland’s Department of Commerce at NASA’s Goddard Space Flight Center in Greenbelt Wednesday, May 28, 2024. NASA/Brian GabourelThe agreement commits the two organizations to develop the state’s aerospace economy, particularly in the area surrounding Goddard’s main Greenbelt campus, as well as on Maryland’s Eastern Shore near NASA’s Wallops Flight Facility in Virginia.
“Our cutting-edge research, and the critical benefits it provides to society, is only possible with the support of strong partnerships outside NASA,” said Goddard Center Director Dr. Makenzie Lystrup, who signed the memo on NASA’s behalf. “I’m grateful to clasp hands with our home state and work together to build up the coalition that will help us all make those next giant leaps.”
Goddard, NASA’s premiere spaceflight complex, hosts the nation’s largest cohort of scientists, engineers, and technologists studying Earth, our solar system, and the universe. Wallops, managed by Goddard for NASA, is the agency’s only owned-and-operated launch range.
“Maintaining and growing Maryland’s strategic advantage in the aerospace industry requires collaboration with our formidable partners at facilities like the Goddard Space Flight Center,” said Maryland Commerce Secretary Kevin Anderson, signing as the state’s representative. “We’re thrilled to sign this agreement, which will support NASA’s innovative work and help make our state more competitive.”
The three-year agreement details how NASA Goddard and the Maryland Department of Commerce will collaborate to promote technology transfer from NASA Goddard to the private sector, STEM education, aerospace industry development, and community outreach. This includes raising awareness of resources such as Small Business Innovation Research (SBIR) and Small Business Technology Transfer (STTR) funding, supporting the creation and growth of new space-related businesses, leading economic development efforts around the two NASA facilities, and collaborating on a report analyzing NASA Goddard’s economic impact in Maryland.
Center Director Dr. Makenzie Lystrup, Secretary of the Maryland Department of Commerce Kevin Anderson signed a Memorandum of Understanding with Maryland’s Department of Commerce at NASA’s Goddard Space Flight Center in Greenbelt Wednesday, May 28, 2024. NASA/Brian GabourelPursuant to the agreement, the Maryland Economic Development Corporation will work with the commerce department and NASA Goddard to host business outreach events in Prince George’s County and on the Lower Eastern Shore.
By Rob Garner
NASA’s Goddard Space Flight Center, Greenbelt, Md.
25 Years Ago: STS-96 Resupplies the Space Station
On May 27, 1999, the second space station assembly and logistics mission began. The main goals of STS-96, designated as the 2A.1 mission in the overall assembly sequence, included resupplying and repairing the fledgling orbital facility, consisting of the Zarya and Node 1 modules assembled during STS-88 in December 1998. The multinational seven-member crew transferred nearly two tons of supplies from the shuttle’s Spacehab double module and water to the crew-tended space station. Two of the astronauts conducted a spacewalk to install equipment on the outside of the facility. The astronauts also conducted repairs inside the station. After six days of docked operations in low Earth orbit, the crew departed the repaired and resupplied space station, making a rare night landing.
Left: The STS-96 crew of Daniel T. Barry, left, Kent V. Rominger, Julie Payette of the Canadian Space Agency, Ellen Ochoa, Valeri I. Tokarev of Roscosmos, Rick D. Husband, and Tammy E. Jernigan. Right: The STS-96 crew patch.
Left: Launch of Discovery on Shuttle mission STS-96. Middle: View of the International Space Station from Discovery during the rendezvous maneuver. Right: The Node 1’s Pressurized Mating Adapter appears in on Discover’s overhead windows just before docking.
The second space shuttle assembly and resupply mission to the space station lifted off just after sunrise on May 27, 1999, from Launch Pad 39B at NASA’s Kennedy Space Center (KSC) in Florida. Its multinational seven-person crew included Commander Kent V. Rominger, Pilot Rick D. Husband, and Mission Specialists Tamara “Tammy” E. Jernigan, Ellen Ochoa, Daniel T. Barry, Julie Payette of the Canadian Space Agency, and Valeri I. Tokarev representing Roscosmos. The flight marked the first time a space crew included three women since STS-40 in 1991. Less than two days after launch, Rominger guided Discovery to the first docking with the two-module space station at the Pressurized Mating Adapter-2 (PMA-2), attached to Node 1. In preparation for the next day’s spacewalk, the astronauts reduced the pressure in the shuttle’s cabin from the usual 14.7 pounds per square inch (psi) to 10.2 psi to reduce the time needed for spacewalkers Jernigan and Barry to breathe pure oxygen to purge their bodies of nitrogen to prevent decompression sickness, also called the bends.
Left: The Orbital Replacement Unit Transfer Device installed on the Pressurized Mating Adapter during the STS-96 spacewalk. Middle: Tamara E. Jernigan carries the Strela boom to the Zarya module. Right: Daniel T. Barry mounts a stowage bag on Node 1.
The day after docking, Jernigan and Barry exited the Shuttle’s airlock to begin one of the flight’s major objectives. From inside the Shuttle, Payette coordinated the spacewalk activities and Ochoa operated the robotic arm to position Jernigan. Jernigan and Barry first installed the American crane, also known as the Orbital Replacement Unit (ORU) Transfer Device onto its socket on PMA-1, the tunnel joining Node 1 and Zarya. Then they moved the Russian Strela boom and installed it on PMA-2. Next, they installed a pair of foot restraints onto PMA-1 and then installed three large tool bags onto Node 1. Jernigan and Barry completed the spacewalk in 7 hours and 55 minutes.
Left: Ellen Ochoa inside the double Spacehab module. Right: Stowage bags transferred into Zarya.
The day after the spacewalk, having repressurized the shuttle cabin to 14.7 psi, the astronauts opened the hatches between the shuttle and the station, first into the PMA-2, then into Node 1, and finally into Zarya. Jernigan and Tokarev entered the station first, and the rest of the crew followed shortly after. Over the course of flight days 5 and 6, Payette and Tokarev replaced all 18 charge/discharge units of Zarya’s six batteries, located under the floor of the module, to improve the batteries’ performance. Husband and Barry repaired the Node 1 S-band radio, part of the station’s early communications system. The entire crew spent the next few days transferring 3,567 pounds of supplies, clothing, sleeping bags, spare parts, medical equipment, and other hardware from the Spacehab double module into the station. They also transferred 84 gallons of water produced by the shuttle’s fuel cells for later use by the station’s first resident crew, then planned for arrival in early 2000. They returned about 200 pounds of items from the station to Discovery. They spent nearly 80 hours inside the station before closing the hatches on June 2, the eighth flight day of the mission. Rominger and Husband pulsed Discovery’s Reaction Control System (RCS) thrusters 17 times to raise the station’s orbit by six miles to 246 by 241 miles.
Left: Battery charge-discharge units in Zarya after replacement. Middle: Inflight photo of the STS-96 crew in Node 1. Right: A resupplied and refurbished space station as seen from Discovery during its departure.
On June 3, with Husband at the controls, Discovery undocked from the space station and completed a 2.5-revolution fly around of the refurbished facility, with the crew taking photographs to document its condition. After departing from the station, Rominger and Husband practiced shuttle landings using a laptop-based simulator in preparation for the actual landing two days later. In addition, the astronauts added to their trove of Earth observation photos.
On flight day 10, the astronauts’ last full day in space, they deployed the Student-Tracked Atmospheric Research Satellite for Heuristic International Networking Equipment (STARSHINE) satellite from Discovery’s payload bay. STARSHINE consisted of an 87-pound hollow aluminum sphere 19 inches in diameter covered with 878 mirrors. Thousands of students in 18 countries polished the mirrors. The Naval Research Laboratory in Washington, D.C. built the sphere and attached the mirrors. The students monitored sightings of the satellite as it orbited the Earth, the Sun reflecting off its multiple mirrors. The astronauts tested Discovery’s RCS thrusters, Auxiliary Power Units, and Flight Control Surfaces in preparation for the next day’s re-entry and landing.
Earth observation photographs from STS-96. Left: The Manicougan impact feature in Québec, Canada. Middle: The Straits of Gibraltar. Right: Sunlit clouds over the Indian Ocean.
Left: Deployment of the STARSHINE student satellite. Right: Discovery makes a smooth night landing at NASA’s Kennedy Space Center in Florida.
On June 6, the astronauts closed Discovery’s payload bay doors, put on their launch and entry suits, strapped into their seats, and fired the Shuttle’s engines for the trip back to Earth. Rominger guided Discovery to a smooth night landing on the Shuttle Landing Facility at KSC, ending a highly successful mission to prepare the space station for future occupants. The flight lasted 9 days 19 hours 13 minutes.
Enjoy the crew narrate a video about the STS-96 mission.
Explore More 6 min read 15 Years Ago: First Time all Partners Represented aboard the International Space Station Article 1 day ago 18 min read 40 Years Ago: NASA Selects its 10th Group of Astronauts Article 6 days ago 21 min read 55 Years Ago: Two Months Until the Moon Landing Article 1 week agoHistoric Marker Celebrates NASA Kennedy’s Old Center Headquarters
A grass field and tile display of NASA’s iconic “meatball” is all that remains of the structure that stood for over 50 years during America’s most monumental launches to space. Now, a large bronze plaque at the agency’s Kennedy Space Center in Florida marks the location of this original headquarters building, commemorating the early days of space exploration.
Approved in April 2023 as part of the State of Florida’s Historical Markers program, the marker was unveiled Tuesday, May 28, 2024, by center leaders during a ceremony attended by former and current NASA employees as part of National Historic Preservation Month.
“As we surge into the future, it’s appropriate to take a moment and remember the past,” said Kennedy Space Center Director Janet Petro. “We wouldn’t be at the forefront of space exploration without those whose footsteps we followed and it’s important that their service be properly honored. But we also focus on the future of the spaceport so that it will always maintain our path to space.”
The new marker will be displayed permanently just west of the seven-story, 200,000 square foot Central Campus Headquarters Building on NASA Parkway, which replaced the old building in 2019. The more modern headquarters was built with the center’s master plan in mind, prioritizing efficiencies in cost, energy, and land usage to ensure NASA puts as much resources as possible toward its mission.
Various artifacts from the old building were removed before its demolition and are now displayed in the new headquarters, including its original sign and a bust of President John F. Kennedy, after whom the center is named.
Wall tiles from Kennedy Space Center’s former headquarters building are presented to Kennedy Director Janet Petro inside the Florida spaceport’s Central Campus Headquarters Building on May 3, 2022. The two 15-pound sections from the building were preserved by Maverick Constructors LLC, the construction company that completed demolition of the structure. The company’s presentation of the tiles is in honor of the many civil servants and contractors who dedicated their lives to working for and supporting NASA in this building.Photo credit: NASA/Frank MichauxConstructed in 1965, Kennedy’s original four-story headquarters building became the scientific, engineering, and administrative hub for three of NASA’s most iconic space programs: Gemini, Apollo, and Space Shuttle. Designed in the International Style, the 440,000 square foot structure had an intimate view of some of NASA’s grandest moments, including the launch of the Apollo 11 mission that successfully landed the first humans on the moon in 1969, fulfilling the goal famously set by President Kennedy seven years earlier.
Other major NASA milestones accomplished during the building’s lifetime include the 1973 launch of Skylab, the first-ever space meeting of American astronauts and Russian cosmonauts in 1975, the 1990 launch of the Hubble Space Telescope, and the construction of the International Space Station in 1998.
Prior to its demolition, the old headquarters was listed in the National Register of Historic Places in 2000. It is the first original NASA center headquarters building to be demolished.
The original headquarters ground becomes the seventh location within the Merritt Island National Wildlife Refuge and Canaveral National Seashore to have a marker approved by the Florida Historic Marker Council. It joins three others within Cape Canaveral Space Force Station and three more located on Kennedy Parkway. It is the only one of the seven inside Kennedy’s secure area.
Swarming for Success: Starling Completes Primary Mission
5 min read
Preparations for Next Moonwalk Simulations Underway (and Underwater) The four CubeSate spacecraft that make up the Starling swarm have demonstrated success in autonomous operations, completing all key mission objectives.After ten months in orbit, the Starling spacecraft swarm successfully demonstrated its primary mission’s key objectives, representing significant achievements in the capability of swarm configurations.
Swarms of satellites may one day be used in deep space exploration. An autonomous network of spacecraft could self-navigate, manage scientific experiments, and execute maneuvers to respond to environmental changes without the burden of significant communications delays between the swarm and Earth.
“The success of Starling’s initial mission represents a landmark achievement in the development of autonomous networks of small spacecraft,” said Roger Hunter, program manager for NASA’s Small Spacecraft Technology program at NASA’s Ames Research Center in California’s Silicon Valley. “The team has been very successful in achieving our objectives and adapting in the face of challenges.”
Sharing the WorkThe Distributed Spacecraft Autonomy (DSA) experiment, flown onboard Starling, demonstrated the spacecraft swarm’s ability to optimize data collection across the swarm. The CubeSats analyzed Earth’s ionosphere by identifying interesting phenomena and reaching a consensus between each satellite on an approach for analysis.
By sharing observational work across a swarm, each spacecraft can “share the load” and observe different data or work together to provide deeper analysis, reducing human workload, and keeping the spacecraft working without the need for new commands sent from the ground.
The experiment’s success means Starling is the first swarm to autonomously distribute information and operations data between spacecraft to generate plans to work more efficiently, and the first demonstration of a fully distributed onboard reasoning system capable of reacting quickly to changes in scientific observations.
Communicating Across the SwarmA swarm of spacecraft needs a network to communicate between each other. The Mobile Ad-hoc Network (MANET) experiment automatically established a network in space, allowing the swarm to relay commands and transfer data between one another and the ground, as well as share information about other experiments cooperatively.
The team successfully completed all the MANET experiment objectives, including demonstrating routing commands and data to one of the spacecraft having trouble with space to ground communications, a valuable benefit of a cooperative spacecraft swarm.
“The success of MANET demonstrates the robustness of a swarm,” said Howard Cannon, Starling project manager at NASA Ames. “For example, when the radio went down on one swarm spacecraft, we ‘side-loaded’ the spacecraft from another direction, sending commands, software updates, and other vital information to the spacecraft from another swarm member.”
Autonomous Swarm NavigationNavigating and operating in relation to one another and the planet is an important part of forming a swarm of spacecraft. Starling Formation-Flying Optical Experiment, or StarFOX, uses star trackers to recognize a fellow swarm member, other satellite, or space debris from the background field of stars, then estimate each spacecraft’s position and velocity.
The experiment is the first-ever published demonstration of this type of swarm navigation, including the ability to track multiple members of a swarm simultaneously and the ability to share observations between the spacecraft, improving accuracy when determining each swarm member’s orbit.
Near the end of mission operations, the swarm was maneuvered into a passive safety ellipse, and in this formation, the StarFOX team was able to achieve a groundbreaking milestone, demonstrating the ability to autonomously estimate the swarm’s orbits using only inter-satellite measurements from the spacecraft star trackers.
Managing Swarm ManeuversThe ability to plan and execute maneuvers with minimal human intervention is an important part of developing larger satellite swarms. Managing the trajectories and maneuvers of hundreds or thousands of spacecraft autonomously saves time and reduces complexity.
The Reconfiguration and Orbit Maintenance Experiments Onboard (ROMEO) system tests onboard maneuver planning and execution by estimating the spacecraft’s orbit and planning a maneuver to a new desired orbit.
The experiment team has successfully demonstrated the system’s ability to determine and plan a change in orbit and is working to refine the system to reduce propellant use and demonstrate executing the maneuvers. The team will continue to adapt and develop the system throughout Starling’s mission extension.
Swarming TogetherNow that Starling’s primary mission objectives are complete, the team will embark on a mission extension known as Starling 1.5, testing space traffic coordination in partnership with SpaceX’s Starlink constellation, which also has autonomous maneuvering capabilities. The project will explore how constellations operated by different users can share information through a ground hub to avoid potential collisions.
“Starling’s partnership with SpaceX is the next step in operating large networks of spacecraft and understanding how two autonomously maneuvering systems can safely operate in proximity to each other. As the number of operational spacecraft increases each year, we must learn how to manage orbital traffic,” said Hunter.
NASA’s Small Spacecraft Technology program, based at Ames and within NASA’s Space Technology Mission Directorate (STMD), funds and manages the Starling mission. Blue Canyon Technologies designed and manufactured the spacecraft buses and is providing mission operations support. Rocket Lab USA, Inc. provided launch and integration services. Partners supporting Starling’s payload experiments have included Stanford University’s Space Rendezvous Lab in Stanford, California, York Space Systems (formerly Emergent Space Technologies) of Denver, Colorado, CesiumAstro of Austin, Texas, L3Harris Technologies, Inc., of Melbourne, Florida. Funding support for the DSA experiment was provided by NASA’s Game Changing Development program within STMD. Partners supporting Starling’s mission extension include SpaceX of Hawthorne, California, NASA’s Conjunction Assessment Risk Analysis (CARA) program, and the Department of Commerce. SpaceX manages the Starlink satellite constellation and the Collision Avoidance ground system.
Share Details Last Updated May 29, 2024 Related Terms Explore More 2 min read Follow NASA’s Starling Swarm in Real Time Article 7 months ago 6 min read NASA’s Starling Mission Sending Swarm of Satellites into Orbit Article 11 months ago Keep Exploring Discover Related TopicsAmes Research Center
Space Technology Mission Directorate
Starling
Game Changing Development
Travel Through Data From Space in New 3D Instagram Experiences
A new project provides special 3D “experiences” on Instagram using data from NASA’s Chandra X-ray Observatory and other telescopes through augmented reality (AR), allowing users to travel virtually through objects in space. These new experiences of astronomical objects – including the debris fields of exploded stars – are being released to help celebrate the 25th anniversary of operations from Chandra, NASA’s flagship X-ray telescope.
In recent years, Instagram experiences (previously referred to as filters) of NASA mission control, the International Space Station, and the Perseverance Rover on Mars have allowed participants to virtually explore what NASA does. This new set of Chandra Instagram filters joins this space-themed collection.
These four images showcase the 2D captured views of the cosmic objects included in the new augmented reality 3D release. Presenting multiwavelength images of the Vela Pulsar, Tycho’s Supernova Remnant, Helix Nebula, and Cat’s Eye Nebula that include Chandra X-ray data as well as optical data in each, and for the Helix, additional infrared and ultraviolet data.Vela Pulsar: X-ray: NASA/CXC/SAO; Optical: NASA/ESA/STScI; Image processing: NASA/CXC/SAO/J. Schmidt, K. Arcand; Tycho’s Supernova Remnant: X-ray: NASA/CXC/SAO; Optical: DSS; Image Processing: NASA/CXC/SAO/N. Wolk; Helix Nebula: X-ray: NASA/CXC/SAO; UV: NASA/JPL-Caltech/SSC; Optical: NASA/ STScI/M. Meixner, ESA/NRAO/T.A. Rector; Infrared:NASA/JPL-Caltech/K. Su; Image Processing: NASA/CXC/SAO/N. Wolk and K. Arcand; Cat’s Eye Nebula: X-ray: NASA/CXC/SAO; Optical: NASA/ESA/STScI; Image Processing: NASA/CXC/SAO/J. Major, L. Frattare, K. Arcand“We are excited to bring data from the universe down to earth in this way,” said Kimberly Arcand, visualization and emerging technology scientist at the Chandra X-ray Center. “By enabling people to access cosmic data on their phones and through AR, it brings Chandra’s amazing discoveries literally right to your fingertips.”
The new Instagram experiences are created from 3D models based on data collected by Chandra and other telescopes along with mathematical models. Traditionally, it has been very difficult to gather 3D data of objects in our galaxy due to their two-dimensional projection on the sky. New instruments and techniques, however, have helped allowed astronomers in recent years to construct more data-driven models of what these distant objects look like in three dimensions.
These advancements in astronomy have paralleled the explosion of opportunities in virtual, extended, and augmented reality. Such technologies provide virtual digital experiences, which now extend beyond Earth and into the cosmos. This new set of Chandra Instagram experiences was made possible by a collaboration including NASA, the Smithsonian Institution, and students and researchers at Brown University.
These Instagram experiences also include data sonifications of the celestial objects. Sonification is the process of translating data into sounds and notes so users can hear representations of the data, an accessibility project the Chandra team has led for the past four years.
“These Chandra Instagram experiences are another way to share these cosmic data with the public,” said Arcand. “We are hoping this helps reach new audiences, especially those who like to get their information through social media.”
The objects in the new Chandra Instagram experience collection include the Tycho supernova remnant, the Vela Pulsar, the Helix Nebula, the Cat’s Eye Nebula, and the Chandra spacecraft. The 3D models of the first three objects were done in conjunction with Sal Orlando, an astrophysicist at Italy’s National Institute for Astrophysics (INAF) in Palmero. The Cat’s Eye Nebula was created with data from Ryan Clairmont, physics researcher and undergraduate at Stanford University. Arcand worked with Brown’s Tom Sgouros and his team, research assistant Alexander Dupuis and undergraduate Healey Koch, on the Chandra Instagram filters.
The experiences include text that explains what users are looking at. The effects are free and available on Instagram on mobile devices for at least six months, and some will remain viewable in perpetuity on the Smithsonian’s Voyager 3D website.
“There is a lot of rich and beautiful data associated with these models that Healey and I looked to bring in, which we did by creating the textures on the models as well as programming visual effects for displaying them in AR,” said Dupuis.
NASA’s Marshall Space Flight Center manages the Chandra program. The Smithsonian Astrophysical Observatory’s Chandra X-ray Center controls science from Cambridge Massachusetts and flight operations from Burlington, Massachusetts. The Chandra X-ray Center is headquartered at the Smithsonian Astrophysical Observatory, which is part of the Center for Astrophysics | Harvard & Smithsonian.
Read more from NASA’s Chandra X-ray Observatory.
For more Chandra images, multimedia and related materials, visit:
https://www.nasa.gov/mission/chandra-x-ray-observatory/
News Media ContactMegan Watzke
Chandra X-ray Center
Cambridge, Mass.
617-496-7998
Jonathan Deal
Marshall Space Flight Center
Huntsville, Ala.
256-544-0034
In Memoriam: Dr. Richard S. Stolarski [1941–2024]
7 min read
In Memoriam: Dr. Richard S. Stolarski [1941–2024] Photo. Dr. Richard (Rich) Stolarski in February, 1989 at the NASA Arctic Airborne Stratospheric Experiment (AASE-I) in Stavanger, Norway. Rich is seen here describing model results from the GSFC chemistry model. Photo credit: Paul Newman/NASARenowned ozone scientist Dr. Richard “Rich” Stolarski died on February 22, 2024, at age 82 from the complications of prostate cancer. Rich was born at Fort Lewis, WA on November 22, 1941. After short stays in Kansas and Hawaii, Rich’s family settled in Tacoma, WA. He attended Stadium High School for three years and Wilson High School for his final year. He received his Bachelor of Science in physics and mathematics from the University of Puget Sound in 1963 and his Ph.D. from the University of Florida three years later in 1966 under Professor Alex Green. Rich was a University of Michigan post-doctoral fellow from 1967 – 1974 under Professor Andrew Nagy, where he met his colleague and friend Dr. Ralph Cicerone.
Rich joined NASA in 1974 at the Manned Space Center (now the Johnson Space Center) as a research physicist in the Environmental Effects Projects Office. He moved to NASA’s Goddard Space Flight Center (GSFC) in 1976 to join the fledgling Stratospheric Physics and Chemistry Branch. Rich was branch head (1979 – 1985) and a research scientist (1985 – 2010). He was the Program Scientist for the Atmospheric Effects of the Stratospheric Aircraft program at NASA headquarters from 1992 to 1995. From 2010 until his passing, Rich was a NASA Goddard Emeritus scientist and a Research Professor in the Department of Earth and Planetary Sciences at Johns Hopkins University.
Rich’s atmospheric science career began during a period of great ferment. A proposed fleet of supersonic transport aircraft (SSTs) was being researched in the early 1970s, and scientists had proposed that nitrogen emissions from SST engines could deplete the Earth’s ozone layer. In 1974, Rich and Ralph Cicerone published their groundbreaking paper showing that reactive chlorine compounds derived from emissions by the NASA space shuttle could also deplete the ozone layer. Mario Molina and Sherry Rowland independently proposed that reactive chlorine could destroy ozone, and further hypothesized that human-produced chlorofluorocarbons (CFCs) would be a source of reactive chlorine compounds. Molina and Rowland shared the 1995 Nobel Prize in chemistry for this work, and Stolarski and Cicerone were cited in the Royal Swedish Academy of Science’s press release for their contributions. Rich was awarded the United Nations Environmental Program’s Ozone Award in 1997, where “Dr. Ralph J. Cicerone and Dr. Richard S. Stolarski were the first to indicate the important role of chlorine monoxide in stratospheric ozone depletion.”
The severe ozone decline over Antarctica discovered by British Antarctic Survey scientists in the 1980s was simultaneously shocking, disturbing, and exciting. In parallel, Dr. P. K. Bhartia and others were examining extremely low ozone values measured by the Total Ozone Mapping Spectrometer (TOMS) aboard NASA’s Nimbus–7 satellite. Rich and colleagues found that TOMS showed that this severe Antarctic ozone decline was continental in scale, publishing the first paper on satellite observations of this ozone depletion. This rapid ozone decline combined with the continental scale led to the coining of the name “Antarctic Ozone Hole” to describe the phenomenon. The ozone hole’s appearance did not directly lead to the finalizing of the “Montreal Protocol on Substances that Deplete the Ozone Layer” (now signed by every nation on Earth), but it likely influenced negotiations for the treaty and supported later strengthening of the protocol with amendments in 1990 and 1992. Subsequent work showing that chlorine-containing substances were causing the ozone hole led to a complete banning of CFCs in 2010. Rich’s work on the Antarctic ozone hole was cited in his 2007 NASA Goddard Scientific Research Award as “… one of the most important papers in atmospheric science in the second half of the twentieth century.” Rich also received NASA’s Exceptional Achievement Medal for his ozone hole research and was named a Fellow of the American Geophysical Union in 1996.
Rich continued his ozone layer research, contributing to the development of trend-quality data sets. In 1991 he published a seminal paper on ozone trends that showed the unambiguous decline of the ozone layer. In this paper he carefully removed “natural” ozone variations to reveal a steady downward ozone trend. Rich was recognized in 1991 by the U.S. Environmental Protection Agency’s Ozone Protection Award for being “… a leader in the verification of ozone depletion from observational data.”
Assessments of ozone depletion are written reports from scientists that provide the foundation for the international Montreal Protocol and Vienna Convention. While many “national” reports were written following Rich’s 1974 paper, there was no international consensus. In December 1980, Rich led an international-based scientific summary of the stratosphere and an assessment of human impact on the ozone layer. This was followed by the 1985 three-volume international report (Atmospheric Ozone: 1985) in which Rich helped write the introduction as well as provide model contributions, reviews, and edits of the report. Ozone 1985 was the scientific basis for the landmark Montreal Protocol. Rich contributed to assessments in 1988, 1989, 1991, 1994, 1998, 2002, 2006, 2010, and 2014 in several roles. Rich attended many of the Les Diableret meetings where the primary executive summaries for Montreal Protocol policy makers were written. Rich’s calm influence and careful science statements at those meetings helped produce clear and consistent messages for the nations of the world in their Montreal Protocol deliberations.
Rich’s modeling contributions began with one dimensional models (height) in the 1970s, evolving to height – latitude models in the 1980s, and fully three-dimensional models late in his career. He was expert at identifying the processes that controlled the simulated ozone distribution and its response to natural and human-produced perturbations. Late in his career at NASA, Rich took on the challenge of leading NASA Goddard’s chemistry–climate modeling project. Rich applied his strengths to this project, making sure that it focused on the scientific questions of the day and examining how ozone changes impact the temperature and dynamics of the stratosphere and troposphere. In 2009, Rich was awarded the NASA Robert H. Goddard Award of Merit, in part for having “… pioneered a new initiative in the model of the coupling of chemistry and climate, utilizing the GMAO climate model, and involving a large number of Goddard and outside scientists.”
In the 1990s the World Climate Research Program’s (WCRP) Stratospheric Processes effort was emerging, drawing together scientists from many nations to discuss our evolving understanding of the ozone layer. As an important contributor to conferences and summer schools organized by this WCRP effort, Rich could be found in the center of a crowd of early career scientists, discussing ozone, science, and life, thus fostering the next generation of leaders. He was elected a member of the International Ozone Commission (IO3C) in 1996, became the IO3C vice-president in 2008, and was elected as an “Honorary IO3C Member” in 2016.
Papers, citations, and awards are performance measures that rarely fully capture the totality of a scientist’s contribution and clearly fail to capture the essence of a life. Rich had an extremely distinguished science career with 155 publications in refereed science journals and 63 additional publications in other reports and science documents. Rich was a quick thinker with a curiosity and a love of learning that never faded. He was particularly adept at the use of models and analysis to identify the processes that control the ozone distribution, the interplay between chemical reactions and transport, and applying his knowledge to understand the stratospheric response to anthropogenic changes in composition and climate. He was a selfless contributor and an excellent collaborator. He was a friend and mentor to many, and through his mentorship his legacy will continue.
In addition to his scientific family, Rich is survived by his beloved wife of 59 years, Shirley Stolarski; daughter Susan Stolarski Datta and her husband Joy of Charleston, SC; son Steven Stolarski and his wife Vanessa of Purcellville, VA; three grandchildren, Kellen Datta, and Zachary and Maxwell Stolarski; brother Bob Stolarski and his wife Jean of Dewey, AZ; and brother-in-law Bob Jewett and his wife Janet of Loveland, CO.
Acknowledgments: The Earth Observer staff wishes to thank Paul A. Newman [GSFC] and Anne Douglass [GSFC, emeritus] for writing this In Memoriam.
Summary of the Fifty-Second U.S.–Japan ASTER Science Team Meeting
8 min read
Summary of the Fifty-Second U.S.–Japan ASTER Science Team MeetingMichael Abrams, NASA/Jet Propulsion Laboratory/California Institute of Technology, mjabrams@jpl.nasa.gov
Yasushi Yamaguchi, Nagoya University/Japan Science and Technology Agency, yasushi@nagoya-u.jp
Introduction
The Advanced Spaceborne Thermal Emission and Reflection Radiometer (ASTER) Science Team (ST) organized a three-day workshop that took place September 11–13, 2023, at the offices of Japan Space Systems (JSS) in Tokyo. Over 40 people from Japan and the U.S. participated in the in-person meeting—some of whom are shown in the Photo below. U.S. participants included members from NASA/Jet Propulsion Laboratory (JPL), NASA’s Land Processes Distributed Active Archive Center (LPDAAC), NASA’s Goddard Space Flight Center (GSFC), University of Arizona (UA), Grace Consulting (GC), and University of Pittsburgh (Pitt). Japanese members included representatives from JSS, Ibaraki University (IU), Nagoya University (NU), University of Tokyo (UT), Geologic Survey of Japan (GSJ), National Institute of Advanced Industrial Science and Technology (AIST), University of Tsukuba (UTs), and Remote Sensing Technology Center of Japan (RESTEC).
The meeting objectives focused on discussing impacts of the 50% budget reductions to the Terra mission (including ASTER) that have been proposed in the NASA Budget for Fiscal Years (FY) 2024–26; revised spacecraft management protocols by the Flight Operations Team; data acquisition status; data calibration and validation; data distribution; status of Level-1 processing interruption; applications; and end-of-mission plans. After summarizing the opening plenary presentations, the remainder of this article provides highlights from meetings of the various ASTER working groups and the closing plenary session.
Photo. Some of the attendees at the fifty-second ASTER STM. Photo credit: Mako Komoda, JSSOpening Plenary Session
Yasushi Yamaguchi [NU] and Michael Abrams [JPL—ASTER ST Leaders from Japan and the U.S., respectively] welcomed participants and reviewed the agenda for the opening plenary and the schedule for the week’s working groups.
Akira Tsuneto [AIST—Vice President], whose office is responsible for the ASTER project, presented a special welcome. As the former Director of Space Industry Office in the Japan Ministry of Economy, Trade and Industry (METI), he was responsible for making ASTER data free to all users.
Michael Abrams [JPL] presented Jason Hendrickson’s [GSFC] slides on the operations status of NASA’s Terra platform—which has changed significantly since the last meeting. The Earth Science Mission Operations (ESMO) Flight Operations Team began implementing “Lights Out Operation,” reducing staff from 24/7 coverage and eliminating the night shift. These changes resulted in a small increase in data gaps and delayed anomaly response. In early 2023 Terra lost two of its 24 solar array shunts. Full power capability remains—however, there is only one spare shunt remaining. Those issues notwithstanding, Terra remains healthy after more than 23 years of operation.
Chris Torbert [LPDAAC] presented ASTER product distribution statistics. The ASTER Global Digital Elevation Model (DEM) continues to be the most ordered product. Torbert discussed the ASTER Preservation Content Specification for the end-of-mission archiving. There is a NASA document that describes the desired content of this archive. As described by the ST at the last meeting, most ASTER data products will be created as real files and placed in a searchable and orderable archive, accessed through NASA’s Earthdata tool, where mission preservation documents for other instruments (e.g., HIRDLS, ICESat/GLAS, TOMS) can be found.
Michael Abrams [JPL] presented highlights of science results based on ASTER data—including the 2023 Earth Science Senior Review. Terra presented its report to NASA Headquarters, but as of this meeting, the response is still pending. However, as stated earlier, a three-year budget reduction of 50% is anticipated.
Hitomi Inada [JSS] presented the status of the ASTER instrument. Although many of the monitored components [e.g., visible-near-infrared (VNIR) pointing motor] have exceeded their original useful life in orbit, they show no signs of decreases in performance. All temperature and current telemetry trends remain straight lines.
Tetsushi Tachikawa [JSS] summarized the status of ASTER observations since the beginning of the mission. He reported that all of the global observation programs are functioning normally, acquiring data as planned. The change of the orbit repeat after the October 2022 constellation exit maneuver has been accommodated in the ASTER scheduler.
Simon Hook [JPL] described the status of the multispectral thermal infrared (TIR) instrument on the ECOsystem Spaceborne Thermal Radiometer Experiment on Space Station (ECOSTRESS) as well as NASA’s future Surface Biology and Geology (SBG) mission, which is part of the planned Earth System Observatory.
Applications Working Group
The applications session offered a sample of the variety of applications that make use of data from ASTER, see examples below. Miyuki Muto [IU] shared her work to estimate the volume of waste in 19 landfills in 11 countries through analysis of ASTER DEM data over the past 20 years. Analysis of data from a site in India showed that the volume of waste increased four-fold over 20 years—see Figure 1. All the other monitored sites showed similar large increases in waste volume.
Figure 1. Google Earth Image of landfill in India [top] and temporal changes in volume from 2001 to 2021 [bottom]. Figure credit: Miyuki Muto and Hideyuki Tonooka, IU Figure credit: Miyuki Muto and Hideyuki Tonooka, IUMichael Ramsey [Pitt] discussed detecting volcanic eruption precursors using the entire ASTER TIR archive for six selected volcanoes: Etna, Fuego, Kliuchevskoi, Lascar, Vulcano, and Popocatepetl—four of these are shown in Figure 2. He and his students developed statistical methods to detect both low- and high-temperature anomalies. The team performed a cluster analysis on four volcanoes. By calculating and plotting heat flux versus mean temperature-above-background versus maximum temperature-above-background, clusters for eruption styles can be identified—see Figure 2. These results offer potential applicability to other volcanoes.
Figure 2. Three-dimensional plots show heat flux and temperature plots (further explained in the text) for hundreds of ASTER TIR scenes for four volcanoes, revealing differences related to eruptive styles. The lower cluster (blue) indicated fumarole and passive degassing; the medium cluster (red) correlated with domes and explosive and small lava flows; and the high clusters (green) correlated with large lava flows. Figure credit: Michael Ramsey/PittCalibration/Validation Working Group
This working group monitors the radiometric performance of ASTER’s VNIR and TIR instruments. The team performs calibration and validation of these instruments by analysis of onboard calibration lamps or blackbody, as well as measurements of pseudo-invariant ground targets during field campaigns. No changes in instrument performance were found based on validation activities during the past year. The radiometric calibration coefficients will remain unchanged for the foreseeable future.
Temperature–Emissivity Working Group
The Temperature–Emissivity Working Group focuses on ASTER’s kinetic temperature and emissivity (T–E) products and their applications, including monitoring instrument performance and calibration. They also review the status of the nighttime TIR global map program. In situ measurement campaigns in Japan and the U.S. use lakes and dry lake beds for ground-based calibration campaigns. Recent campaign results indicate that the TIR instrument perform within required calibration limits—see Figure 3. The team also noted the successful completion of the Visible Infrared Imaging Radiometer Suite (VIIRS)–ASTER 375-m (~1230-ft) near-real-time land-surface temperature algorithm using ASTER emissivity for corrections. Review of the thermal global mapping acquisition program indicated that it was proceeding as planned with no changes needed.
Figure 3. ASTER and Landsat 8 and 9 data provide a way to compare the satellite-derived temperature and lake surface measured temperature. ASTER mean difference for all five bands is less than 0.5 °C (~0.9 °F). On the Y axis, BT stands for Brightness Temperature. Figure credit: Remote Sensing Technology Center of Japan/Soushi Kato Figure credit: Remote Sensing Technology Center of Japan/Soushi KatoOperations and Mission Planning Working Group
The Operations and Mission Planning working group oversees and reviews the acquisition programs executed by the ASTER scheduler. The working group schedules ASTER data acquisitions daily to accommodate ASTER’s average 8% duty cycle. An automated program selects 600–700 daily scenes from the more than 3000 in the request archive.
Tetsushi Tachikawa [JSS] reviewed the status of acquisition scheduling. Urgent observations receive the highest priority and can be scheduled close to acquisition time. Approximately 70 scenes are programmed per month—with over 95% acquisition success. By contrast, global mapping data acquisitions receive the lowest priority and fill in the scenes for the daily quota. The objective is for ASTER to acquire at least one cloud-free image for every place on Earth. Due to persistent cloud cover, success is typically ~85%. The group restarts the program after several years, with the next scheduled restart in October 2024. The thermal group submits aerial requirements to acquire global nighttime coverage with the thermal bands, which will continue as scheduled. There are also acquisition programs that focus on islands, volcanoes, glaciers, and cloudy areas. The global volcano image acquisition program will continue with no change to the observation parameters. Acquisition of images of islands and over cloudy areas will also continue in current form. The global glacier acquisition program will be modified to change the VNIR gain settings to optimize images over snow and ice.
Chris Torbert [LPDAAC] reported that software fixes were ongoing for the (currently non-functional) expedited data processing at the LPDAAC.
Closing Plenary Session
Each working group chairperson summarized the presentations, discussions, and recommendations that occurred during each session. Consensus holds the ASTER instrument is operating normally, with no indications of any component failures. The backlog of unprocessed scenes resulting from the 2022 constellation exit maneuver impact on production software should clear by early October 2023. The closing highlighted the impact of the 50% budget reduction on the Flight Operation Team at GSFC with only a small increase in lost data (1–2%) due to the absence of operators to attempt immediate recovery.
Conclusion
The fifty-second ASTER ST Meeting successfully covered all of the critical issues introduced during the opening plenary session. Working groups updated instrument scheduling, instrument performance, archiving plans, and new applications. The plan is for the 2024 meeting to take place at the same venue in Tokyo.
NASA Lucy Images Reveal Asteroid Dinkinesh to be Surprisingly Complex
4 min read
Preparations for Next Moonwalk Simulations Underway (and Underwater)Images from the November 2023 flyby of asteroid Dinkinesh by NASA’s Lucy spacecraft show a trough on Dinkinesh where a large piece — about a quarter of the asteroid — suddenly shifted, a ridge, and a separate contact binary satellite (now known as Selam). Scientists say this complicated structure shows that Dinkinesh and Selam have significant internal strength and a complex, dynamic history.
Panels a, b, and c each show stereographic image pairs of the asteroid Dinkinesh taken by the NASA Lucy Spacecraft’s L’LORRI Instrument in the minutes around closest approach on Nov. 1, 2023. The yellow and rose dots indicate the trough and ridge features, respectively. These images have been sharpened and processed to enhance contrast. Panel d shows a side view of Dinkinesh and its satellite Selam taken a few minutes after closest approach.NASA/GSFC/SwRI/Johns Hopkins APL/NOIRLab“We want to understand the strengths of small bodies in our solar system because that’s critical for understanding how planets like Earth got here,” said Hal Levison, Lucy principal investigator at the Boulder, Colorado, branch of the Southwest Research Institute in San Antonio, Texas. “Basically, the planets formed when zillions of smaller objects orbiting the Sun, like asteroids, ran into each other. How objects behave when they hit each other, whether they break apart or stick together, has a lot to do with their strength and internal structure.” Levison is lead author of a paper on these observations published May 29 in Nature.
On November 1, 2023, NASA’s Lucy spacecraft flew by the main-belt asteroid Dinkinesh. Now, the mission has released pictures from Lucy’s Long Range Reconnaissance Imager taken over a roughly three-hour period, providing the best views of the asteroid to date. During the flyby, Lucy discovered that Dinkinesh has a small moon, which the mission named “Selam,” a greeting in the Amharic language meaning “peace.” Lucy is the first mission designed to visit the Jupiter Trojans, two swarms of asteroids trapped in Jupiter’s orbit that may be “fossils” from the era of planet formation. Credit: NASA’s Goddard Space Flight Center. Download this video and more at: https://svs.gsfc.nasa.gov/14596/Researchers think that Dinkinesh is revealing its internal structure by how it has responded to stress. Over millions of years rotating in the sunlight, the tiny forces coming from the thermal radiation emitted from the asteroid’s warm surface generated a small torque that caused Dinkinesh to gradually rotate faster, building up centrifugal stresses until part of the asteroid shifted into a more elongated shape. This event likely caused debris to enter into a close orbit, which became the raw material that produced the ridge and satellite.
Stereo movie of asteroid Dinkinesh from NASA’s Lucy spacecraft flyby on Nov. 1, 2023.NASA/GSFC/SwRI/Johns Hopkins APL/NOIRLab/Brian May/Claudia ManzoniIf Dinkinesh were much weaker, more like a fluid pile of sand, its particles would have gradually moved toward the equator and flown off into orbit as it spun faster. However, the images suggest that it was able to hold together longer, more like a rock, with more strength than a fluid, eventually giving way under stress and fragmenting into large pieces. (Although the amount of strength needed to fragment a small asteroid like Dinkinesh is miniscule compared to most rocks on Earth.)
“The trough suggests an abrupt failure, more an earthquake with a gradual buildup of stress and then a sudden release, instead of a slow process like a sand dune forming,” said Keith Noll of NASA’s Goddard Space Flight Center in Greenbelt, Maryland, project scientist for Lucy and a co-author of the paper.
“These features tell us that Dinkinesh has some strength, and they let us do a little historical reconstruction to see how this asteroid evolved,” said Levison. “It broke, things moved apart and formed a disk of material during that failure, some of which rained back onto the surface to make the ridge.”
The researchers think some of the material in the disk formed the moon Selam, which is actually two objects touching each other, a configuration called a contact binary. Details of how this unusual moon formed remain mysterious.
Stereo movie of Selam from NASA’s Lucy spacecraft flyby on Nov. 1, 2023.NASA/GSFC/SwRI/Johns Hopkins APL/NOIRLab/Brian May/Claudia ManzoniDinkinesh and its satellite are the first two of 11 asteroids that Lucy’s team plans to explore over its 12-year journey. After skimming the inner edge of the main asteroid belt, Lucy is now heading back toward Earth for a gravity assist in December 2024. That close flyby will propel the spacecraft back through the main asteroid belt, where it will observe asteroid Donaldjohanson in 2025, and then on to the first of the encounters with the Trojan asteroids that lead and trail Jupiter in its orbit of the Sun beginning in 2027.
Lucy’s principal investigator is based out of the Boulder, Colorado, branch of Southwest Research Institute, headquartered in San Antonio. NASA’s Goddard Space Flight Center in Greenbelt, Maryland, provides overall mission management, systems engineering, and safety and mission assurance. Lockheed Martin Space in Littleton, Colorado, built and operates the spacecraft. Lucy is the 13th mission in NASA’s Discovery Program. NASA’s Marshall Space Flight Center in Huntsville, Alabama, manages the Discovery Program for the Science Mission Directorate at NASA Headquarters in Washington.
For more information about NASA’s Lucy mission, visit:
https://science.nasa.gov/mission/lucy
Share Details Last Updated May 29, 2024 EditorWilliam SteigerwaldContactWilliam Steigerwaldwilliam.a.steigerwald@nasa.govLocationGoddard Space Flight Center Related Terms Explore More 1 min read What are the Trojan Asteroids? We Asked a NASA ScientistWhat are the Trojan asteroids? These mysterious space rocks have been gravitationally trapped in Jupiter’s…
Article 2 years ago 3 min read Asteroid Fast Facts Article 10 years ago 13 min read NASA’s Lucy Mission: A Journey to the Young Solar SystemNASA’s Lucy spacecraft launched Oct. 16, 2021, on a 12-year journey to Jupiter’s Trojan asteroids.
Article 3 years ago
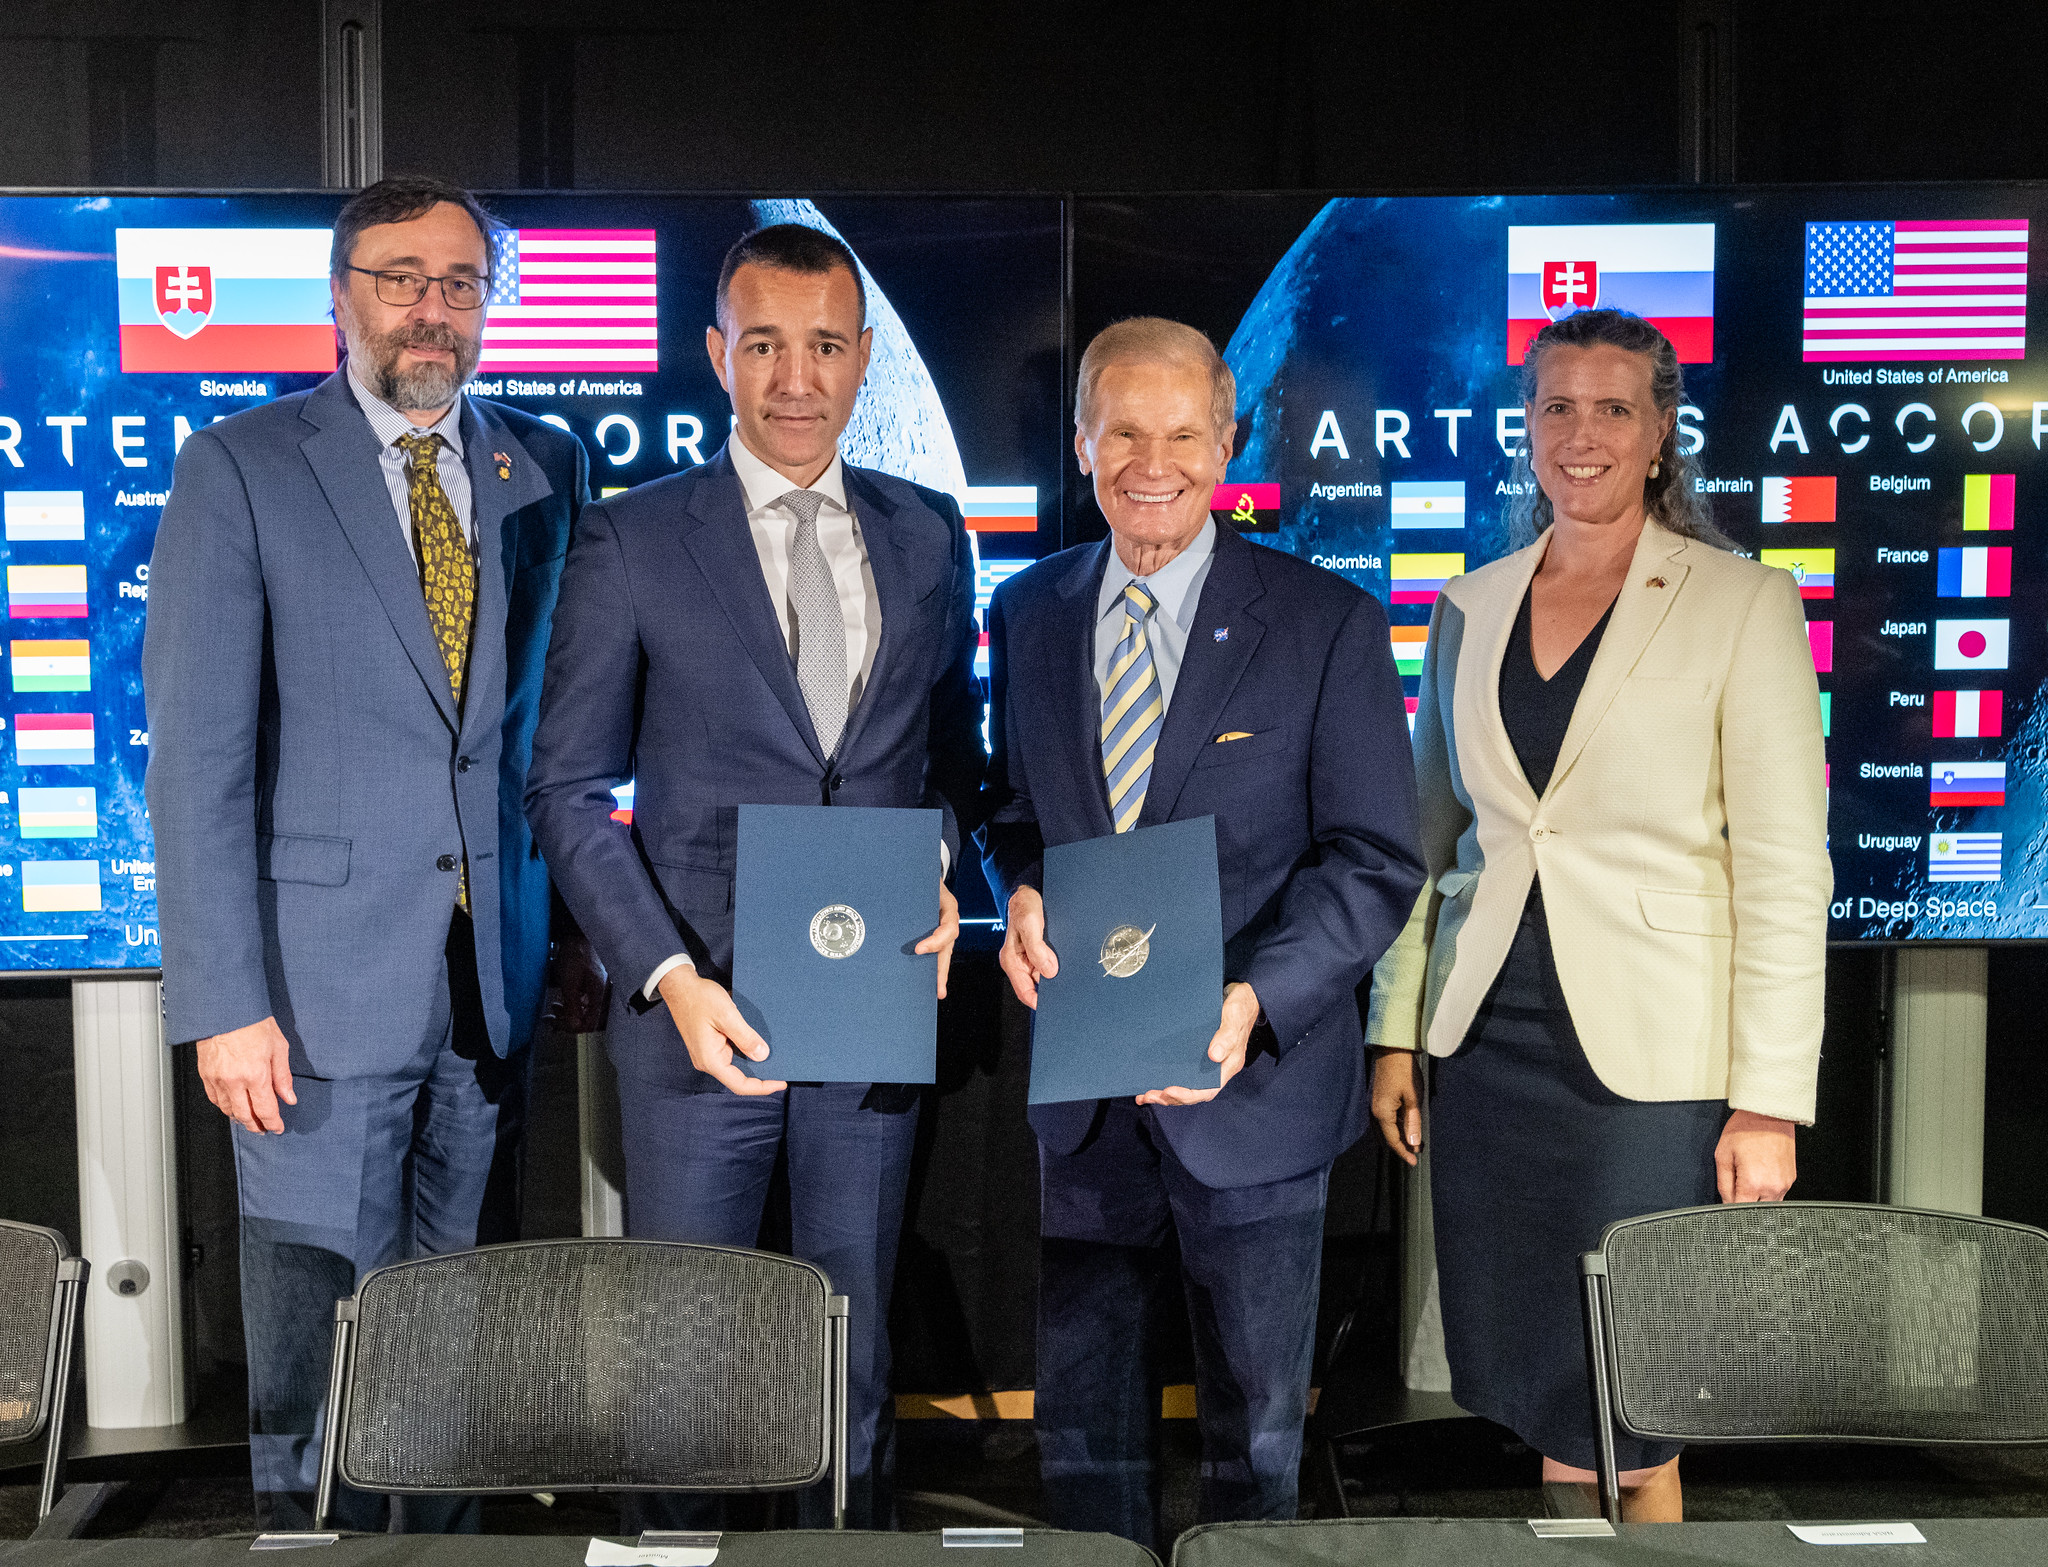
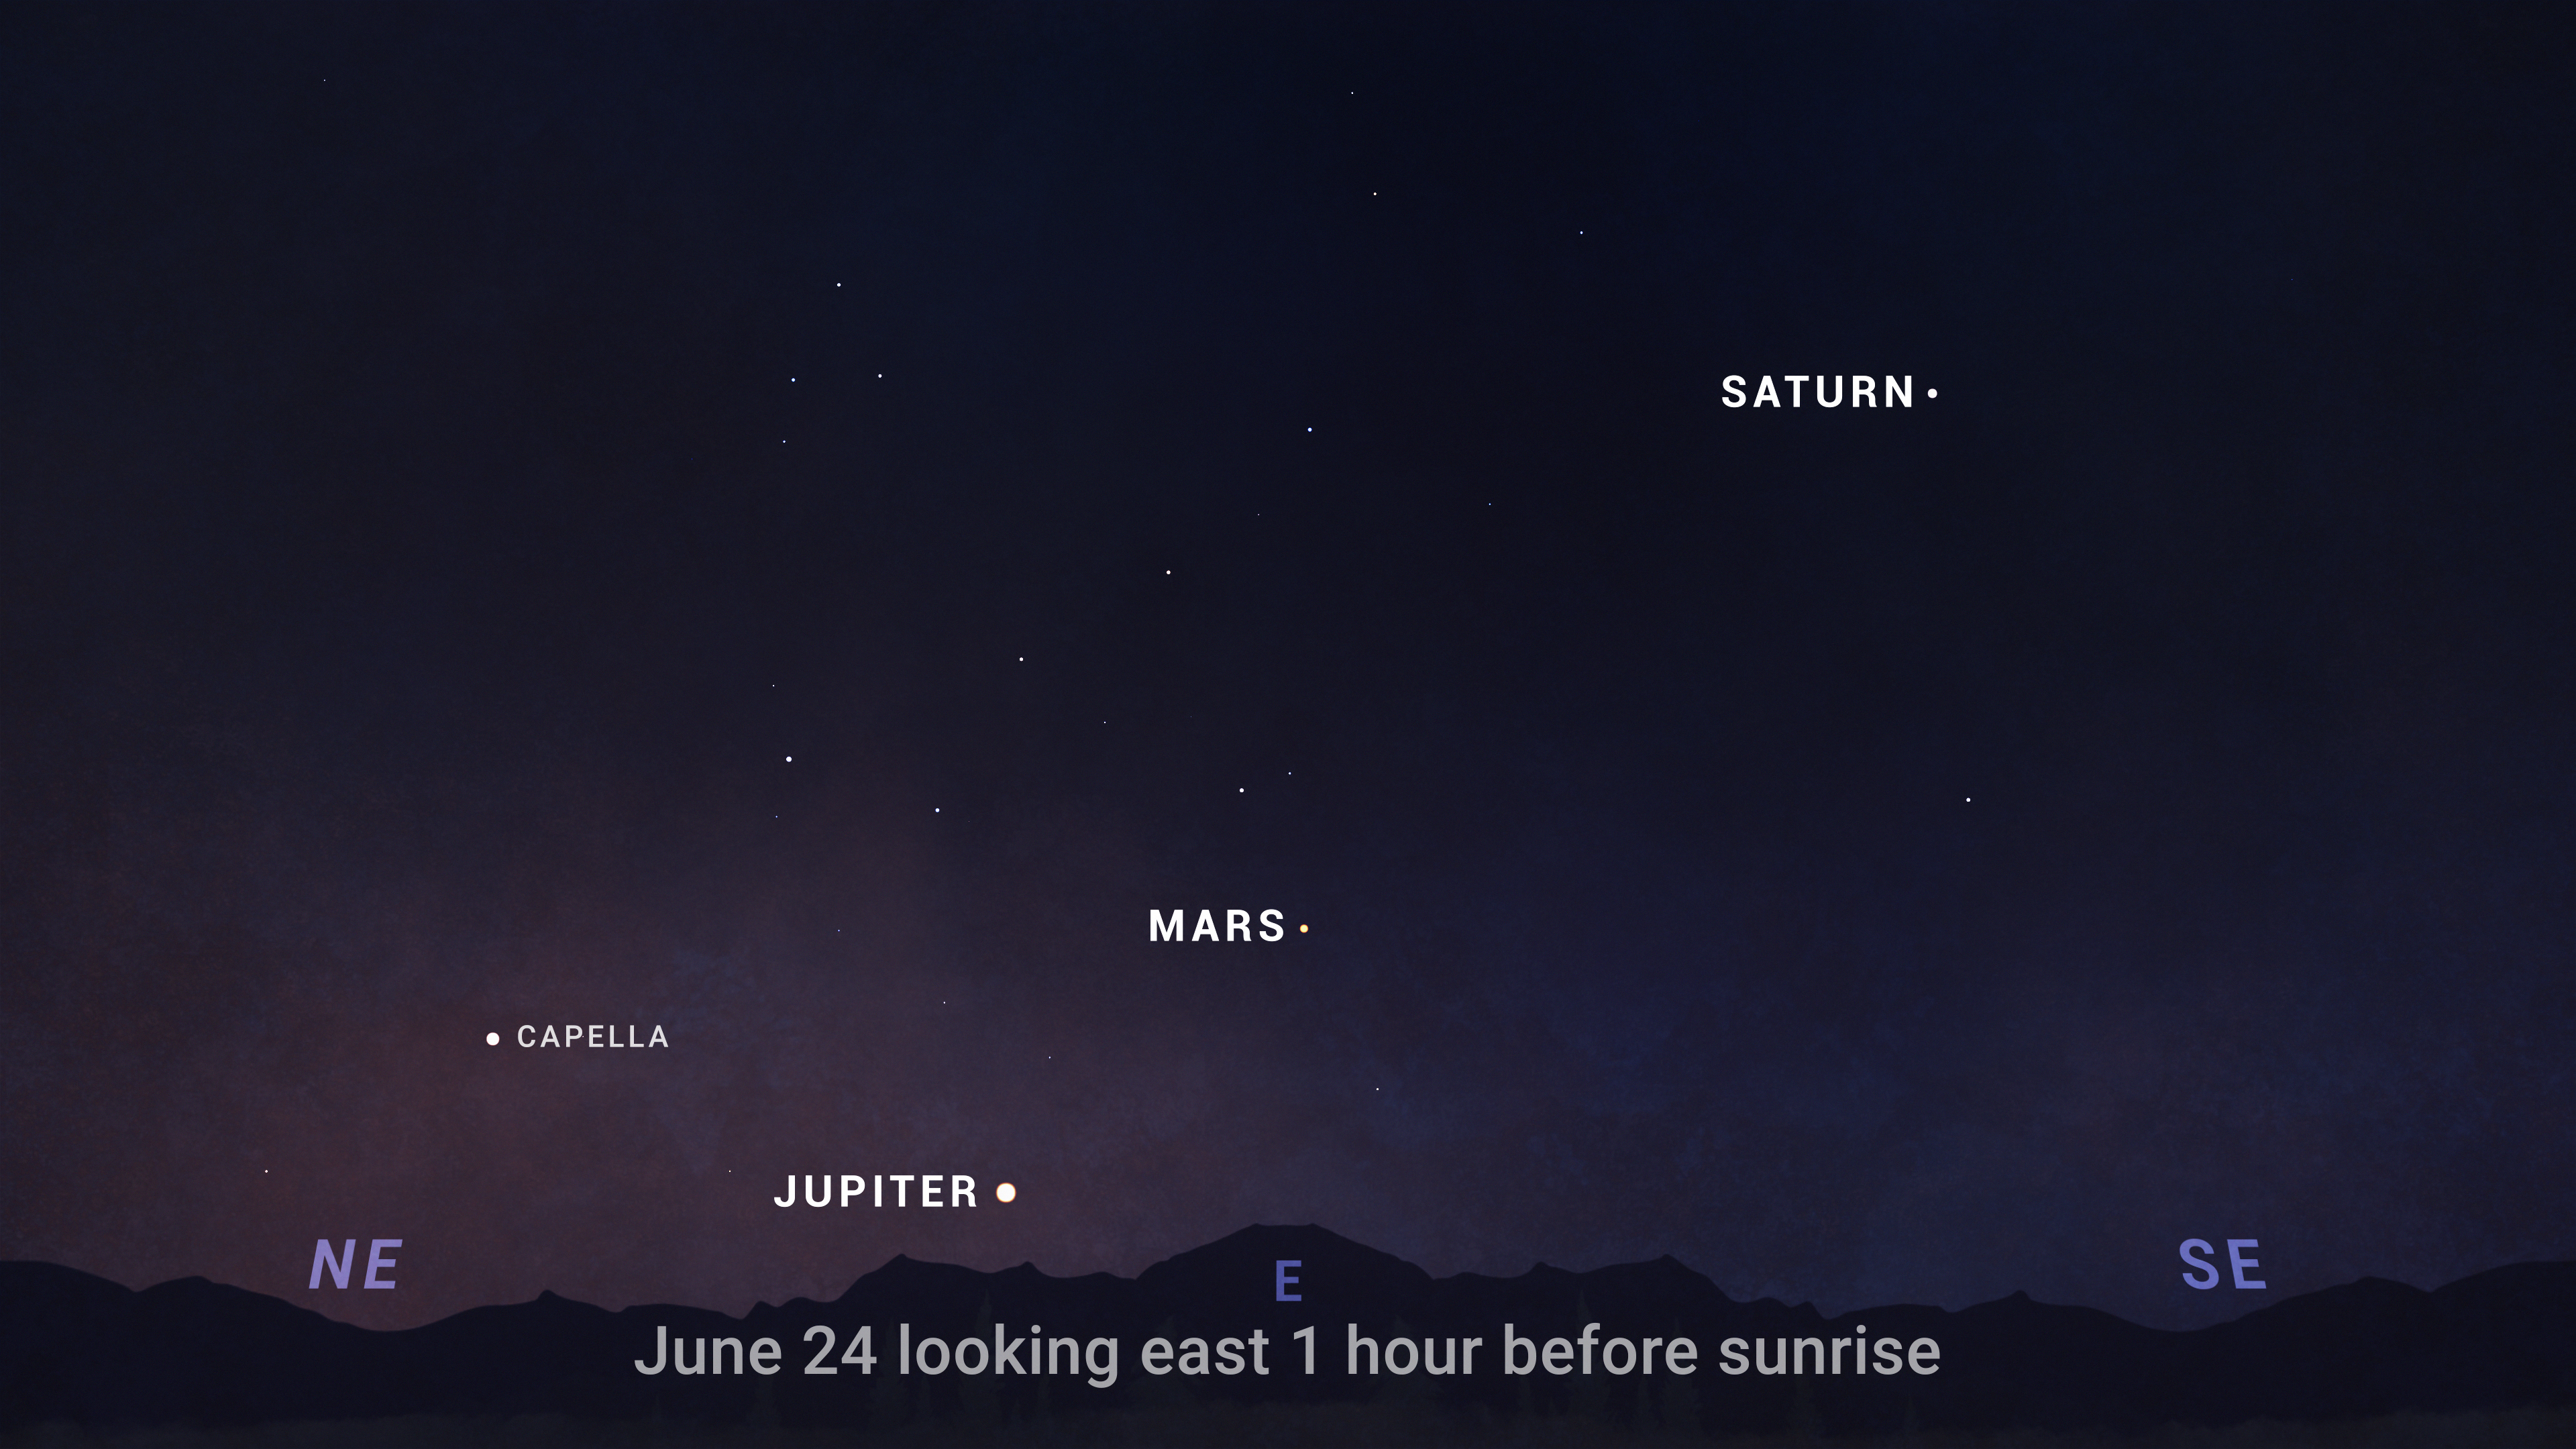
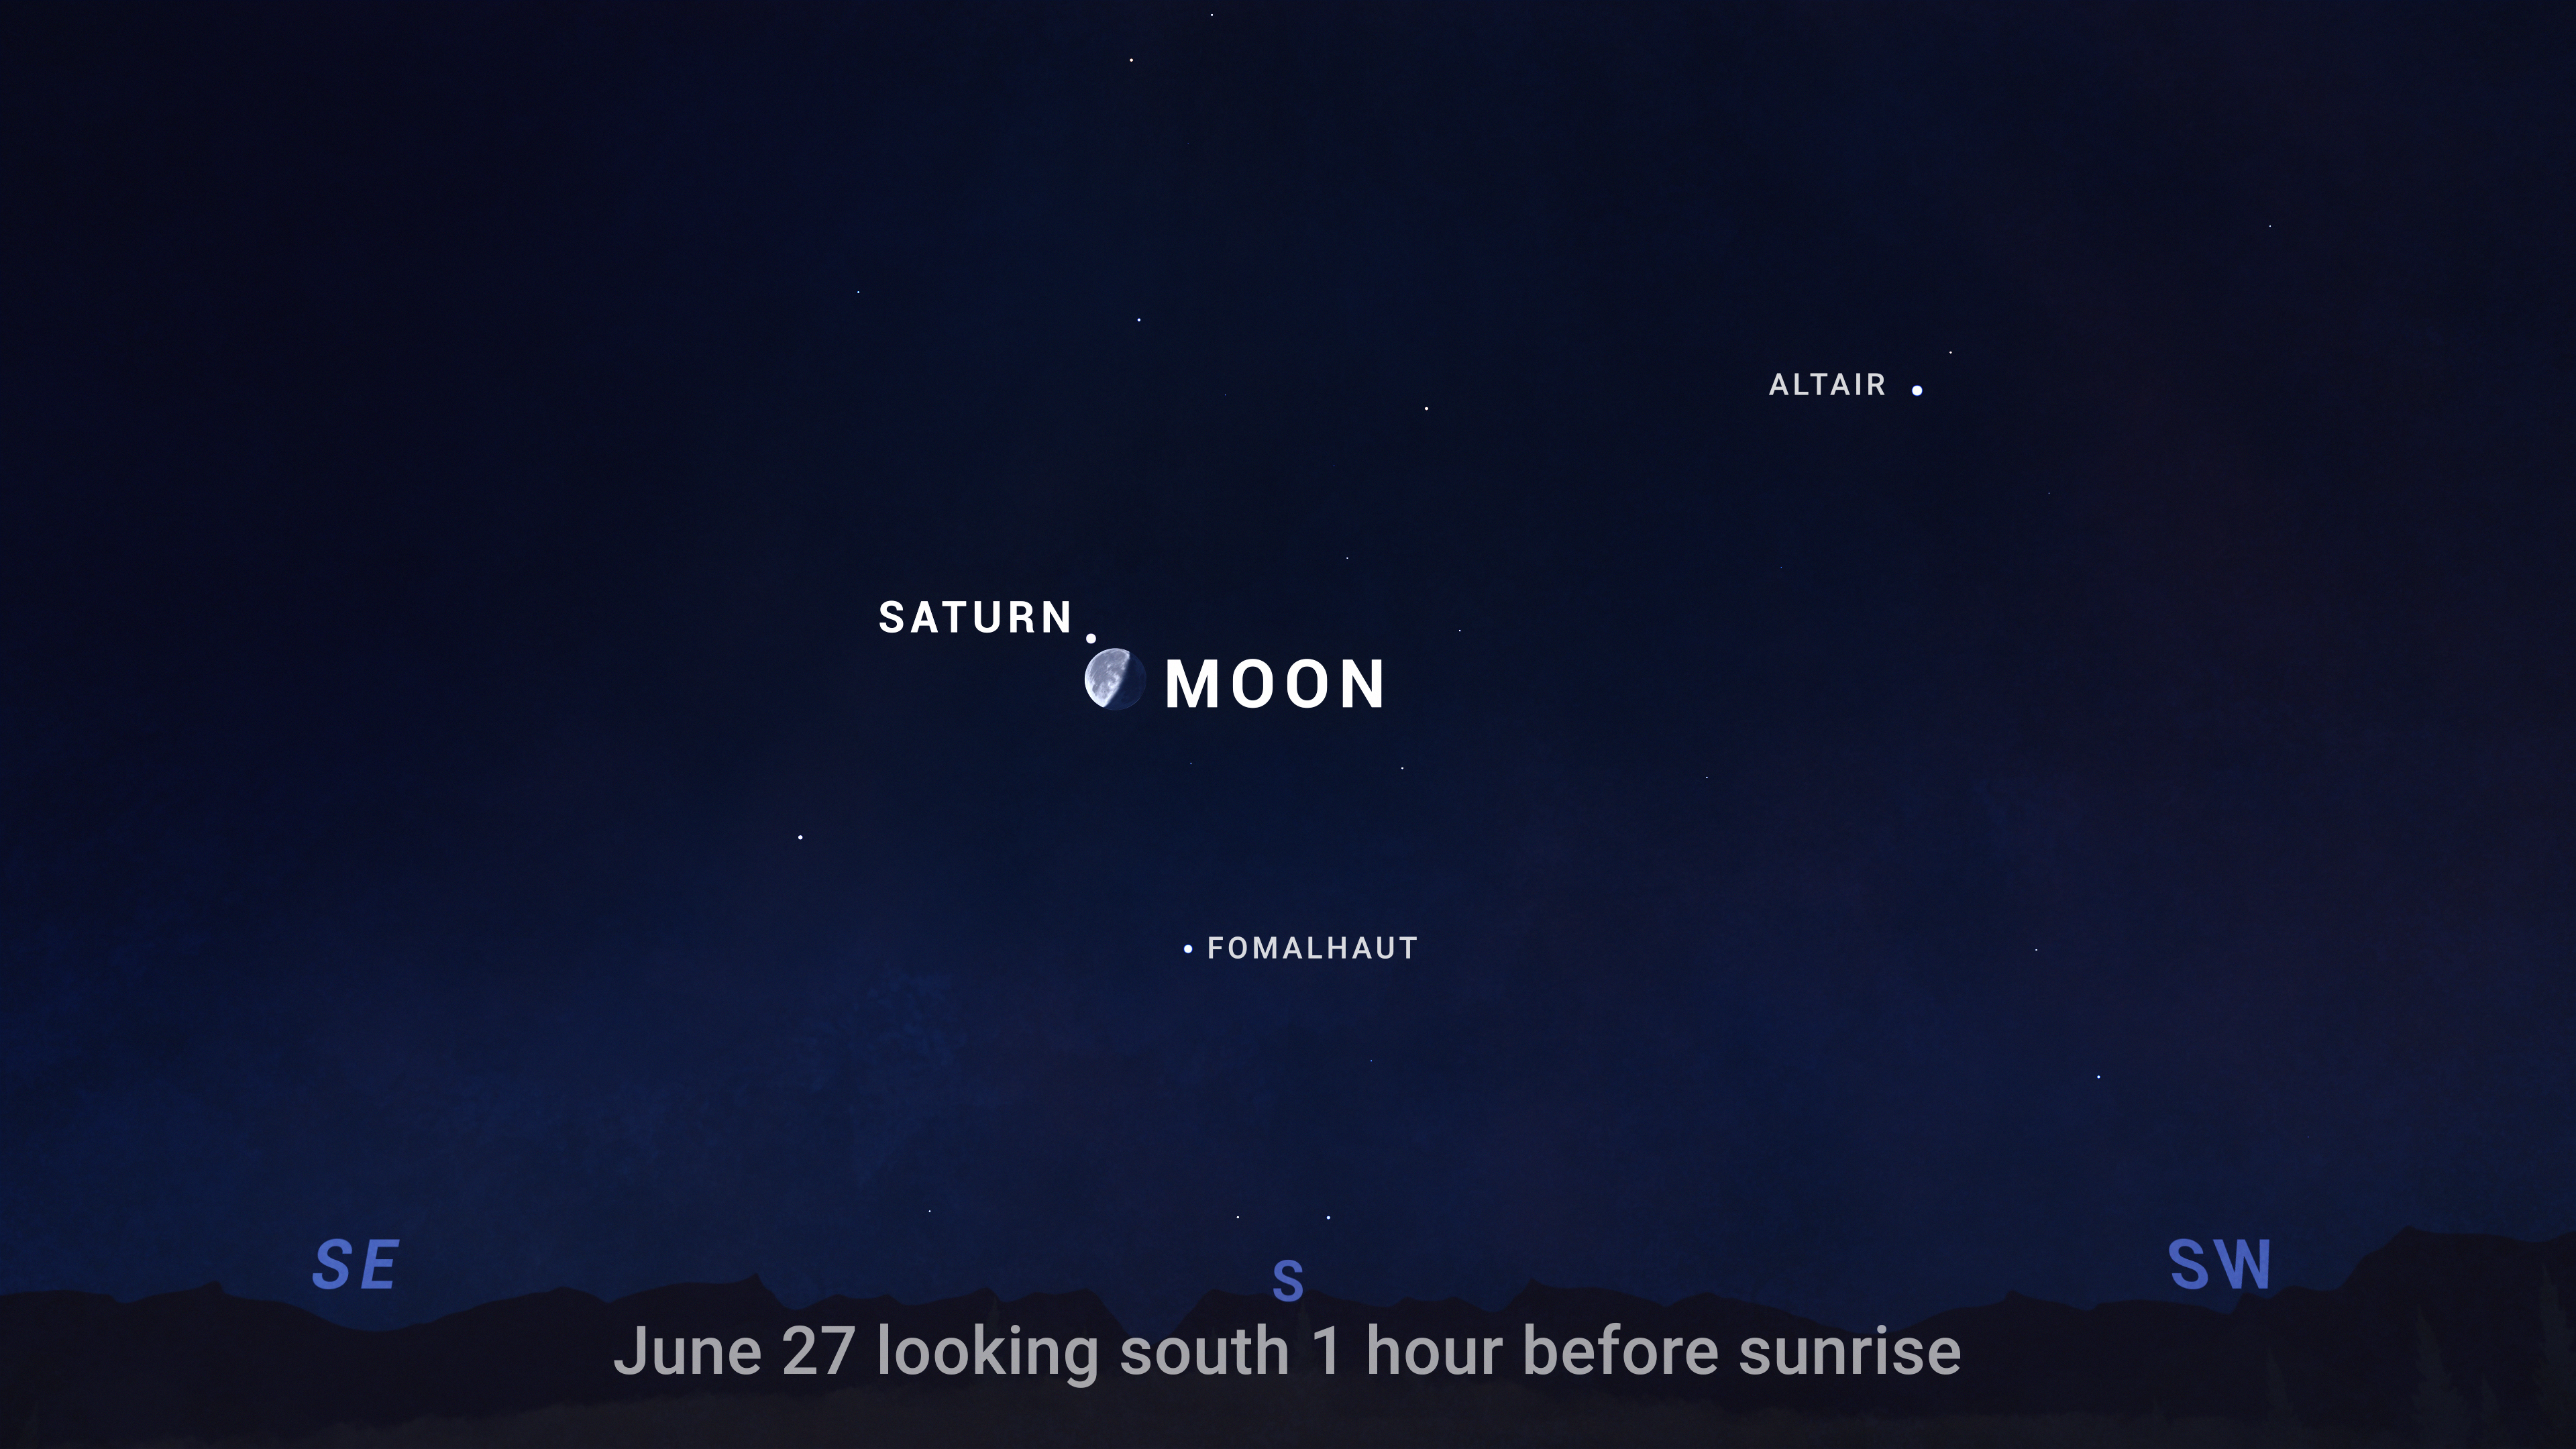
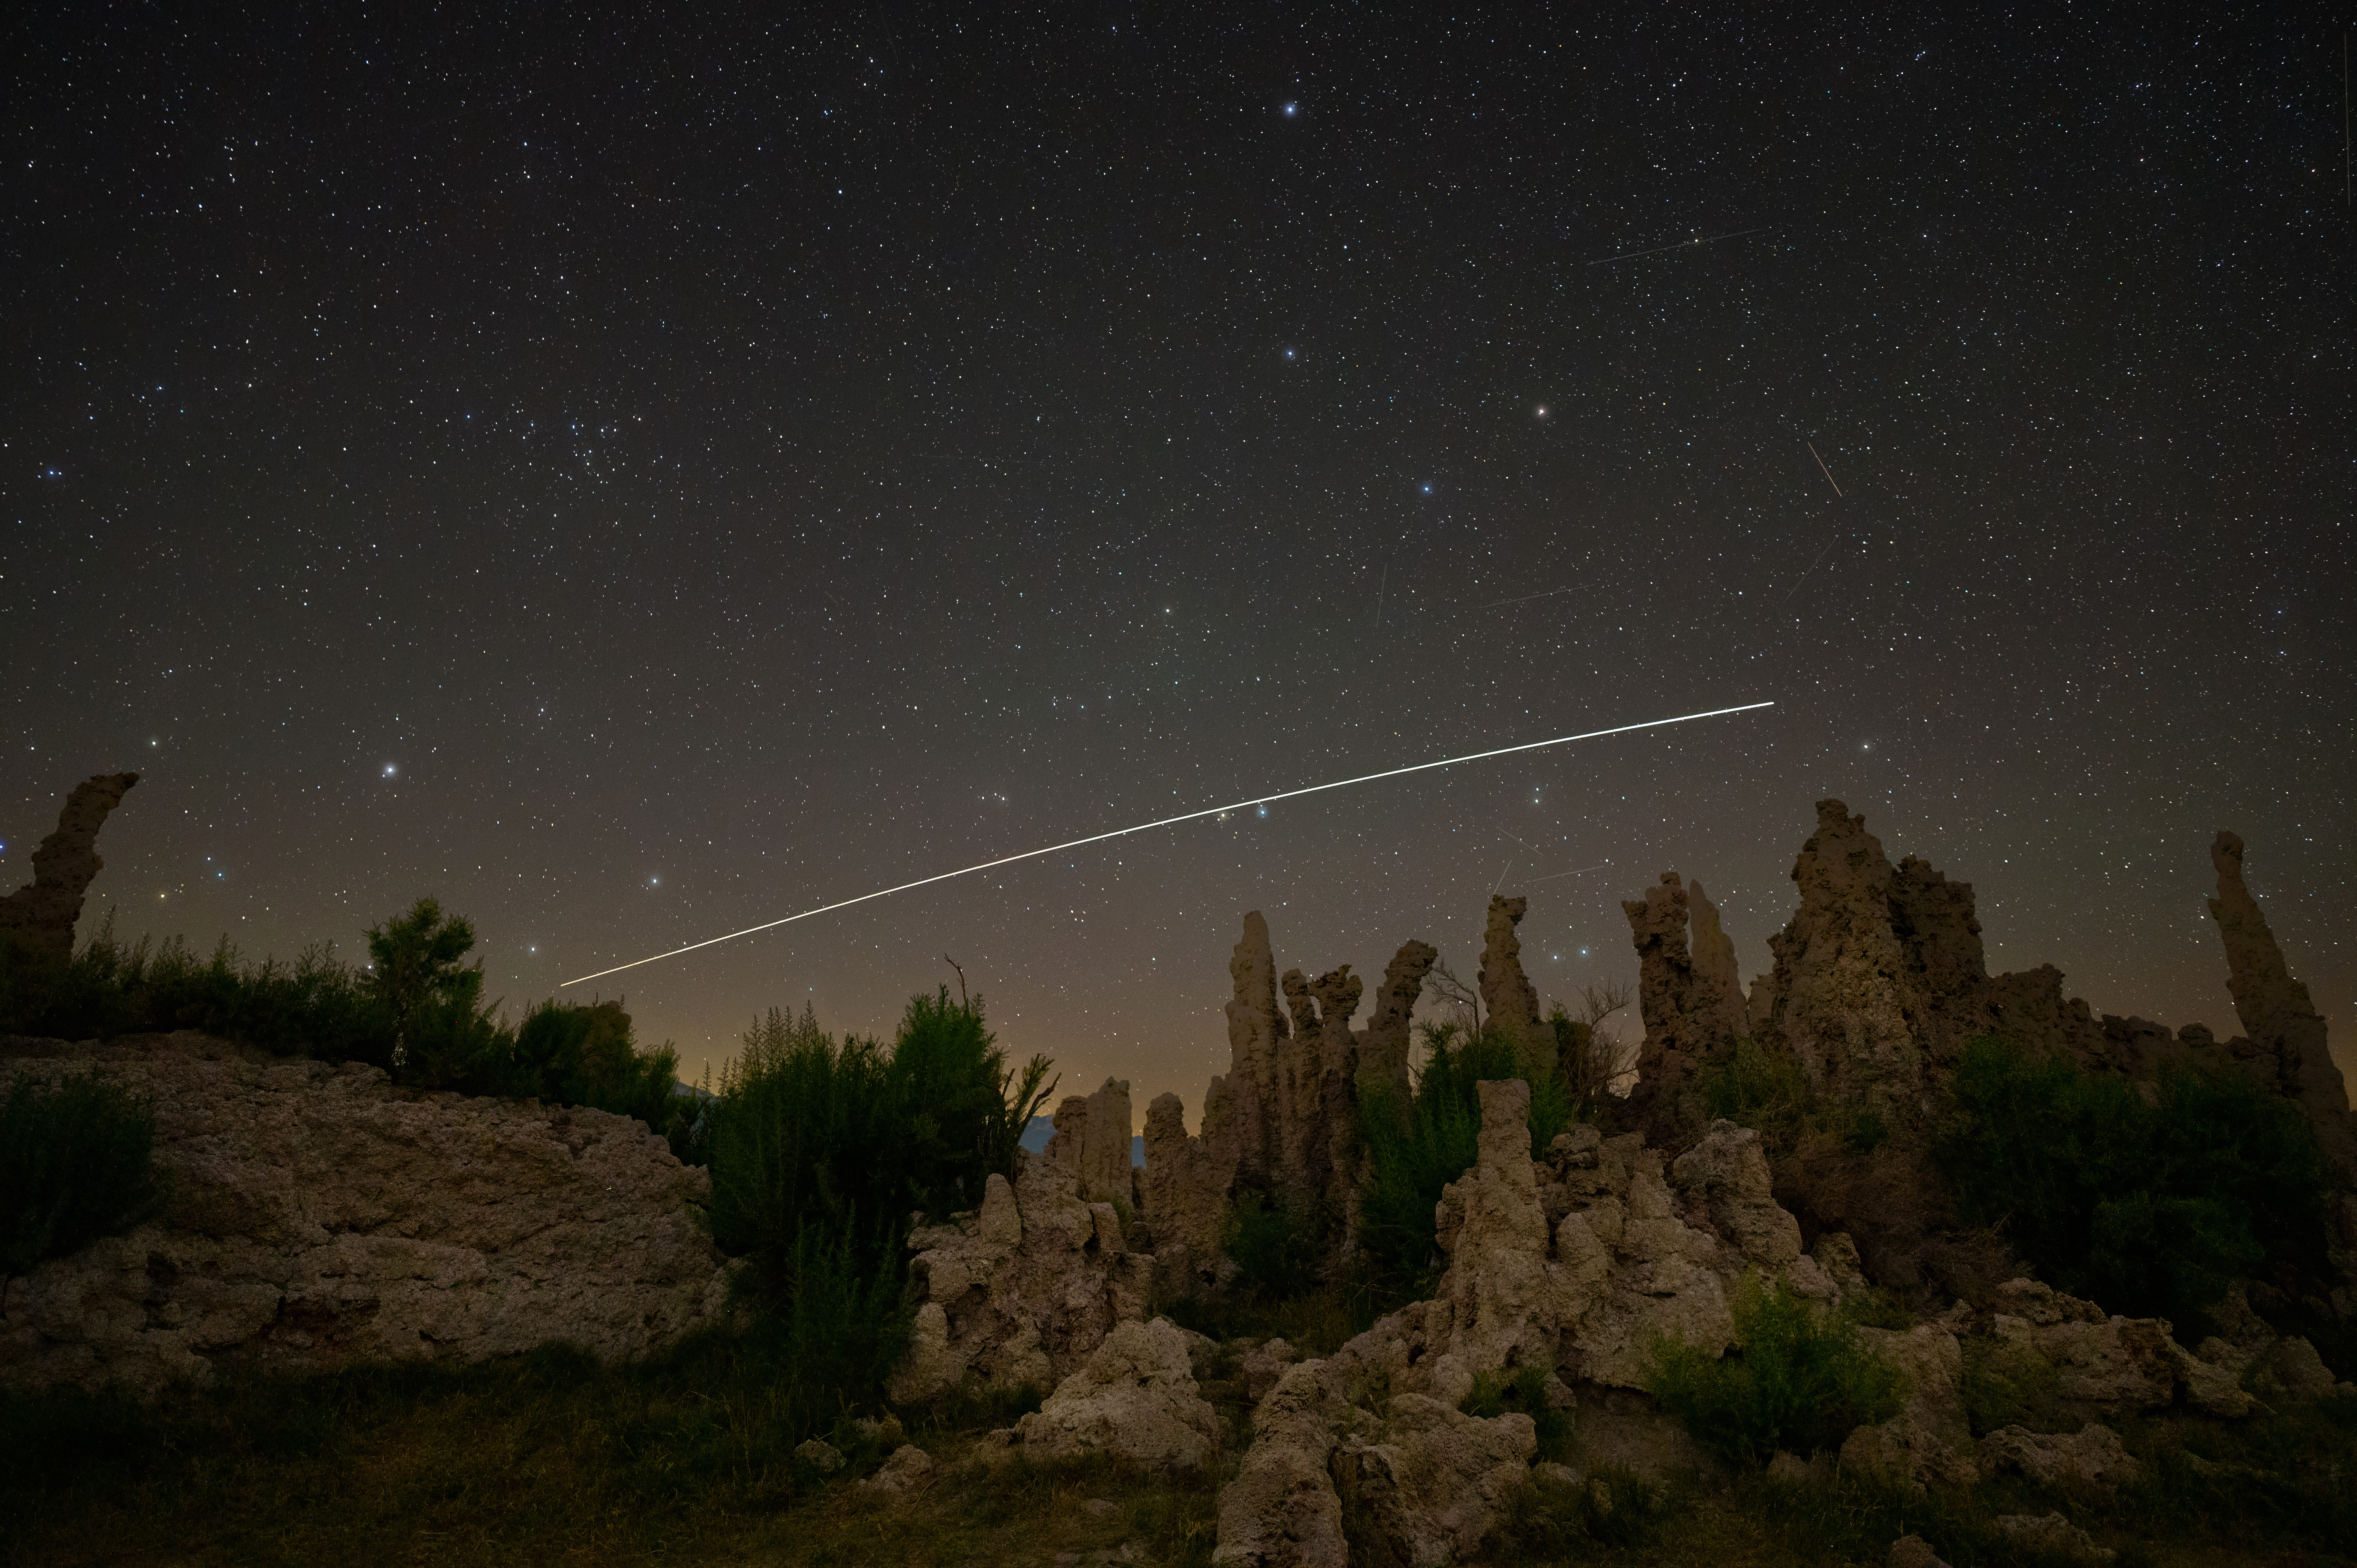
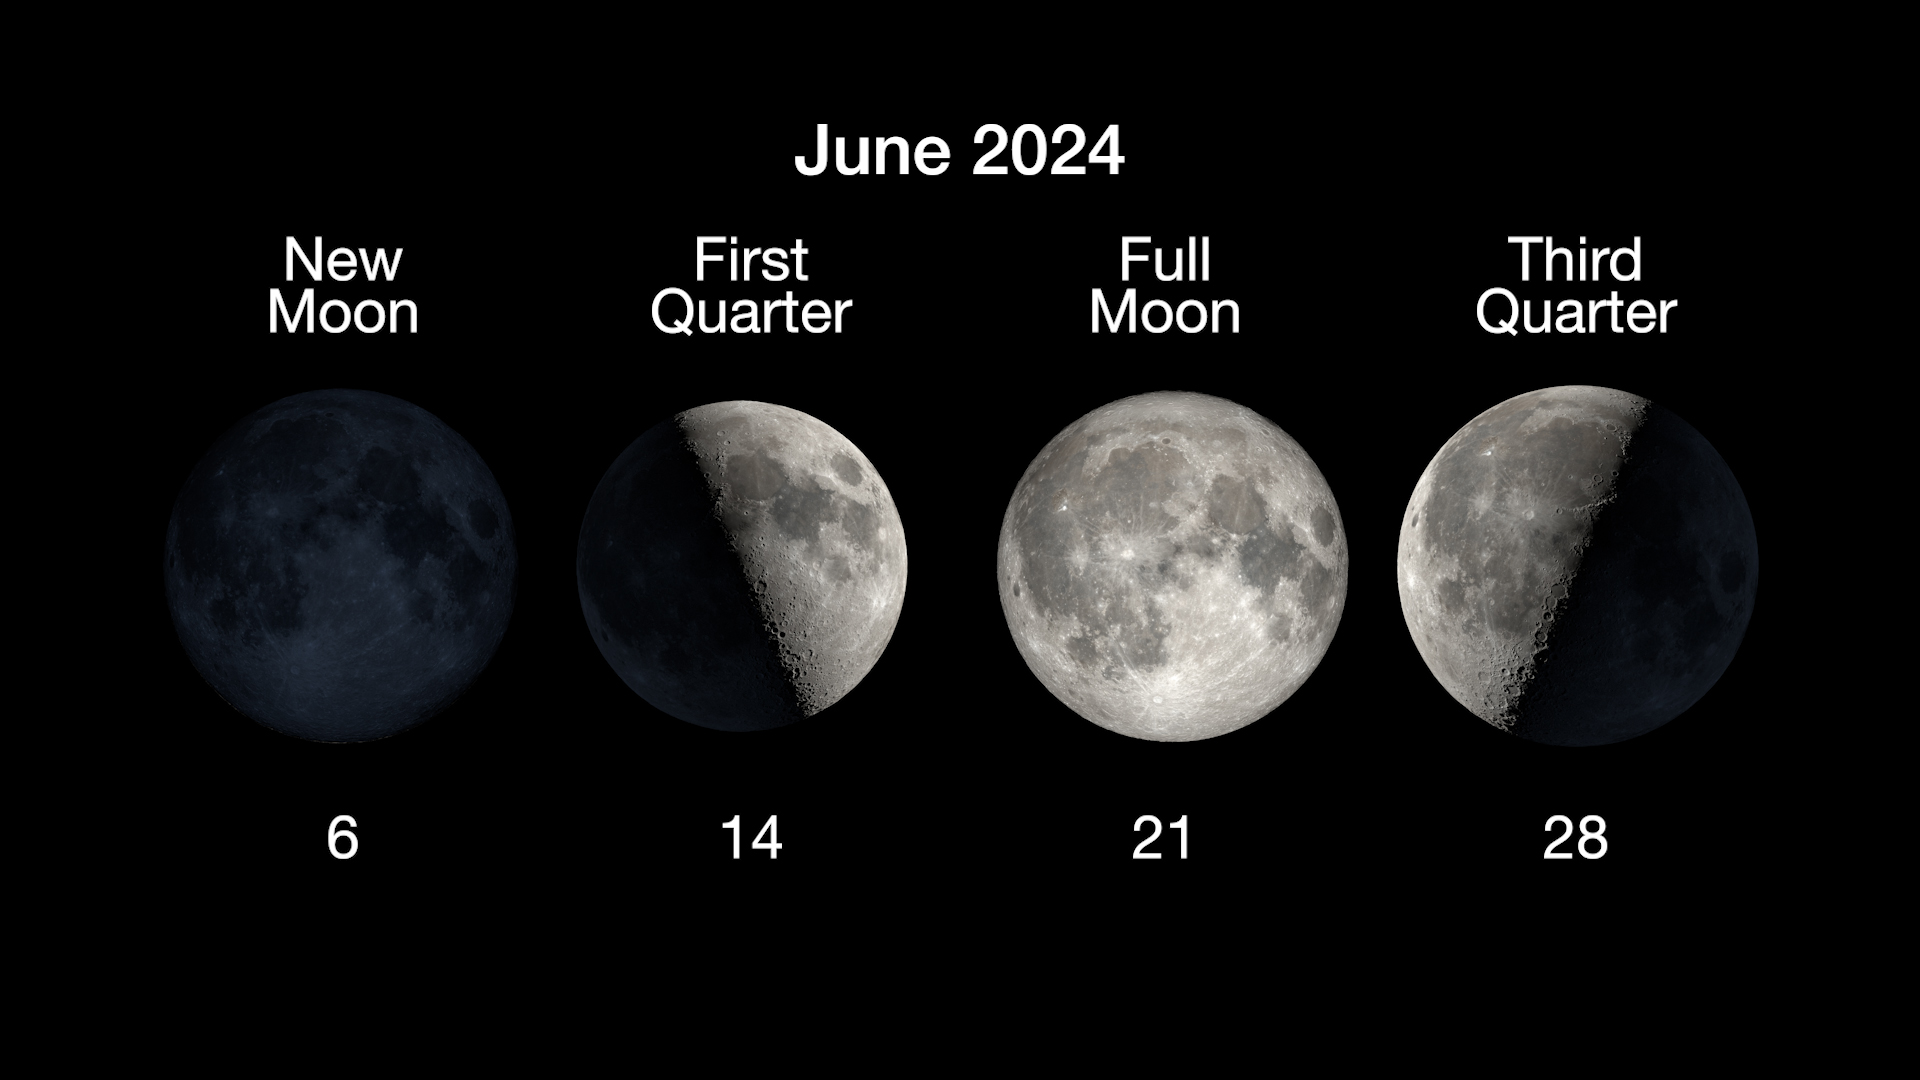
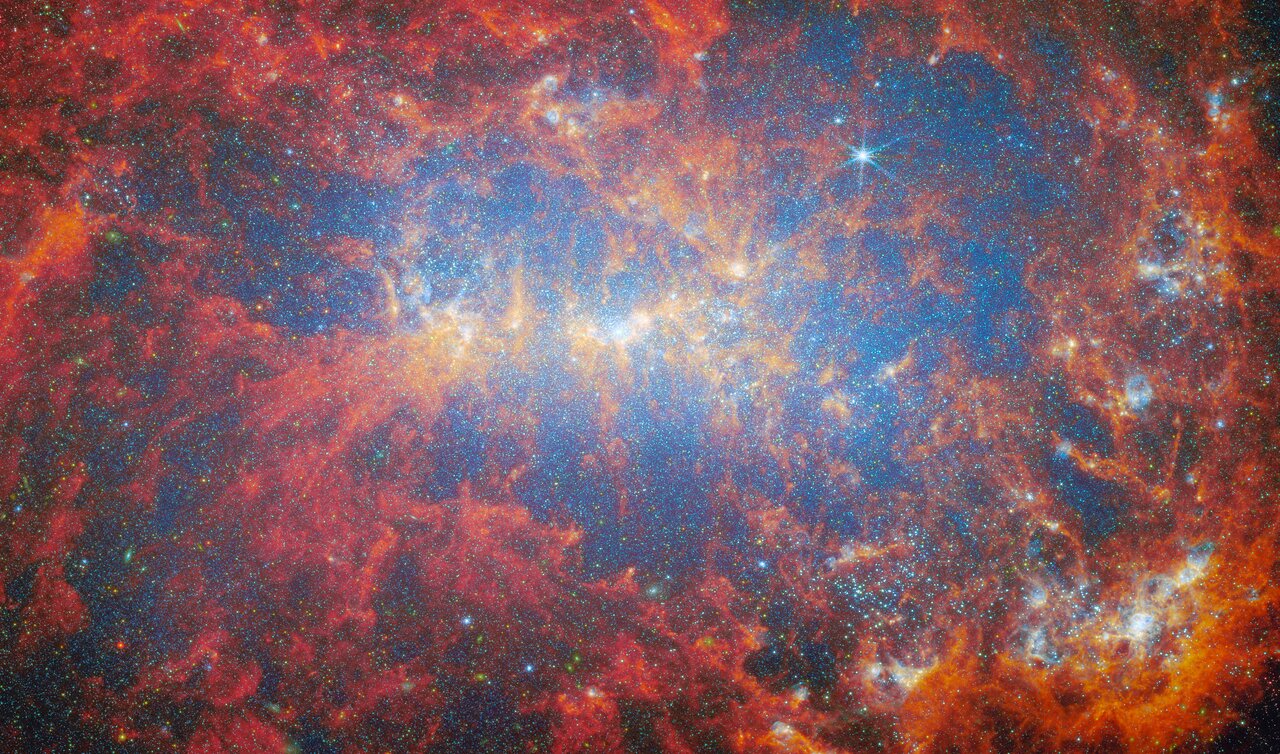
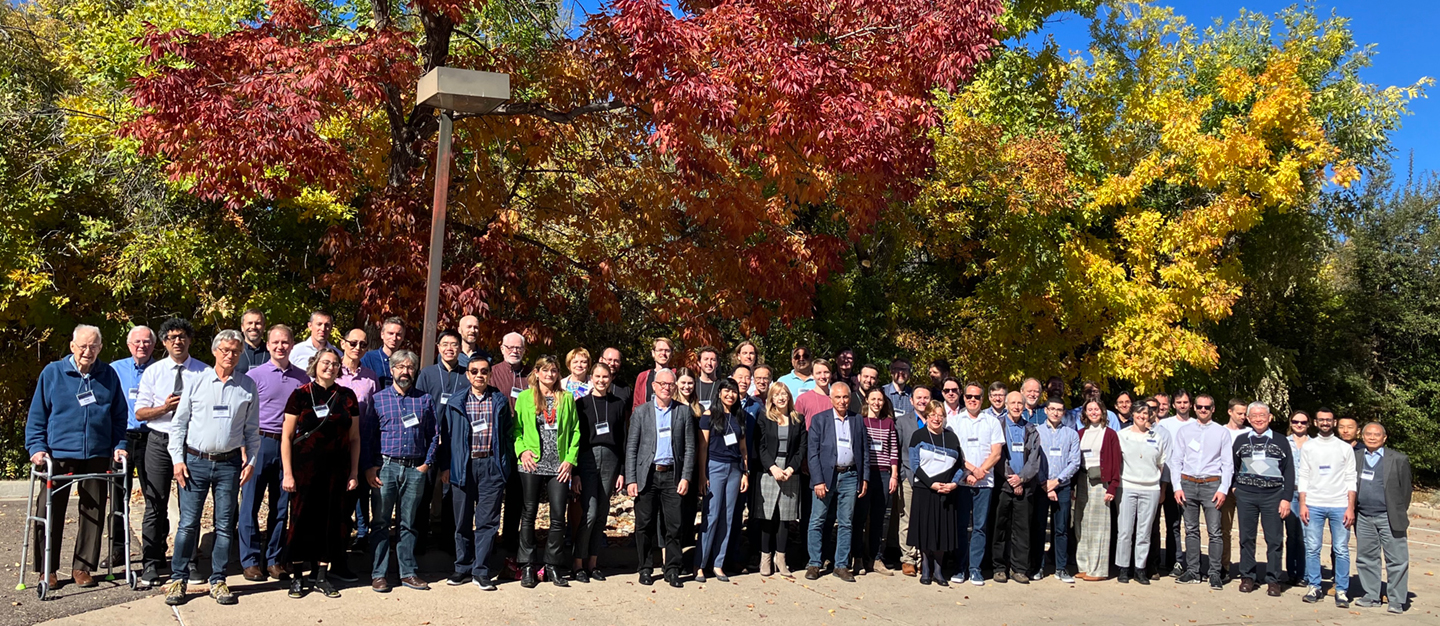
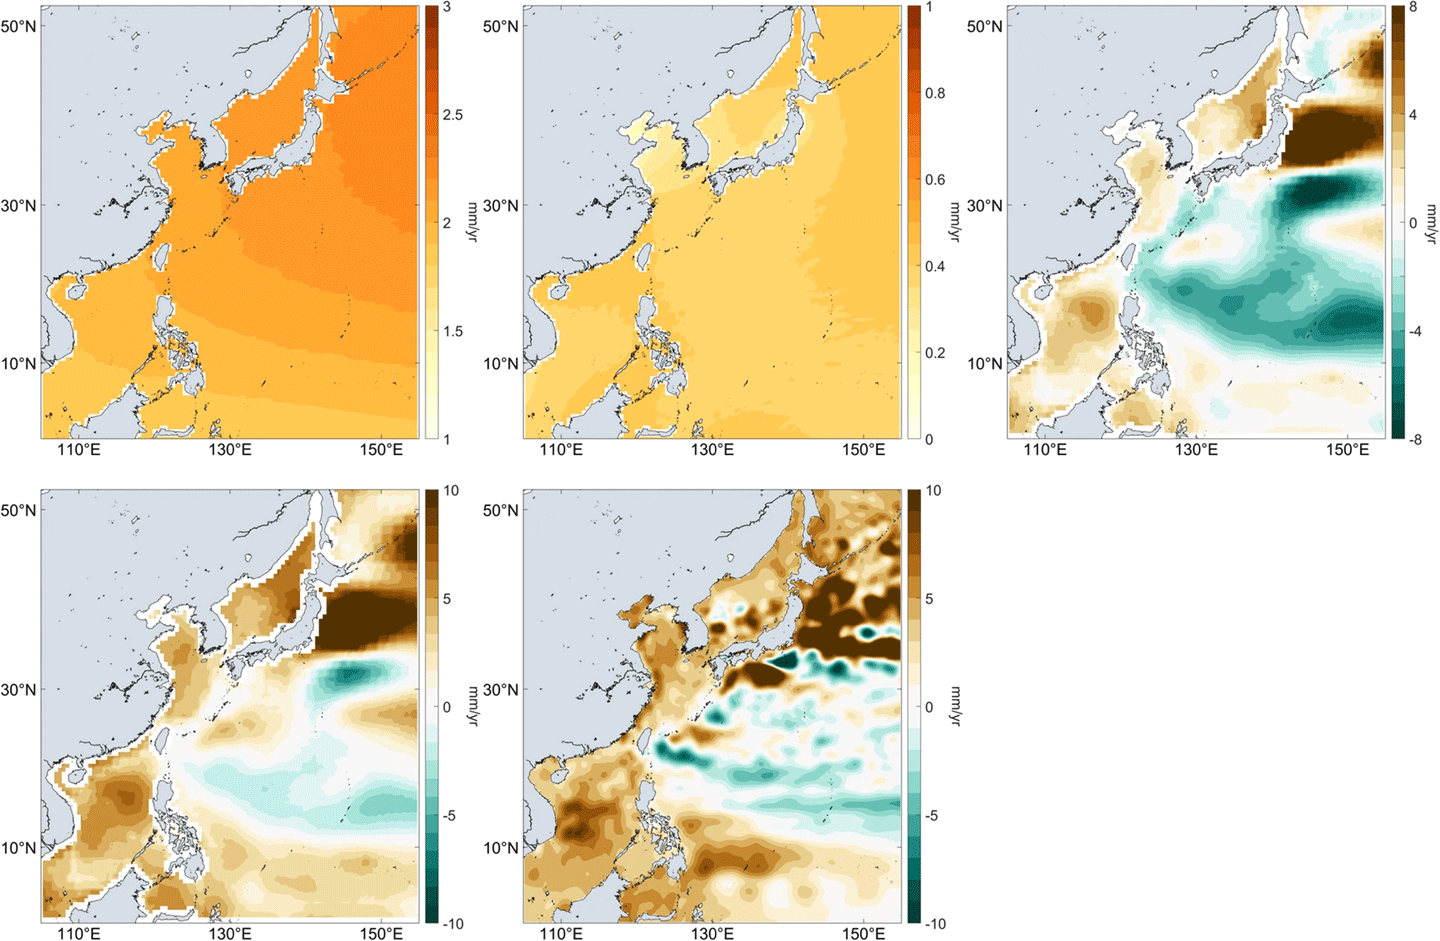
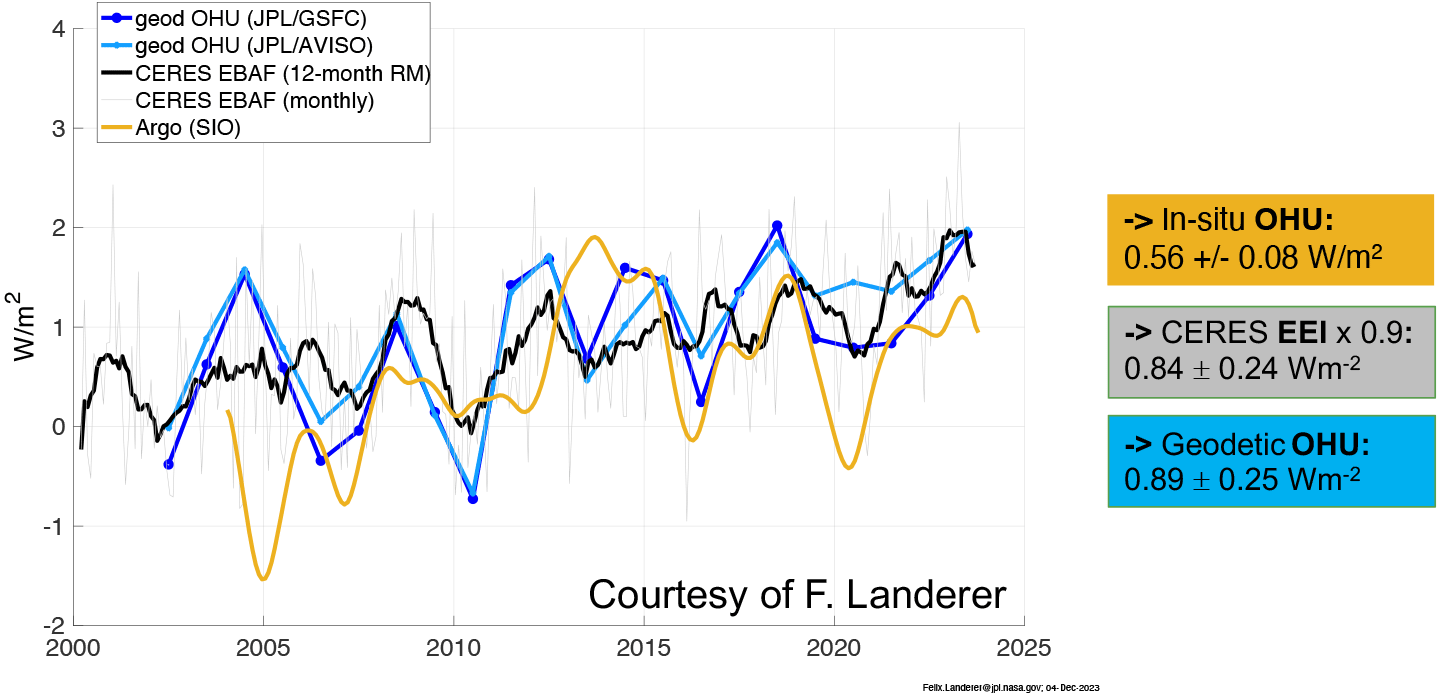
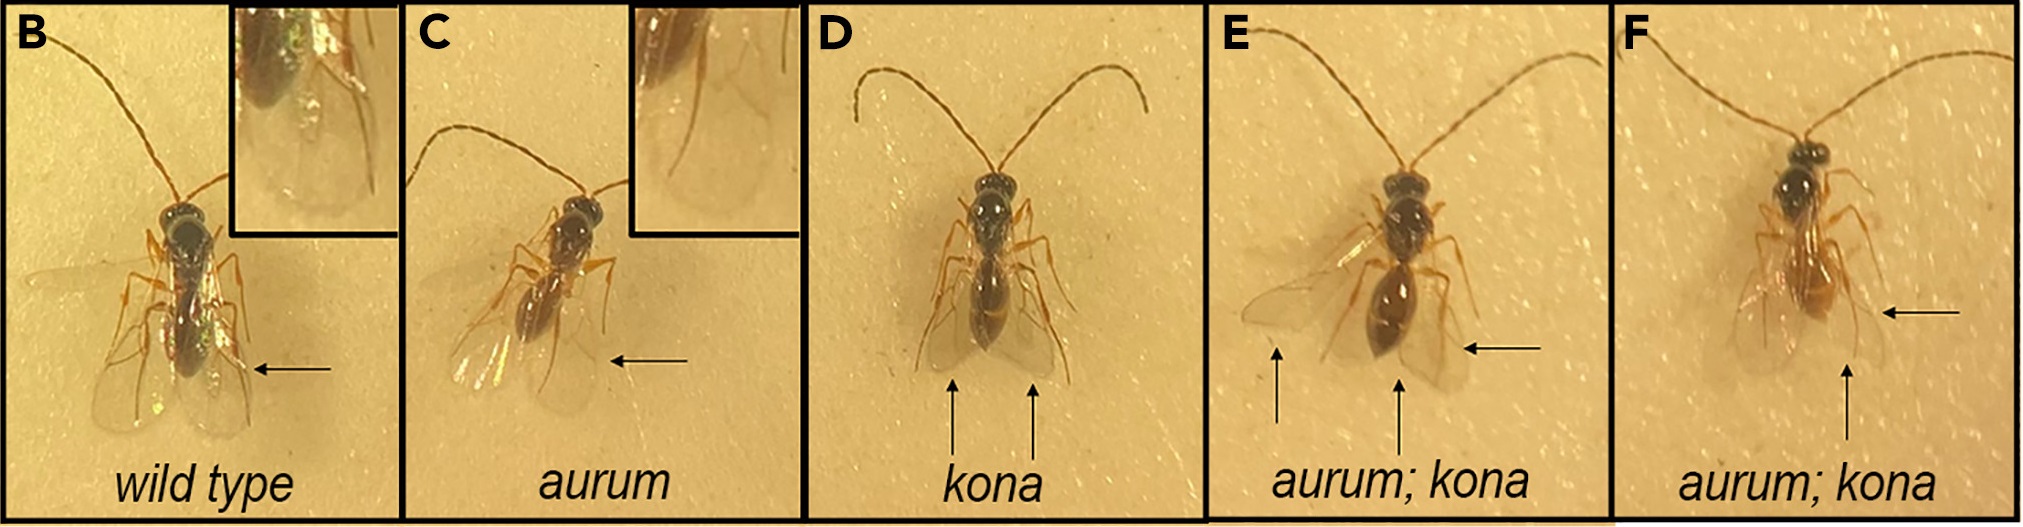
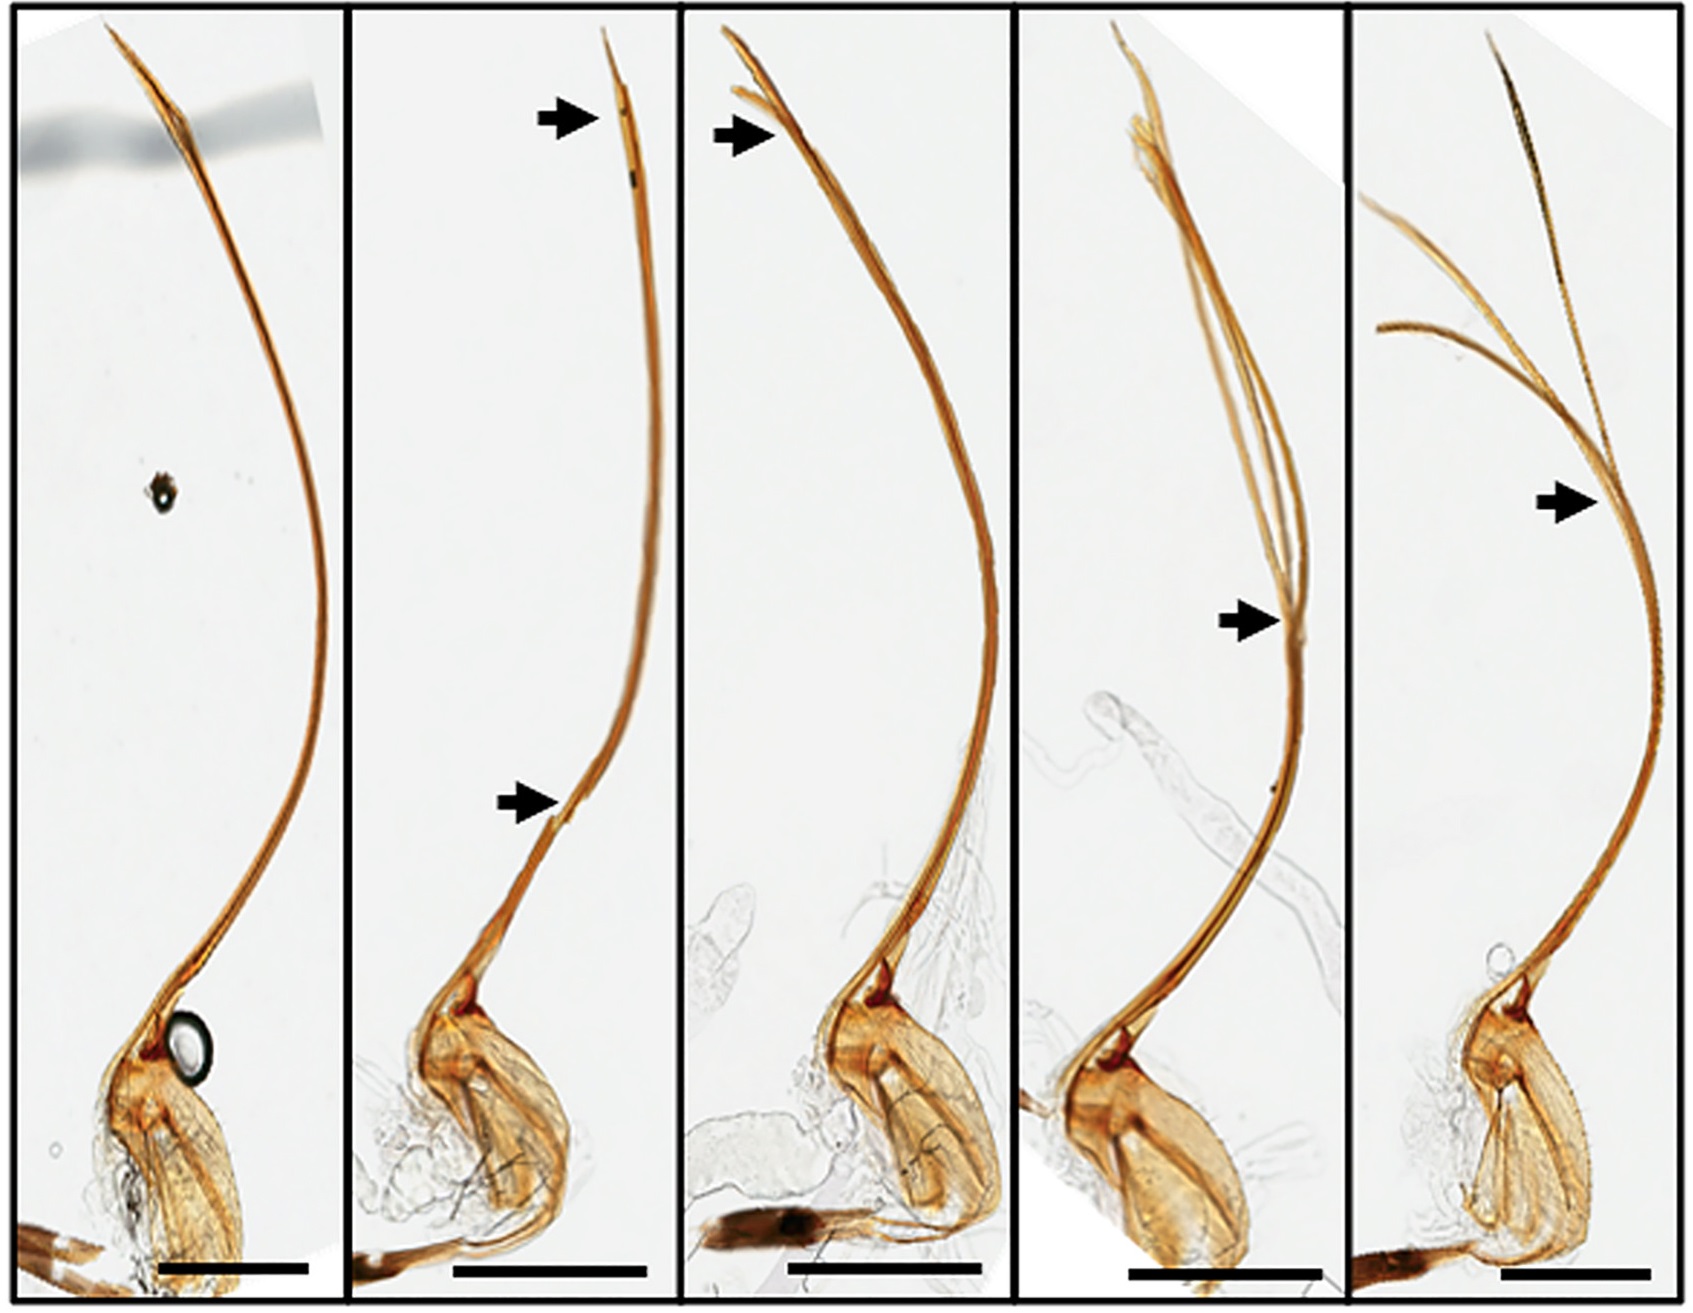
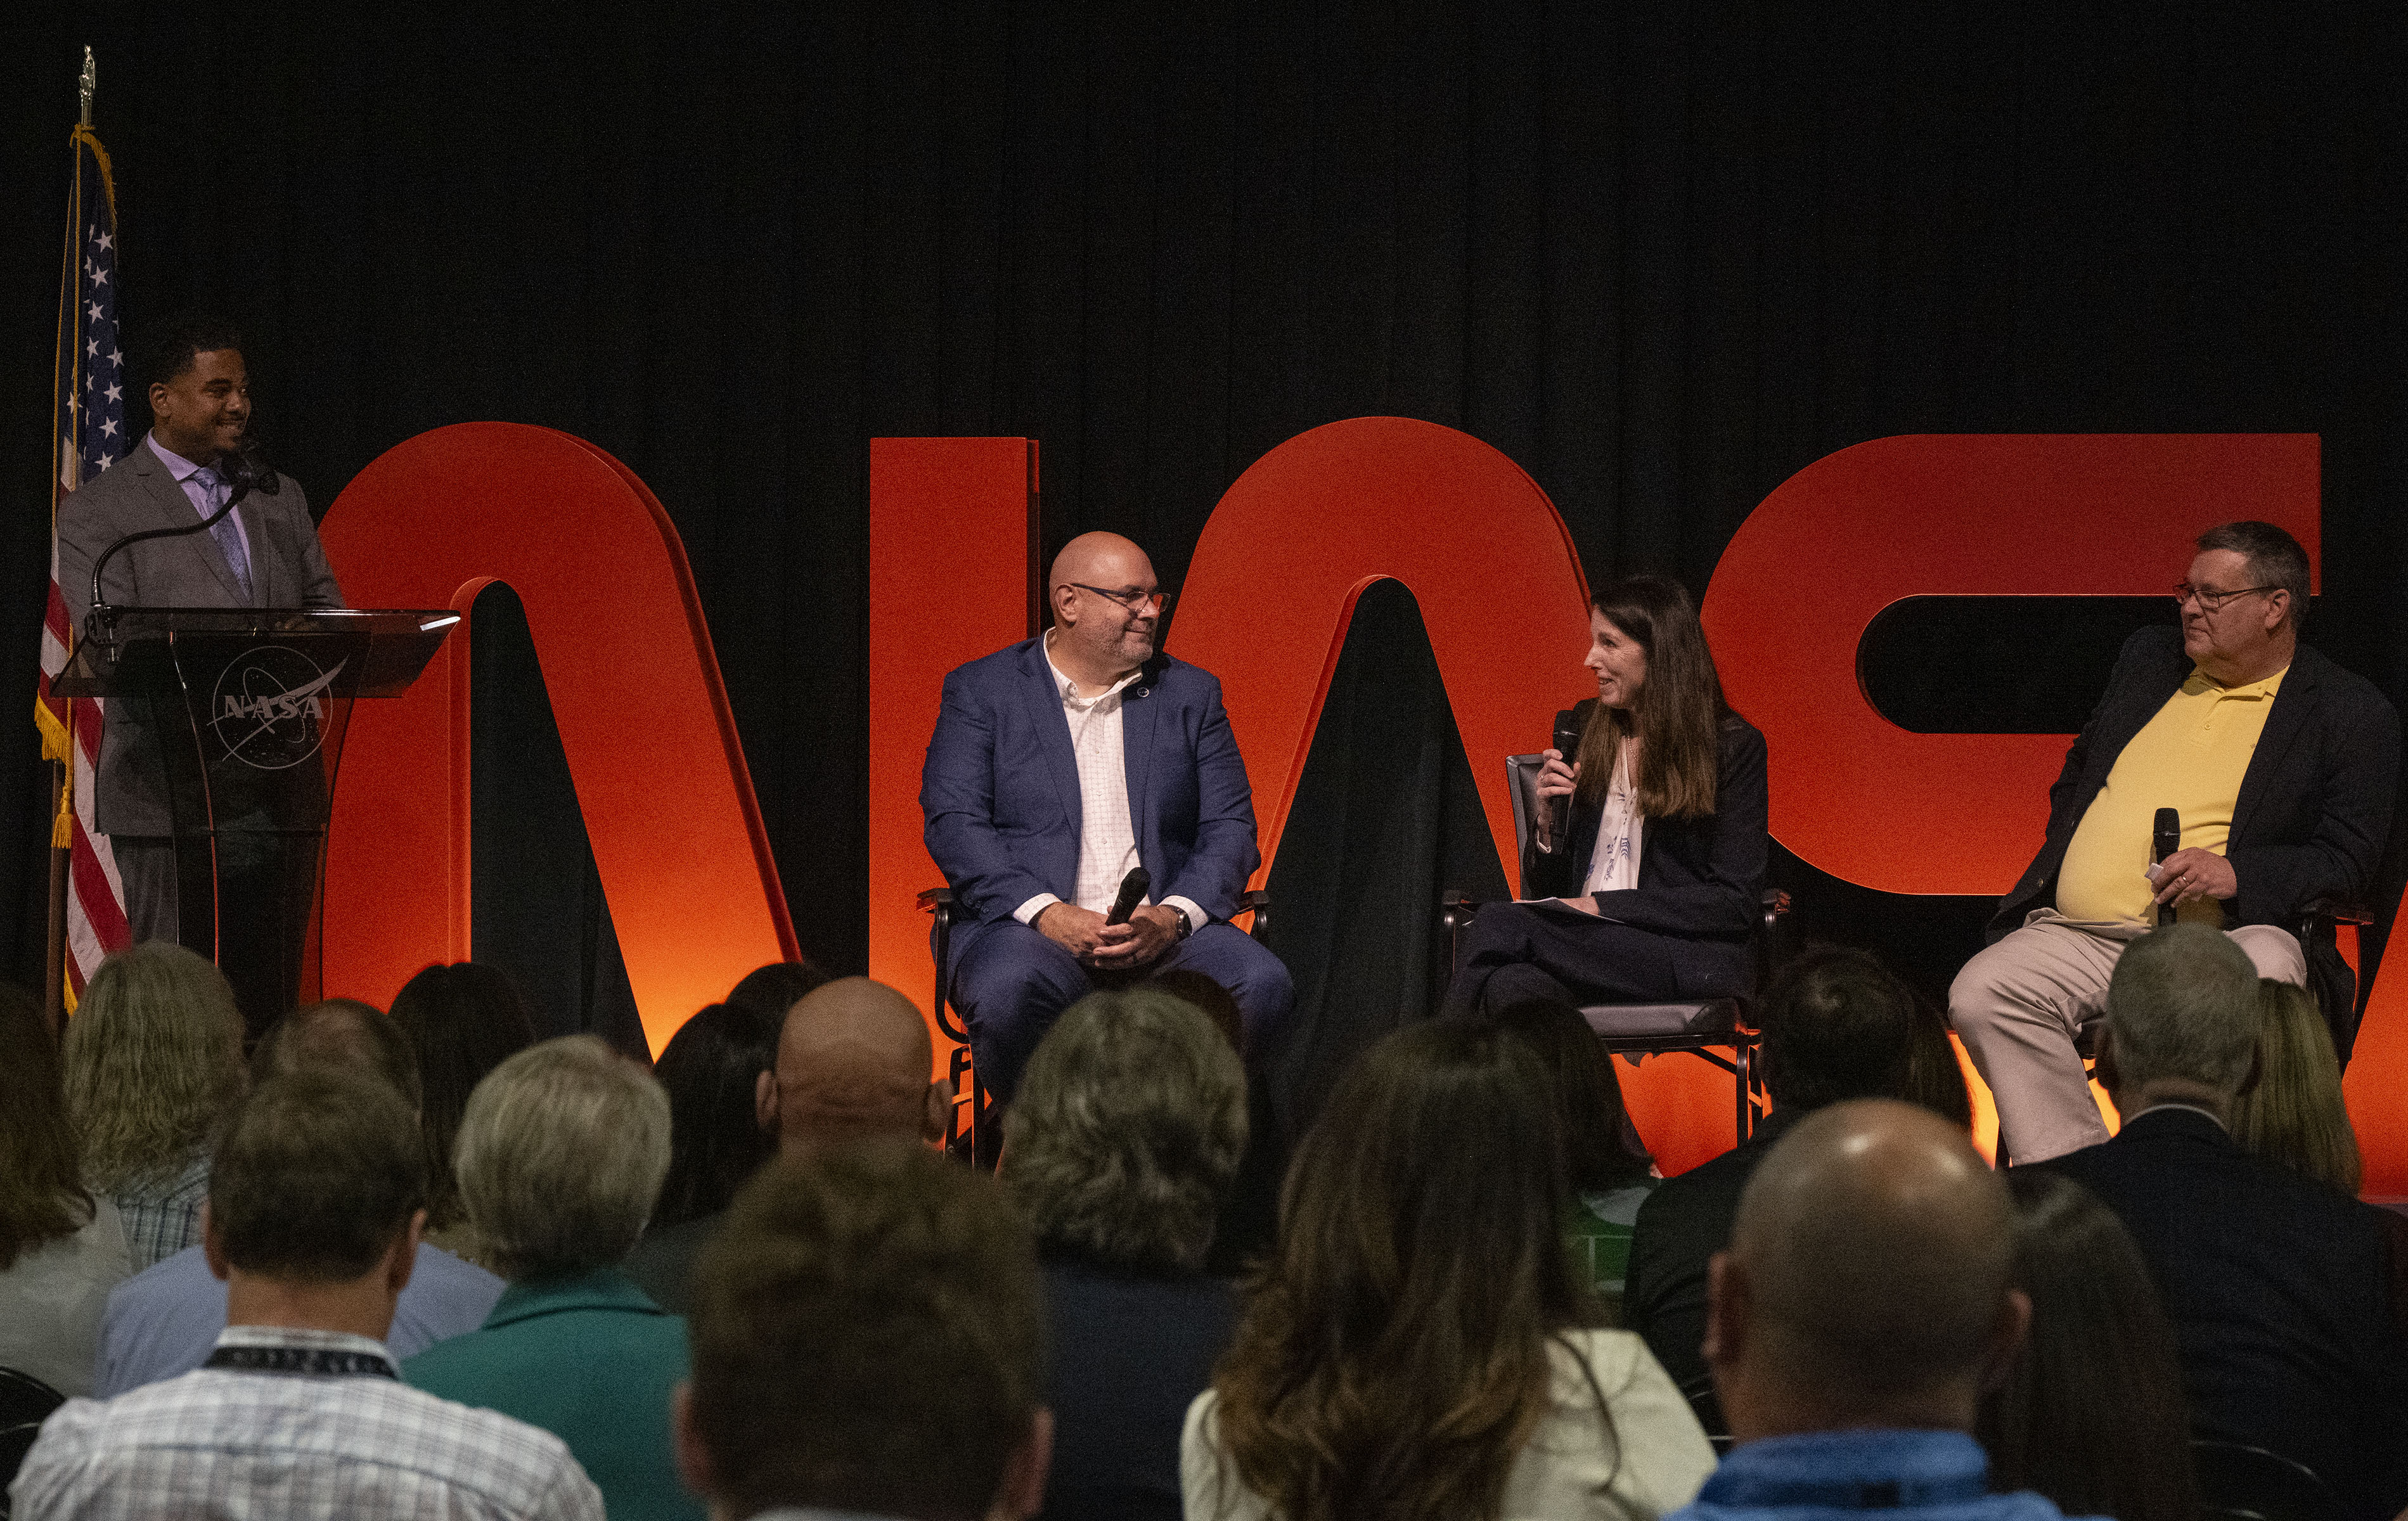
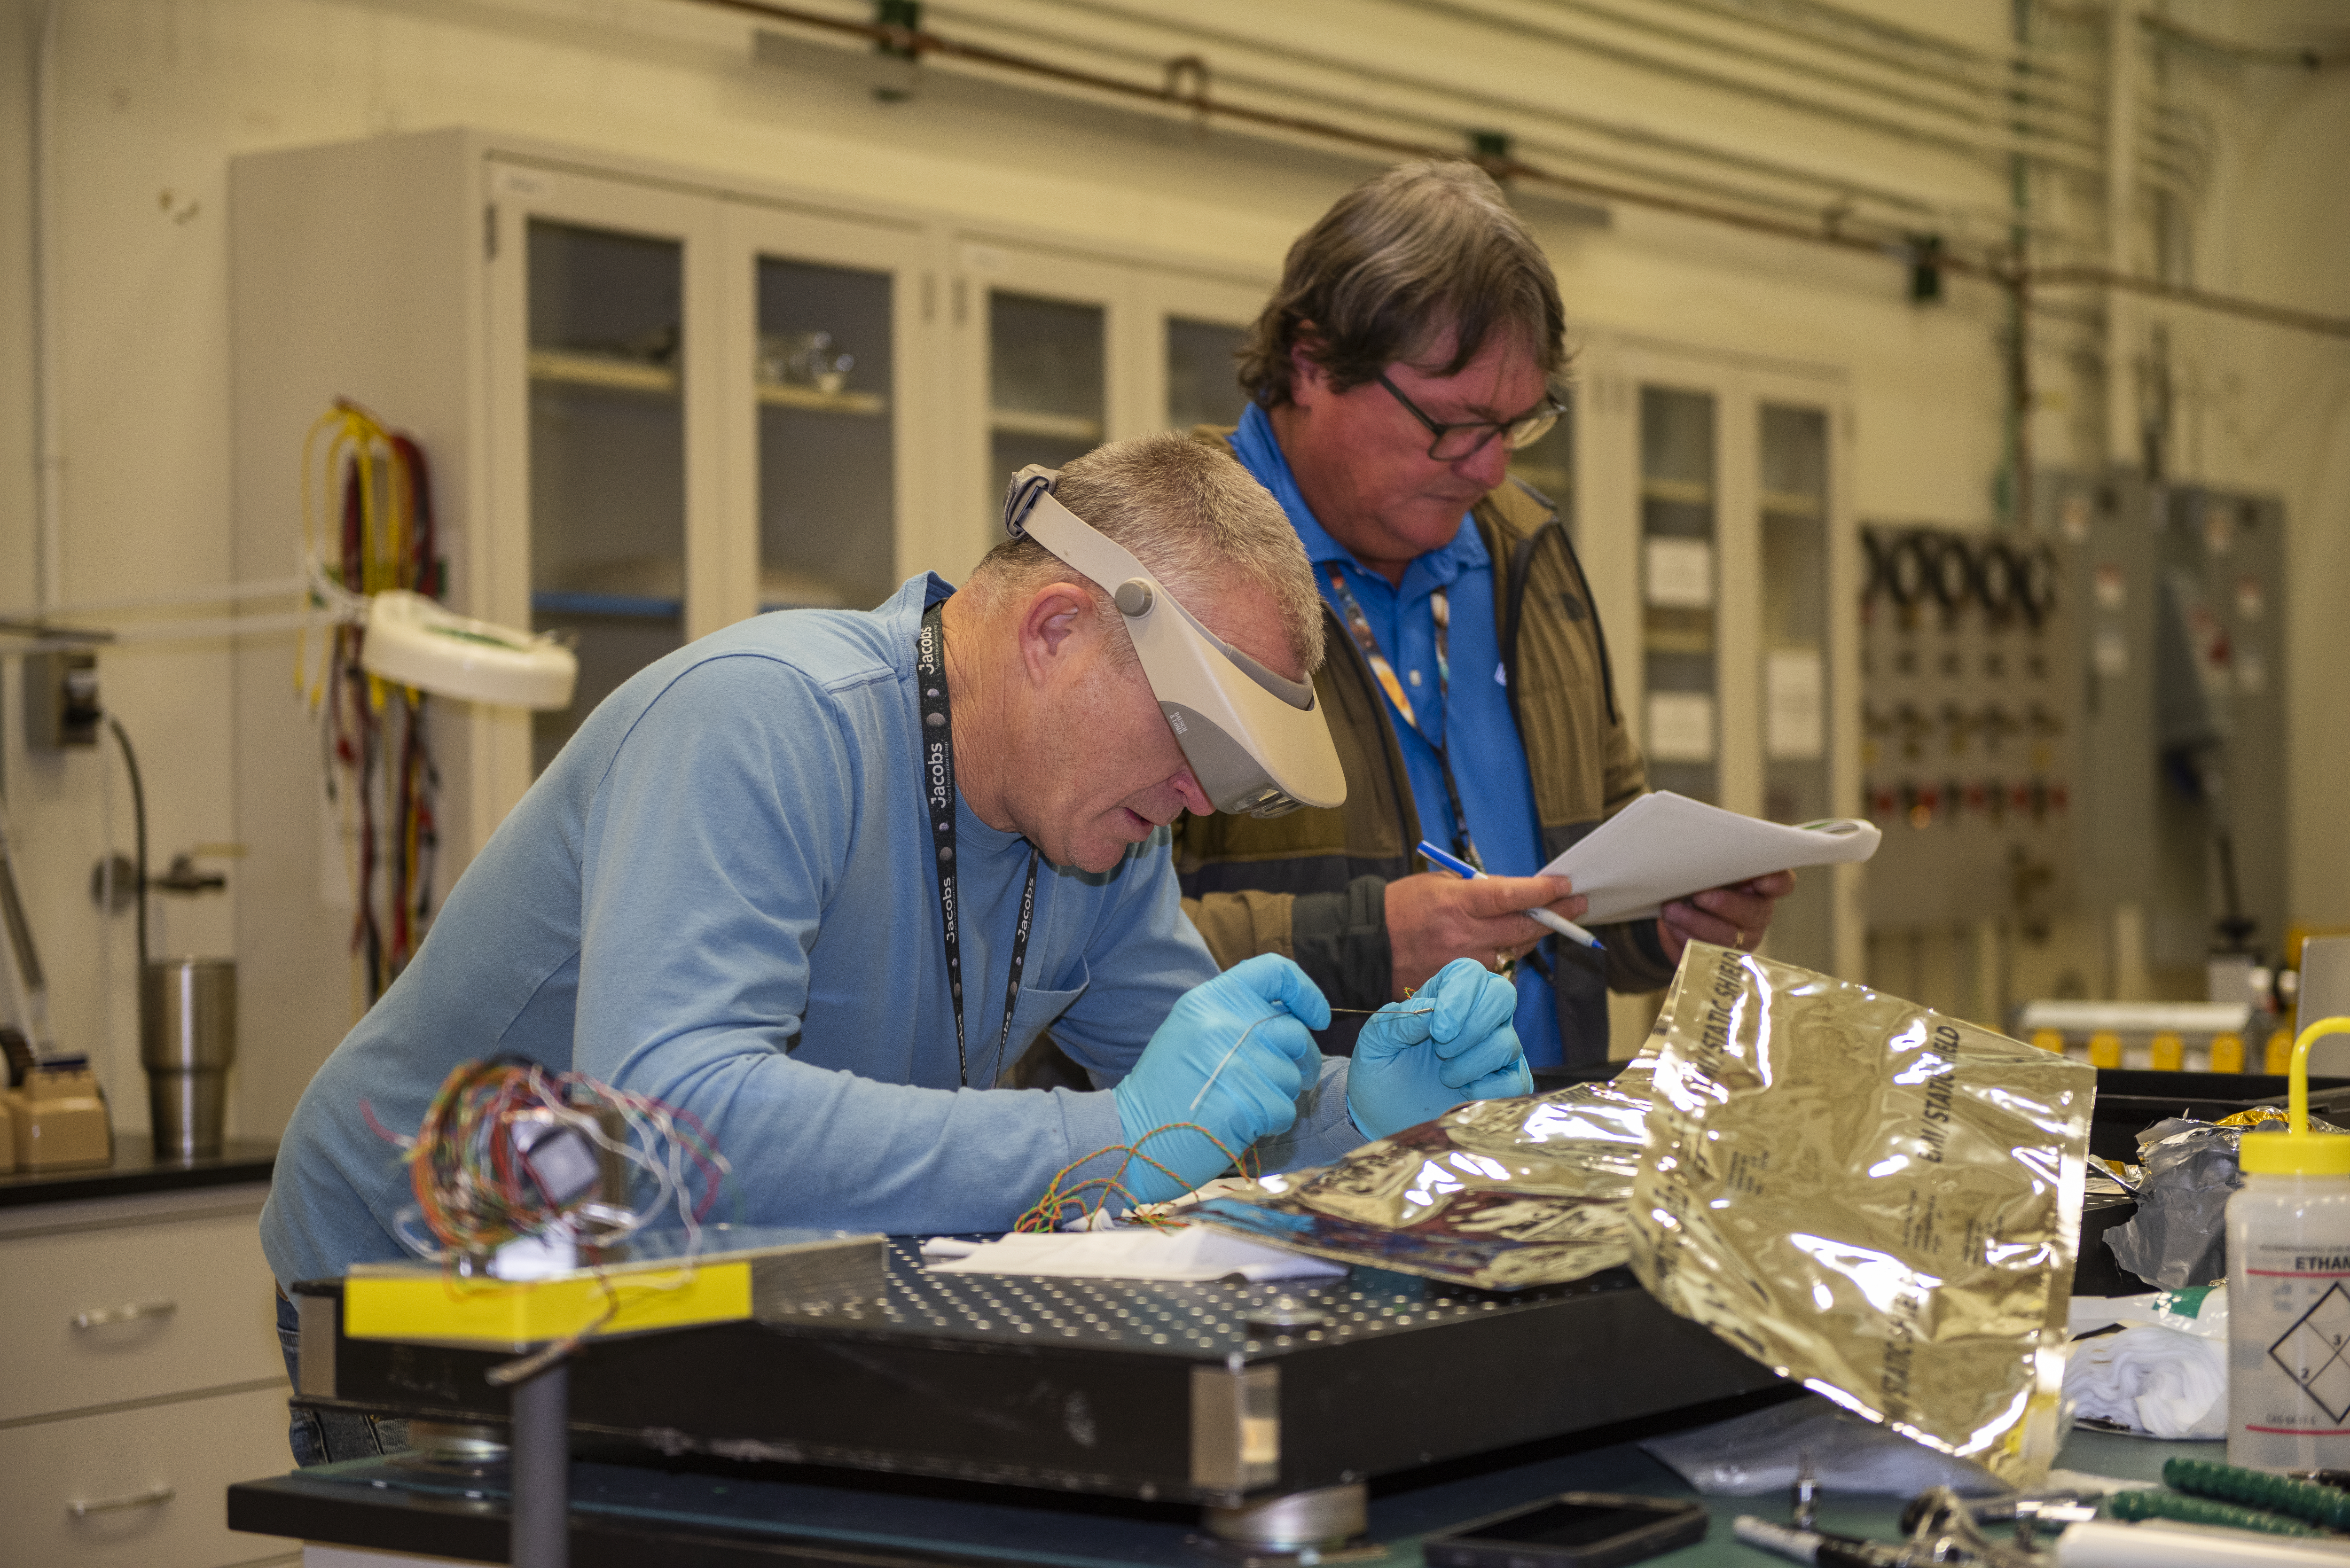
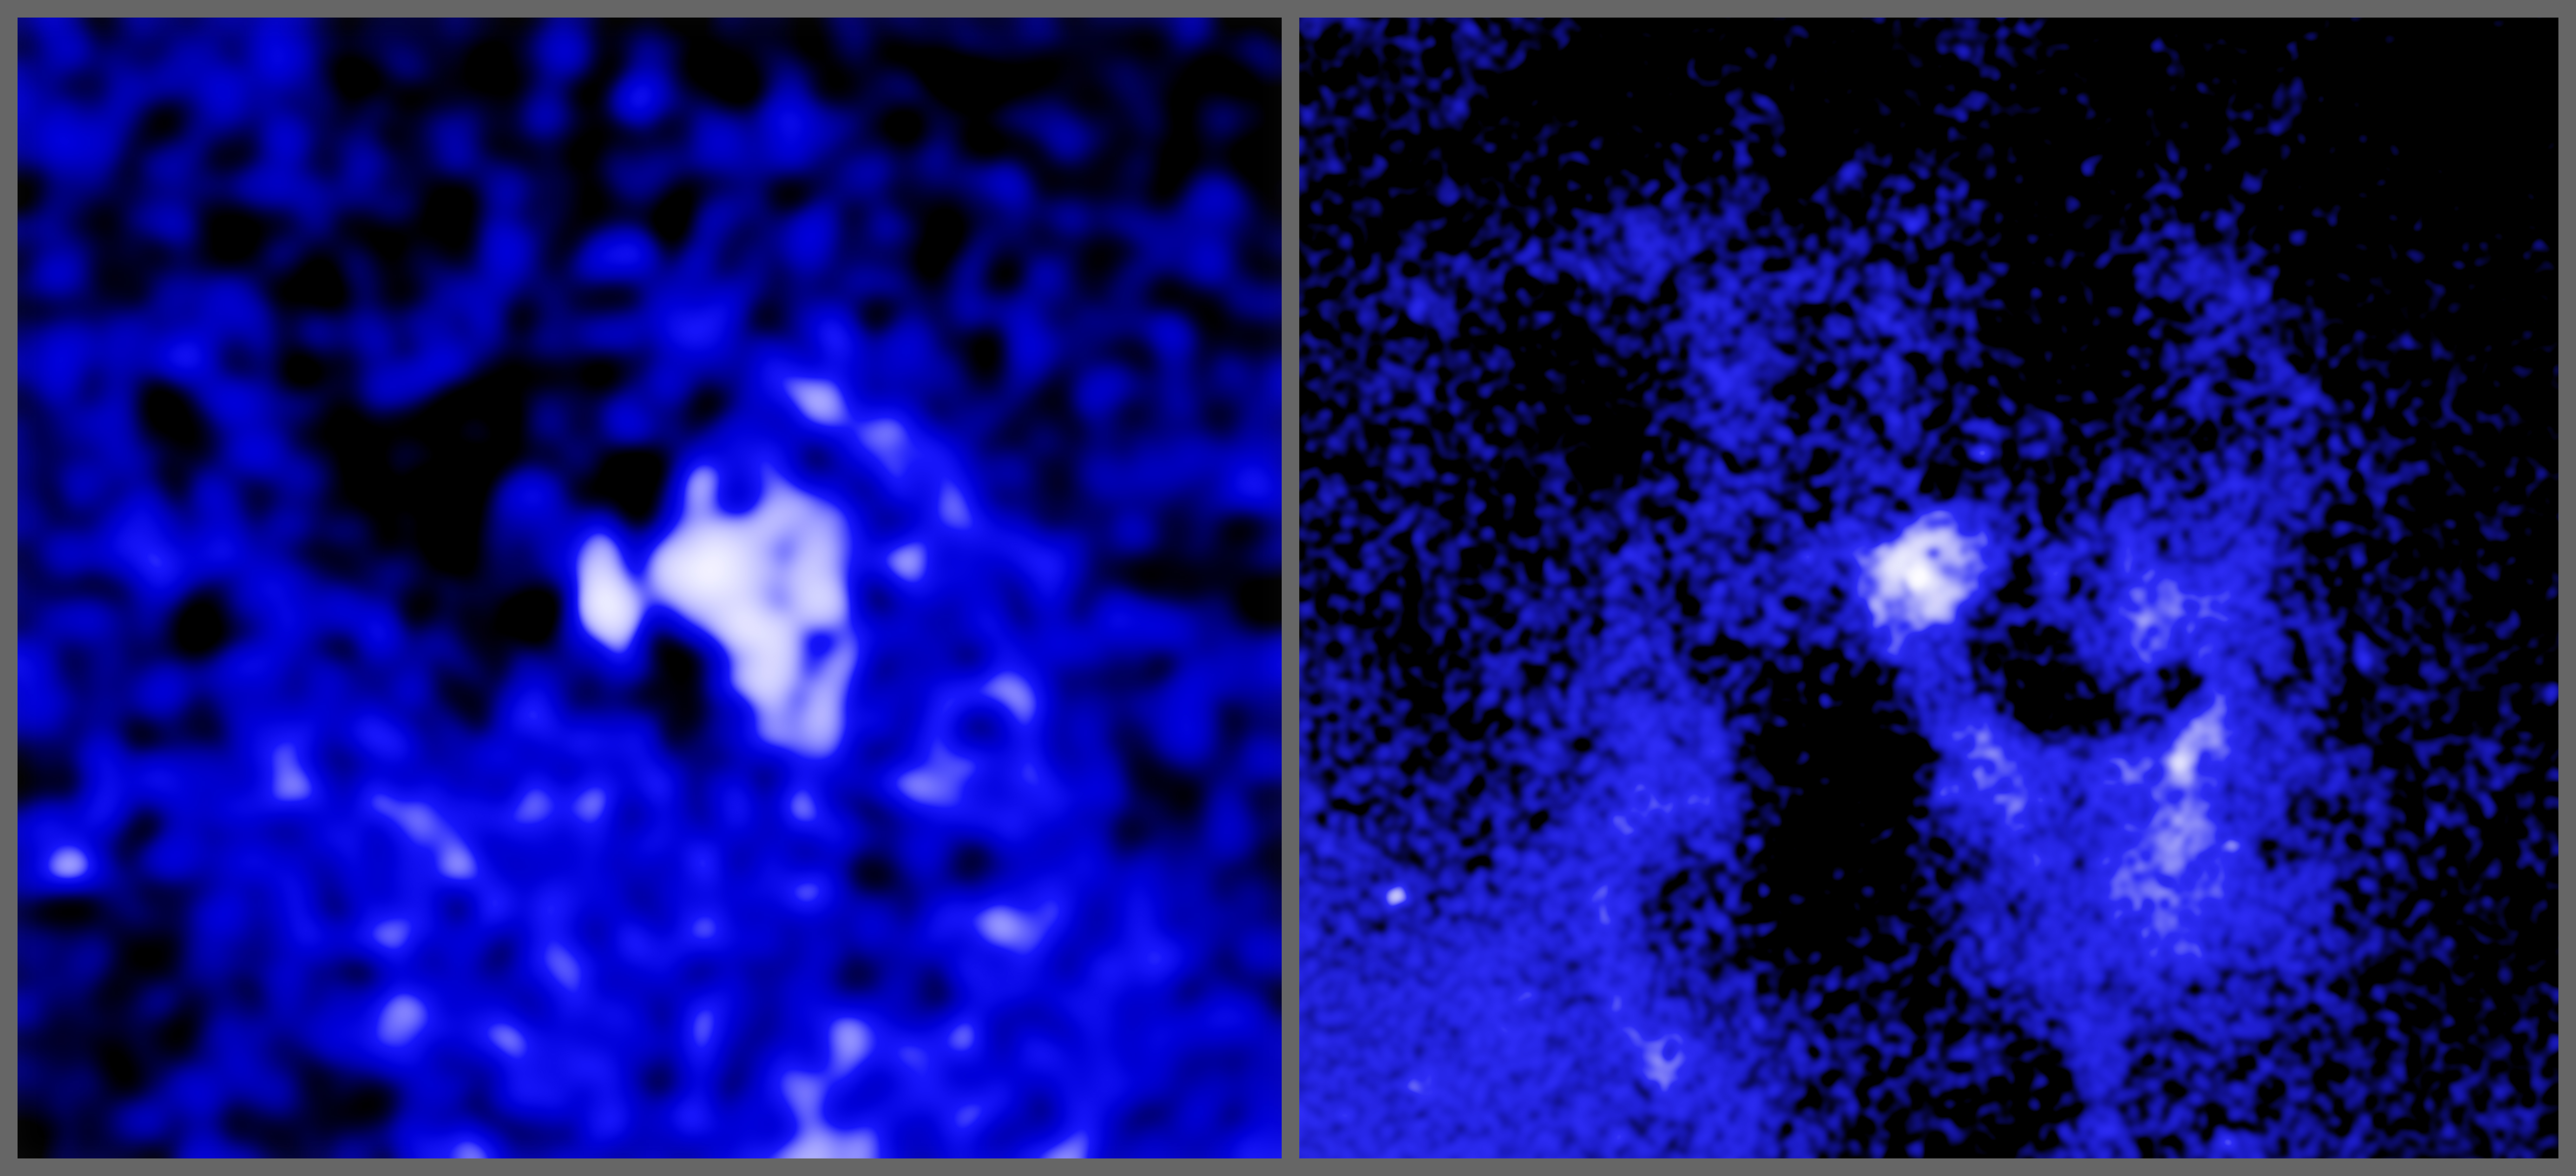
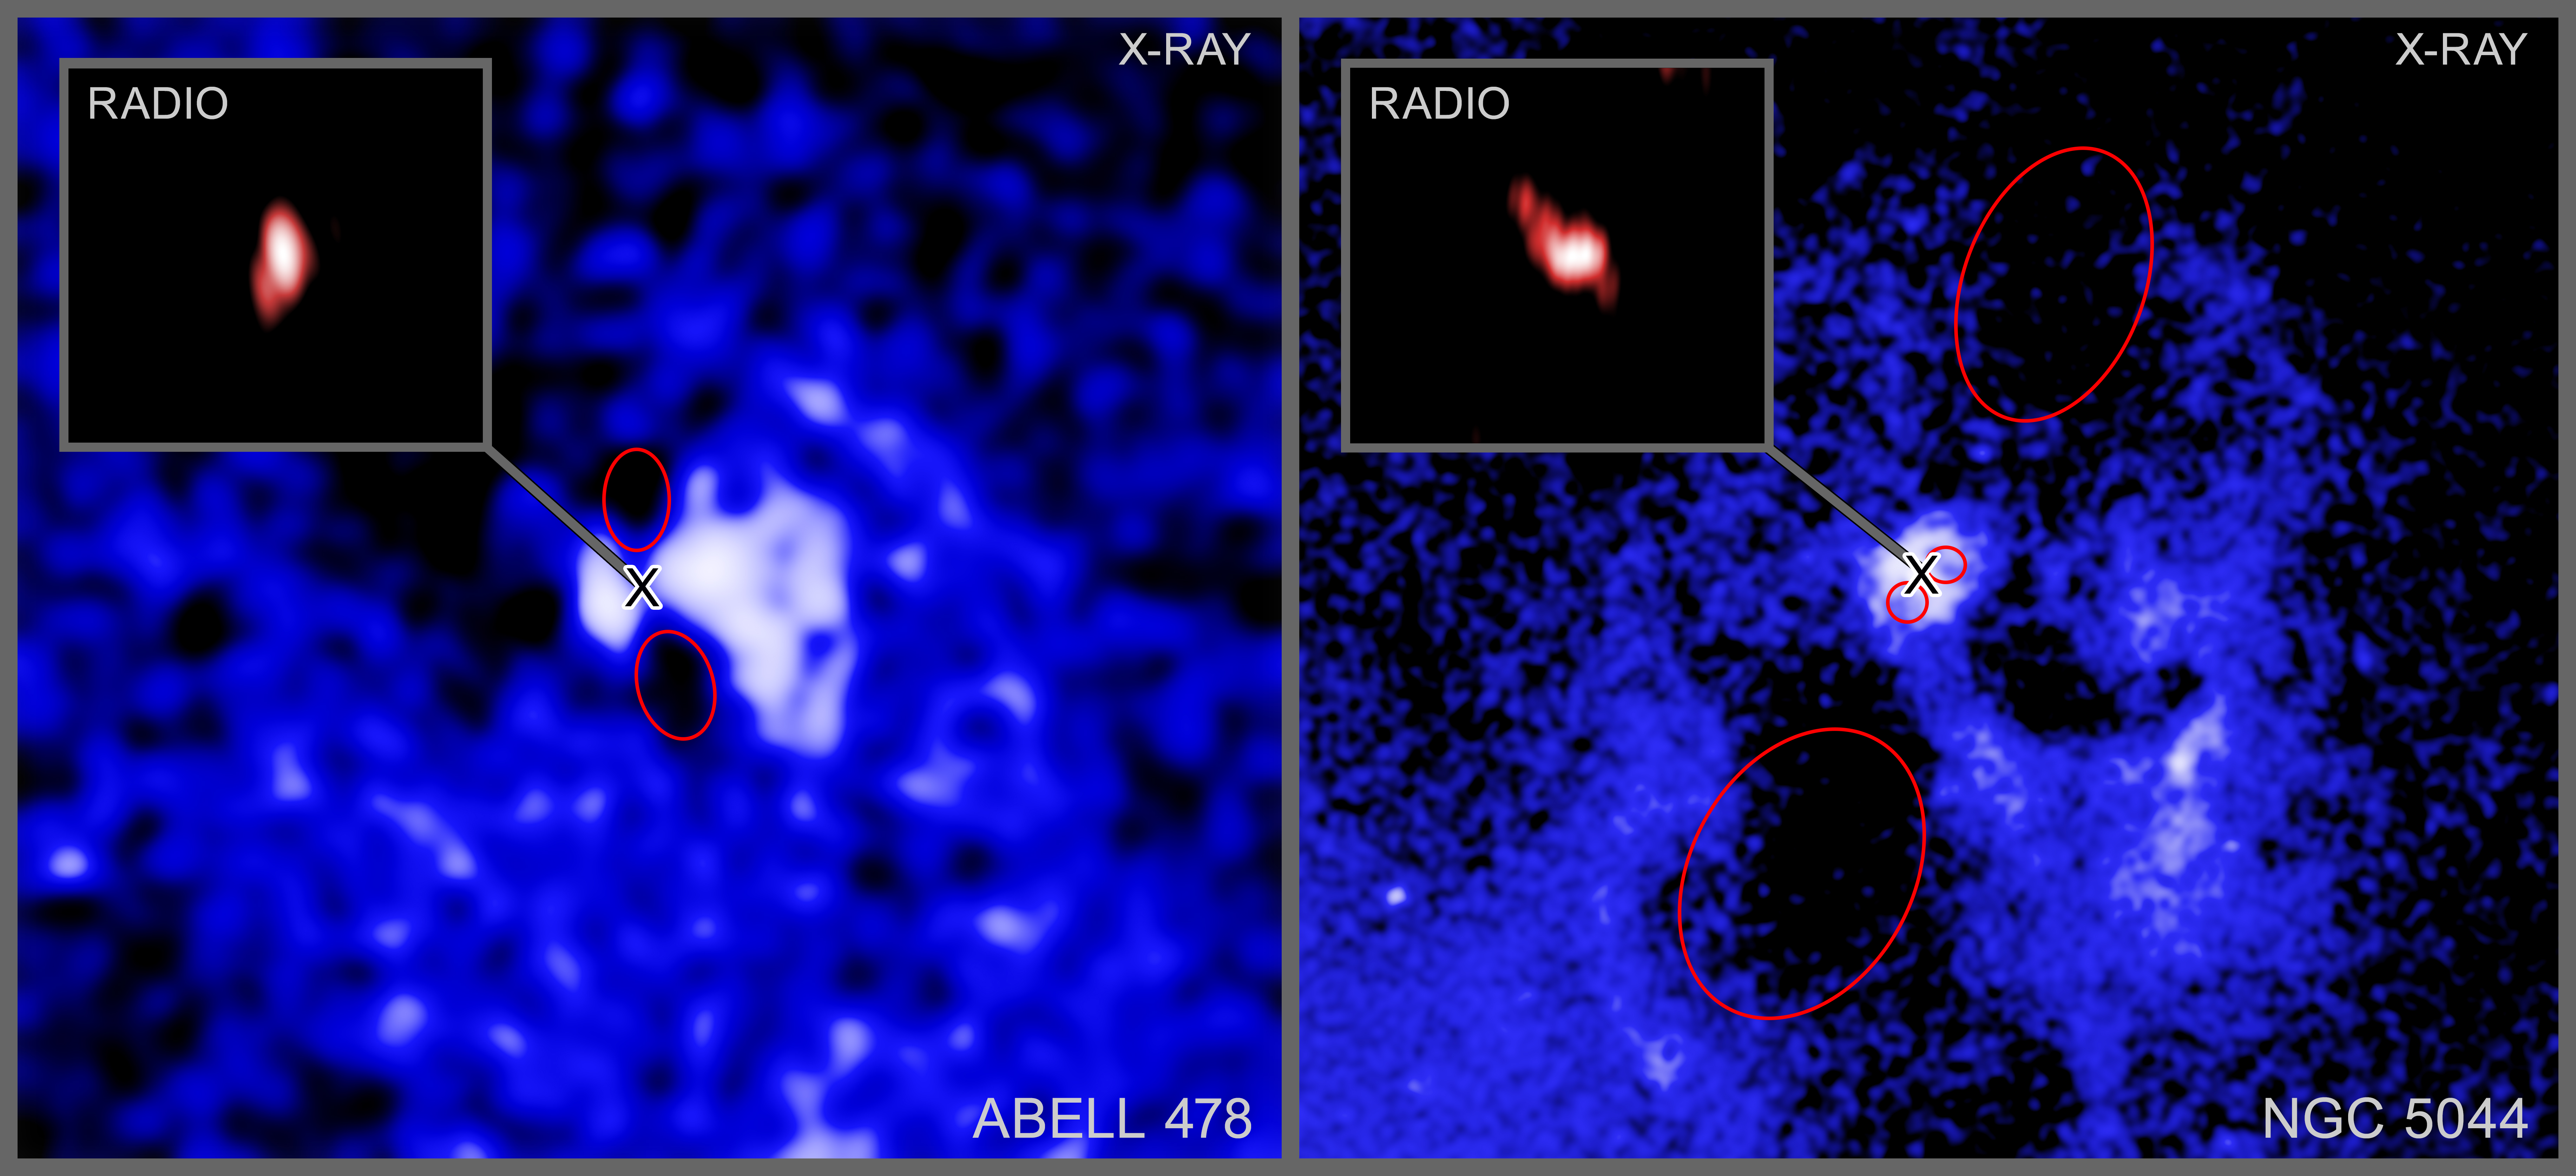
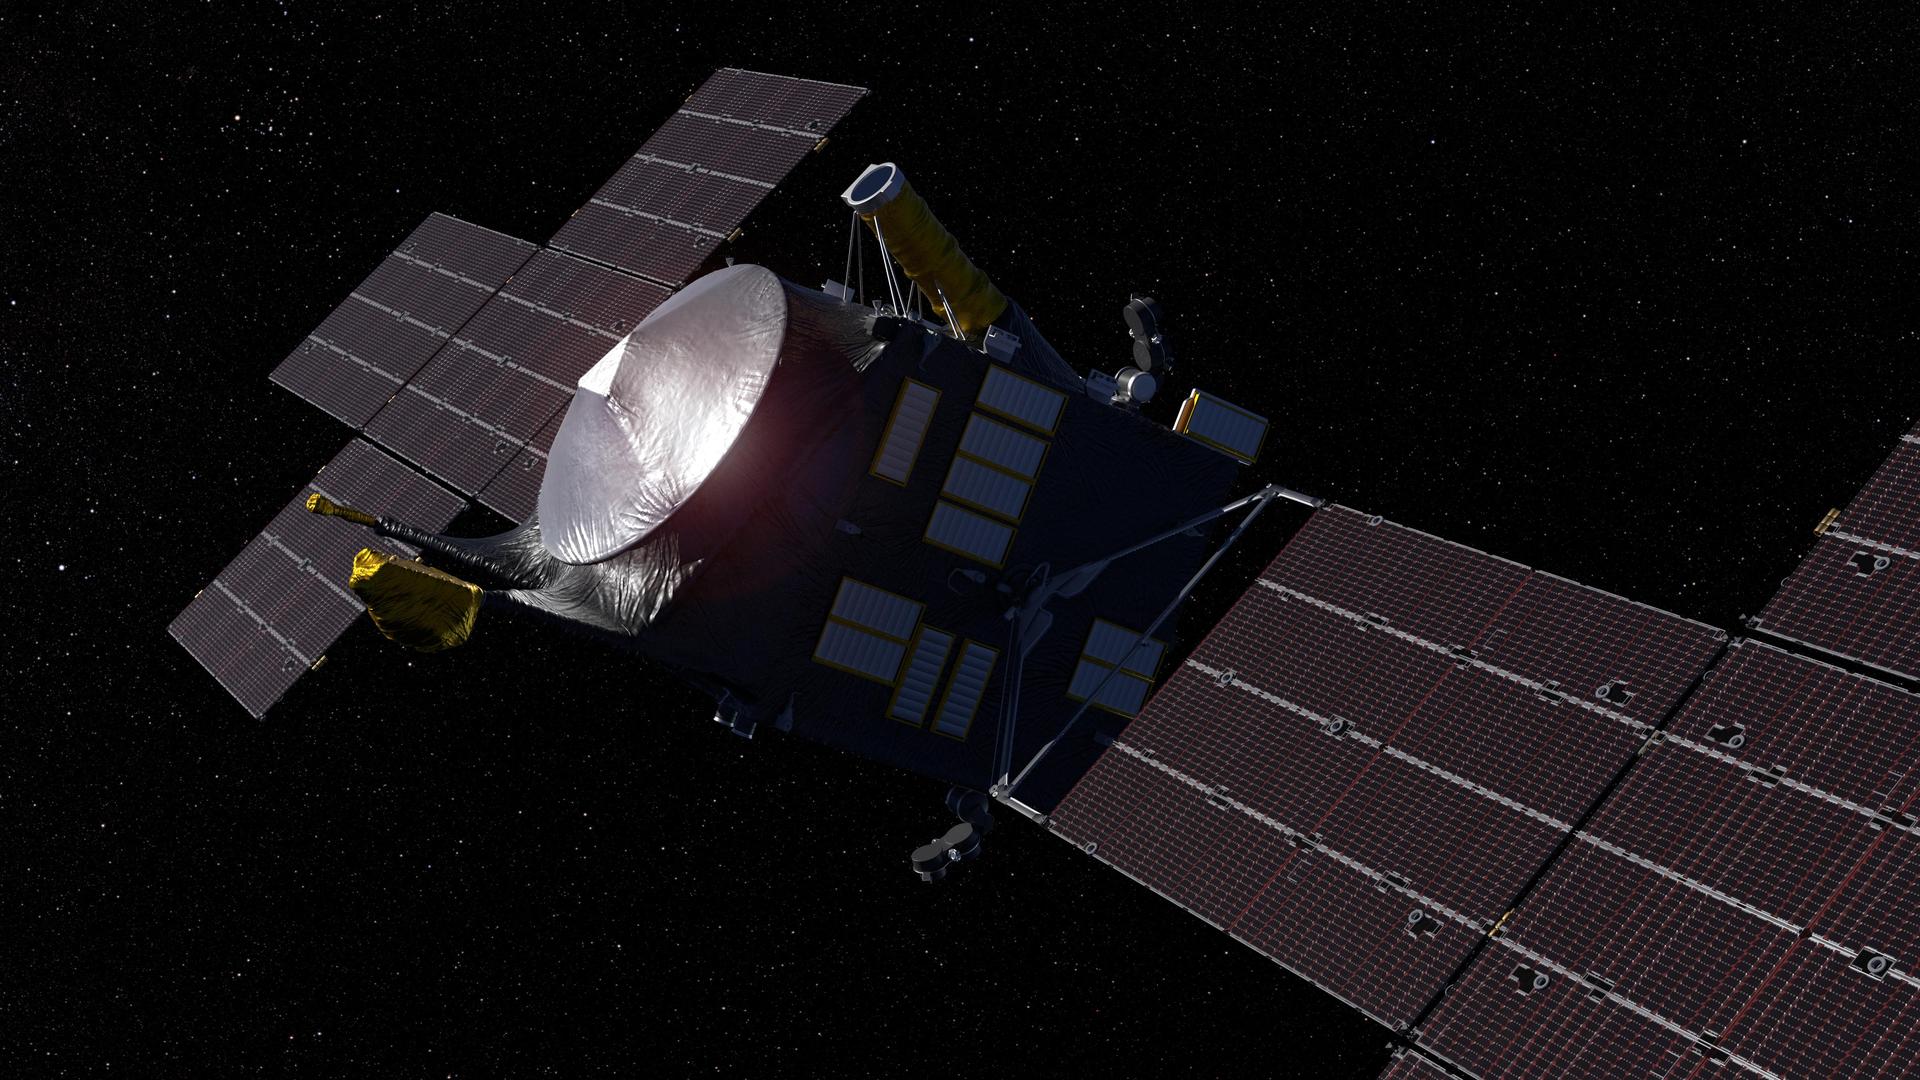
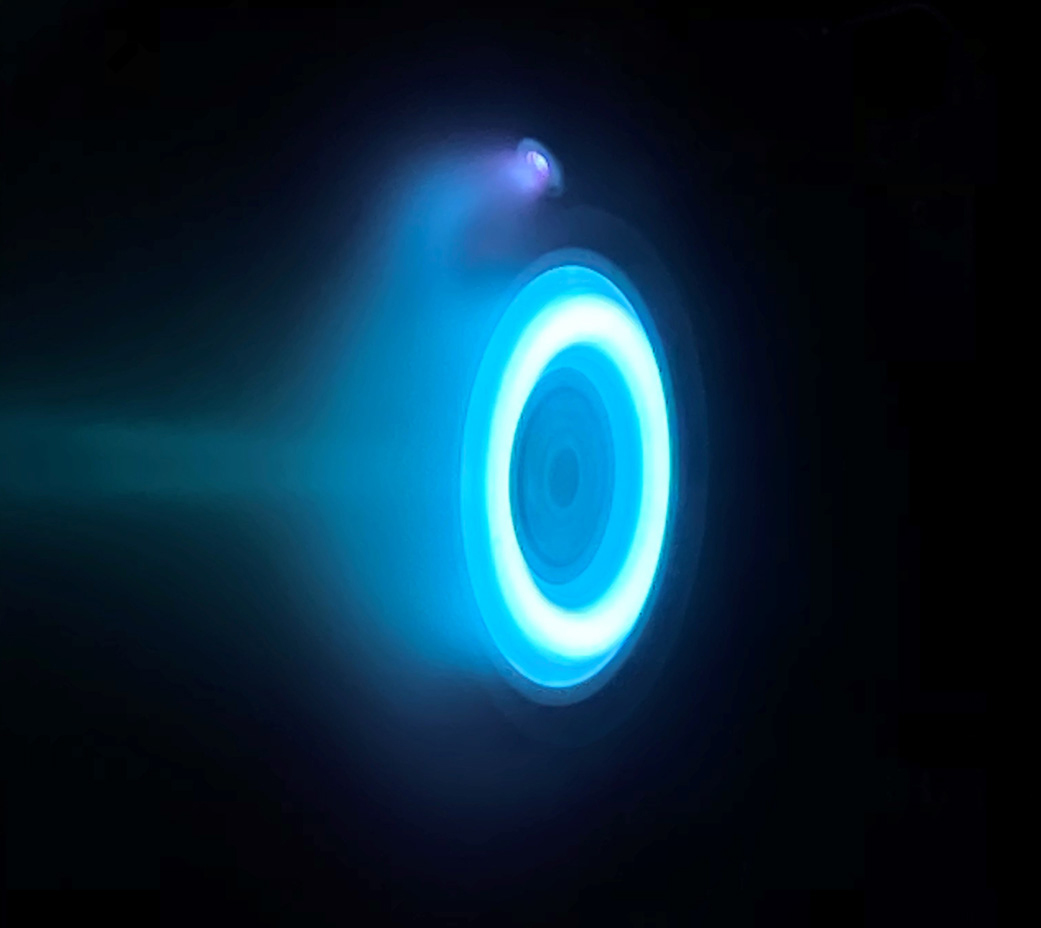
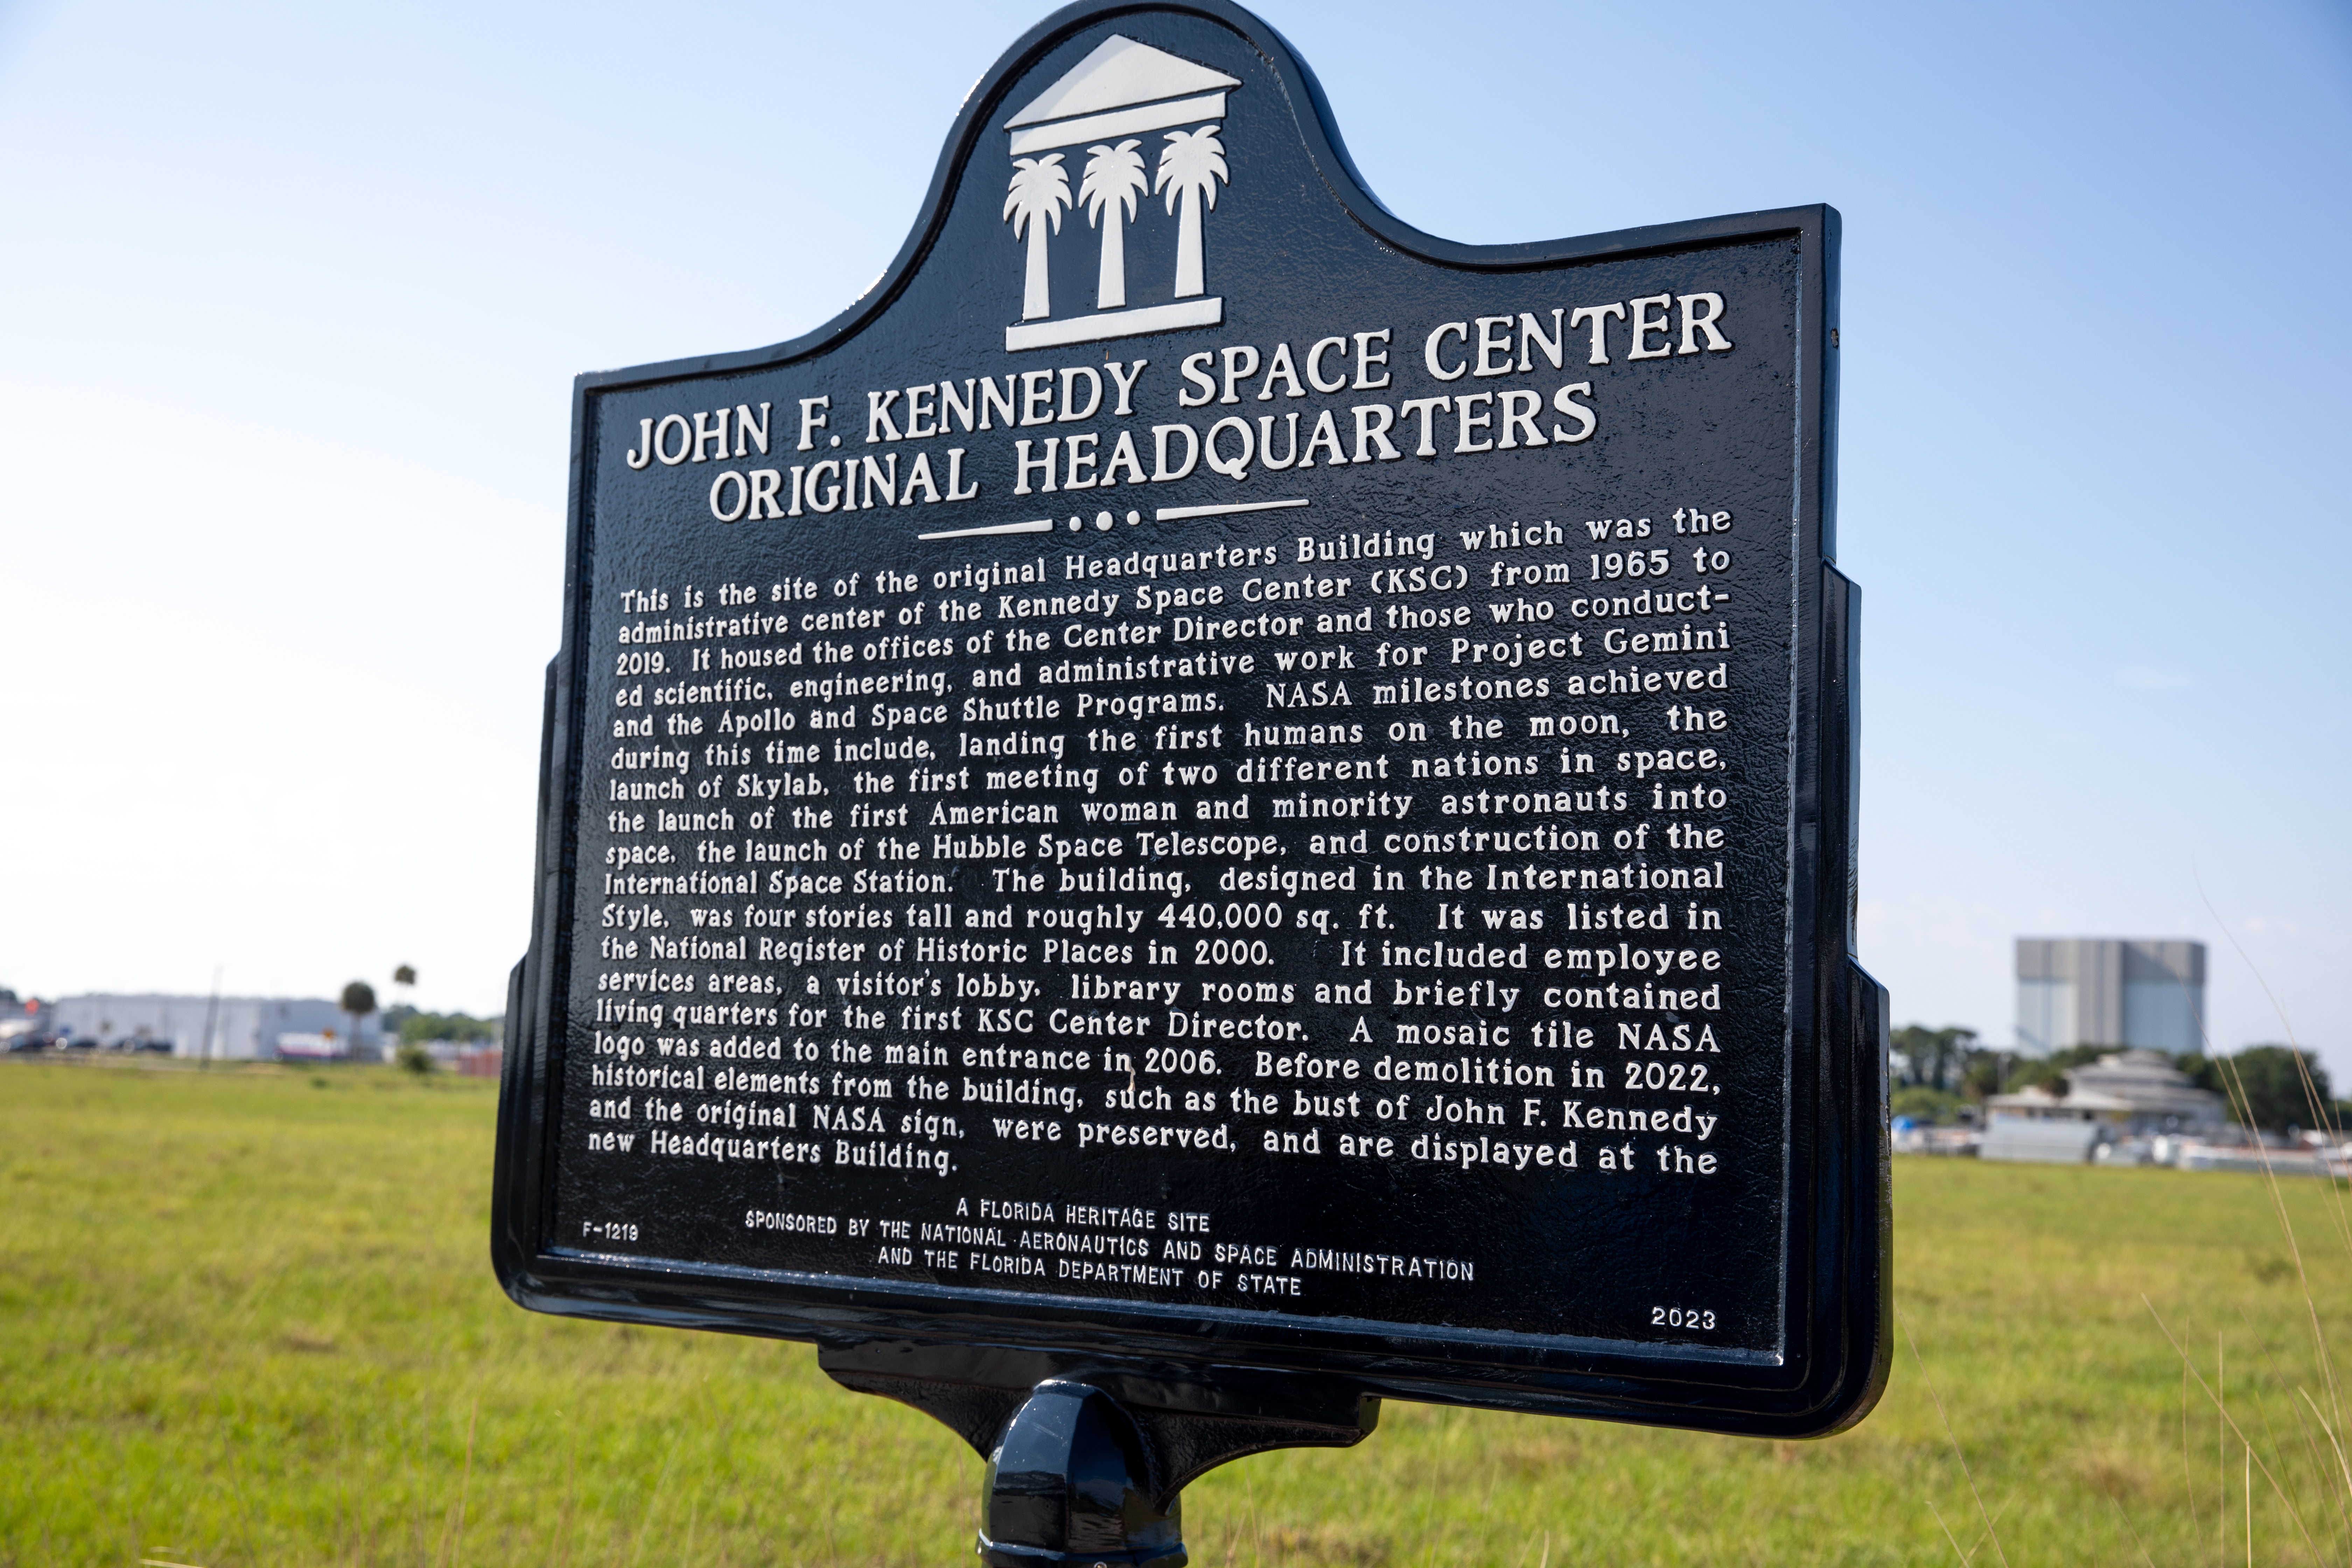
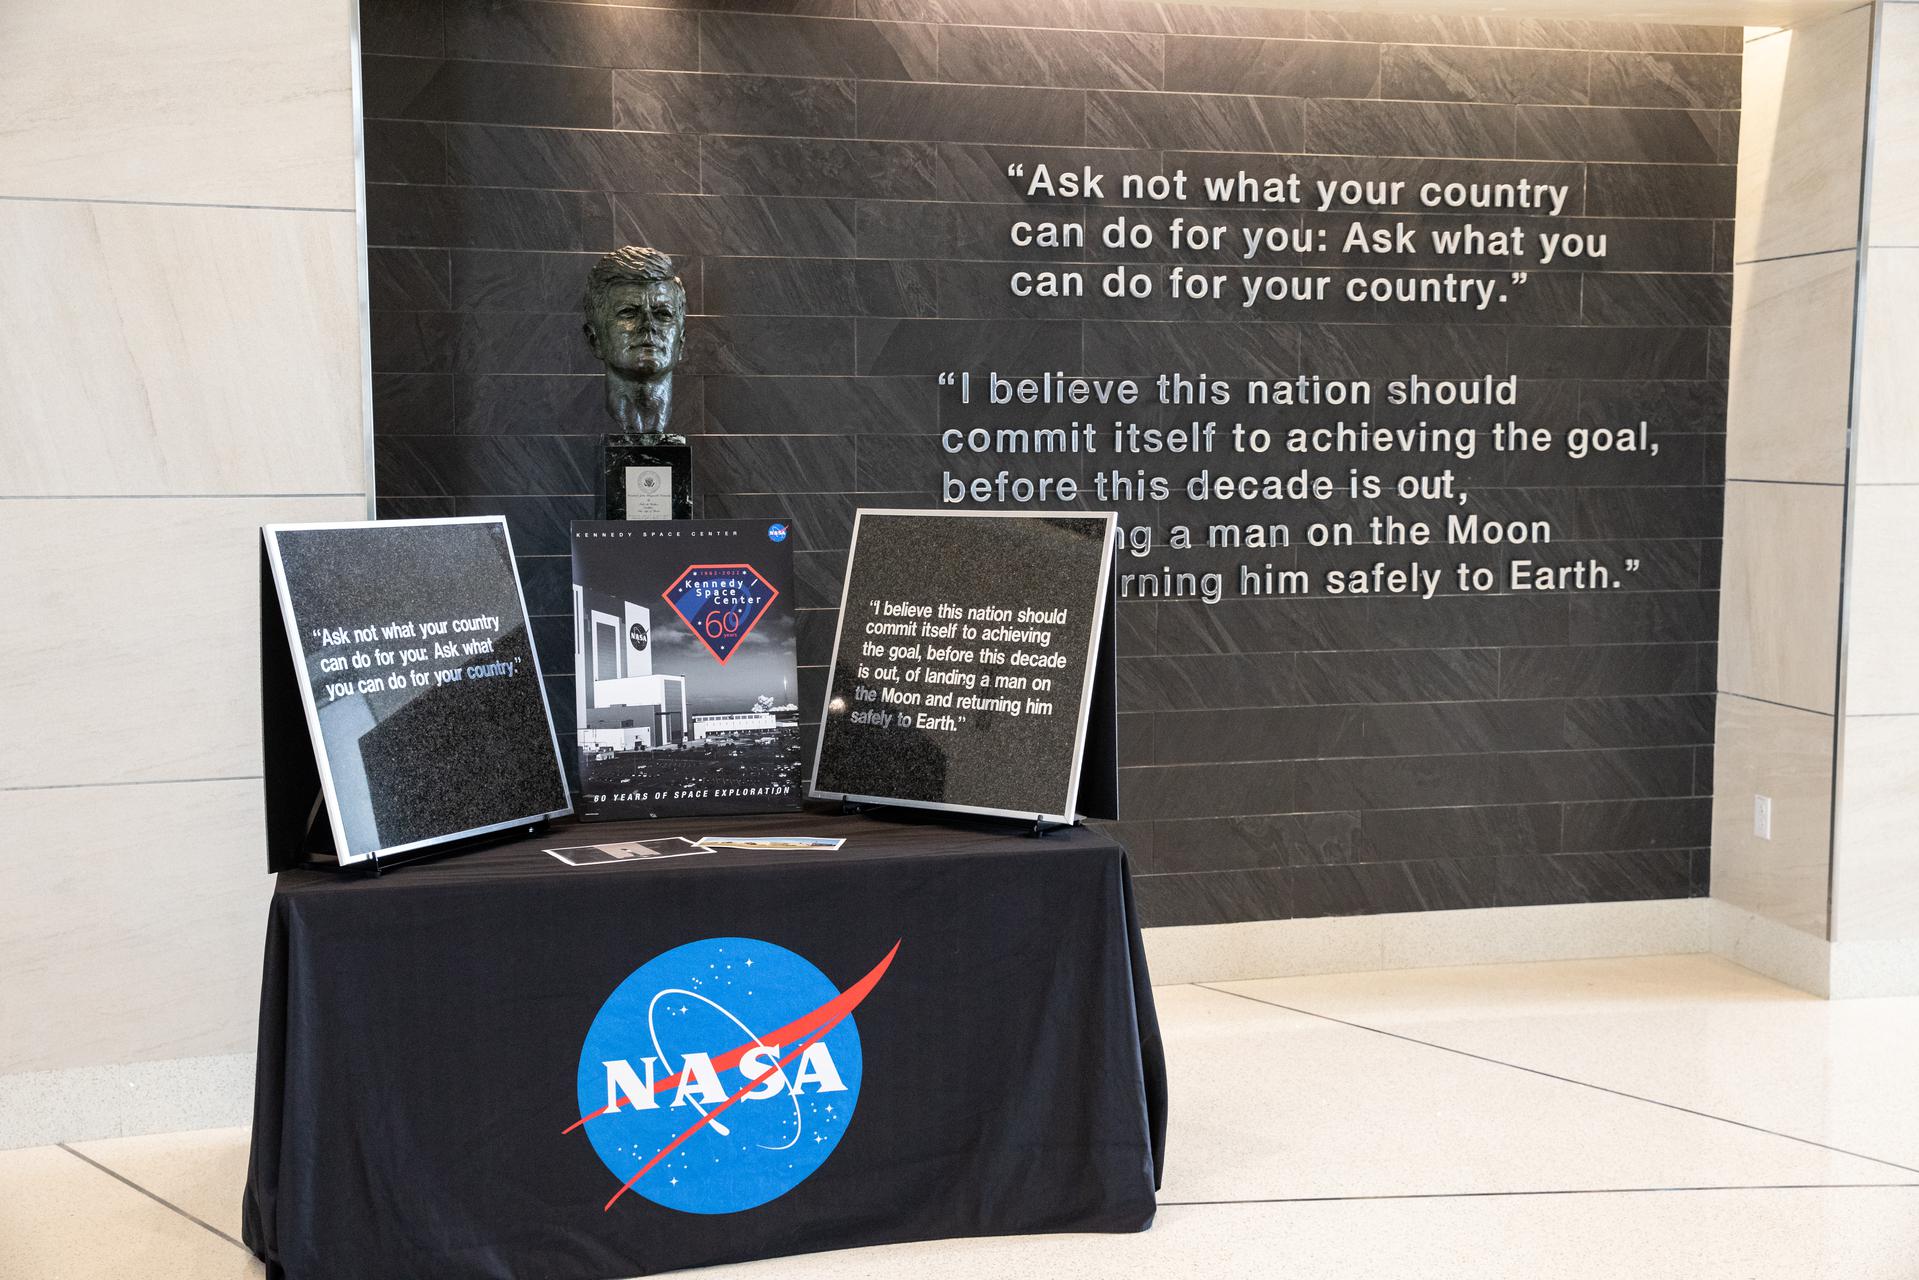
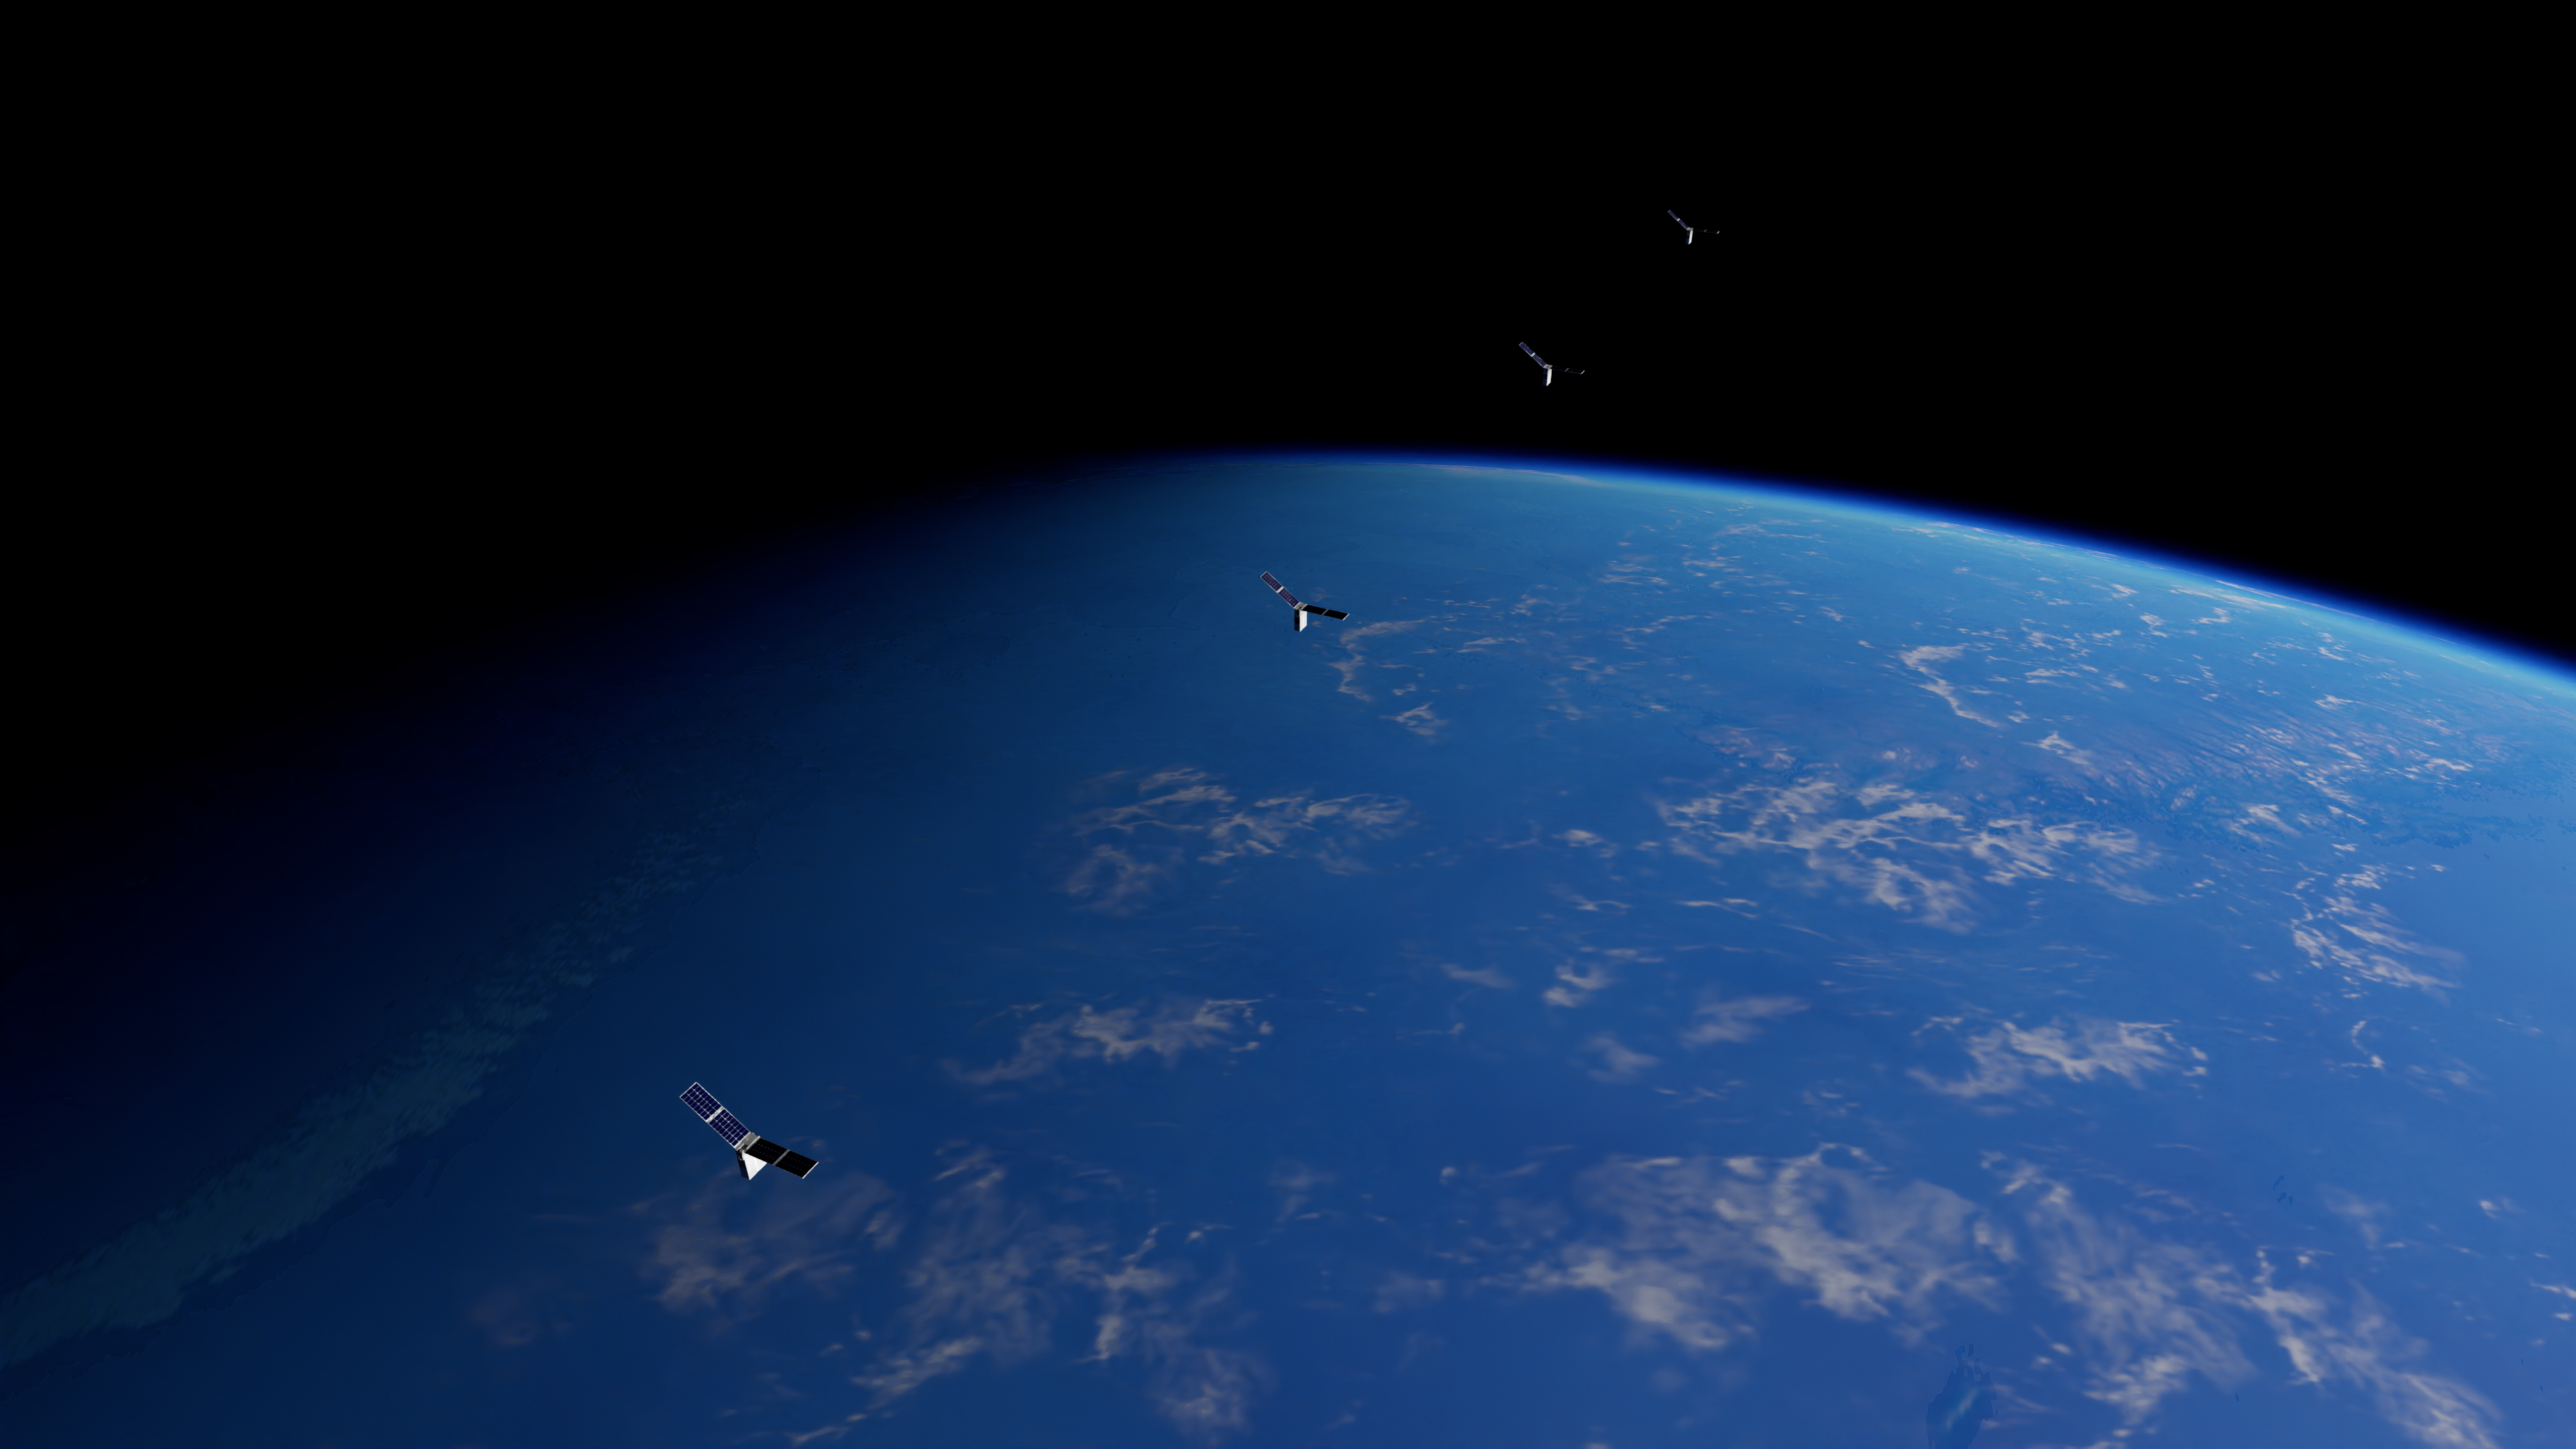
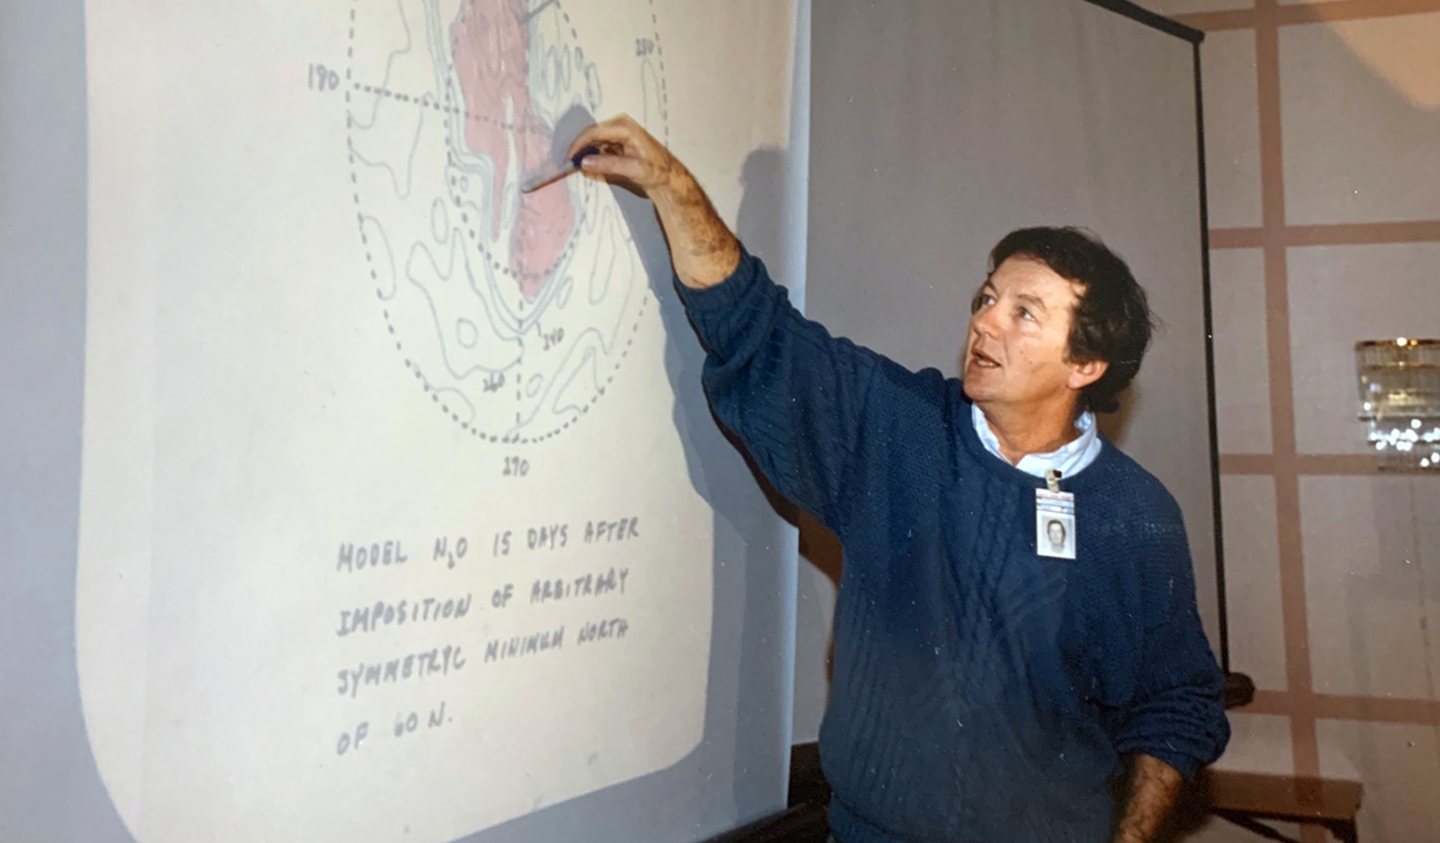
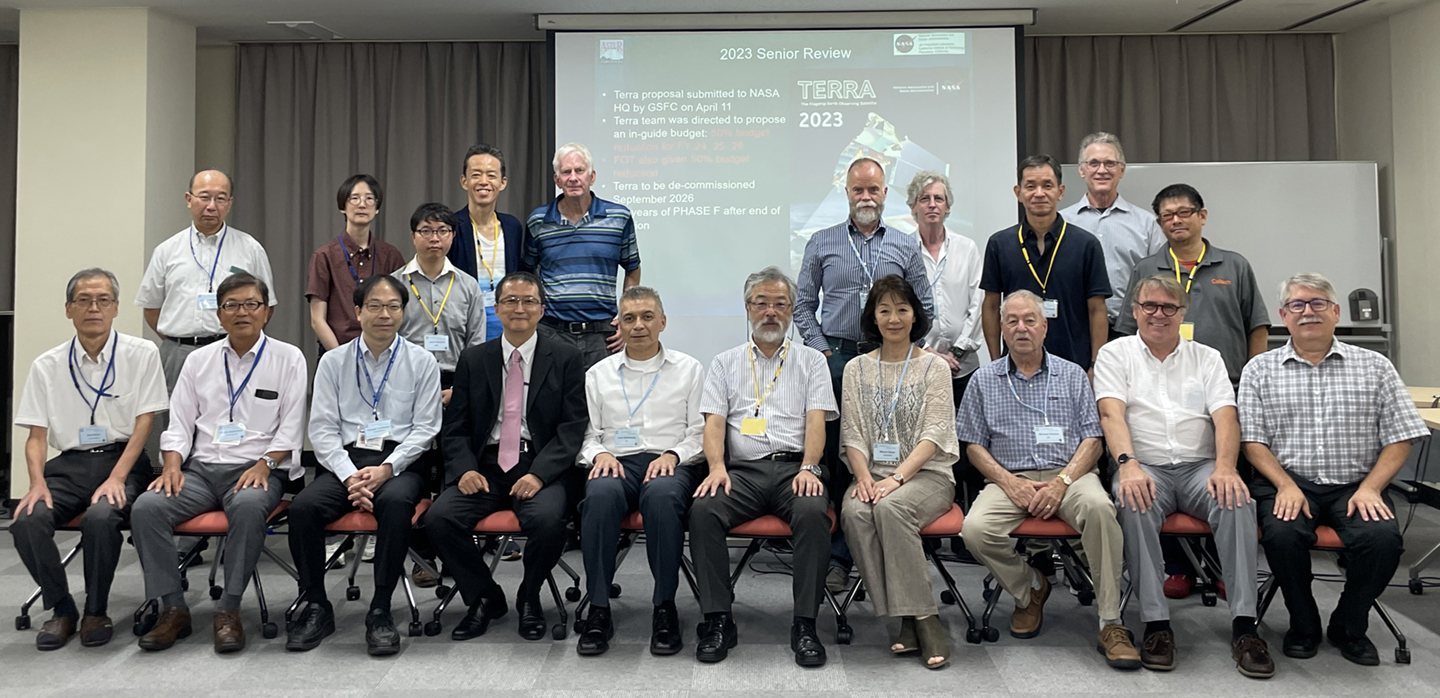
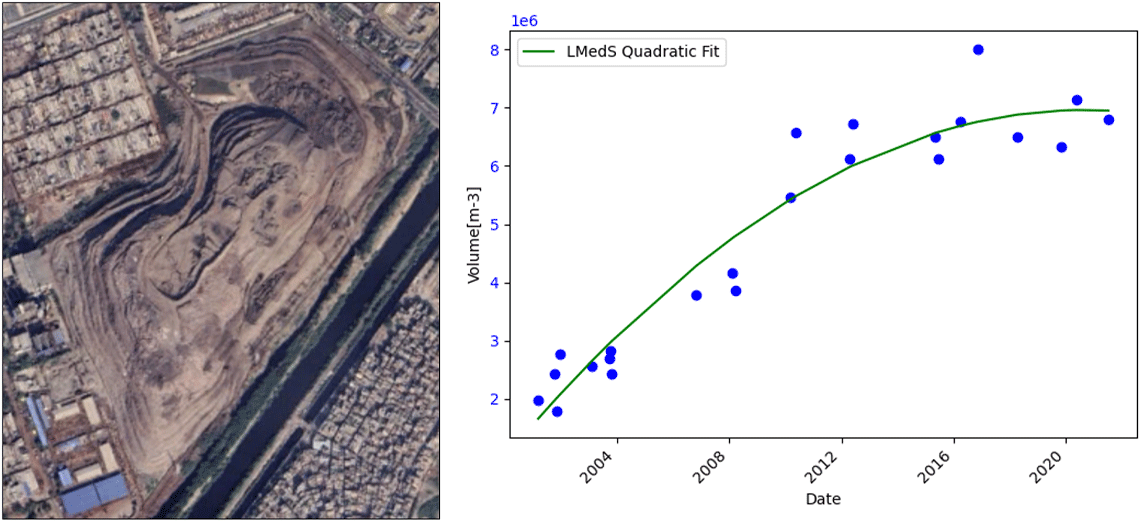
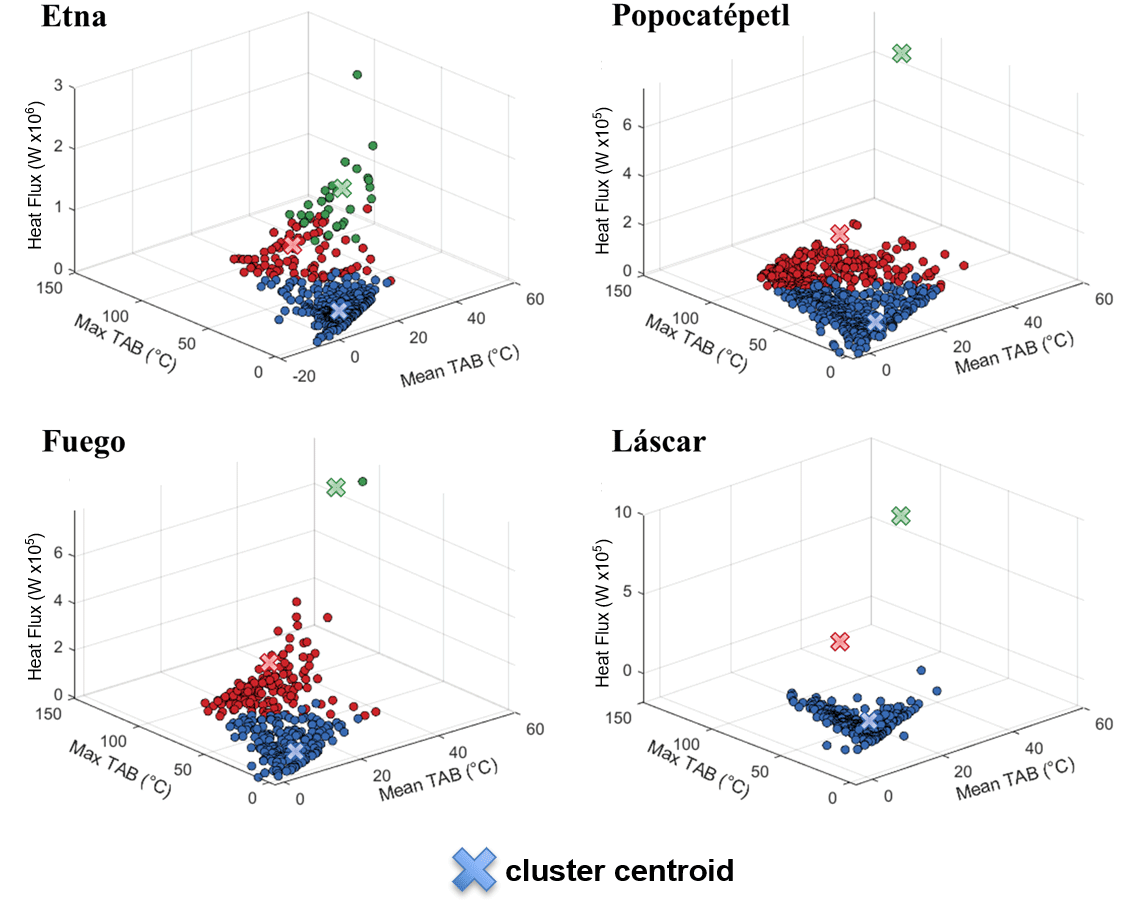
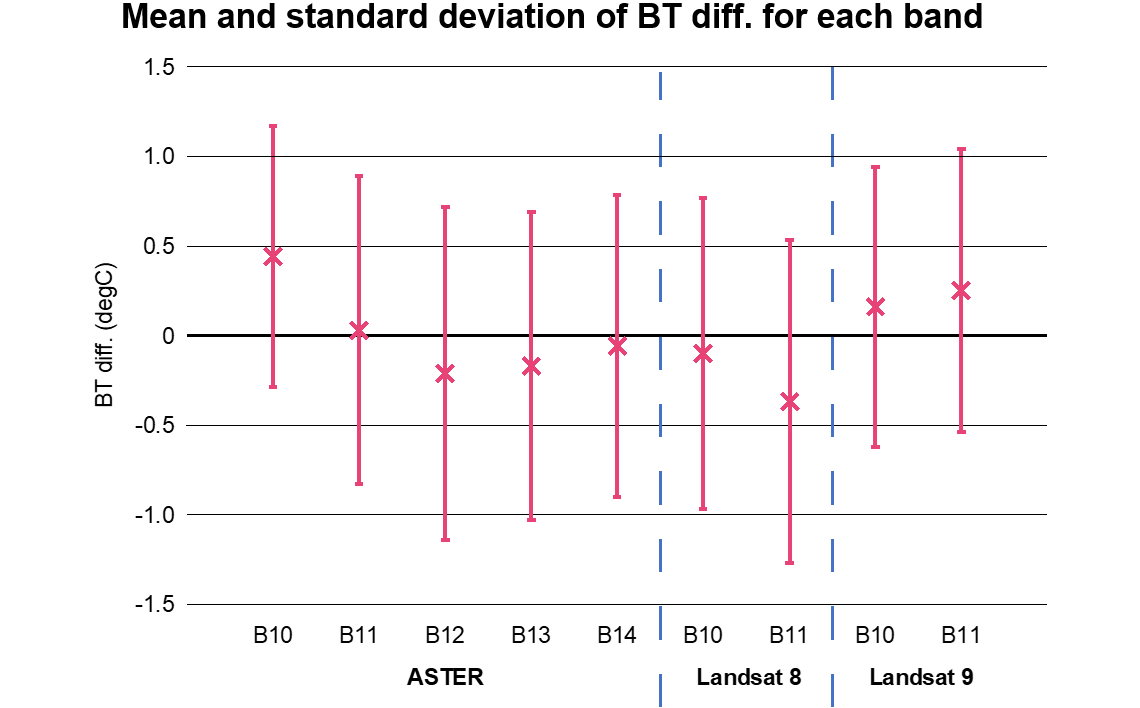