
NASA - Breaking News
NASA Science, Cargo Launch Aboard Northrop Grumman CRS-24
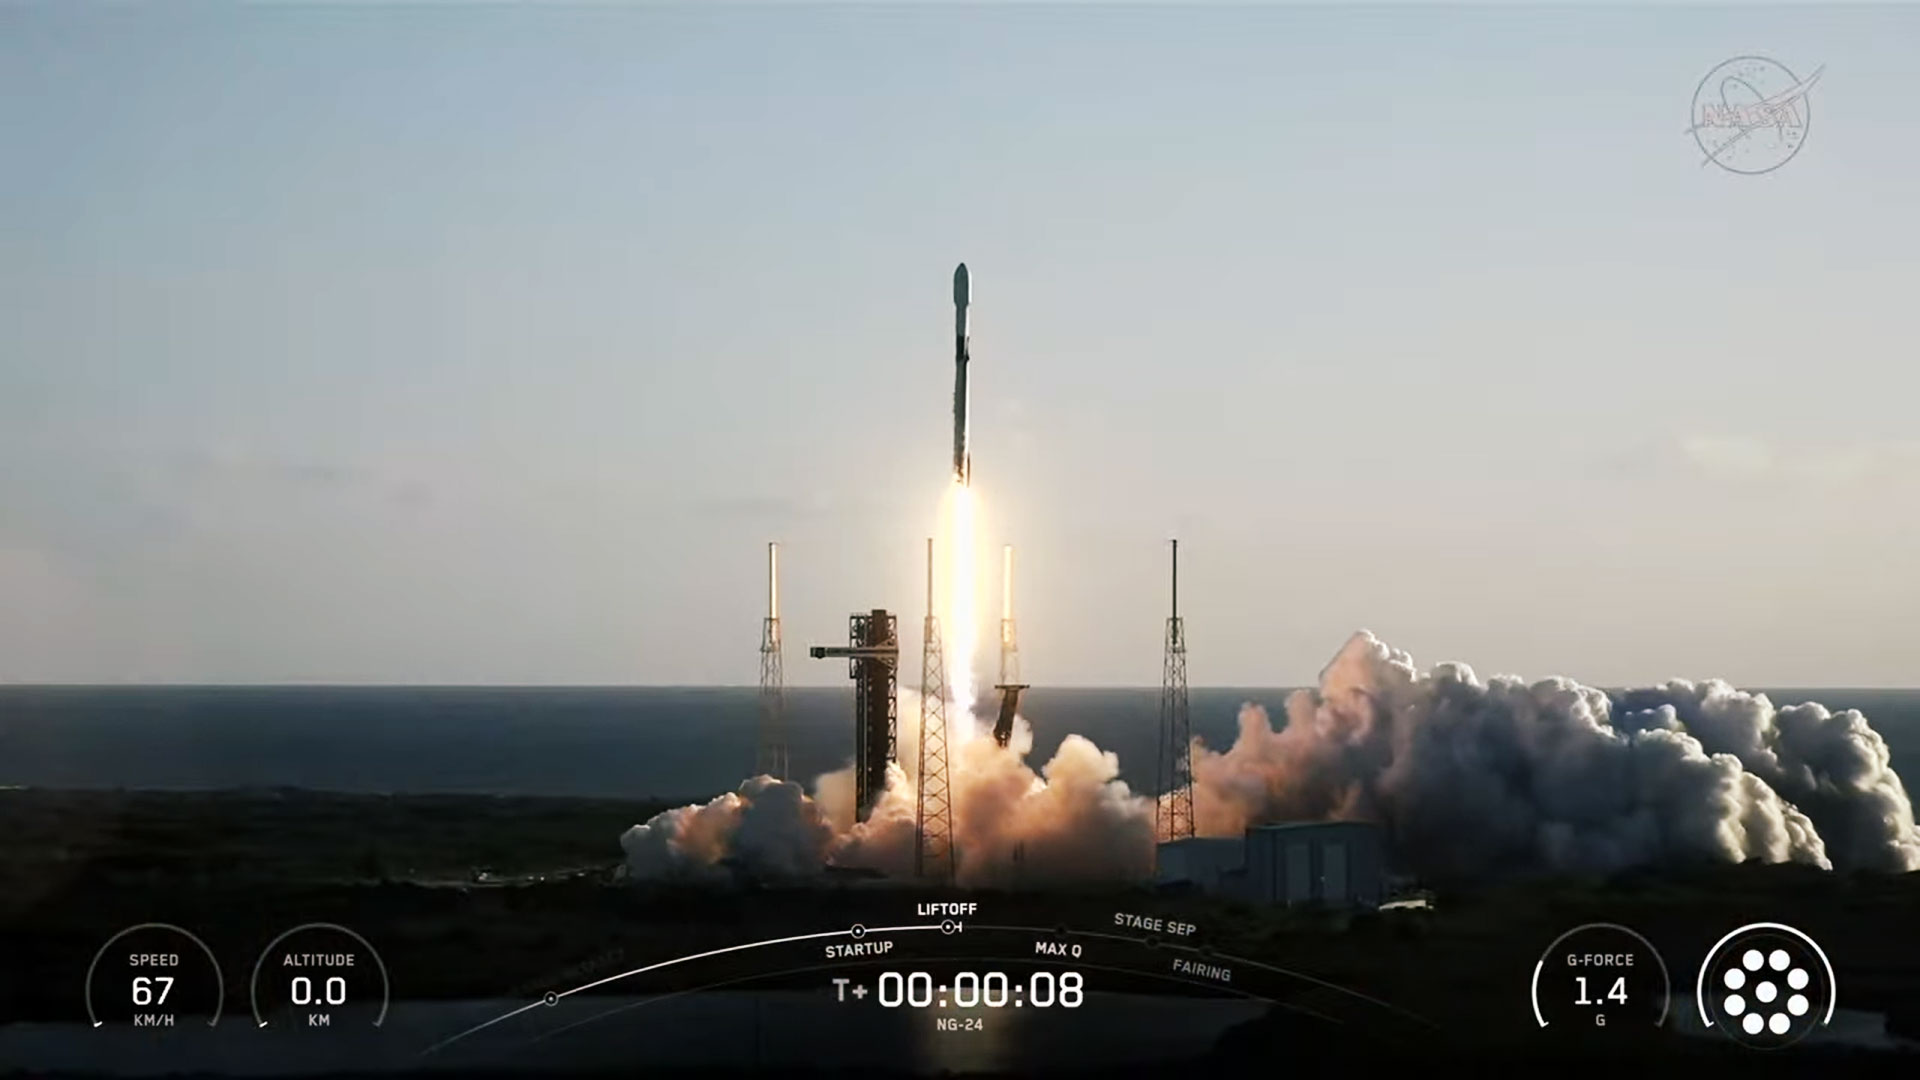
NASA is sending more science, technology demonstrations, and crew supplies to the International Space Station following the successful launch of the agency’s Northrop Grumman Commercial Resupply Services 24 mission, or Northrop Grumman CRS-24.
Northrop Grumman’s Cygnus XL spacecraft, carrying approximately 11,000 pounds of cargo to the orbiting laboratory, lifted off at 7:41 a.m. EDT Saturday on a SpaceX Falcon 9 rocket from Space Launch Complex 40 at Cape Canaveral Space Force Station in Florida.
Watch live coverage of the spacecraft’s arrival to the space station beginning at 12 p.m. on Monday, April 13, on NASA+, Amazon Prime, and the agency’s YouTube channel. Learn how to watch NASA content through a variety of online platforms, including social media.
Cygnus XL is scheduled to be captured at 12:50 p.m. by the station’s Canadarm2 robotic arm, operated by NASA astronauts Jack Hathaway and Chris Williams. After capture, the spacecraft will be installed on the Unity module’s Earth-facing port for cargo unloading.
NASA’s arrival and capture coverage is as follows (all times Eastern and subject to change based on real-time operations):
Monday, April 13
12 p.m. – Arrival coverage begins on NASA+, Amazon Prime, and the agency’s YouTube channel.
12:50 p.m. – Capture of Cygnus XL with the space station’s robotic arm.
The resupply mission is carrying dozens of research experiments that will be conducted during Expedition 74/75, including a new module to advance quantum science that could improve computing technology and aid in the search for dark matter, and hardware to produce a greater number of therapeutic stem cells for blood diseases and cancer. Cygnus also carries model organisms to study the gut microbiome and a receiver that could enhance space weather models to protect critical space infrastructure, such as GPS and radar.
These experiments are just some of the hundreds of scientific investigations conducted aboard the orbiting laboratory in the areas of biology and biotechnology, Earth and space science, physical sciences, and technology development and demonstrations.
Cygnus XL is scheduled to remain at the orbiting laboratory until October, before it departs and disposes of thousands of pounds of trash through its re-entry into Earth’s atmosphere, where it will harmlessly burn up.
Northrop Grumman named the spacecraft the S.S. Steven R. Nagel in honor of the former NASA astronaut who flew four space shuttle missions, commanded the Gamma Ray Observatory deployment, and logged 723 hours in space.
Learn more about this NASA commercial resupply mission at:
https://www.nasa.gov/mission/nasas-northrop-grumman-crs-24/
-end-
Josh Finch
Headquarters, Washington
202-358-1100
joshua.a.finch@nasa.gov
Amanda Griffin
Kennedy Space Center, Fla.
321-876-2468
amanda.a.griffin@nasa.gov
Sandra Jones
Johnson Space Center, Houston
281-483-5111
sandra.p.jones@nasa.gov
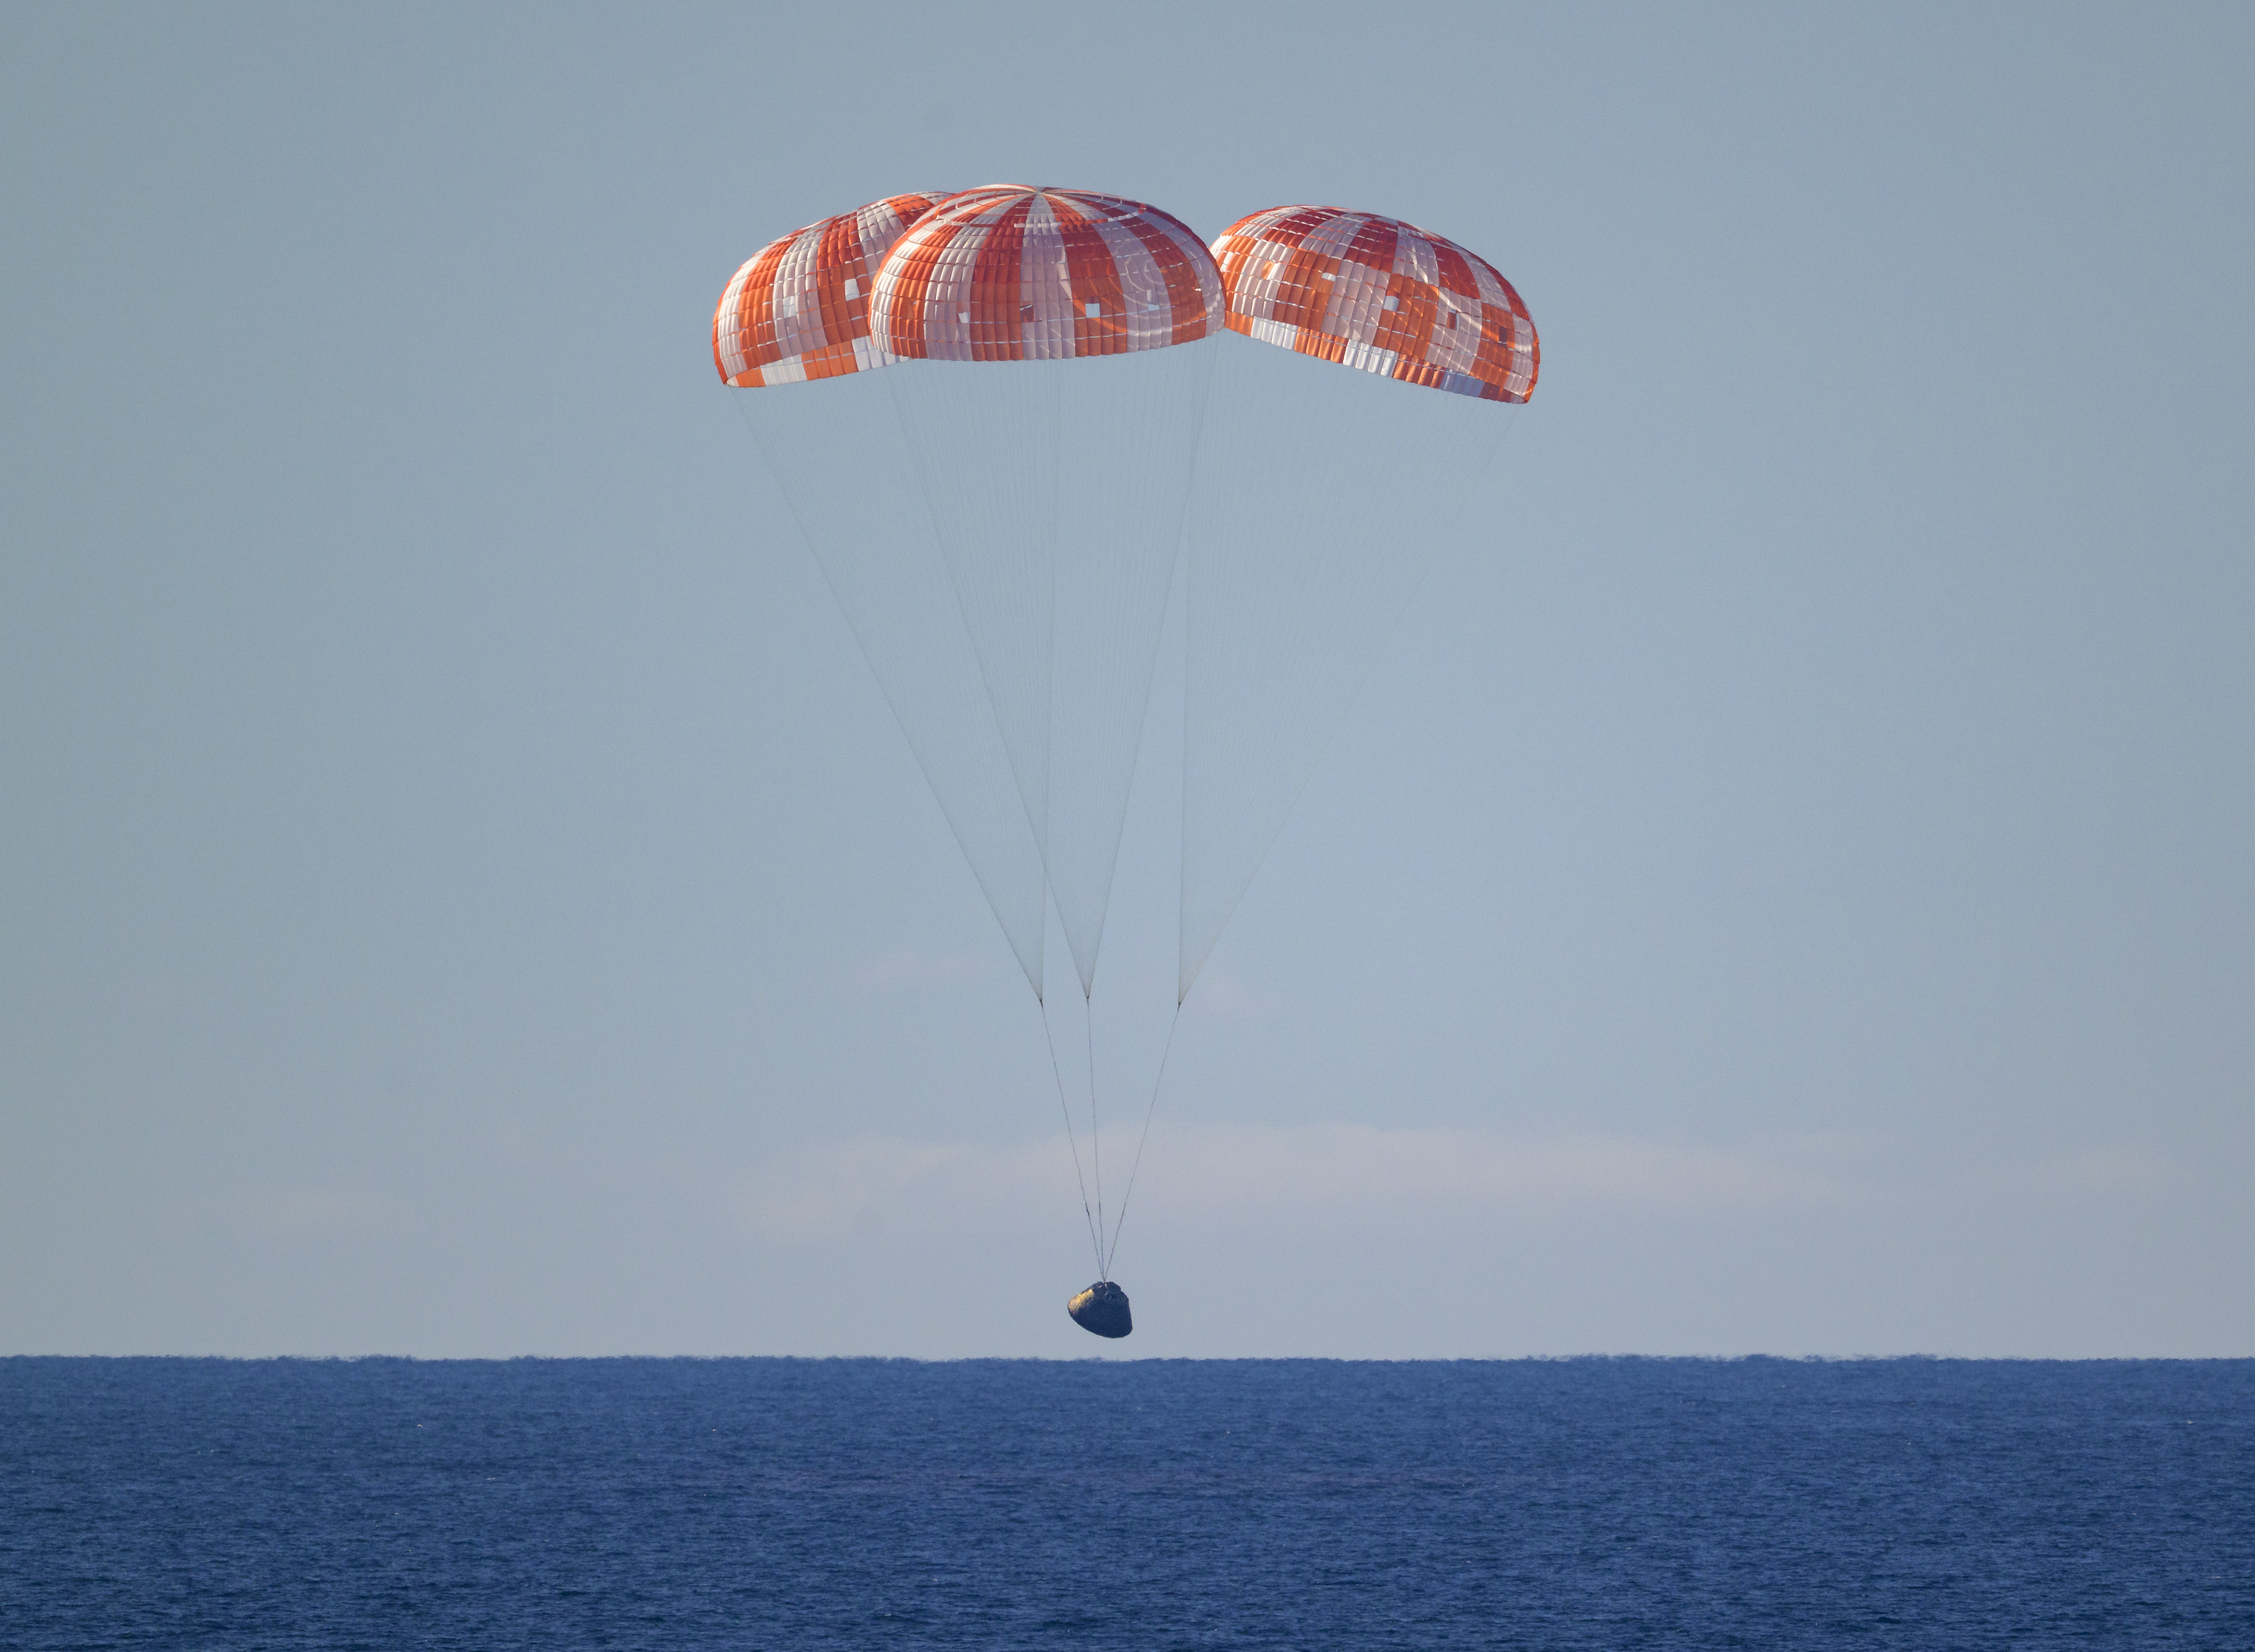
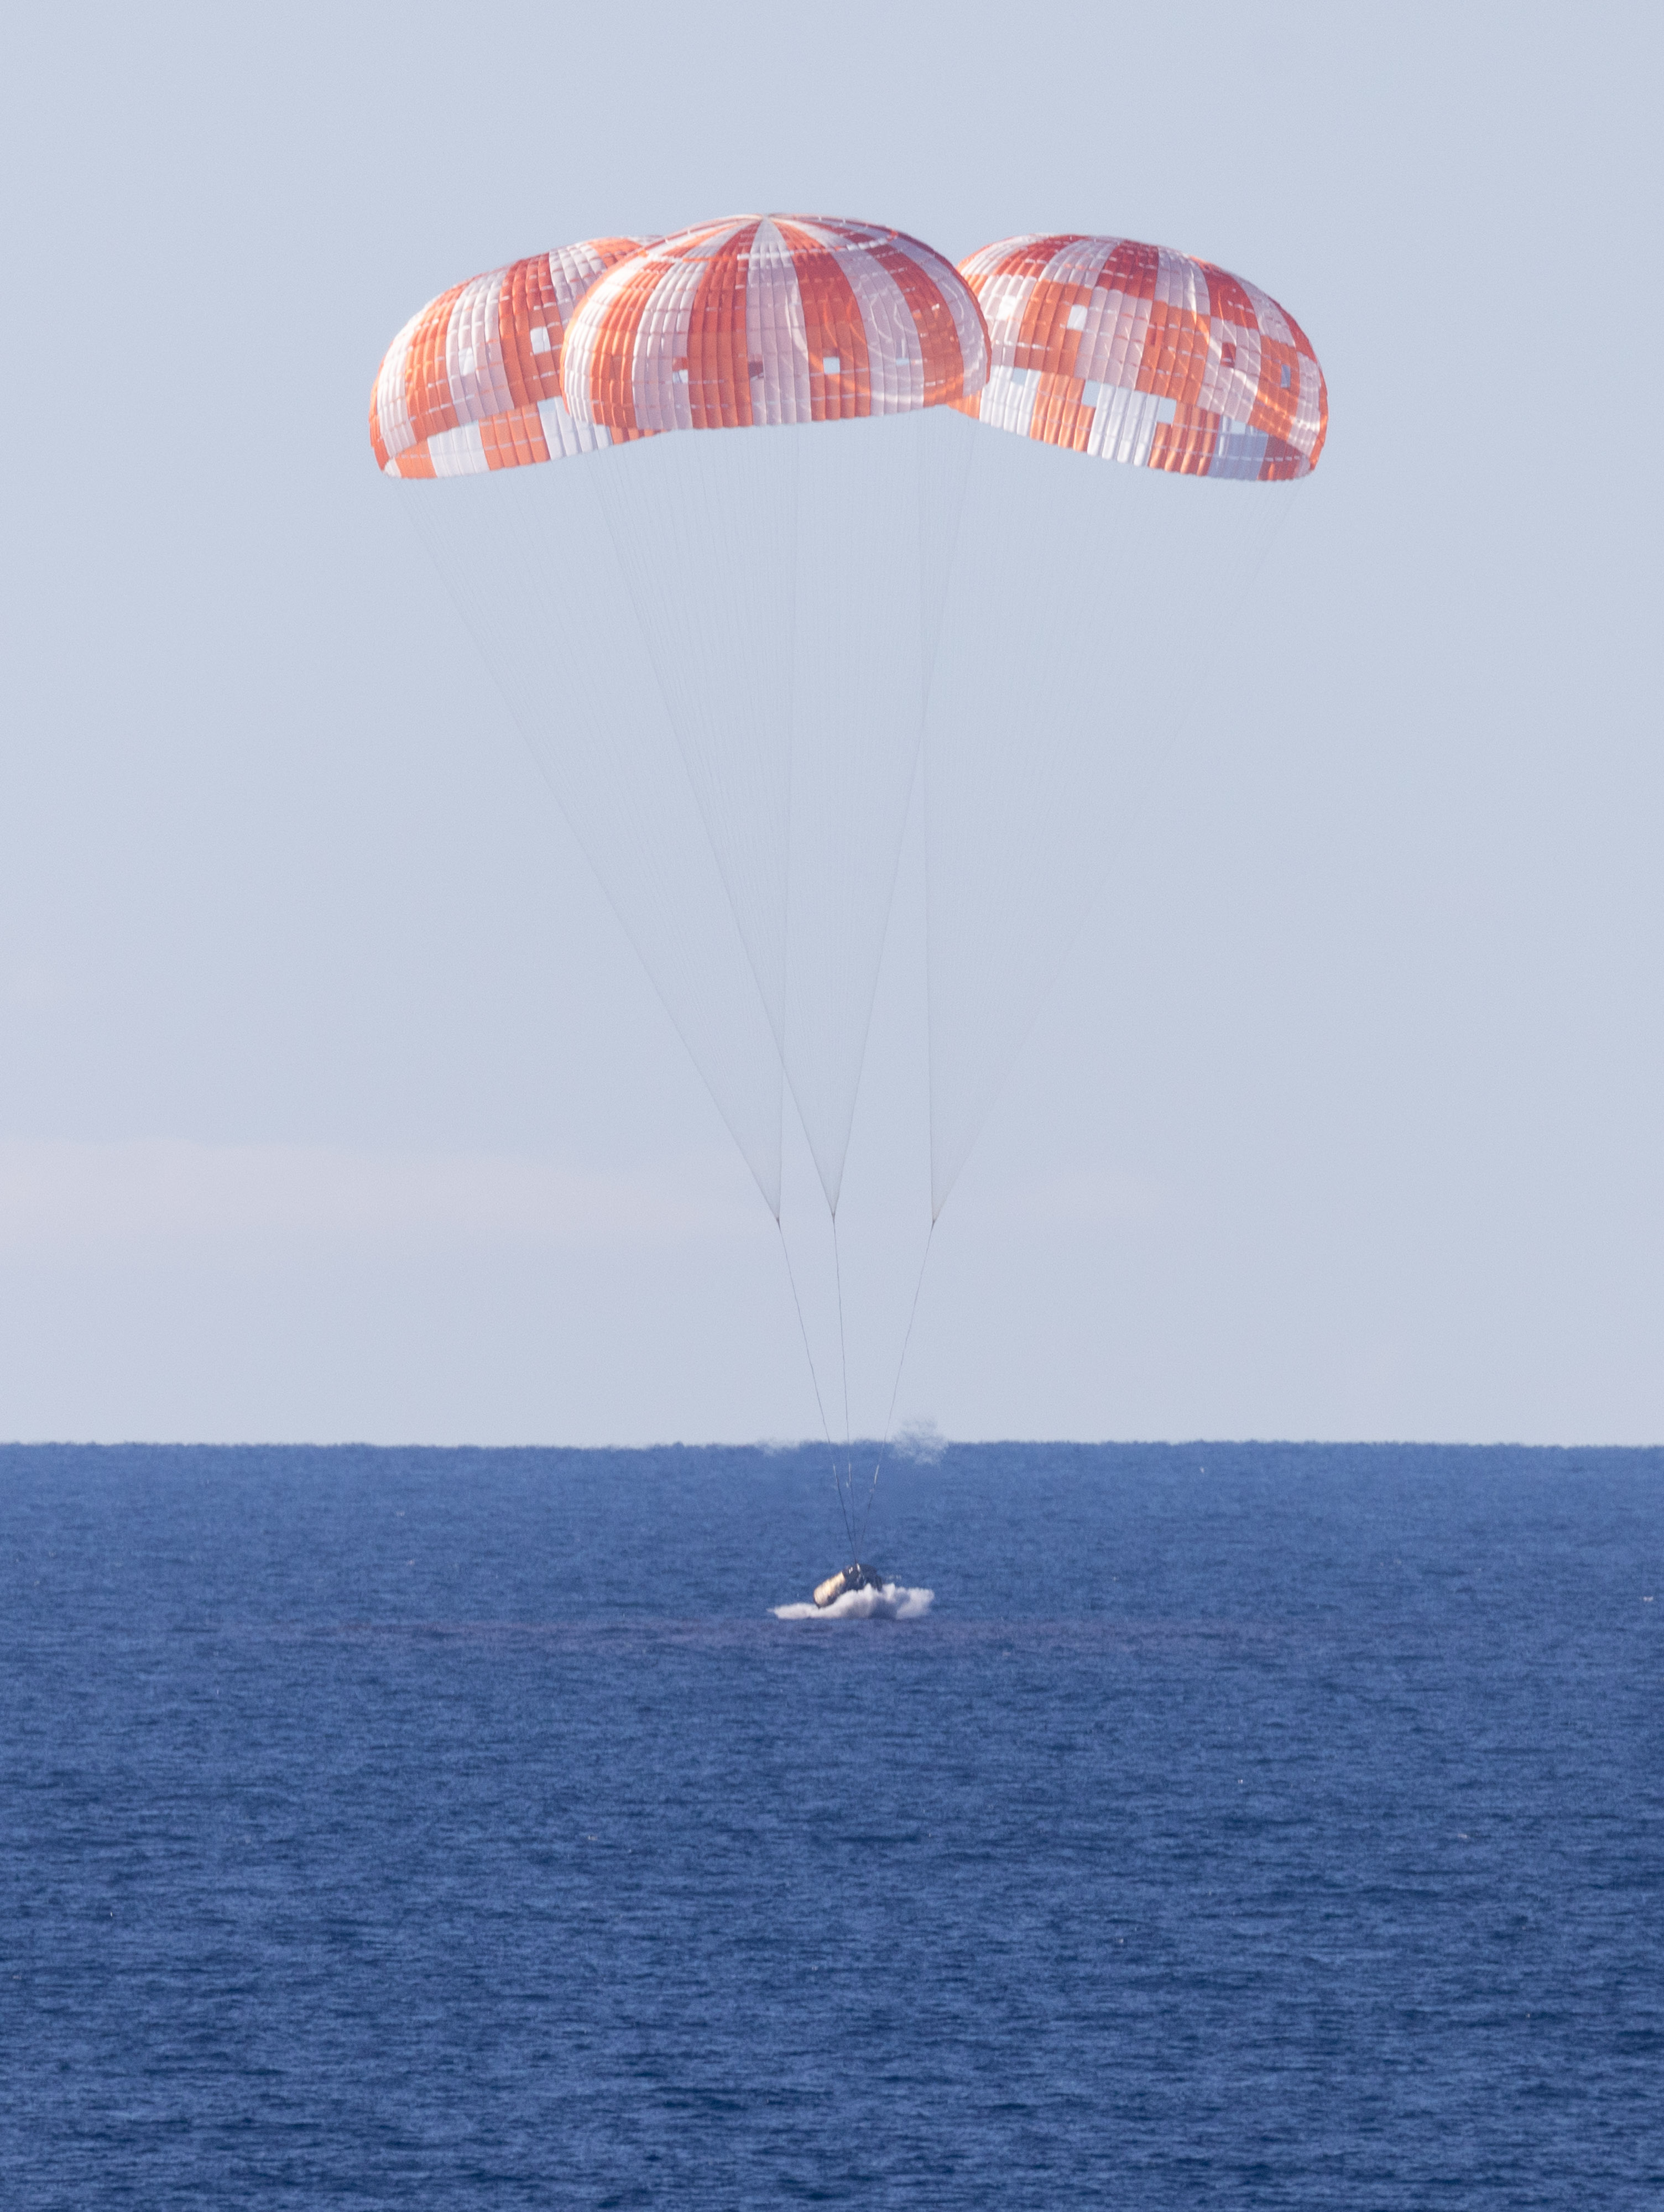
Artemis II Splashes Down
This image from April 10, 2026, captures NASA’s Orion spacecraft, with its parachutes deployed, seconds before splashdown in the Pacific Ocean. The Artemis II crew accomplished many milestones on their nearly 10-day mission, surpassing the Apollo 13 record for farthest crewed spaceflight and capturing views of the far side of the Moon.
Under Artemis, NASA will send astronauts on increasingly difficult missions to explore more of the Moon for scientific discovery, economic benefits, and to build on our foundation for the first crewed missions to Mars.
See more photos from the mission. (Link to https://www.nasa.gov/artemis-ii-multimedia/)
NASA Welcomes Record-Setting Artemis II Moonfarers Back to Earth
The first astronauts to travel to the Moon in more than half a century are back on Earth after a record-setting mission aboard NASA’s Artemis II test flight.
NASA astronauts Reid Wiseman, Victor Glover, and Christina Koch, and CSA (Canadian Space Agency) astronaut Jeremy Hansen splashed down at 5:07 p.m. PDT Friday off the coast of San Diego, completing a nearly 10-day journey that took them 252,756 miles from home at their farthest distance from Earth.
“Reid, Victor, Christina, and Jeremy, welcome home, and congratulations on a truly historic achievement. NASA is grateful to President Donald Trump and partners in Congress for providing the mandate and resources that made this mission and the future of Artemis possible,” said NASA Administrator Jared Isaacman. “Artemis II demonstrated extraordinary skill, courage, and dedication as the crew pushed Orion, SLS (Space Launch System), and human exploration farther than ever before. As the first astronauts to fly this rocket and spacecraft, the crew accepted significant risk in service of the knowledge gained and the future we are determined to build. NASA also acknowledges the contributions of the entire NASA workforce, along with our international partners, whose expertise and commitment were essential to this mission’s success. With Artemis II complete, focus now turns confidently toward assembling Artemis III and preparing to return to the lunar surface, build the base, and never give up the Moon again.”
After splashdown in the Pacific Ocean, the astronauts were met by a combined NASA and U.S. military team that assisted them out of the spacecraft in open water and transported them via helicopter to the USS John P. Murtha for initial medical checkouts. The crew members are expected to return to NASA’s Johnson Space Center in Houston on Saturday, April 11.
During their mission, Wiseman, Glover, Koch, and Hansen flew 694,481 miles in total. Their lunar flyby took them farther than any humans have ever traveled before, surpassing the previous distance record set by Apollo 13 astronauts in 1970.
The first Artemis crew launched on NASA’s SLS rocket at 6:35 p.m. April 1, from Launch Pad 39B at the agency’s Kennedy Space Center in Florida. With 8.8 million pounds of thrust at liftoff, the American-built rocket propelled the crew inside the Orion spacecraft to space, delivering it to orbit with pinpoint accuracy after a smooth countdown conducted by the agency’s Artemis launch control team.
During the first day in space, the astronauts and teams on the ground checked out the spacecraft — named Integrity by the crew — to confirm all systems were healthy ahead of the transit to the Moon. NASA also deployed four CubeSats from international partners to Earth orbit.
On the second day of the test flight, with all systems Go, Orion’s service module fired its main engine, placing the astronauts on a trajectory that brought them 4,067 miles above the lunar surface at their closest approach.
“The Artemis II crew is home. The entry, descent, and landing systems performed as designed and the final test was completed as intended. This moment belongs to the thousands of people across fourteen countries who built, tested, and trusted this vehicle. Their work protected four human lives traveling at 25,000 miles per hour and brought them safely back to Earth,” said NASA Associate Administrator Amit Kshatriya. “Artemis II proved the vehicle, the teams, the architecture, and the international partnership that will return humanity to the lunar surface. Reid, Victor, Christina, and Jeremy carried the hopes of this world farther than humans have traveled in more than half a century. Fifty‑three years ago, humanity left the Moon. This time, we returned to stay. The future is ours to win.”
With astronauts aboard for the first time, engineers put Orion through a full in‑flight evaluation. The crew tested the spacecraft’s life support systems, confirming Orion can sustain humans in deep space. During several piloting demonstrations, crew members took manual control of the spacecraft, flying Orion to validate its handling and collect data that will guide future rendezvous and docking operations with human-rated landers during Artemis III and beyond.
The crew completed a series of tests to inform how NASA will fly future missions to the Moon, including evaluations of how the spacecraft operates during crew exercise, emergency equipment and procedures, the Orion crew survival system spacesuits, and other critical spacecraft systems.
Wiseman, Glover, Koch, and Hansen also supported scientific investigations to help NASA prepare astronauts to live and work on the Moon as the agency builds a Moon Base and looks toward Mars. These experiments — including the AVATAR investigation, which studies how human tissue responds to microgravity and the deep space radiation environment, and other human research performance studies — are gathering essential health data for long-duration missions.
During their April 6 lunar flyby, the astronauts captured more than 7,000 images of the lunar surface and a solar eclipse, during which the Moon blocked the Sun from Orion’s vantage point. The imagery includes striking views of earthset and earthrise, impact craters, ancient lava flows, our Milky Way galaxy, and surface fractures and color variations across the lunar terrain.
They documented the topography along the terminator — the boundary between lunar day and night — where low-angle sunlight casts long shadows across the surface, creating illumination conditions similar to those in the South Pole region where astronauts are scheduled to land in 2028. The crew also proposed potential names for two lunar craters and reported meteoroid impact flashes on the night side of the Moon.
Artemis II science will pave the way for future missions to the Moon’s surface by helping advance mission operations and training astronauts to use well-informed judgment to identify areas of high interest for science and exploration.
With the crew safely on Earth, NASA and its partners now will turn attention to preparing for next year’s Artemis III mission, when a new Orion crew will test integrated operations with commercially built Moon landers in low Earth orbit.
As part of a Golden Age of innovation and exploration, NASA will send Artemis astronauts on increasingly challenging missions to explore more of the Moon for scientific discovery, economic benefits, establish an enduring human presence on the lunar surface, and lay the groundwork for sending the first astronauts – American astronauts – to Mars.
To learn more about the Artemis program, visit:
-end-
Bethany Stevens / Rachel Kraft
Headquarters, Washington
202-358-1600
bethany.c.stevens@nasa.gov / rachel.h.kraft@nasa.gov
New Perspective of Home
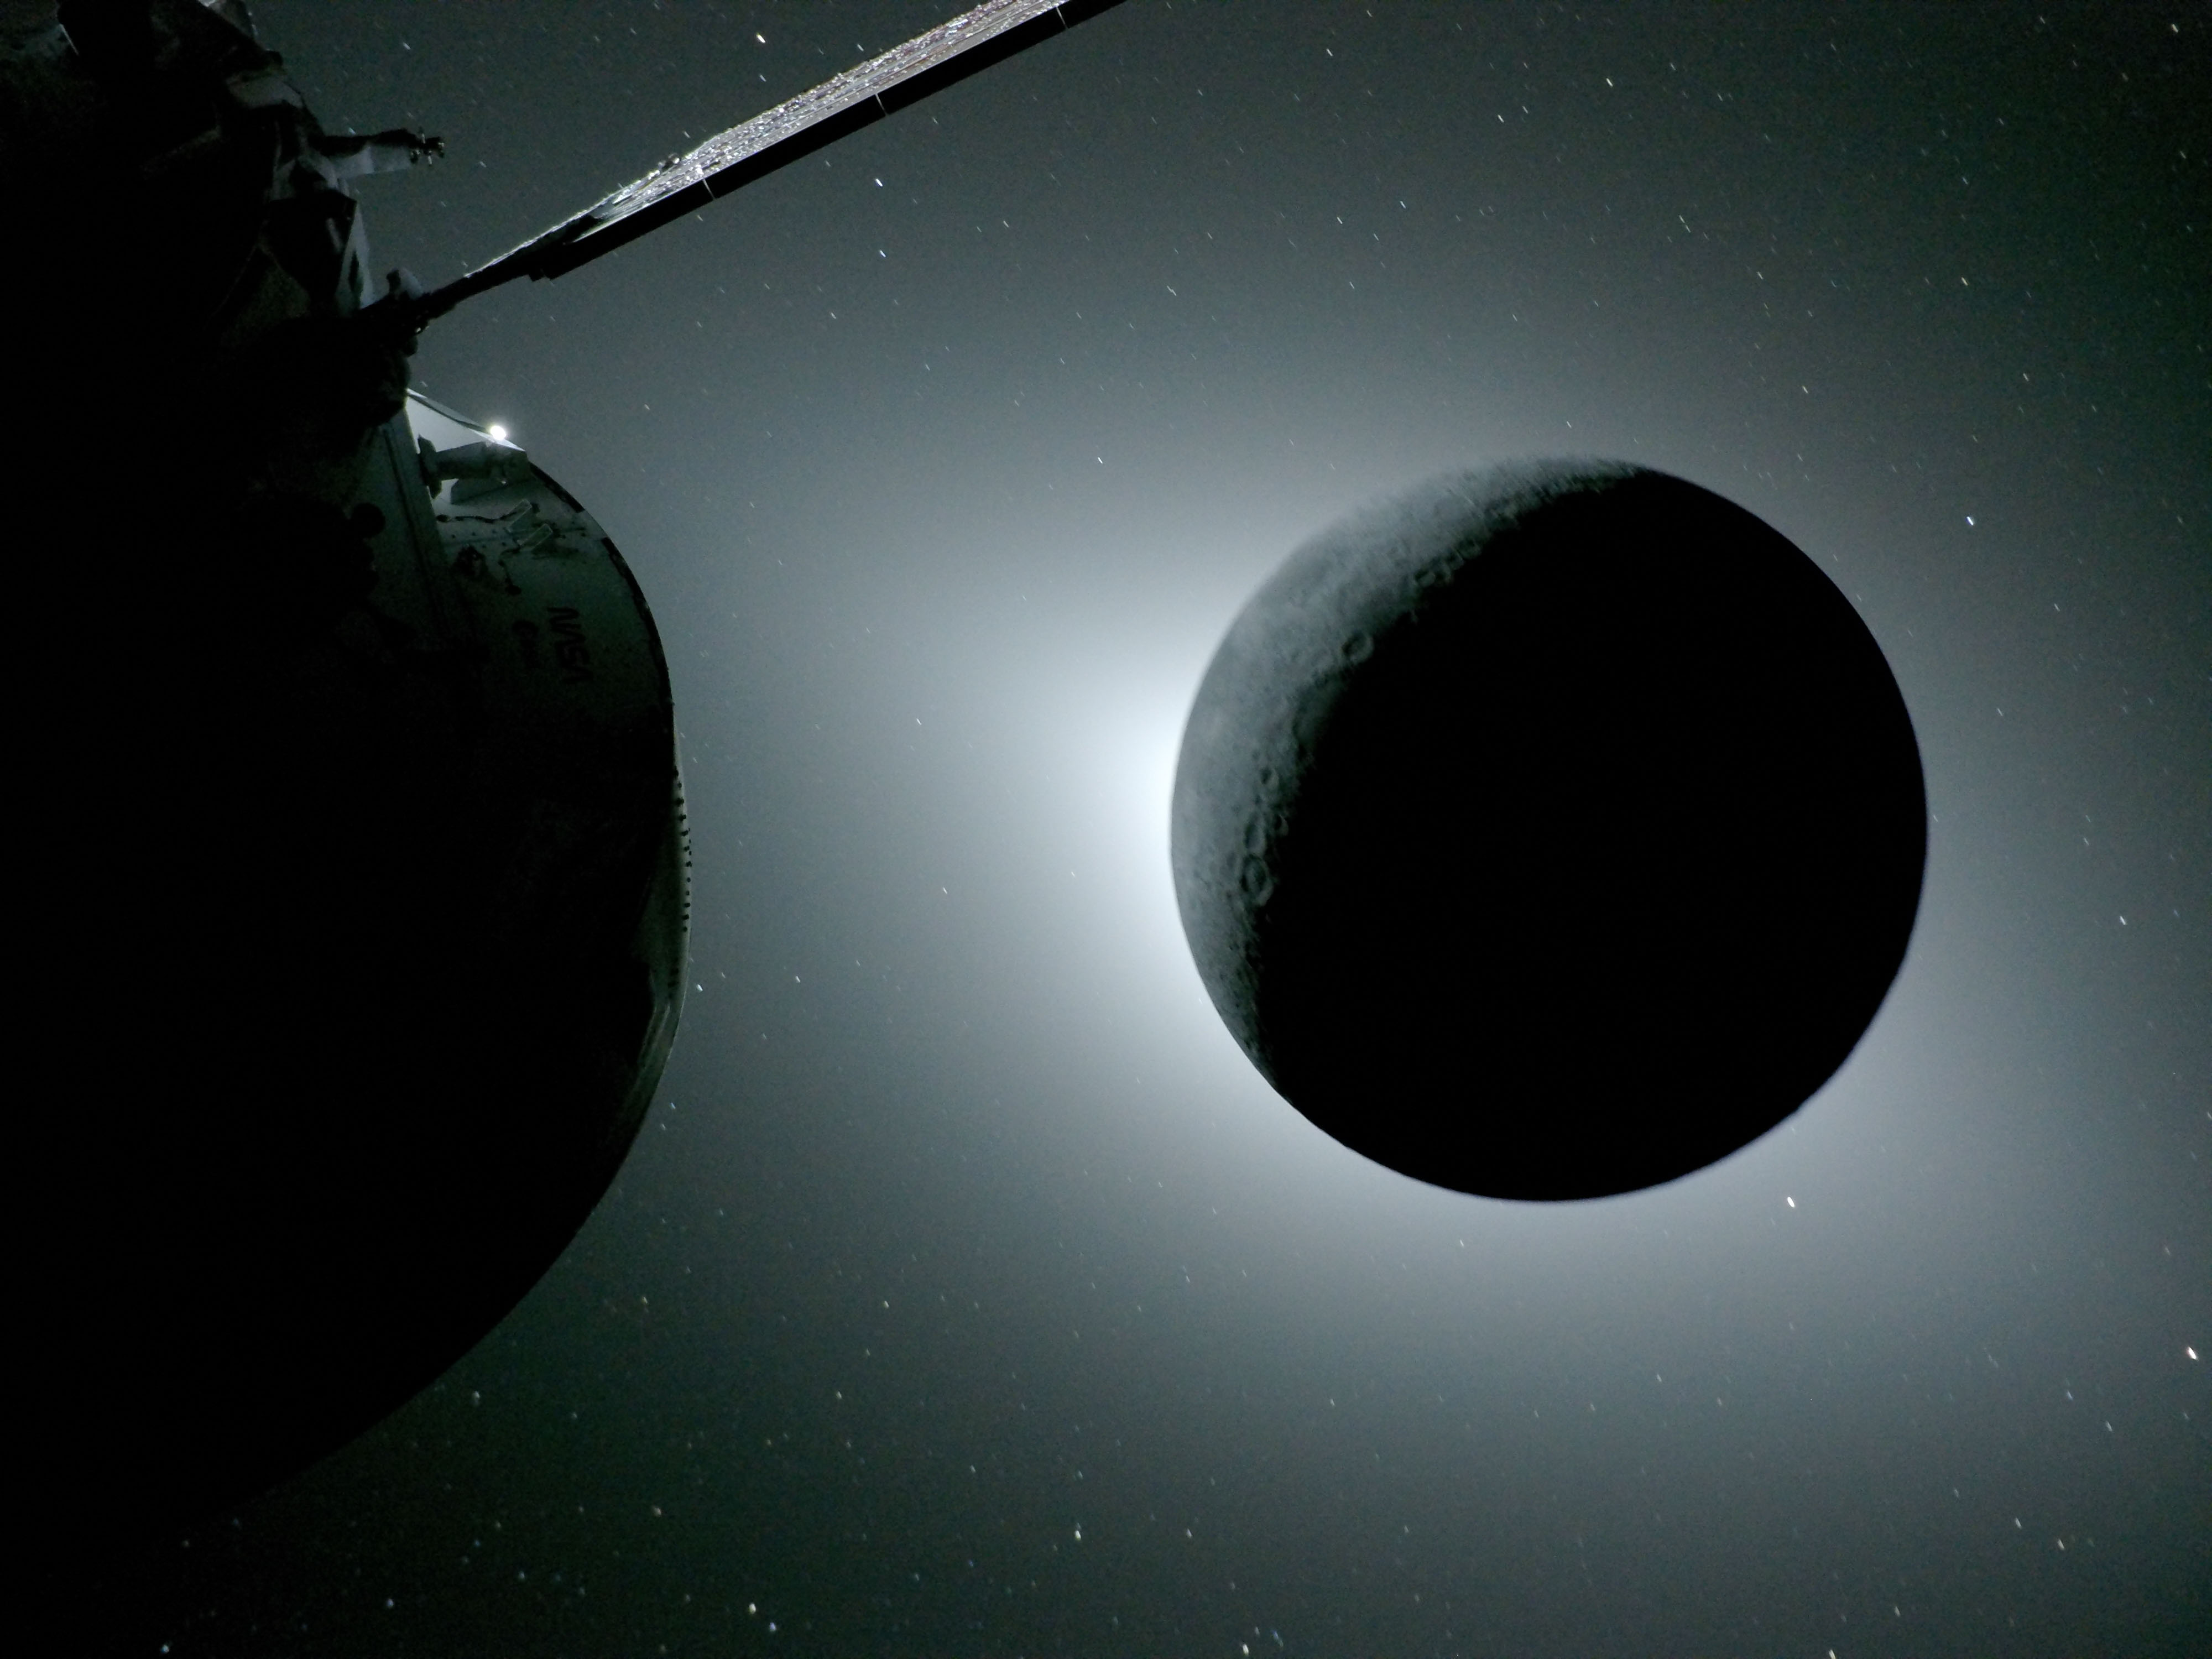
Seen during Artemis II’s lunar flyby on April 6, 2026, the Moon and Earth align in the same frame, each partially illuminated by the Sun. The Moon’s surface appears in sharp detail in the foreground, while Earth sits much farther away, smaller and softly lit in the background. A faint reflection in the spacecraft window is also visible, subtly overlaying the scene. Though their phases differ, both are shaped by the same sunlight, revealing the geometry of the Sun–Earth–Moon system from deep space.
NASA astronauts Reid Wiseman, Christina Koch, and Victor Glover, and CSA (Canadian Space Agency) astronaut Jeremy Hansen are set to return to Earth, splashing down in the Pacific Ocean around 8:07 p.m. EDT. Watch their return with NASA.
Image credit: NASA
Earthset From the Lunar Far Side
- Earth
- Earth Observatory
- Image of the Day
- EO Explorer
- Topics
- More Content
- About
Indoor Testing Facilities available at the NASA Unmanned Autonomy Research Complex (NUARC)
A large WindShaper fan array is available for dynamic low-speed and hovering flight research. The WindShaper is ideal for generating arbitrary wind gradients and wind gusts via a simple Python API. A companion WindProbe is also available for quick surveys of flows. The WindProbe utilizes the lab’s OptiTrack motion capture system to extract the position and orientation of the 5-hole cone probe located on the probe tip.
- Large dynamic fan array: 9’x7’, 1134 fans arranged as 567 ‘wind pixels’
- Wind speeds: 0 to 16 m/s (0 to 36 mph/31 kts)
- Acceleration: 4 m/s2, Deceleration: 2.5 m/s2
- Each fan is programmable via Python scripting
- Replicates steady winds, gusts, and wind gradients
I Am Artemis: Dan Florez
Listen to this audio excerpt from Dan Florez, test director for NASA’s Exploration Ground Systems Program:
0:00 / 0:00
Your browser does not support the audio element.At 1:47 a.m. EST November 16, 2022, as the Artemis I engines ignited, NASA astronaut Reid Wiseman and Dan Florez, NASA test director for the agency’s Exploration Ground Systems, watched from Kennedy’s Launch Control Center roof as the midnight sky turned bright as daylight, the crackle and roar of launch vibrating through them. Little did they know, one of them soon would be the Artemis II commander, and the other would be an important figure in bringing the mission home safely.
Florez is one of the NASA test directors for the Exploration Ground Systems Program. The test directors are a group of 20 engineers at the agency’s Kennedy Space Center in Florida who plan and execute integrated testing for Artemis missions. Their work includes developing timelines and procedures for launch countdown, propellant loading, emergency egress, pad and launch abort scenarios, recovery operations, and more. They help lead the ground systems team in all areas of testing.
Members of the Artemis launch team participate in an Artemis II launch countdown simulation inside Firing Room 1 in the Launch Control Center at NASA’s Kennedy Space Center in Florida on Thursday, May 8, 2025. NASA/Frank MichauxAt the time of Artemis I launch, Florez and his fellow test directors had already developed the launch countdown timelines for Artemis II.
“We were really focused on loading that spacecraft with cryogenic propellants and successfully launching it. With Artemis II, we’re going to have to do all that again, but in the middle of that, we’re going to have to embed the crew timeline to get the crew safely inside the spacecraft, get all the systems checked out, and launch them into space,” Florez said. “And we have to do the same thing on the tail end through recovery. So, there’s a lot of complexities when you have the human element thrown into the operation.”
Since Artemis I, Florez has focused his work even more heavily on the human element, taking on rescue and recovery operations.
A wave breaks inside the well deck of USS Somerset as teams work to recover the Crew Module Test Article (CMTA), a full scale replica of the Orion spacecraft, as they practice Artemis recovery operations during Underway Recovery Test-12 off the coast of California, Thursday, March 27, 2025. NASA/Joel Kowsky“We have to have a plan to go get to the crew if we have an abort, if we land anywhere in the world within 24 hours,” said Florez. “My role right now is to do a lot of that coordination to make sure we have all the assets and all the resources in place to get to the crew.”
When the Artemis II crew returns to Earth aboard the Orion spacecraft, Florez will be there, prepared and ready with NASA’s Landing and Recovery Team and the U.S. military.
We have a great partnership with the military. We have the Human Spaceflight Support Office within the Air Force that support us directly for not just for recovery operations, but also for any of the rescue operations.Dan Florez
NASA Test Director, Exploration Ground Systems Program
Recovery operations are routinely verified and validated in what is called an underway recovery test. NASA and Navy teams board a U.S. Navy ship and travel off the coast of San Diego to test retrieving the capsule and getting the crew safely on the ship. In late February 2024, the Artemis II crew joined the recovery team’s eleventh iteration of testing called, URT-11.
“It was really great to have that perspective of having astronauts in the loop during our test operations,” said Florez. “Everywhere along the way, we got feedback from them.”
Artemis II launched at 6:35 p.m. EDT April 1, from Launch Complex 39B, sending NASA astronauts Reid Wiseman, Victor Glover, and Christina Koch, and CSA (Canadian Space Agency) astronaut Jeremy Hansen, on their approximately 10-day mission around the Moon.
Florez and his colleagues are prepared and ready to apply everything they tested to recover the crew.
Watching them launch is going to be great. I'm going to be happier when they land.Dan Florez
NASA Test Director, Exploration Ground Systems Program
About the AuthorAdeline Morgan RoeschStrategic Communications Specialist Share Details Last Updated Apr 10, 2026 Related Terms Explore More 1 min read Watching the Artemis II Mission Unfold at JPL’s Space Flight Operations FacilityDescription Staff at NASA’s Jet Propulsion Laboratory in Southern California watch the agency’s Artemis II…
Article 4 days ago 2 min read The Deep Space Network Acquires Artemis II SignalDescription A graphical representation of the Deep Space Network’s radio frequency antennas indicate signal acquisition…
Article 4 days ago 2 min read The Deep Space Network Acquires Artemis II SignalDescription The acquisition of the radio frequency signal from the Artemis II crewed mission to…
Article 4 days ago Keep Exploring Discover More Topics From NASAMissions
Humans in Space
Climate Change
Solar System
Indoor Testing Facilities available at the NASA Unmanned Autonomy Research Complex (NUARC)
A large WindShaper fan array is available for dynamic low-speed and hovering flight research. The WindShaper is ideal for generating arbitrary wind gradients and wind gusts via a simple Python API. A companion WindProbe is also available for quick surveys of flows. The WindProbe utilizes the lab’s OptiTrack motion capture system to extract the position and orientation of the 5-hole cone probe located on the probe tip.
Windshaper fan array for dynamic low-speed and hovering flight research at NASA Ames Research Center.NASA/John Melton•Large dynamic fan array: 9’x7’, 1134 fans arranged as 567 ‘wind pixels’
•Wind speeds: 0 to 16 m/s (0 to 36 mph/31 kts)
•Acceleration: 4 m/s2, Deceleration: 2.5 m/s2
•Each fan is programmable via Python scripting
•Replicates steady winds, gusts, and wind gradients
WindProbe for handheld mobile wind data collection. WindShaperStarstruck
The Artemis II crew captured this photo of our galaxy, the Milky Way, on April 7, 2026. The Milky Way’s elegant spiral structure is dominated by just two arms wrapping off the ends of a central bar of stars. Spanning more than 100,000 light-years, Earth is located along one of the galaxy’s spiral arms, about halfway from the center.
See more photos from the mission.
Image credit: NASA
Watching the Artemis II Mission Unfold at JPL’s Space Flight Operations Facility
NASA/JPL-Caltech Photojournal Navigation Downloads Watching the Artemis II Mission Unfold at JPL’s Space Flight Operations Facility
JPEG (66.13 MB)
Description
Staff at NASA’s Jet Propulsion Laboratory in Southern California watch the agency’s Artemis II mission unfold soon after launch on April 1, 2026, at the Space Flight Operations Facility, which operates the Deep Space Network (DSN).
The DSN comprises of three complexes in Goldstone, California; Madrid, Spain; and Canberra, Australia. Each complex has several radio frequency antennas that communicate with dozens of spacecraft exploring the solar system in addition to the crewed Artemis II mission.
The DSN is managed by JPL for the agency’s Space Communications and Navigation program, which is located at NASA Headquarters within the Space Operations Mission Directorate. The DSN allows missions to track, send commands to, and receive scientific data from faraway spacecraft. JPL is managed by Caltech in Pasadena, California, for NASA.
For more information about Artemis II, visit: https://www.nasa.gov/mission/artemis-ii/
Keep Exploring Discover More Topics From Photojournal
Photojournal
Search Photojournal
Photojournal’s Latest Content
Feedback
The Deep Space Network Acquires Artemis II Signal
NASA/JPL-Caltech Photojournal Navigation Downloads The Deep Space Network Acquires Artemis II Signal
JPEG (62.03 MB)
Description
A graphical representation of the Deep Space Network’s radio frequency antennas indicate signal acquisition from NASA’s Artemis II mission to the Moon on April 1, 2026, inside the Space Flight Operations Facility at NASA’s Jet Propulsion Laboratory in Southern California. Two antennas at the Madrid Deep Space Communications Complex, Deep Space Station 54 and 56, can be seen communicating with Artemis II (the signals are labelled “EM2”, short for “Exploration Mission 2”; elsewhere they are labelled “ART2” for “Artemis II”).
A similar visualization can be found at DSN Now, which details all the missions that the network is communicating with 24 hours a day, seven days a week.
The Space Flight Operations Facility operates the DSN, which comprises of three complexes in Goldstone, California; Madrid, Spain; and Canberra, Australia. Each complex consists of several radio frequency antennas that communicate with dozens of spacecraft exploring the solar system in addition to the Artemis II mission.
The DSN is managed by JPL for the agency’s Space Communications and Navigation program, which is located at NASA Headquarters within the Space Operations Mission Directorate. The DSN allows missions to track, send commands to, and receive scientific data from faraway spacecraft. JPL is managed by Caltech in Pasadena, California, for NASA.
For more information about Artemis II, visit: https://www.nasa.gov/mission/artemis-ii/
Keep Exploring Discover More Topics From Photojournal
Photojournal
Search Photojournal
Photojournal’s Latest Content
Feedback
The Deep Space Network Acquires Artemis II Signal
NASA/JPL-Caltech Photojournal Navigation Downloads The Deep Space Network Acquires Artemis II Signal
JPEG (66.25 MB)
Description
The acquisition of the radio frequency signal from the Artemis II crewed mission to the Moon by NASA’s Deep Space Network (DSN) is indicated by the peak in the data signal shown on the top computer screen.
Soon after the mission’s launch on April 1, 2026, at 6:35 p.m. EDT, NASA’s Near Space Network led communications with the Orion capsule. Then, communications were handed off to the DSN, marking the first time in over 50 years that the network would be communicating with a crewed spacecraft traveling through deep space.
The Space Flight Operations Facility at NASA’s Jet Propulsion Laboratory in Southern California (where this photo was taken) operates the DSN, which comprises three complexes in Goldstone, California; Madrid, Spain; and Canberra, Australia. Each complex consists of several radio frequency antennas that communicate with dozens of robotic spacecraft exploring the solar system in addition to the Artemis II mission.
The DSN is managed by JPL for the agency’s Space Communications and Navigation program, which is located at NASA Headquarters within the Space Operations Mission Directorate. The DSN allows missions to track, send commands to, and receive scientific data from faraway spacecraft. JPL is managed by Caltech in Pasadena, California, for NASA.
For more information about Artemis II, visit: https://www.nasa.gov/mission/artemis-ii/
Keep Exploring Discover More Topics From Photojournal
Photojournal
Search Photojournal
Photojournal’s Latest Content
Feedback
Watching Over the Deep Space Network Before Artemis II Signal Acquisition
NASA/JPL-Caltech Photojournal Navigation Downloads Watching Over the Deep Space Network Before Artemis II Signal Acquisition
JPEG (63.52 MB)
Description
Blanca Renteria, Artemis Deep Space Network (DSN) operations chief, monitors data at the Space Flight Operations Facility at NASA’s Jet Propulsion Laboratory in Southern California shortly after Artemis II launched from the agency’s Kennedy Space Flight Center in Florida on April 1, 2026, at 6:35 p.m. EDT.
The Space Flight Operations Facility operates the DSN, which comprises three complexes in Goldstone, California; Madrid, Spain; and Canberra, Australia. Each complex consists of several radio frequency antennas that communicate with dozens of robotic spacecraft exploring the solar system in addition to the crewed Artemis II mission.
The DSN is managed by JPL for the agency’s Space Communications and Navigation program, which is located at NASA Headquarters within the Space Operations Mission Directorate. The DSN allows missions to track, send commands to, and receive scientific data from faraway spacecraft. JPL is managed by Caltech in Pasadena, California, for NASA.
For more information about Artemis II, visit: https://www.nasa.gov/mission/artemis-ii/
Keep Exploring Discover More Topics From Photojournal
Photojournal
Search Photojournal
Photojournal’s Latest Content
Feedback
Watching the Artemis II Launch From JPL’s Space Flight Operations Facility
NASA/JPL-Caltech Photojournal Navigation Downloads Watching the Artemis II Launch From JPL’s Space Flight Operations Facility
JPEG (96.19 MB)
Description
Staff at NASA’s Jet Propulsion Laboratory in Southern California watch the launch of the agency’s Artemis II mission to the Moon on April 1, 2026, at the Space Flight Operations Facility, which operates the Deep Space Network (DSN). Soon after launch, the Artemis II crew communicated with the Near Space Network while they were close to Earth. Later, communications were handed off to the DSN as the Orion capsule continued its journey into deep space.
The DSN comprises three complexes in Goldstone, California; Madrid, Spain; and Canberra, Australia. Each complex has several radio frequency antennas that communicate with dozens of spacecraft exploring the solar system in addition to the Artemis II mission.
The DSN is managed by JPL for the agency’s Space Communications and Navigation program, which is located at NASA Headquarters within the Space Operations Mission Directorate. The DSN allows missions to track, send commands to, and receive scientific data from faraway spacecraft. JPL is managed by Caltech in Pasadena, California, for NASA.
For more information about Artemis II, visit: https://www.nasa.gov/mission/artemis-ii/
Keep Exploring Discover More Topics From Photojournal
Photojournal
Search Photojournal
Photojournal’s Latest Content
Feedback
JPL’s ‘Lucky Peanuts’ Before Artemis II Launch
NASA/JPL-Caltech Photojournal Navigation Downloads JPL’s ‘Lucky Peanuts’ Before Artemis II Launch
JPEG (67.09 MB)
Description
A container of “lucky peanuts” sits above workstations within the Space Flight Operations Facility at NASA’s Jet Propulsion Laboratory shortly before the launch of the Artemis II mission to the Moon on April 1, 2026. Eating peanuts before launches and other major mission events is a longstanding tradition at JPL.
The Space Flight Operations Facility operates the DSN, which comprises three complexes in Goldstone, California; Madrid, Spain; and Canberra, Australia. Each complex consists of several radio frequency antennas that communicate with dozens of spacecraft exploring the solar system in addition to the crewed Artemis II mission.
The DSN is managed by JPL for the agency’s Space Communications and Navigation program, which is located at NASA Headquarters within the Space Operations Mission Directorate. The DSN allows missions to track, send commands to, and receive scientific data from faraway spacecraft. JPL is managed by Caltech in Pasadena, California, for NASA.
For more information about Artemis II, visit: https://www.nasa.gov/mission/artemis-ii/
Keep Exploring Discover More Topics From Photojournal
Photojournal
Search Photojournal
Photojournal’s Latest Content
Feedback
Snow in the Shadow of the Andes
- Earth
- Earth Observatory
- Image of the Day
- EO Explorer
- Topics
- More Content
- About
Twin NASA Control Rooms Support Artemis Safety, Success
Twin control rooms at NASA’s Marshall Space Flight Center in Huntsville, Alabama, are actively supporting real-time mission operations in lunar orbit as part of the agency’s Artemis II mission, helping ensure astronaut safety and mission success as the crew prepares to return to Earth Friday, April 10.
The LUCA (Lunar Utilization Control Area) and LESA (Lander Engineering Support Area) rooms are part of the Huntsville Operations Support Center at NASA Marshall. While the spaces look nearly identical, the two are more like fraternal twins in their focus areas: LUCA primarily supports Artemis science operations, while LESA will provide engineering support for landing astronauts on the Moon.
LUCA (Lunar Utilization Control Area) at NASA Marshall is specially designed to support a wide variety of science operations on and around the Moon – and beyond. Engineers in the LUCA monitored operations for the Lunar Node-1 experiment, an autonomous navigation payload that was part of the first NASA Commercial Lunar Payload Services (CLPS) launch on Intuitive Machines’ Nova-C lunar lander in 2024. NASA Marshall flight controllers will use the LUCA again for Artemis II to monitor science operations.NASA/Charles Beason“The Huntsville Operations Support Center at NASA Marshall can be adapted to the needs of the agency’s missions, and LUCA and LESA are some of our newest configurable control rooms for the Artemis campaign,” said Harish Chandranath, Payload and Mission Operations Division Human Landing Systems project lead at Marshall. “In addition to supporting Artemis, our Huntsville Operations Support Center teams also support the Commercial Crew Program, the SLS (Space Launch System) rocket, and International Space Station science operations.”
Support center services include work to manage spacecraft command and telemetry, local and remote voice services for international connections, live and recorded video services, and a telescience resource kit – special software that makes sure two computers far apart can communicate without missing any information and without human help. All Huntsville Operations Support Center services can be tied into both the LUCA and LESA rooms, giving operators the capability to use data and communicate with scientists and experts around the world.
Support engineers will use the LESA (Lander Engineering Support Area) at NASA Marshall to monitor human landing system (HLS) for the first crewed Artemis missions.NASA/Charles BeasonDuring Artemis II, teams in LUCA are supporting first-of-their-kind science operations designed to better understand the effects of deep space – such as microgravity and radiation – on crew physiology, immune response, and performance. The data gathered during the mission will inform future crewed flights to the Moon.
Meanwhile, teams in LESA are observing Artemis II mission operations in real time, which is a critical opportunity to refine processes and prepare for future crewed landings on the Moon’s surface. For Artemis missions, members of NASA’s Human Landing System Mission Insight Support Team – including engineers, safety leads, flight operations experts, and technical authorities – will operate from LESA to monitor lander systems and support key decision-making.
Through the Artemis program, NASA is returning humans to the Moon for scientific discovery, economic opportunity, and to build the foundation for the first crewed missions to Mars – for the benefit of all.
To learn more about the Artemis program, visit:
Share Details Last Updated Apr 08, 2026 EditorLee MohonContactCorinne M. Beckingercorinne.m.beckinger@nasa.gov Related Terms Keep Exploring Discover More Topics From NASAArtemis II
Human Landing System
Marshall Space Flight Center
Artemis
Solar Eclipse of the Heart
The Moon, seen here backlit by the Sun during a solar eclipse on April 6, 2026, is photographed by one of the cameras on the Orion spacecraft’s solar array wings. During lunar flyby, the Artemis II astronauts observed a solar eclipse that only they could see due to their unique position.
See more photos from the Artemis II mission.
Image credit: NASA
A Volcanic Medley Near Mammoth Lakes
- Earth
- Earth Observatory
- Image of the Day
- EO Explorer
- Topics
- More Content
- About
Celestial Wonders in Leo
NASA, ESA and the Hubble Heritage (STScI/AURA)-ESA/Hubble Collaboration; Acknowledgment: Davide De Martin and Robert Gendler
Leo is a prominent sight for stargazers in April. Its famous sickle, punctuated by the bright star Regulus, draws many a beginning stargazer’s eyes, inviting deeper looks into some of Leo’s celestial delights, including a great double star and a famous galactic trio.
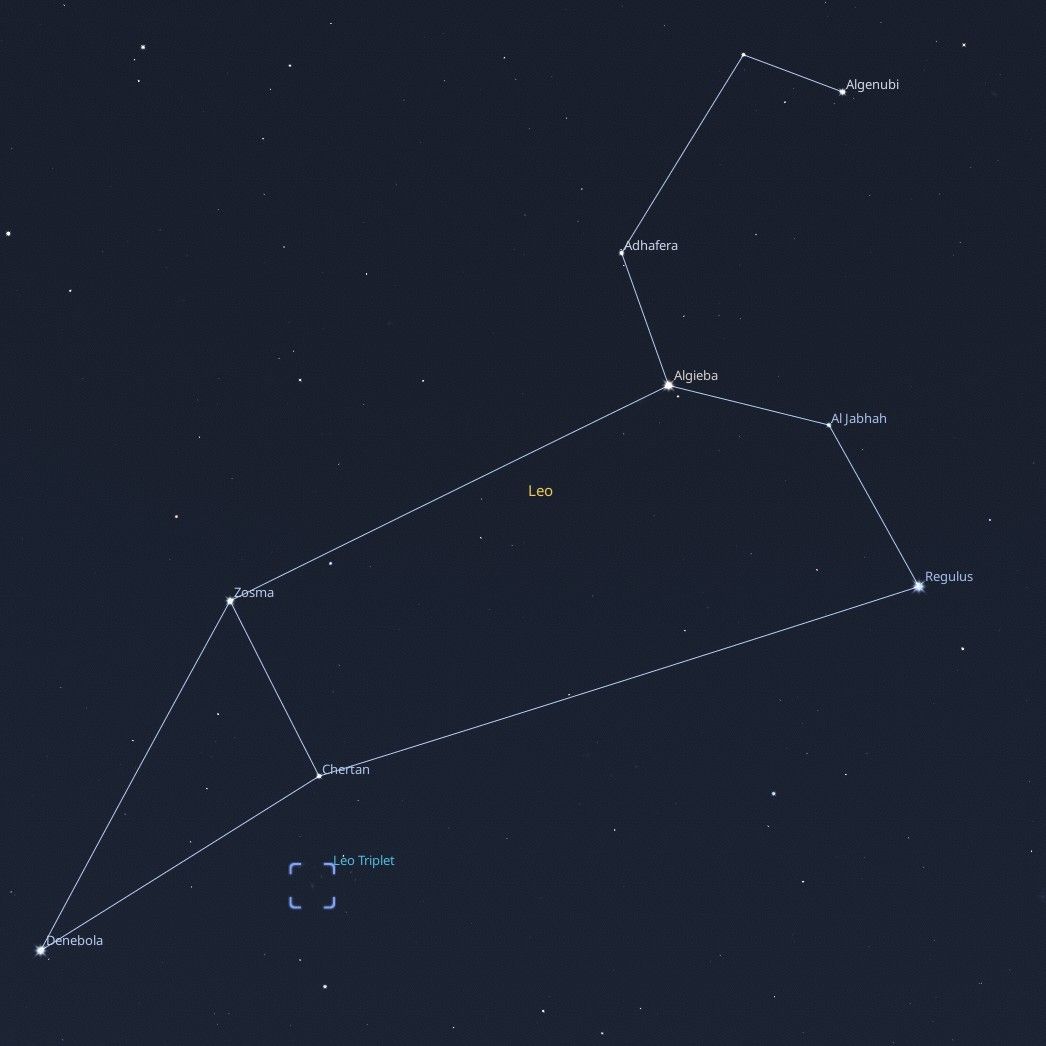
The constellation, Leo. You can find this constellation in the springtime skies. StellariumLeo’s distinctive forward sickle, or “reverse question mark,” is easy to spot as it climbs the skies in the southeast after sunset. If you are having a difficult time spotting the sickle, look for bright Sirius and Procyon in Canis Major and Canis Minor. Complete a triangle by drawing two lines to the east, joining at the bright star Regulus, the “period” in the reverse question mark. Trailing them is a trio of bright stars forming an isosceles triangle, the brightest star in that formation named Denebola. Connecting these two patterns together forms the constellation of Leo the Lion, with the forward-facing sickle being the lion’s head and mane, and the rear triangle its hindquarters. Can you see this mighty feline? It might help to imagine Leo proudly sitting up and staring straight ahead, like a celestial Sphinx. To help find these objects, you can use online tools like Stellarium Web.
If you peer deeper into Leo with a small telescope or binoculars, you’ll find a notable double star! Look in the sickle of Leo for its second-brightest star, Algieba, also called Gamma Leonis. This star splits into two bright yellow stars even with a small magnification. You can make this “split” with binoculars, but it’s more apparent with a telescope. Compare the color and intensity of these two stars: do you notice any differences? There are other multiple-star systems in Leo; spend a few minutes scanning with your instrument of choice, and see what you discover.
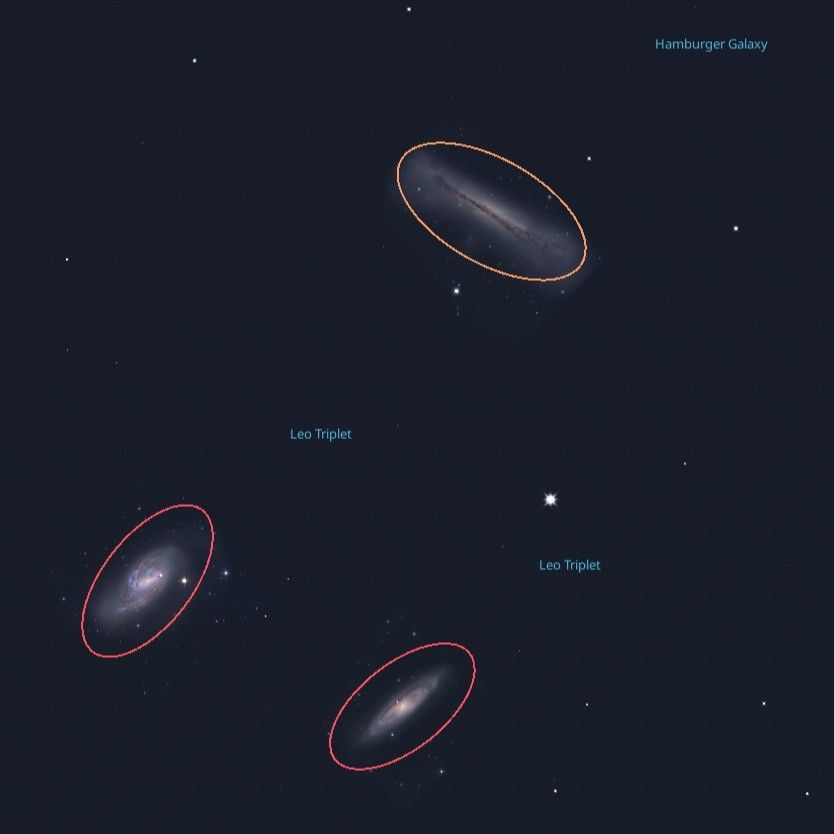
The Leo Triplet – three galaxies that appear to be close together under the star Chertan in the Leo constellation. StellariumOne of the most famous sights in Leo is the “Leo Triplet”: three galaxies that appear to be close together. They are indeed gravitationally bound to one another, around 30 million light-years away! You’ll need a telescope to spot them, and use an eyepiece with a wide field of view to see all three galaxies at once! Look below the star Chertan to find galaxies M65, M66, and NGC 3628 – The Hamburger Galaxy. Compare and contrast the appearance of each galaxy – while they are all spiral galaxies, each one is tilted at different angles to our point of view! Do they all look like spiral galaxies to you?
April is Citizen Science Month, and there are some fun Leo-related activities you can participate in! If you enjoy
comparing the Triplets, the Galaxy Zoo project could use your eyes to help classify different galaxies from sky survey data! Looking at Leo itself can even help measure light pollution: the Globe at Night project uses Leo as their target constellation for sky quality observations from the Northern Hemisphere. Find and participate in many more NASA community science programs at NASA Citizen Science. Happy observing!
Originally posted by Dave Prosper: April 2021
Last Updated by Kat Troche: April 2026