
NASA
Ganges Delta Under a Winter Shroud of Fog
- Earth
- Earth Observatory
- Image of the Day
- EO Explorer
- Topics
- More Content
- About
NASA to Provide Media with International Space Station Update Today
NASA will host a live news conference at 5 p.m. EST on Thursday from the agency’s headquarters in Washington to discuss the International Space Station and its crew.
On Jan. 7, the agency announced it was postponing a planned spacewalk originally scheduled for Jan. 8 while teams monitored a medical concern with a crew member currently living and working aboard the orbital laboratory.
The matter involved a single crew member, who is stable. Due to medical privacy, it is not appropriate for NASA to share more details about the crew member.
Participants in the news conference include:
- NASA Administrator Jared Isaacman
- Amit Kshatriya, associate administrator
- Dr. James Polk, chief health and medical officer, NASA Headquarters
NASA will provide live coverage of the news conference on NASA+, Amazon Prime, and the agency’s YouTube channel. Learn how to stream NASA content through a variety of online platforms, including social media.
To participate in the news conference virtually or in-person, media must RSVP for details no later than one hour before the start of the event to the NASA Newsroom at: hq-media@mail.nasa.gov. NASA’s media credentialing policy is online.
To learn more about the International Space Station, visit:
-end-
Bethany Stevens / Cheryl Warner
Headquarters, Washington
202-358-1600
bethany.c.stevens@nasa.gov / cheryl.m.warner@nasa.gov
Best of 2025: Artemis II Countdown Demonstration Test
Best of 2025: Artemis II Countdown Demonstration Test
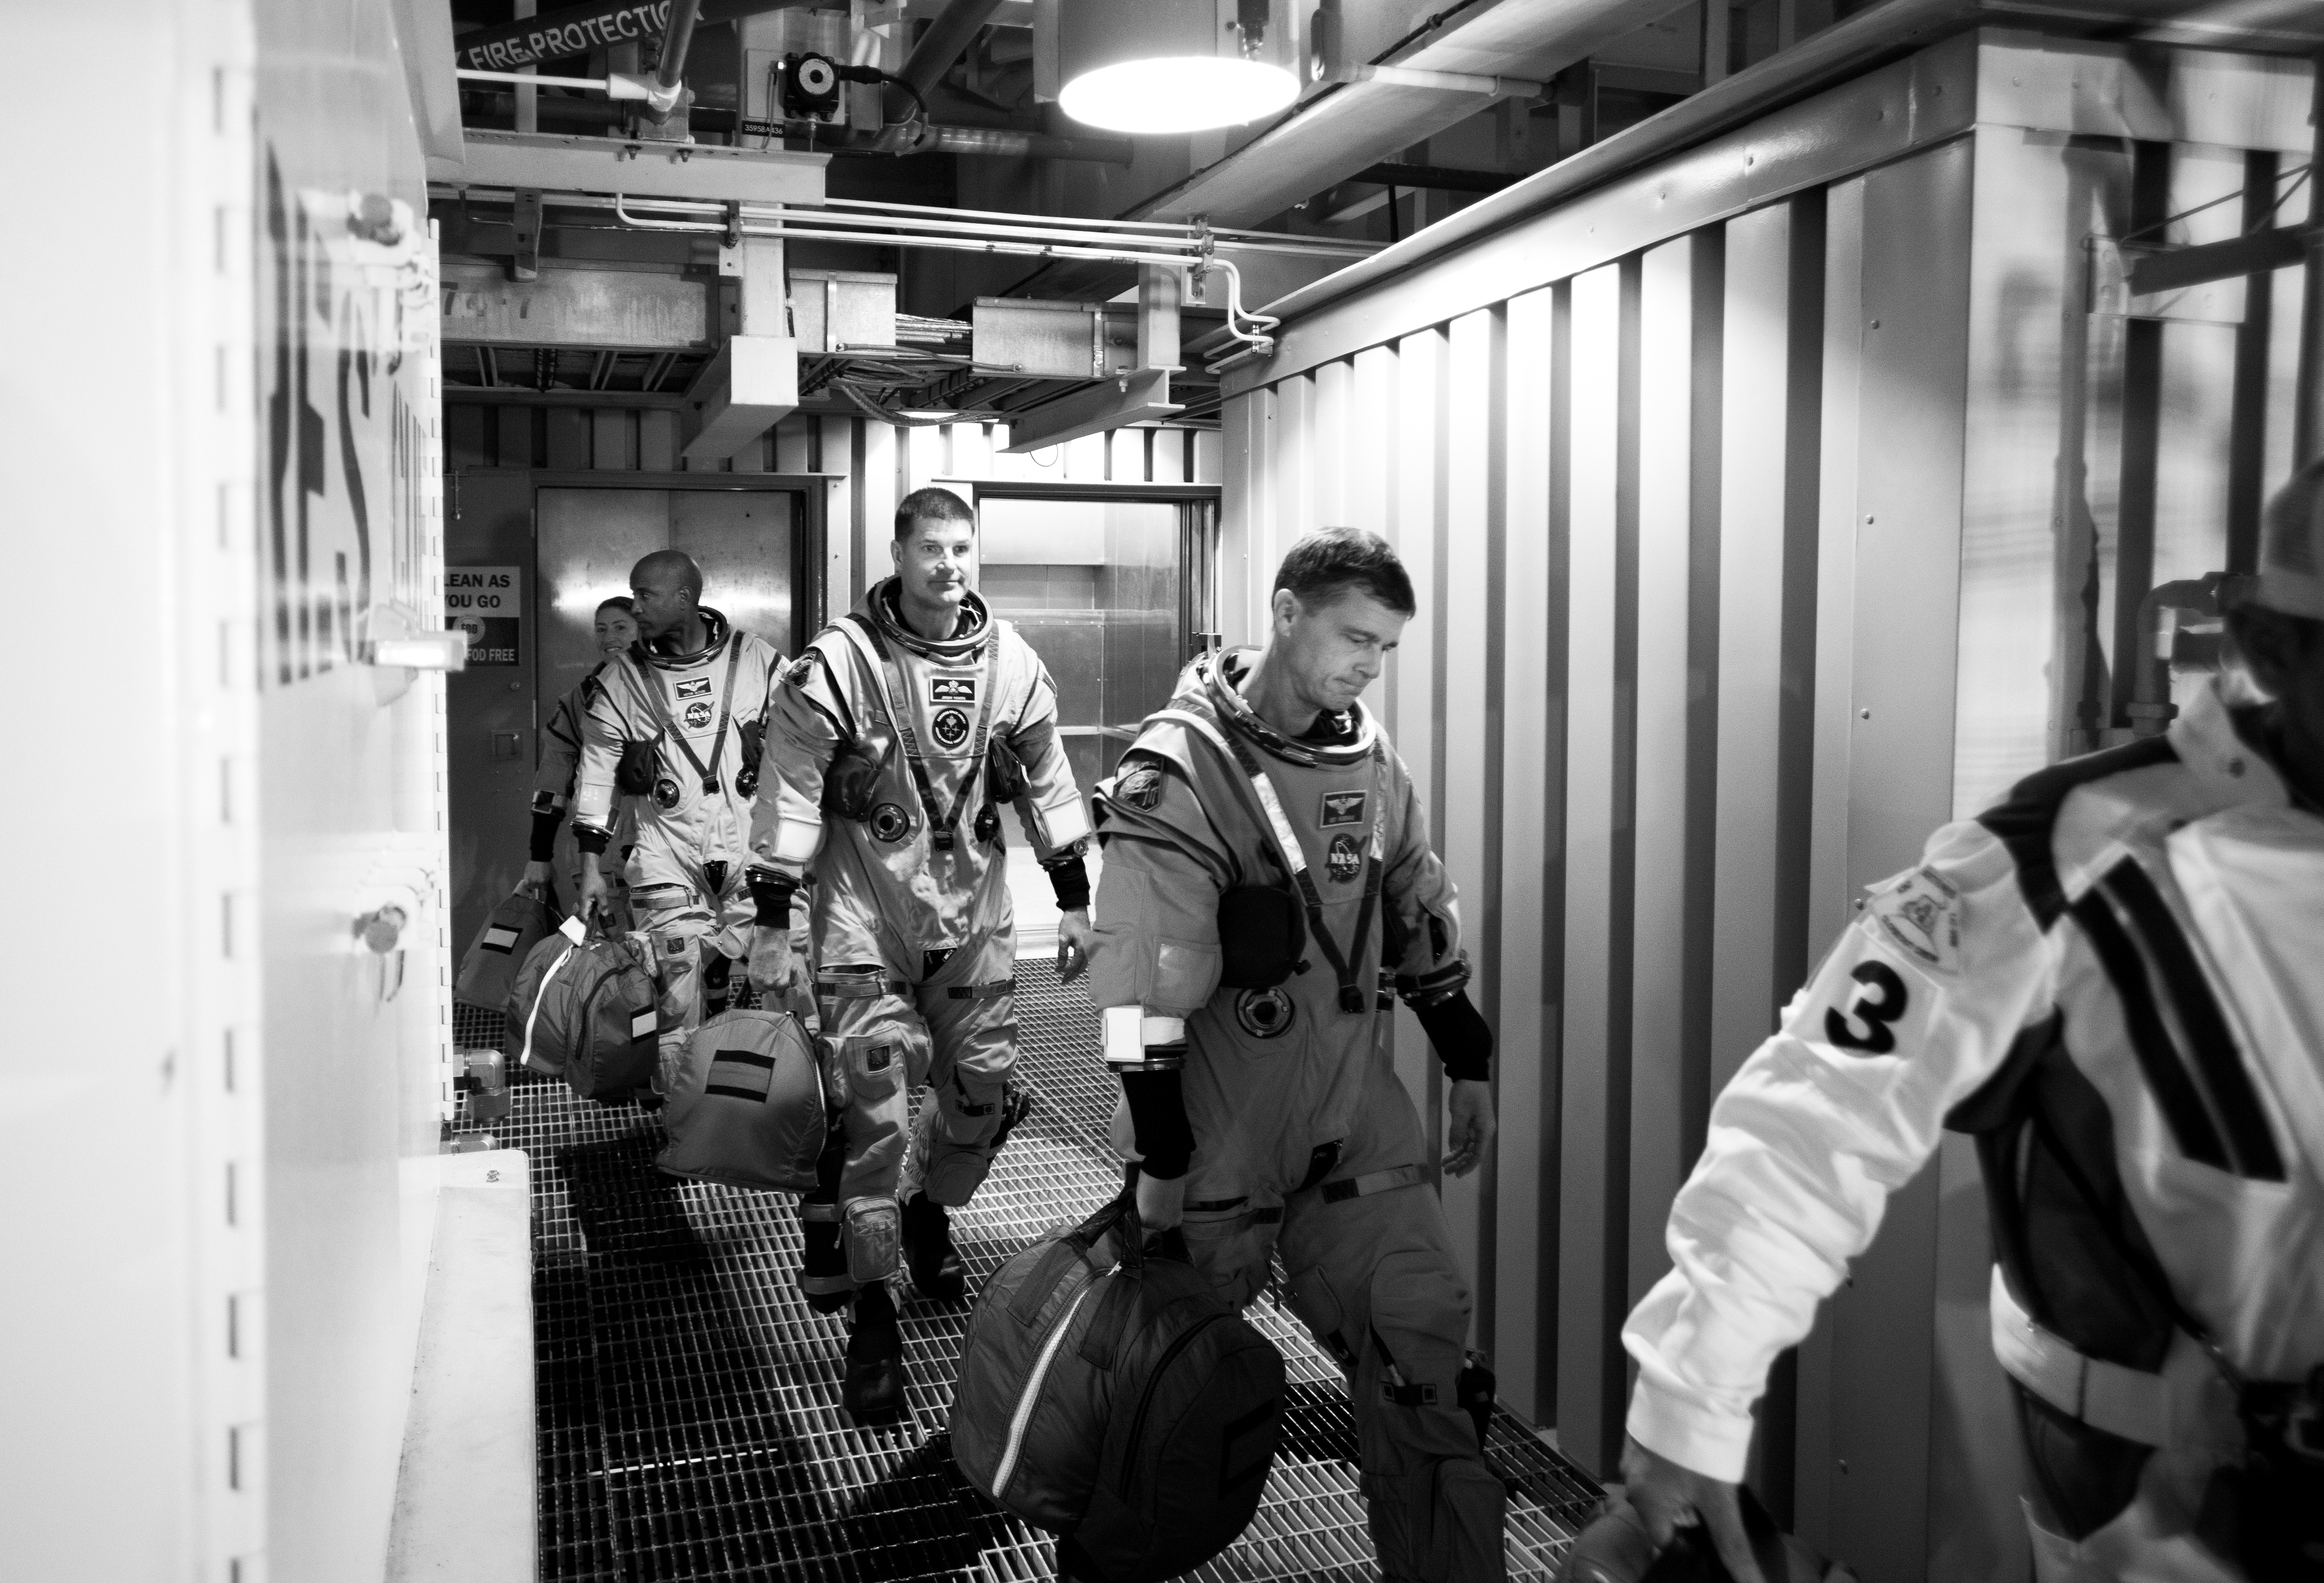
Artemis II crewmembers (left to right) NASA astronauts Christina Koch, mission specialist; and Victor Glover, pilot; CSA (Canadian Space Agency) astronaut Jeremy Hansen, mission specialist; and NASA astronaut Reid Wiseman, commander are led by Bill Owens of the Closeout Crew from the elevator at the 275-foot level of the mobile launcher to the crew access arm as they prepare to board their Orion spacecraft atop NASA’s Space Launch System rocket during the Artemis II countdown demonstration test, Saturday, Dec. 20, 2025, inside the Vehicle Assembly Building at NASA’s Kennedy Space Center in Florida. For this operation, the Artemis II crew and launch teams are simulating the launch day timeline including suit-up, walkout, and spacecraft ingress and egress.
Through the Artemis campaign, NASA will send astronauts to explore the Moon for scientific discovery, economic benefits, and to build the foundation for the first crewed missions to Mars, for the benefit of all.
This image was chosen by NASA’s Headquarters photo team as one of the best of 2025.
Image credit: NASA/Joel Kowsky
Best of 2025: Artemis II Countdown Demonstration Test
Artemis II crewmembers (left to right) NASA astronauts Christina Koch, mission specialist; and Victor Glover, pilot; CSA (Canadian Space Agency) astronaut Jeremy Hansen, mission specialist; and NASA astronaut Reid Wiseman, commander are led by Bill Owens of the Closeout Crew from the elevator at the 275-foot level of the mobile launcher to the crew access arm as they prepare to board their Orion spacecraft atop NASA’s Space Launch System rocket during the Artemis II countdown demonstration test, Saturday, Dec. 20, 2025, inside the Vehicle Assembly Building at NASA’s Kennedy Space Center in Florida. For this operation, the Artemis II crew and launch teams are simulating the launch day timeline including suit-up, walkout, and spacecraft ingress and egress.
Through the Artemis campaign, NASA will send astronauts to explore the Moon for scientific discovery, economic benefits, and to build the foundation for the first crewed missions to Mars, for the benefit of all.
This image was chosen by NASA’s Headquarters photo team as one of the best of 2025.
Image credit: NASA/Joel Kowsky
NASA Starts Up Gateway’s Power System for First Time
1 min read
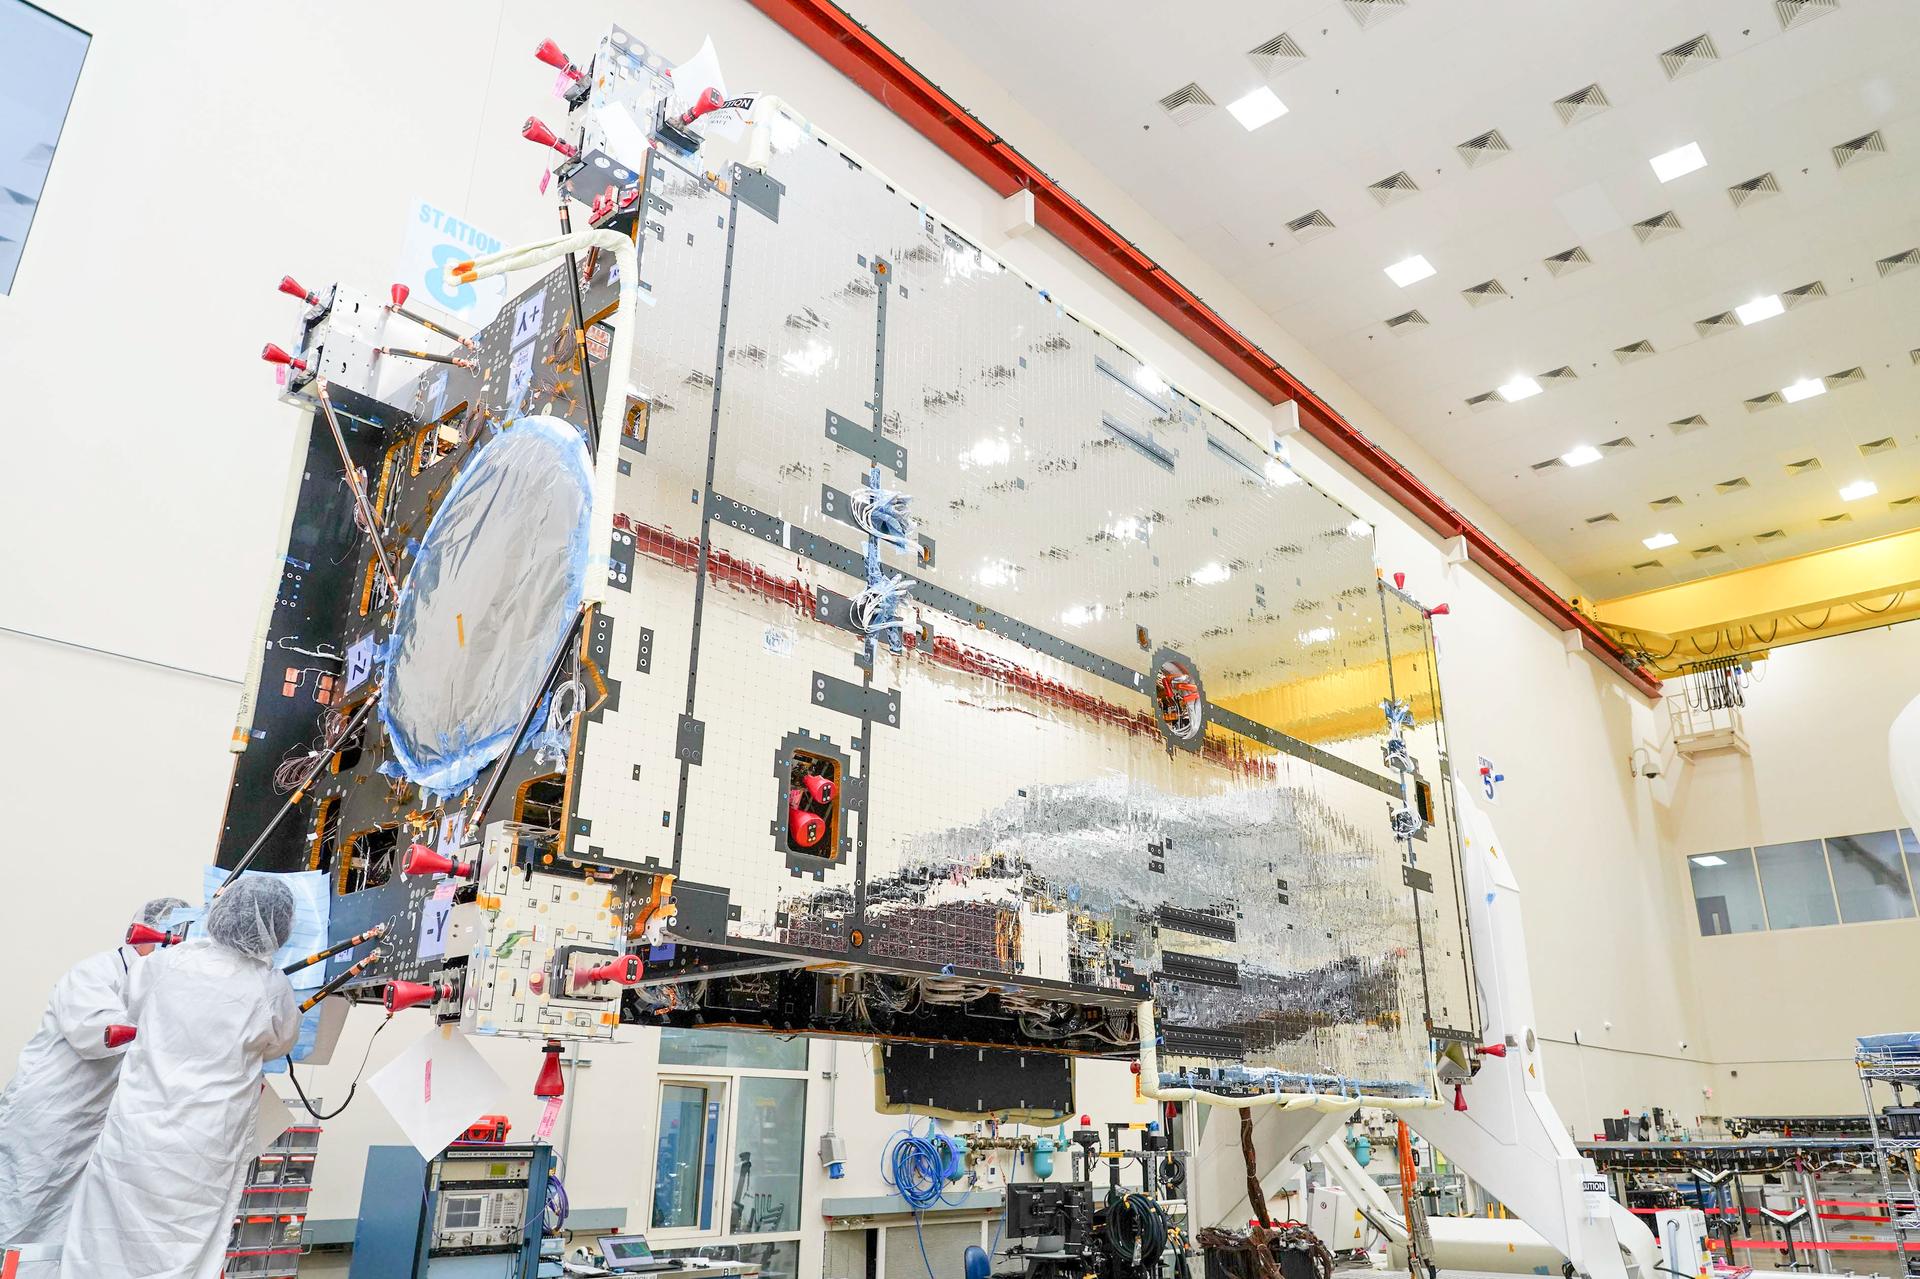
Preparations for Next Moonwalk Simulations Underway (and Underwater) The primary structure of Gateway’s Power and Propulsion Element (PPE) undergoing assembly, integration, and testing at Lanteris Space Systems in Palo Alto, California, on September 29, 2025. Lanteris Space SystemsDevelopment continues on NASA’s Power and Propulsion Element, a solar electric propulsion spacecraft designed to provide power for Gateway in lunar orbit.
Able to generate 60 kilowatts of power, the element was successfully powered on earlier last year. The milestone demonstrates the element can provide the spacecraft with power, high-rate communications, attitude control, as well as the ability to maintain and maneuver between orbits.
The Power and Propulsion Element is managed by NASA’s Glenn Research Center in Cleveland and built by industry partner Lanteris Space Systems in Palo Alto, California, where teams have secured the element’s main electrical system inside protective exterior panels. On deck for installation at Lanteris Space Systems are three 12-kilowatt advanced electric propulsion system thrusters, manufactured by L3Harris, and four 6-kilowatt Busek-built BHT-6000 thrusters. The roll-out solar arrays for Gateway are complete and moving through testing at Redwire’s facility in Goleta, California.
For more information about NASA’s lunar exploration missions, visit:
Share Details Last Updated Jan 08, 2026 ContactJacqueline Minerdjacqueline.minerd@nasa.govLocationGlenn Research Center Related Terms Explore More 3 min read Lunar Space Station Module for NASA’s Artemis Campaign to Begin Final Outfitting Article 9 months ago 2 min read Gateway Tops OffGateway’s Power and Propulsion Element is now equipped with its xenon and liquid fuel tanks.
Article 1 year ago Keep Exploring Discover More Topics From NASAMissions
Humans in Space
Climate Change
Solar System
NASA Starts Up Gateway’s Power System for First Time
1 min read
Preparations for Next Moonwalk Simulations Underway (and Underwater) The primary structure of Gateway’s Power and Propulsion Element (PPE) undergoing assembly, integration, and testing at Lanteris Space Systems in Palo Alto, California, on September 29, 2025. Lanteris Space SystemsDevelopment continues on NASA’s Power and Propulsion Element, a solar electric propulsion spacecraft designed to provide power for Gateway in lunar orbit.
Able to generate 60 kilowatts of power, the element was successfully powered on earlier last year. The milestone demonstrates the element can provide the spacecraft with power, high-rate communications, attitude control, as well as the ability to maintain and maneuver between orbits.
The Power and Propulsion Element is managed by NASA’s Glenn Research Center in Cleveland and built by industry partner Lanteris Space Systems in Palo Alto, California, where teams have secured the element’s main electrical system inside protective exterior panels. On deck for installation at Lanteris Space Systems are three 12-kilowatt advanced electric propulsion system thrusters, manufactured by L3Harris, and four 6-kilowatt Busek-built BHT-6000 thrusters. The roll-out solar arrays for Gateway are complete and moving through testing at Redwire’s facility in Goleta, California.
For more information about NASA’s lunar exploration missions, visit:
Share Details Last Updated Jan 08, 2026 ContactJacqueline Minerdjacqueline.minerd@nasa.govLocationGlenn Research Center Related Terms Explore More 3 min read Lunar Space Station Module for NASA’s Artemis Campaign to Begin Final Outfitting Article 9 months ago 2 min read Gateway Tops OffGateway’s Power and Propulsion Element is now equipped with its xenon and liquid fuel tanks.
Article 1 year ago Keep Exploring Discover More Topics From NASAMissions
Humans in Space
Climate Change
Solar System
Meltwater Turns Iceberg A-23A Blue
- Earth
- Earth Observatory
- Image of the Day
- EO Explorer
- Topics
- More Content
- About
Meltwater Turns Iceberg A-23A Blue
- Earth
- Earth Observatory
- Image of the Day
- EO Explorer
- Topics
- More Content
- About
NASA Celebrates Artemis II During Houston Texans Space City Day
NASA’s Johnson Space Center was front and center Jan. 4, 2026, as the Houston Texans faced the Indianapolis Colts during Space City Day at NRG Stadium. Fans watched the Texans win while getting a close look at NASA’s Artemis II mission, the first crewed flight of the Artemis campaign.
The Artemis II mission will send four astronauts—NASA astronauts Reid Wiseman, Victor Glover, and Christina Koch, along with CSA (Canadian Space Agency) astronaut Jeremy Hansen—around the Moon and back to Earth to test Orion spacecraft systems in deep space and help lay the groundwork for future lunar missions.
NASA connected fans with the agency’s next giant leap, reinforcing Space City’s role in shaping the future of human exploration.
NASA’s Johnson Space Center employees hold the American flag on the field during the national anthem at NRG Stadium in Houston.Image courtesy of the Houston TexansBefore kickoff, 27 Johnson employees helped unfurl the U.S. flag for the national anthem, marking the start of an evening that blended football, exploration, and Houston pride.
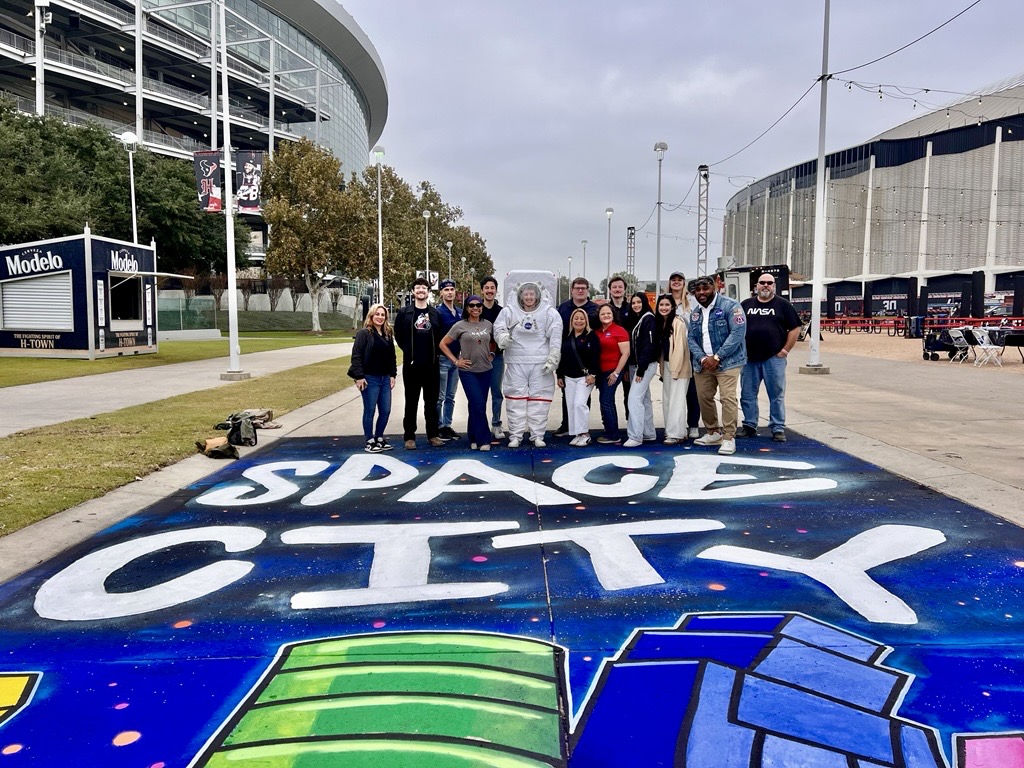
Johnson employees gather on the BULLevard to share the excitement of space exploration with football fans.On the BULLevard, Johnson employees engaged with fans at a NASA activation area, where visitors explored the agency’s Mobile Exhibit Trailer and learned more about Artemis II. Team members answered questions and shared how NASA is preparing to send humans back to the Moon.
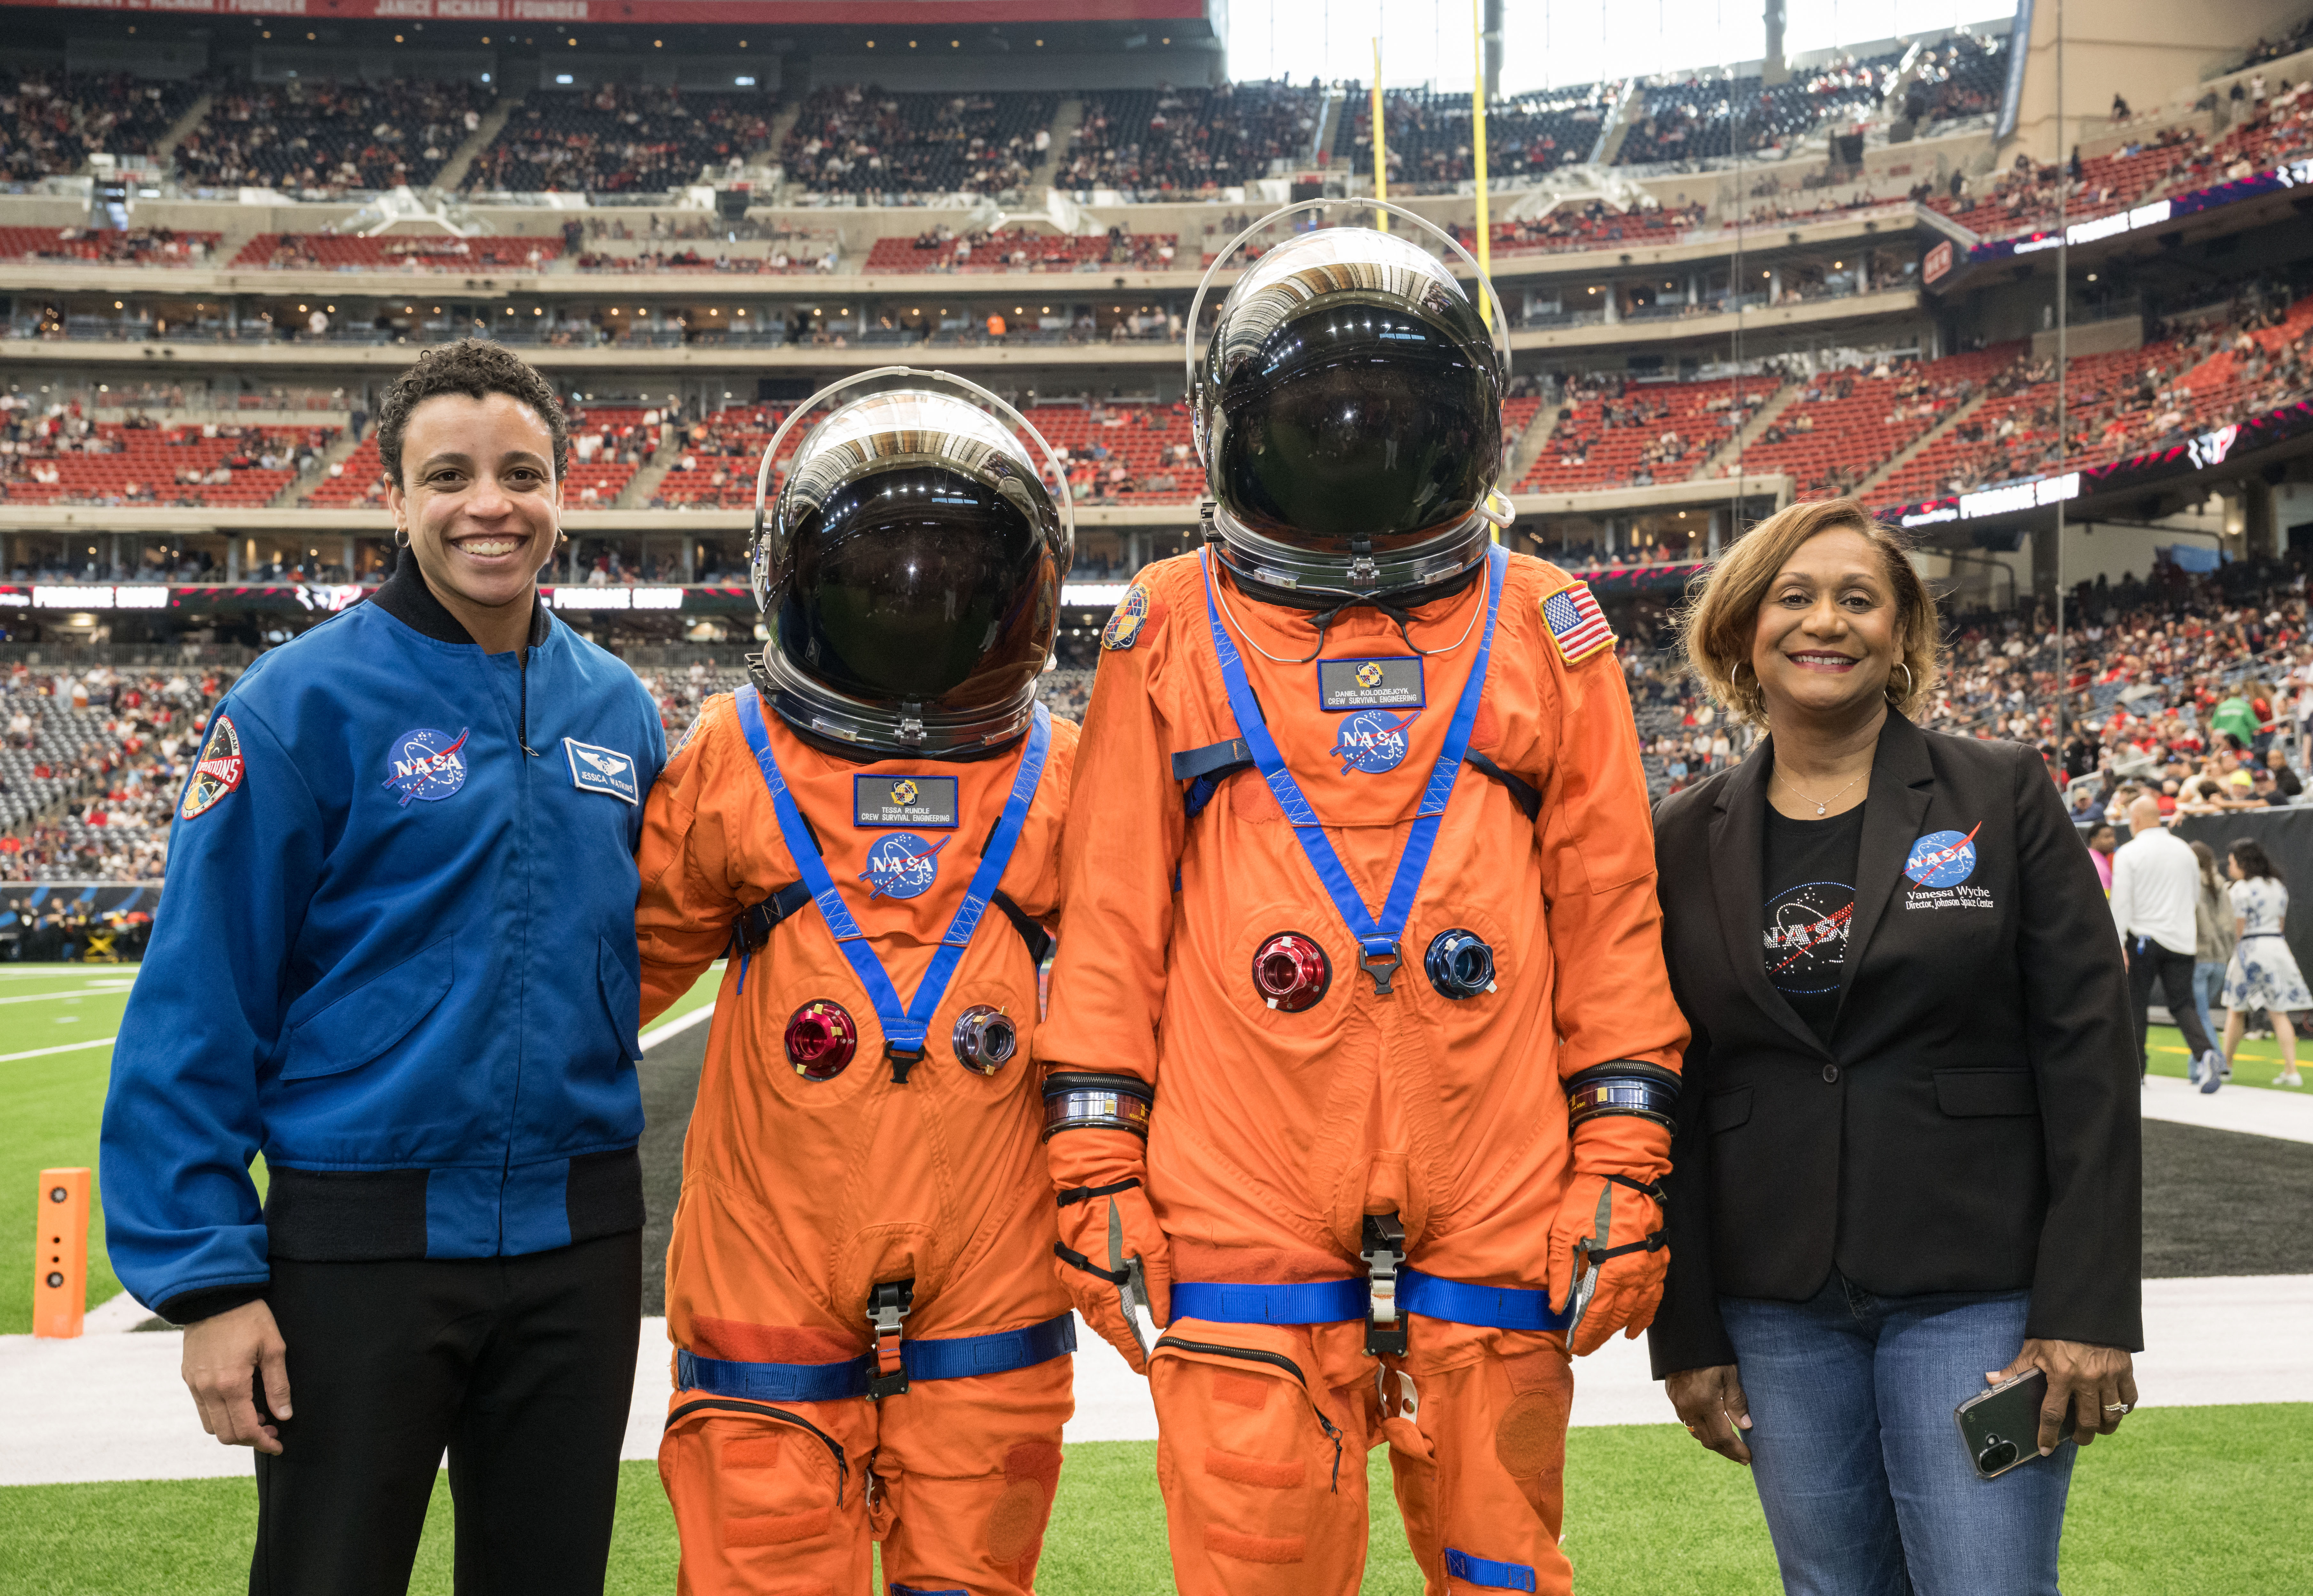
From left, Johnson Community Engagement Lead Jessica Cordero, NASA astronaut Jessica Watkins, Johnson Space Center Director Vanessa Wyche, NASA Flight Controller Jonathan Guthmiller wearing the Extravehicular Mobility Unit (EMU), Multimedia Developer Jessica Krenzel, and NASA Flight Controller Sarah Hill stand together during the outdoor engagement on the BULLevard outside NRG Stadium.Johnson Director Vanessa Wyche and NASA astronaut Jessica Watkins visited the exhibit and the Extravehicular Activity and Human Surface Mobility Program booth, where they greeted team members and thanked volunteers supporting the event.
The International Space Station Program joined the celebration with a prerecorded message from the Expedition 74 crew, marking over 25 years of continuous human presence in low Earth orbit.
The Expedition 74 crew aboard the International Space Station deliver a prerecorded message to fans on the stadium jumbotron during the Houston Texans’ Space City Day game.“Even from 250 miles above the Earth, we’re proud to represent Houston and celebrate the mission of this incredible city on and off the field,” said NASA astronaut Mike Fincke.
“Today’s game reminds us how connected Houston, NASA, and the Texans truly are,” said NASA astronaut Zena Cardman.
Cardman highlighted how research aboard the International Space Station has led to innovations that benefit life on Earth, including applications now used in sports and athletic safety. Advances in materials developed for spacesuits and astronaut protection have influenced the design of modern helmets and padding, while cooling technologies originally created for extreme environments are used in training gear and protective equipment.
“Space innovation doesn’t remain in orbit, sometimes it ends up on the 50-yard line.”
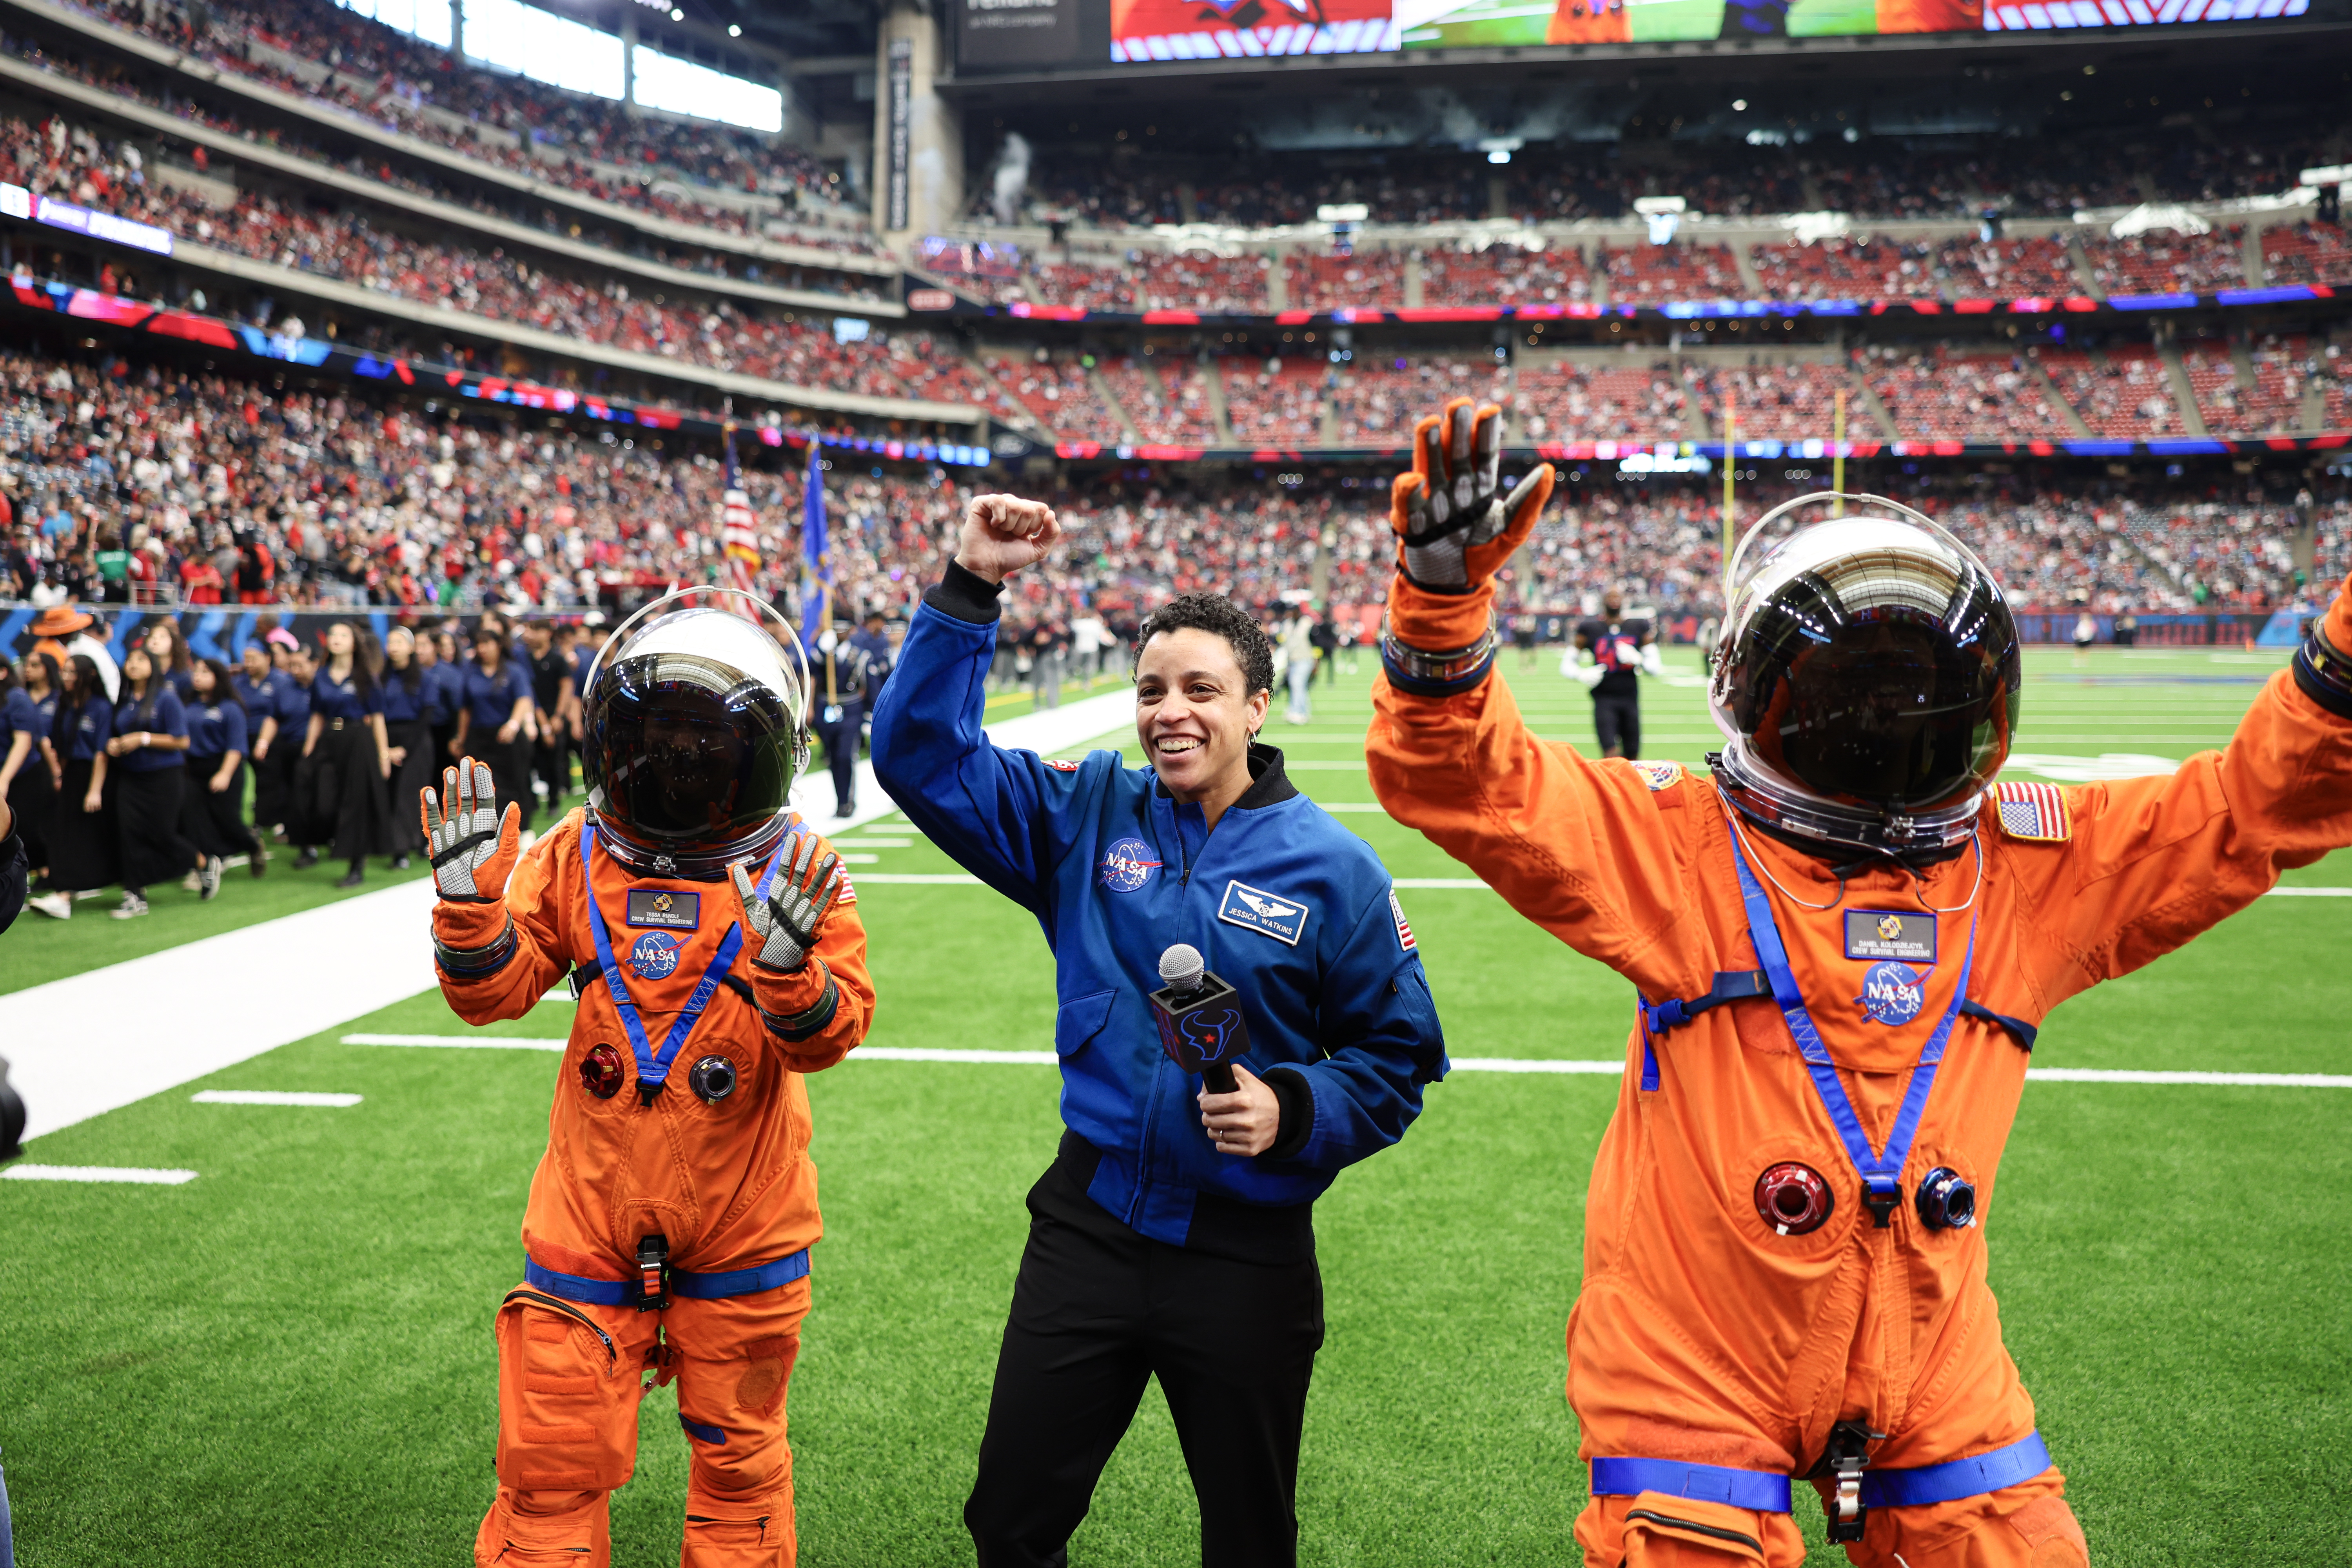
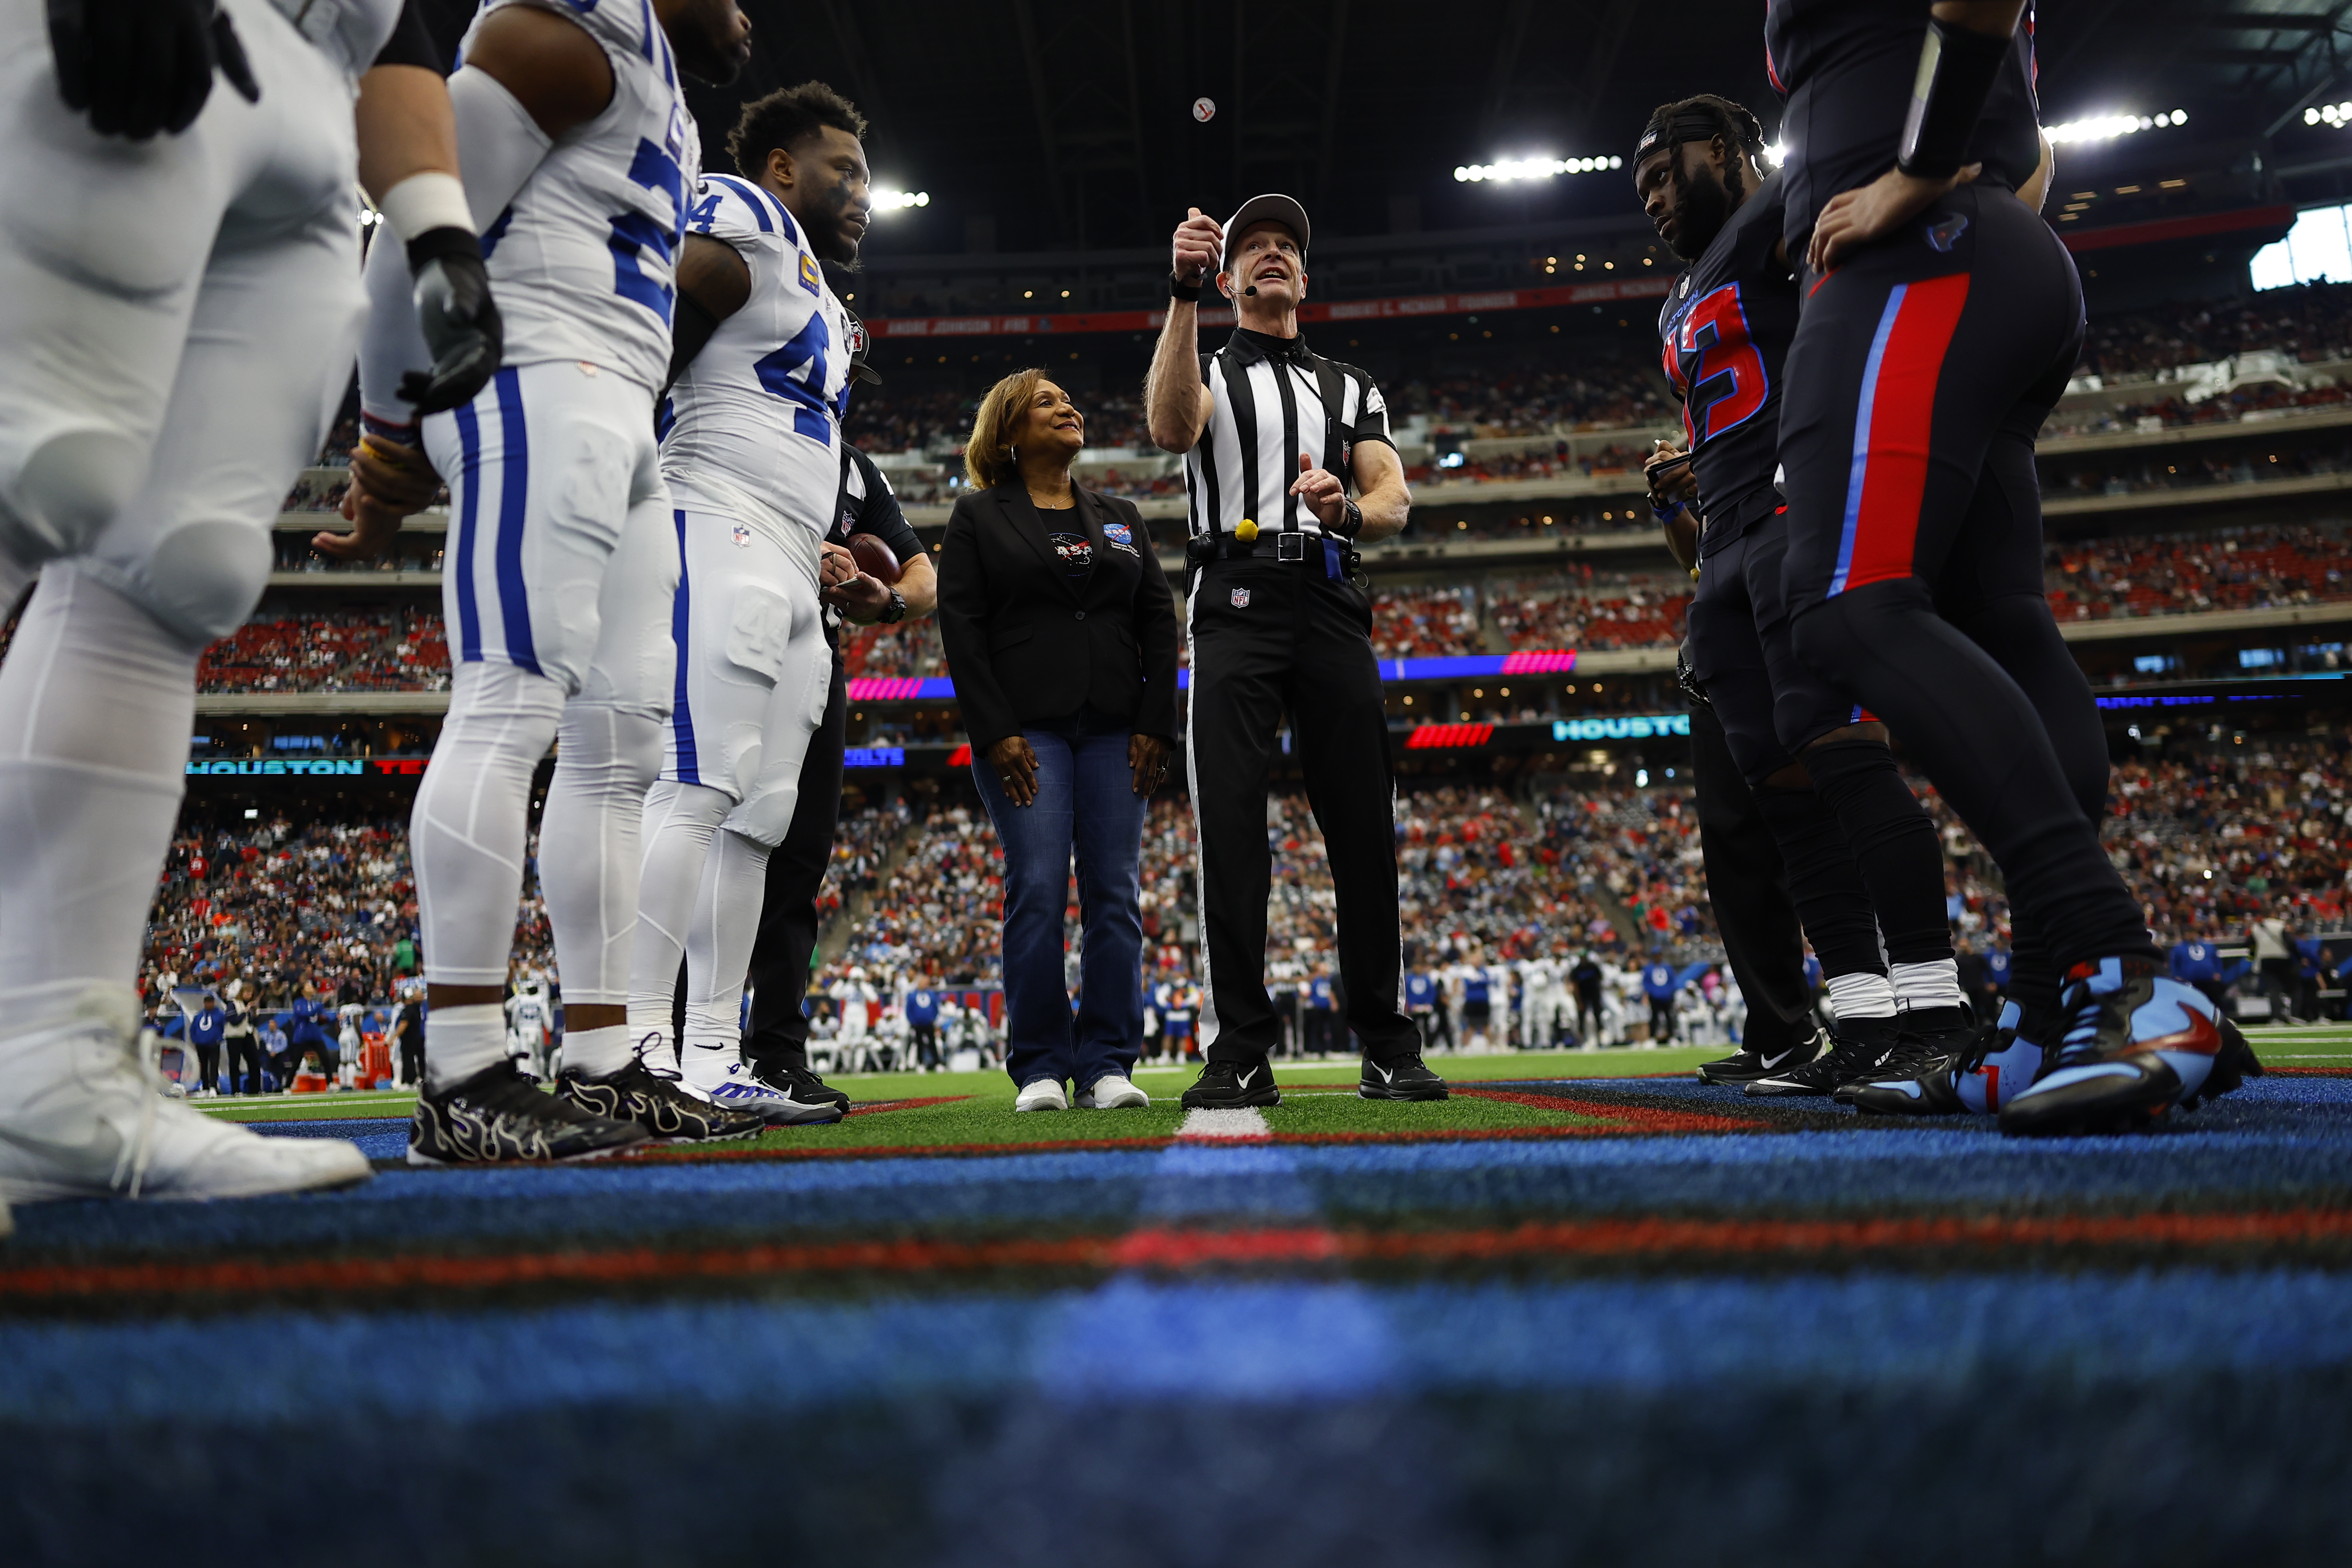
NASA astronaut Jessica Watkins, center, and Johnson employees Tessa Rundle and Daniel Kolodziejcyk, wearing Orion Crew Survival System spacesuits, take the field during the Texans’ “Reppin’ H-Town” appearance. Image courtesy of the Houston Texans Johnson Director Vanessa Wyche waves to fans after participating in the ceremonial coin toss.Image courtesy of the Houston TexansJessica Watkins took the field for the Texans’ “Reppin’ H-Town” appearance, joined by Johnson employees Tessa Rundle and Daniel Kolodziejcyk wearing NASA’s Orion Crew Survival System spacesuits. The bright orange pressure suits are designed to protect astronauts during launch, flight, and reentry aboard NASA’s Orion spacecraft.
The pregame continued with Center Director Vanessa Wyche joining the festivities on the field and participating in the ceremonial coin toss, where she called heads.
About 30 seconds into halftime, the Artemis Fueling the Fire video played on the stadium jumbotron, sharing NASA’s plans to return humans to the Moon and marking a major step in the agency’s Moon to Mars campaign.
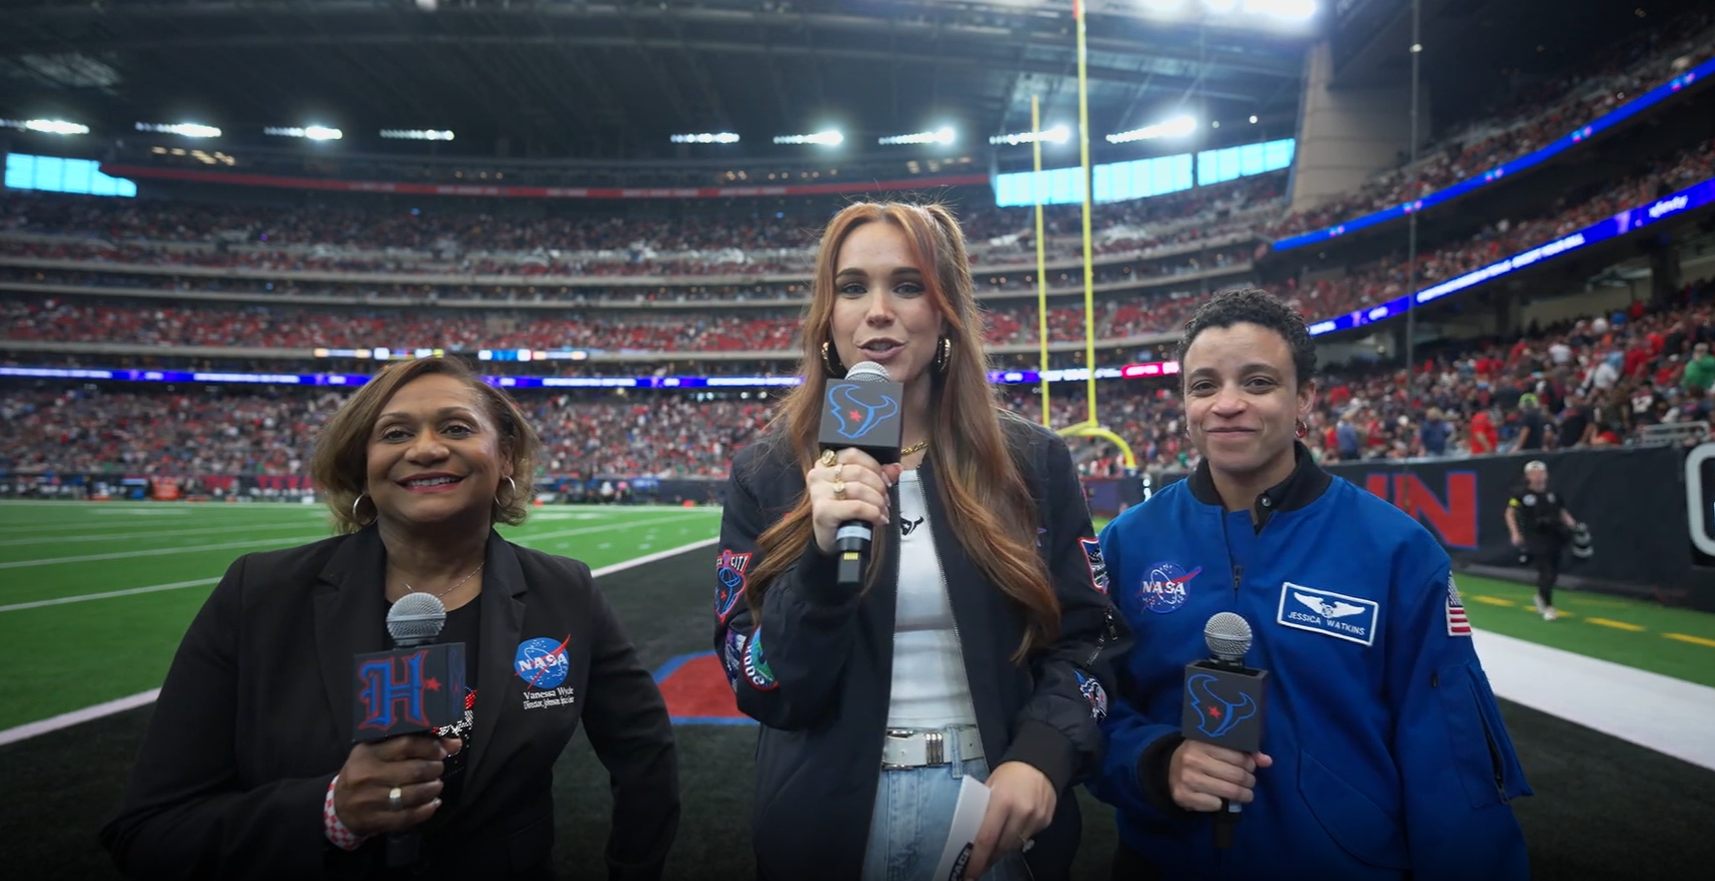
Center Director Vanessa Wyche and NASA astronaut Jessica Watkins are interviewed on the field during halftime.The video led into a live interview with Vanessa Wyche and Jessica Watkins, where Wyche discussed the Artemis II mission and Watkins highlighted similarities between astronaut training and football training. At the conclusion of the interview, the host invited fans to take part in NASA’s “Send Your Name with Artemis II” initiative, which allows the public to have their names stored on a small chip aboard the Orion spacecraft during the mission. Participants receive a digital boarding pass and virtual guest access to select NASA launches. While the names remain stored electronically inside the spacecraft, the effort symbolically gives participants a place on Orion’s journey around the Moon.
Image courtesy of the Houston Texans Image courtesy of the Houston Texans NASA/James Blair Image courtesy of the Houston Texans NASA/James Blair Explore More 1 min read NASA Starts Up Gateway’s Power System for First Time Article 4 hours ago 4 min read 25 Years in Orbit: Science, Innovation, and the Future of Exploration Article 24 hours ago 4 min read Diving Into Human Spaceflight Safety with NASA Johnson’s Craig Shannon Article 2 days agoNASA Celebrates Artemis II During Houston Texans Space City Day
NASA’s Johnson Space Center was front and center Jan. 4, 2026, as the Houston Texans faced the Indianapolis Colts during Space City Day at NRG Stadium. Fans watched the Texans win while getting a close look at NASA’s Artemis II mission, the first crewed flight of the Artemis campaign.
The Artemis II mission will send four astronauts—NASA astronauts Reid Wiseman, Victor Glover, and Christina Koch, along with CSA (Canadian Space Agency) astronaut Jeremy Hansen—around the Moon and back to Earth to test Orion spacecraft systems in deep space and help lay the groundwork for future lunar missions.
NASA connected fans with the agency’s next giant leap, reinforcing Space City’s role in shaping the future of human exploration.
NASA’s Johnson Space Center employees hold the American flag on the field during the national anthem at NRG Stadium in Houston.Image courtesy of the Houston TexansBefore kickoff, 27 Johnson employees helped unfurl the U.S. flag for the national anthem, marking the start of an evening that blended football, exploration, and Houston pride.
Johnson employees gather on the BULLevard to share the excitement of space exploration with football fans.On the BULLevard, Johnson employees engaged with fans at a NASA activation area, where visitors explored the agency’s Mobile Exhibit Trailer and learned more about Artemis II. Team members answered questions and shared how NASA is preparing to send humans back to the Moon.
From left, Johnson Community Engagement Lead Jessica Cordero, NASA astronaut Jessica Watkins, Johnson Space Center Director Vanessa Wyche, NASA Flight Controller Jonathan Guthmiller wearing the Extravehicular Mobility Unit (EMU), Multimedia Developer Jessica Krenzel, and NASA Flight Controller Sarah Hill stand together during the outdoor engagement on the BULLevard outside NRG Stadium.Johnson Director Vanessa Wyche and NASA astronaut Jessica Watkins visited the exhibit and the Extravehicular Activity and Human Surface Mobility Program booth, where they greeted team members and thanked volunteers supporting the event.
The International Space Station Program joined the celebration with a prerecorded message from the Expedition 74 crew, marking over 25 years of continuous human presence in low Earth orbit.
The Expedition 74 crew aboard the International Space Station deliver a prerecorded message to fans on the stadium jumbotron during the Houston Texans’ Space City Day game.“Even from 250 miles above the Earth, we’re proud to represent Houston and celebrate the mission of this incredible city on and off the field,” said NASA astronaut Mike Fincke.
“Today’s game reminds us how connected Houston, NASA, and the Texans truly are,” said NASA astronaut Zena Cardman.
Cardman highlighted how research aboard the International Space Station has led to innovations that benefit life on Earth, including applications now used in sports and athletic safety. Advances in materials developed for spacesuits and astronaut protection have influenced the design of modern helmets and padding, while cooling technologies originally created for extreme environments are used in training gear and protective equipment.
“Space innovation doesn’t remain in orbit, sometimes it ends up on the 50-yard line.”
NASA astronaut Jessica Watkins, center, and Johnson employees Tessa Rundle and Daniel Kolodziejcyk, wearing Orion Crew Survival System spacesuits, take the field during the Texans’ “Reppin’ H-Town” appearance. Image courtesy of the Houston Texans Johnson Director Vanessa Wyche waves to fans after participating in the ceremonial coin toss.Image courtesy of the Houston TexansJessica Watkins took the field for the Texans’ “Reppin’ H-Town” appearance, joined by Johnson employees Tessa Rundle and Daniel Kolodziejcyk wearing NASA’s Orion Crew Survival System spacesuits. The bright orange pressure suits are designed to protect astronauts during launch, flight, and reentry aboard NASA’s Orion spacecraft.
The pregame continued with Center Director Vanessa Wyche joining the festivities on the field and participating in the ceremonial coin toss, where she called heads.
About 30 seconds into halftime, the Artemis Fueling the Fire video played on the stadium jumbotron, sharing NASA’s plans to return humans to the Moon and marking a major step in the agency’s Moon to Mars campaign.
Center Director Vanessa Wyche and NASA astronaut Jessica Watkins are interviewed on the field during halftime.The video led into a live interview with Vanessa Wyche and Jessica Watkins, where Wyche discussed the Artemis II mission and Watkins highlighted similarities between astronaut training and football training. At the conclusion of the interview, the host invited fans to take part in NASA’s “Send Your Name with Artemis II” initiative, which allows the public to have their names stored on a small chip aboard the Orion spacecraft during the mission. Participants receive a digital boarding pass and virtual guest access to select NASA launches. While the names remain stored electronically inside the spacecraft, the effort symbolically gives participants a place on Orion’s journey around the Moon.
Image courtesy of the Houston Texans Image courtesy of the Houston Texans NASA/James Blair NASA NASA/James Blair Image courtesy of the Houston Texans NASA/James Blair Explore More 1 min read NASA Starts Up Gateway’s Power System for First Time Article 12 hours ago 4 min read 25 Years in Orbit: Science, Innovation, and the Future of Exploration Article 1 day ago 4 min read Diving Into Human Spaceflight Safety with NASA Johnson’s Craig Shannon Article 3 days ago25 Years in Orbit: Science, Innovation, and the Future of Exploration
NASA and its partners have supported humans continuously living and working in space since November 2000. A truly global endeavor, the International Space Station has been visited by more than 290 people from 26 countries and a variety of international and commercial spacecraft. The unique microgravity laboratory has hosted more than 4,000 experiments from over 5,000 researchers from 110 countries. The space station also is facilitating the growth of a commercial market in low Earth orbit for research, technology development, and crew and cargo transportation.
After a quarter of century of human presence in orbit, the station remains a symbol of international cooperation and a proving ground for humanity’s next giant leaps to the Moon and, eventually, Mars.
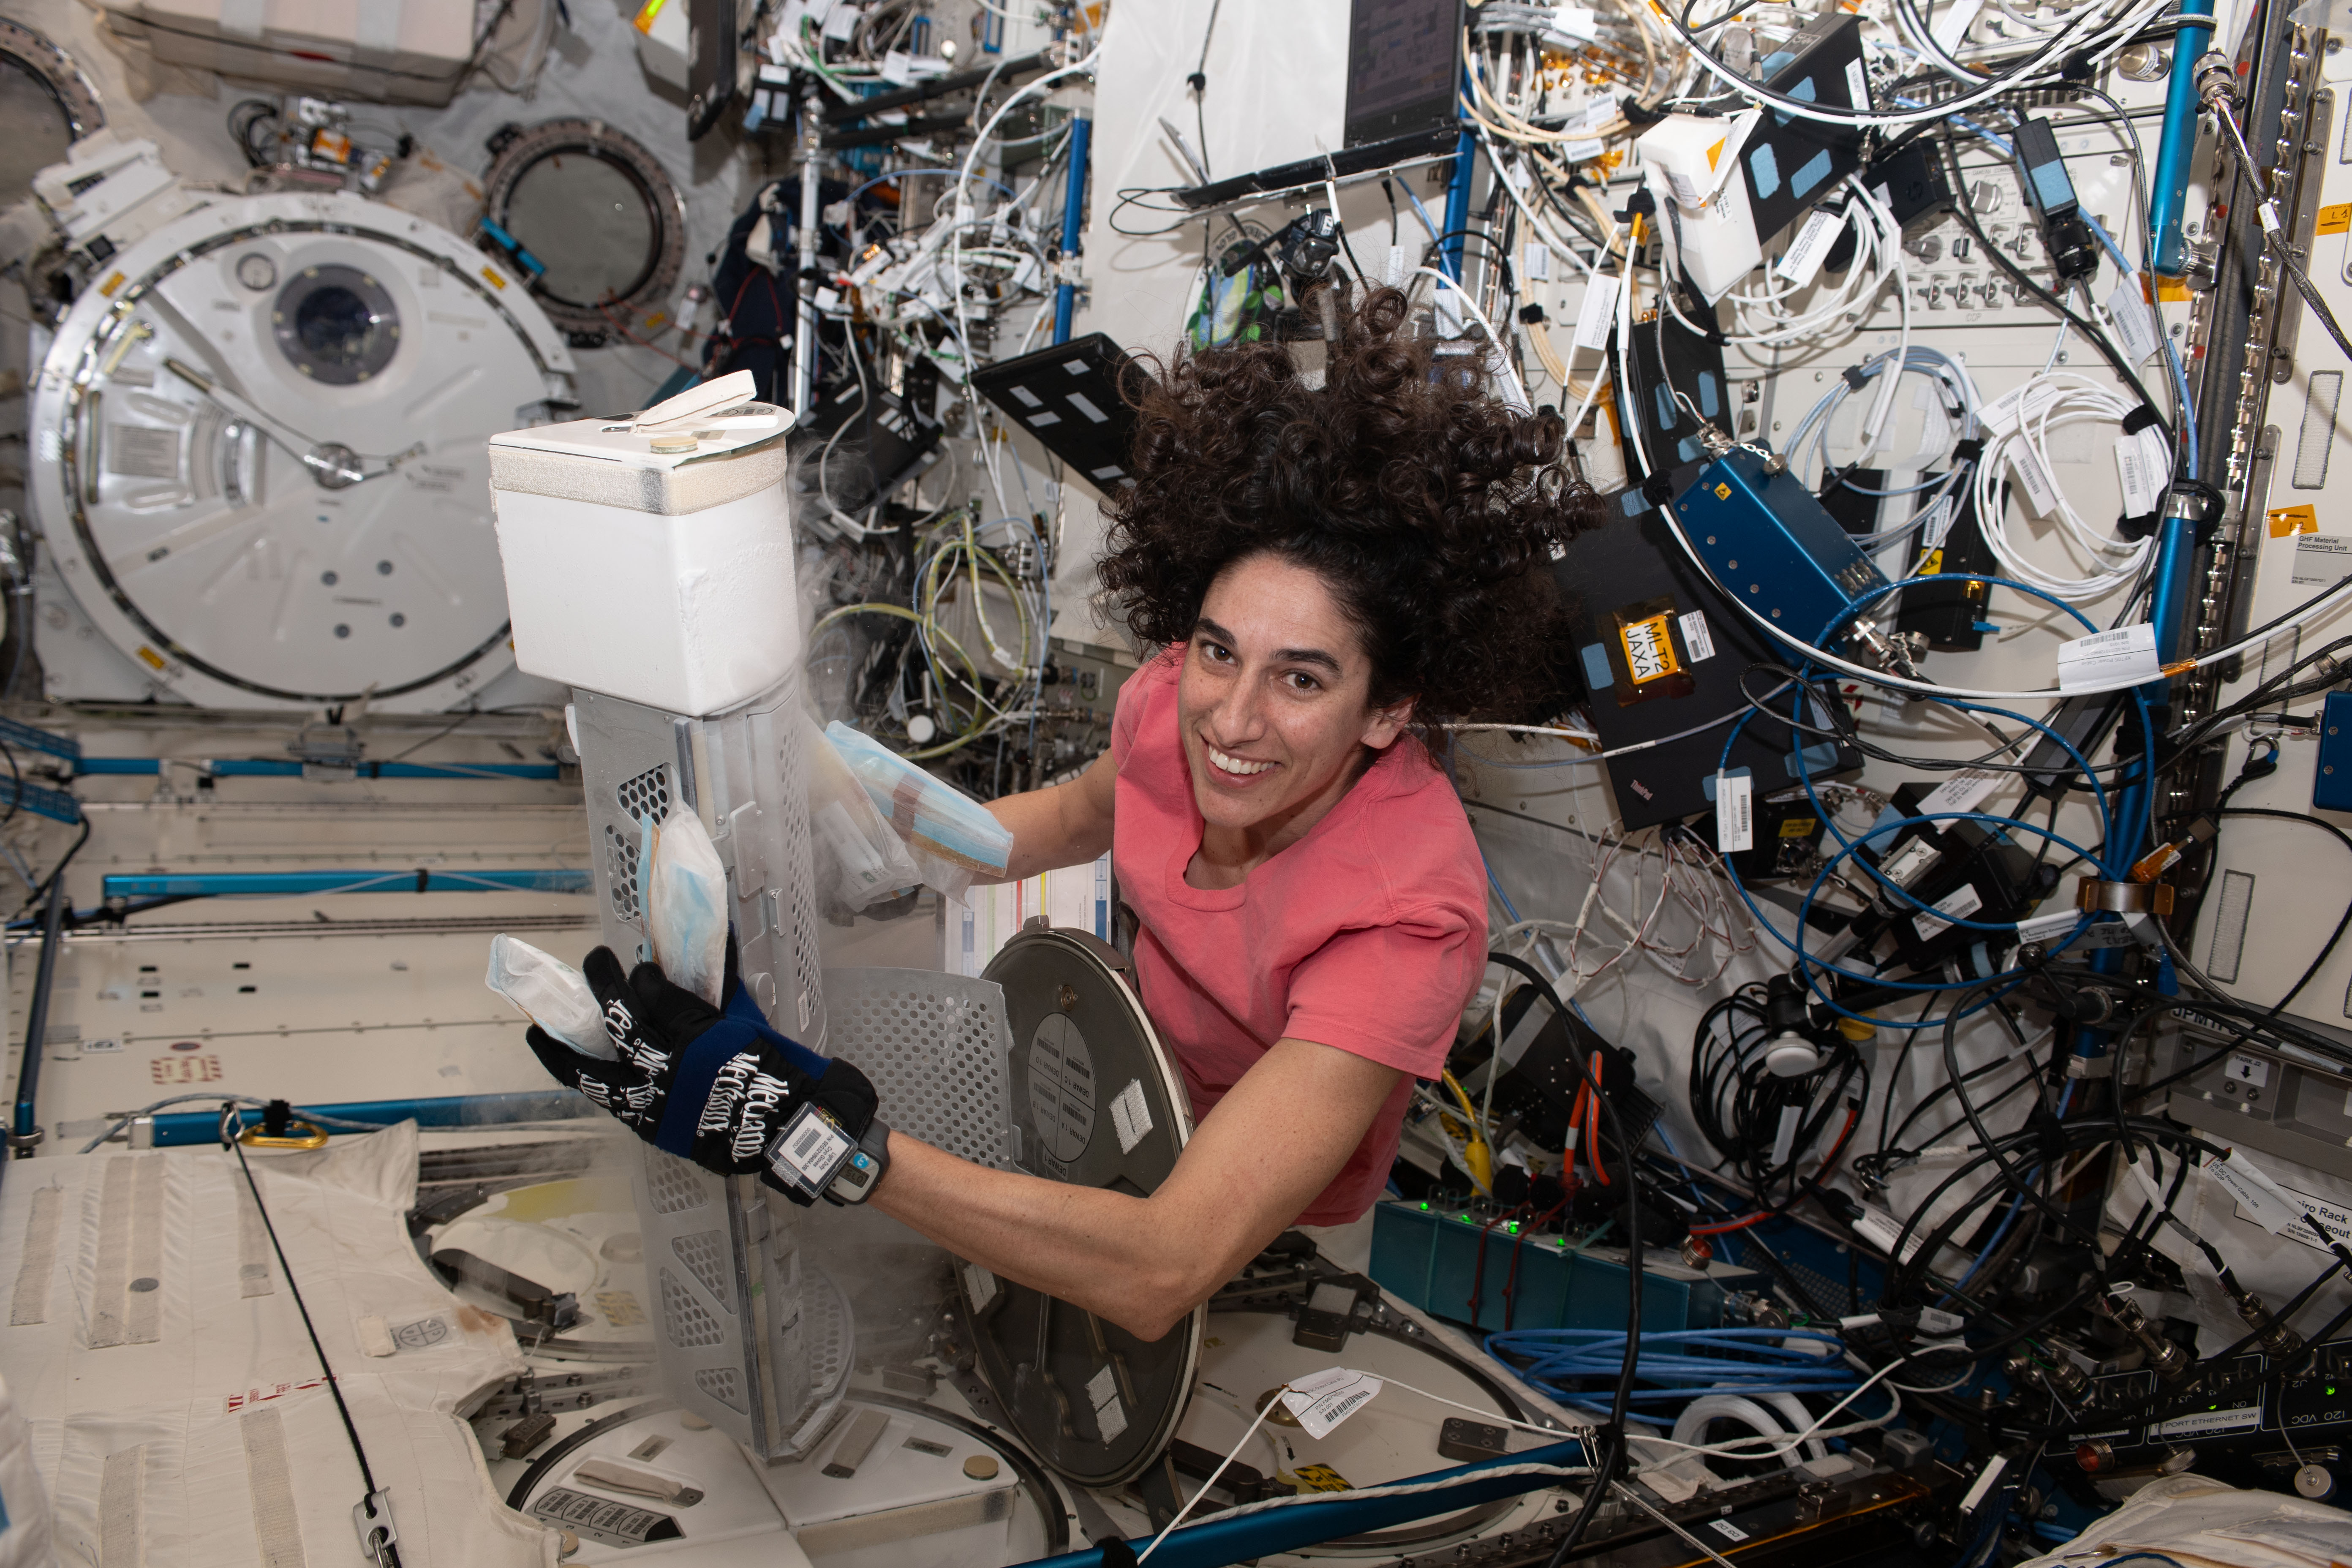
September’s full Moon, the Harvest Moon, is photographed from the space station, placed in between exterior station hardware.NASAThe microgravity environments aboard the space station unlocks discoveries that benefit life on Earth and prepare humans for deep space missions. NASA’s Human Research Program (HRP) works to understand the changes astronauts face aboard the orbital outpost and to develop interventions to keep crews healthy before, during, and after flight.
Astronauts aboard the station exercise for roughly two hours a day to protect bone density, muscle strength, and the cardiovascular system, but the longer they are in microgravity, the harder it can be for the brain and body to readapt to gravity’s pull. After months in orbit, returning astronauts often describe Earth as heavy, loud, and strangely still. Some reacclimate within days, while other astronauts take longer to fully recover.
Through HRP-led studies, scientists track these changes and test solutions—from improved exercise regimens to medical monitoring and nutritional strategies. The results inspire new medical technologies, while teaching scientists how the human body adapts to long-duration spaceflights—knowledge that helps keep astronauts healthy on future missions.
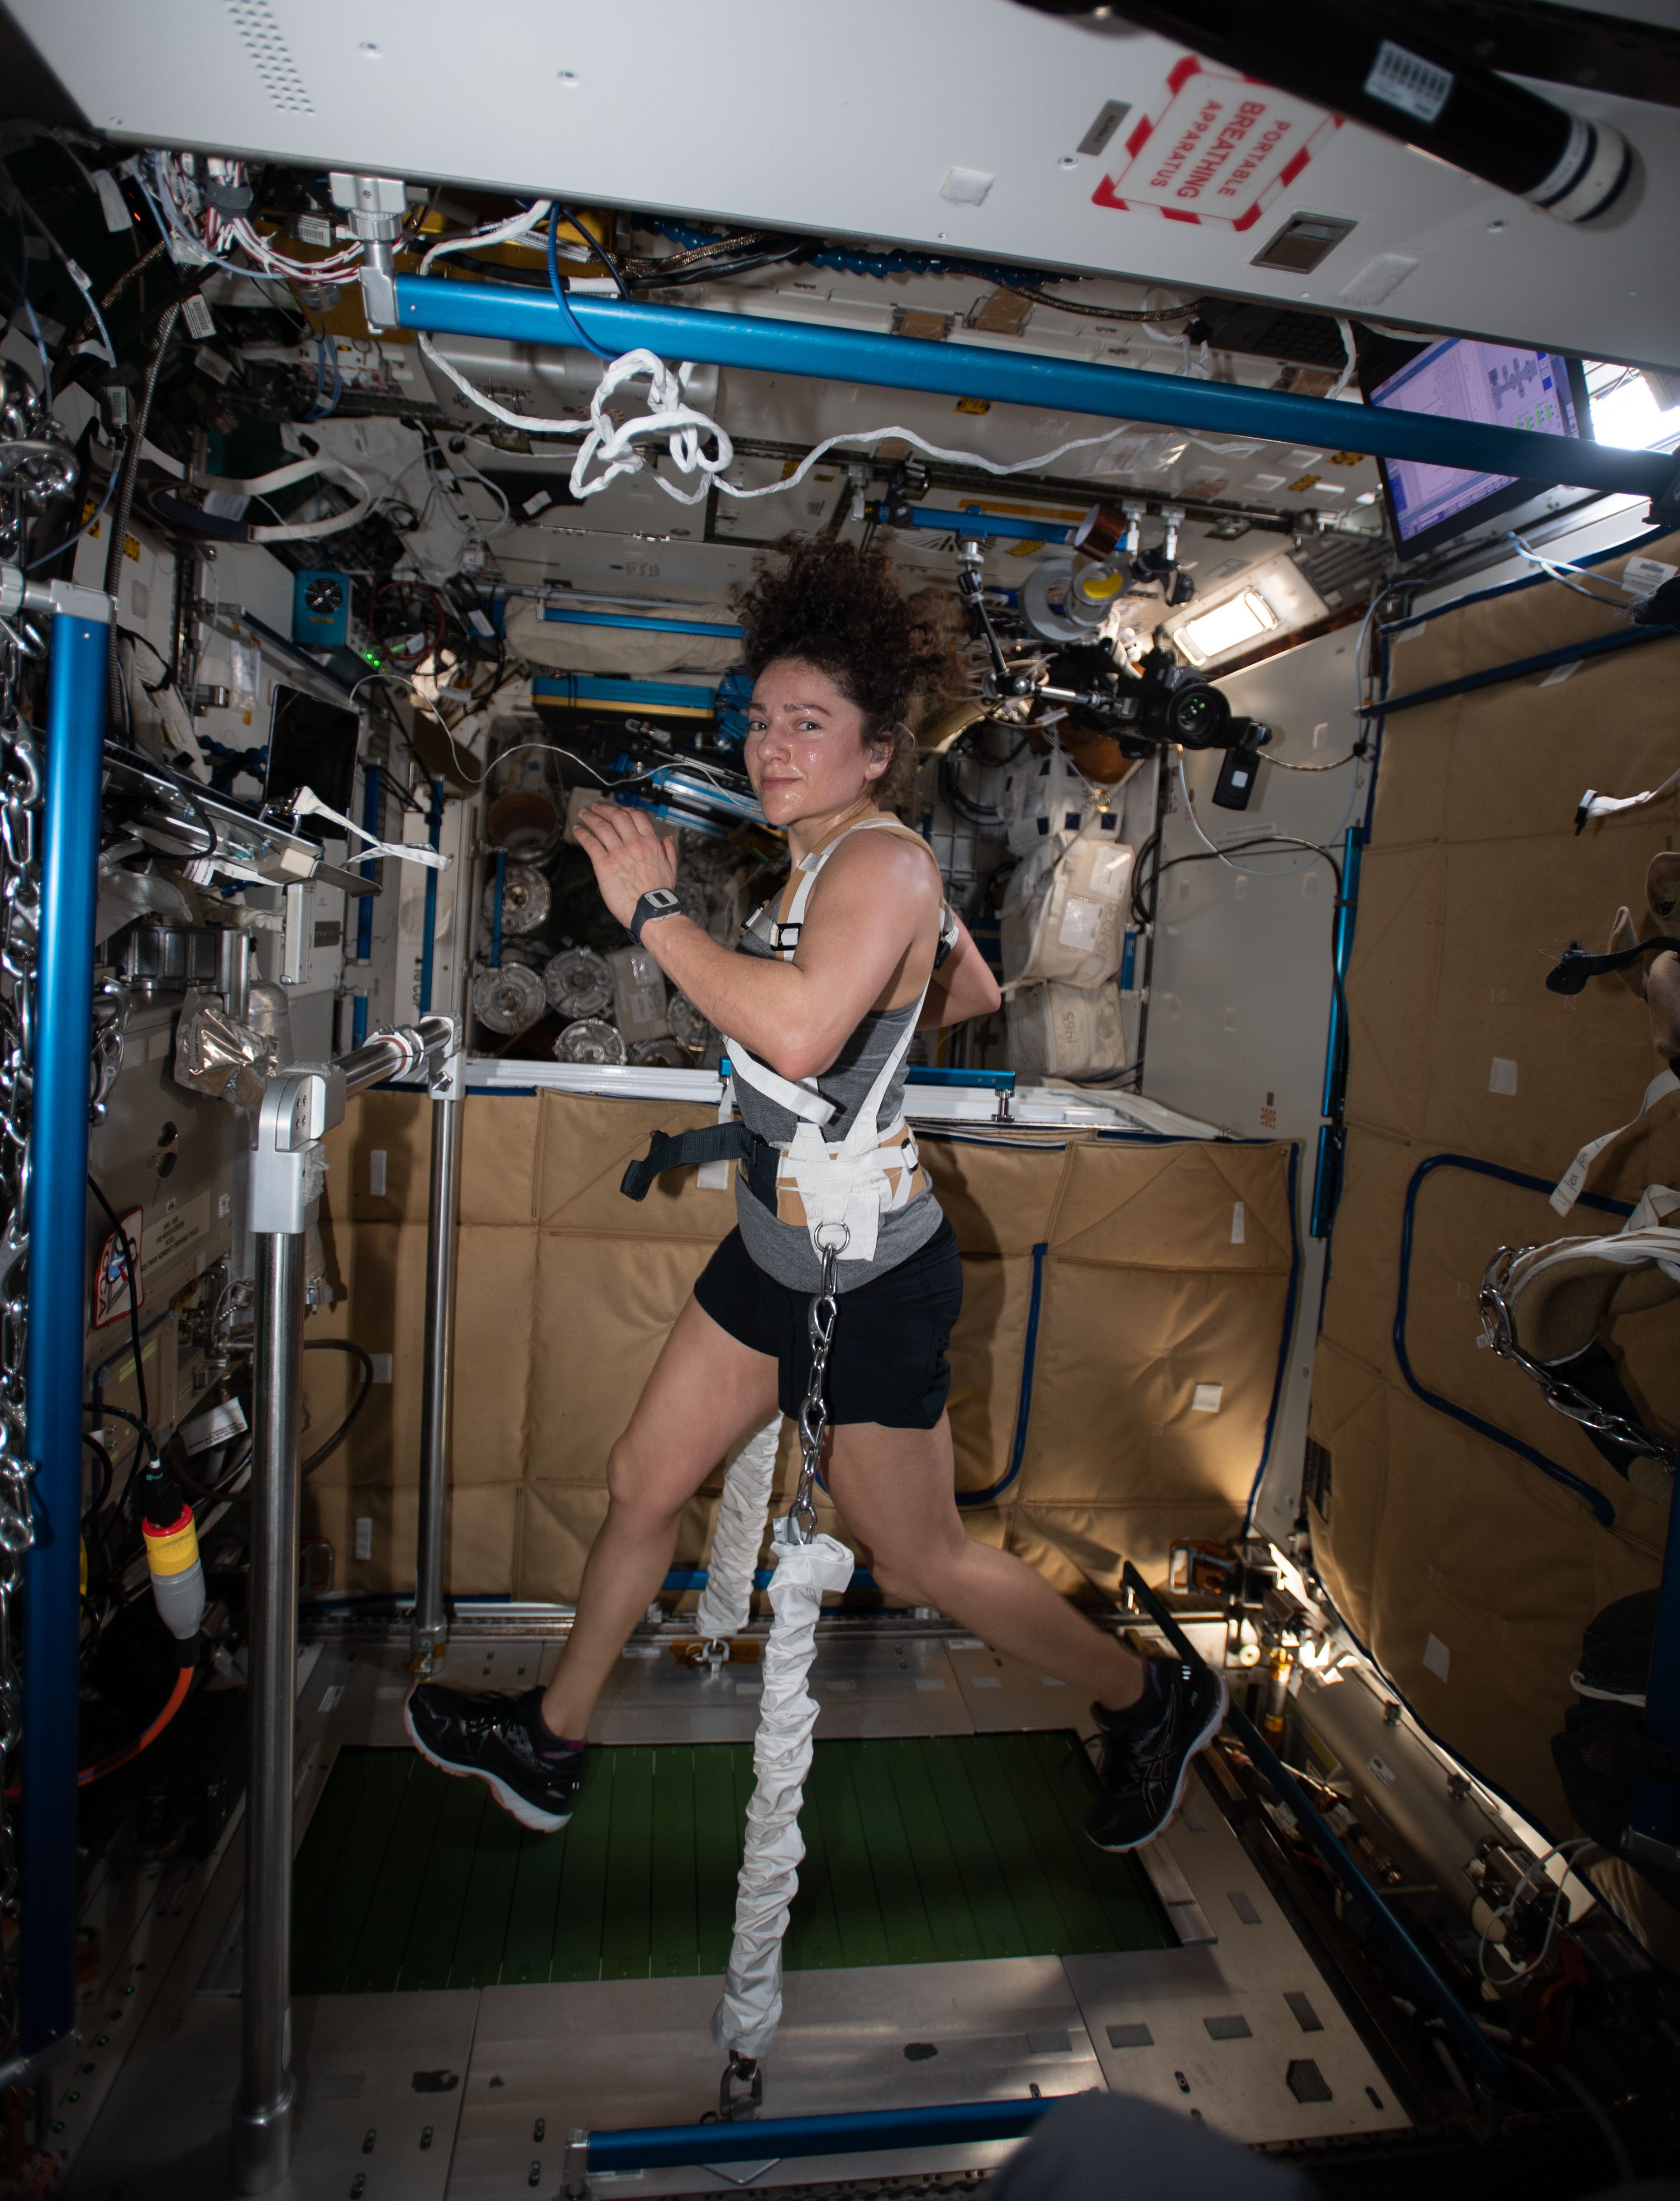
In the Tranquility node of the orbiting laboratory, NASA astronaut Jessica Meir exercises on the Combined Operational Load Bearing External Resistance Treadmill (COLBERT), technically named the Treadmill 2 and abbreviated as T2. NASAThe space station continues to be a critical platform for sharpening skills, technology, and understanding that will prepare humanity to return to the Moon with NASA’s Artemis campaign and journey on to Mars and beyond.
Since space presents an entirely new physical environment with a distinct set of challenges, the orbiting laboratory is uniquely positioned to support research and preparations not possible on Earth. That includes:
- Mastering techniques for basic tasks like drinking water, sleeping, exercising, and handling various materials.
- Developing solutions to microgravity-induced changes to and challenges for the human body.
- Testing reliable technologies and self-sustaining ecosystems necessary for deep space travel, from life support systems to in-orbit agriculture and 3D printing of materials.
- Refining techniques and procedures for data and imagery collection and analysis.
Read more about how the space station has enabled significant strides in our journey farther into the final frontier.
The first decade of the space station was the decade of construction. The second decade moved from initial studies to fully using the orbiting laboratory. Now we are in the decade of results.
With nearly 25 years of experiments conducted aboard the station, more breakthroughs are materializing than ever before. These scientific discoveries and technological advancements are benefiting humanity on the ground, contributing to the growing low Earth orbit economy, and helping to prepare for future exploration of the Moon and Mars.
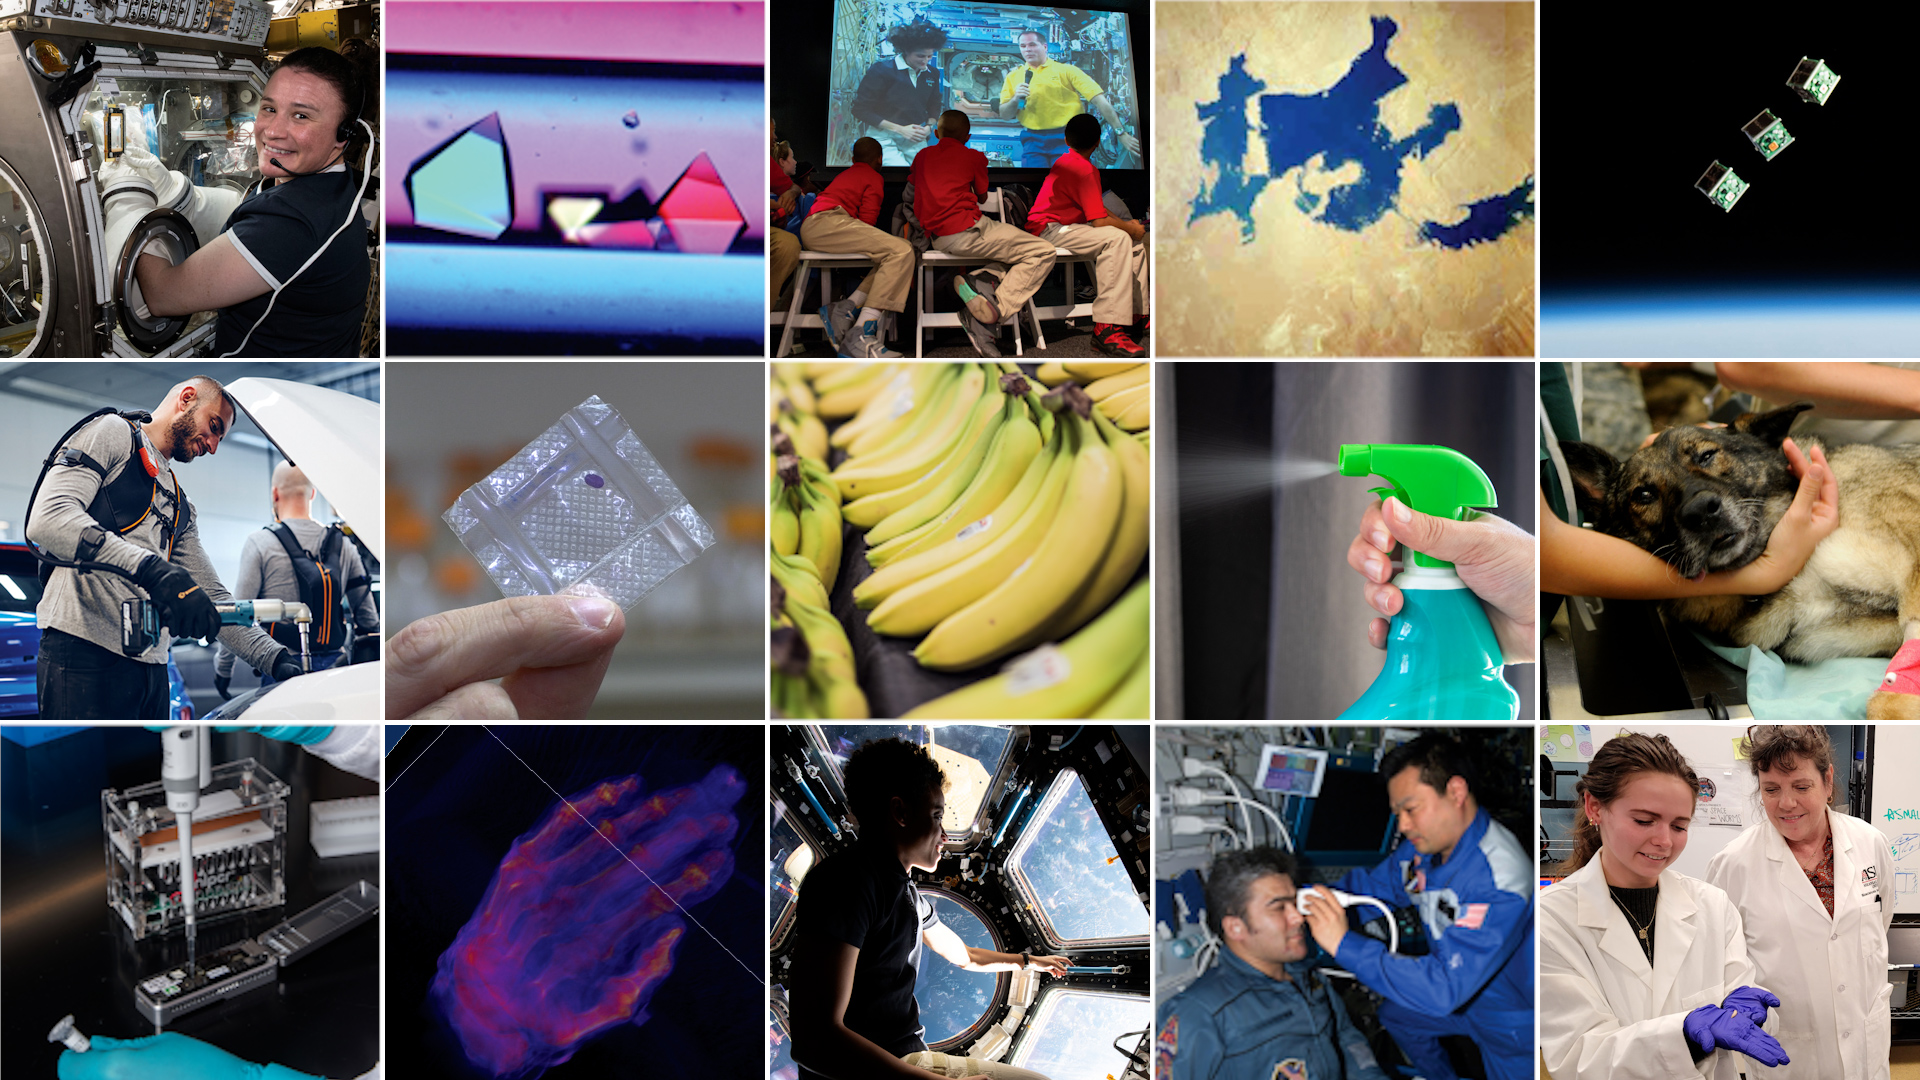
Innovations include:
- Advances in X-ray technologies, developed to create a space station telescope, are helping unravel the mysteries of our universe while improving medical devices on Earth.
- Temperature-change data that has been employed in efforts to reduce heat absorbed by city surfaces, reduce fire risk, and help farmers efficiently water their fields.
- Demonstrations of robotic technologies with the potential to relieve repetitive movement and other workplace-related stressors.
- Development of a small ultrasound unit for crew health monitoring that has since been adapted to provide diagnostic care in remote areas on Earth.
Find more information about the space station’s benefits for humanity here.
Explore More 1 min read NASA Starts Up Gateway’s Power System for First Time Article 4 hours ago 4 min read NASA Celebrates Artemis II During Houston Texans Space City Day Article 22 hours ago 4 min read Supernova Remnant Video From NASA’s Chandra Is Decades in Making Article 2 days ago25 Years in Orbit: Science, Innovation, and the Future of Exploration
NASA and its partners have supported humans continuously living and working in space since November 2000. A truly global endeavor, the International Space Station has been visited by more than 290 people from 26 countries and a variety of international and commercial spacecraft. The unique microgravity laboratory has hosted more than 4,000 experiments from over 5,000 researchers from 110 countries. The space station also is facilitating the growth of a commercial market in low Earth orbit for research, technology development, and crew and cargo transportation.
After a quarter of century of human presence in orbit, the station remains a symbol of international cooperation and a proving ground for humanity’s next giant leaps to the Moon and, eventually, Mars.
September’s full Moon, the Harvest Moon, is photographed from the space station, placed in between exterior station hardware.NASAThe microgravity environments aboard the space station unlocks discoveries that benefit life on Earth and prepare humans for deep space missions. NASA’s Human Research Program (HRP) works to understand the changes astronauts face aboard the orbital outpost and to develop interventions to keep crews healthy before, during, and after flight.
Astronauts aboard the station exercise for roughly two hours a day to protect bone density, muscle strength, and the cardiovascular system, but the longer they are in microgravity, the harder it can be for the brain and body to readapt to gravity’s pull. After months in orbit, returning astronauts often describe Earth as heavy, loud, and strangely still. Some reacclimate within days, while other astronauts take longer to fully recover.
Through HRP-led studies, scientists track these changes and test solutions—from improved exercise regimens to medical monitoring and nutritional strategies. The results inspire new medical technologies, while teaching scientists how the human body adapts to long-duration spaceflights—knowledge that helps keep astronauts healthy on future missions.
In the Tranquility node of the orbiting laboratory, NASA astronaut Jessica Meir exercises on the Combined Operational Load Bearing External Resistance Treadmill (COLBERT), technically named the Treadmill 2 and abbreviated as T2. NASAThe space station continues to be a critical platform for sharpening skills, technology, and understanding that will prepare humanity to return to the Moon with NASA’s Artemis campaign and journey on to Mars and beyond.
Since space presents an entirely new physical environment with a distinct set of challenges, the orbiting laboratory is uniquely positioned to support research and preparations not possible on Earth. That includes:
- Mastering techniques for basic tasks like drinking water, sleeping, exercising, and handling various materials.
- Developing solutions to microgravity-induced changes to and challenges for the human body.
- Testing reliable technologies and self-sustaining ecosystems necessary for deep space travel, from life support systems to in-orbit agriculture and 3D printing of materials.
- Refining techniques and procedures for data and imagery collection and analysis.
Read more about how the space station has enabled significant strides in our journey farther into the final frontier.
The first decade of the space station was the decade of construction. The second decade moved from initial studies to fully using the orbiting laboratory. Now we are in the decade of results.
With nearly 25 years of experiments conducted aboard the station, more breakthroughs are materializing than ever before. These scientific discoveries and technological advancements are benefiting humanity on the ground, contributing to the growing low Earth orbit economy, and helping to prepare for future exploration of the Moon and Mars.
Innovations include:
- Advances in X-ray technologies, developed to create a space station telescope, are helping unravel the mysteries of our universe while improving medical devices on Earth.
- Temperature-change data that has been employed in efforts to reduce heat absorbed by city surfaces, reduce fire risk, and help farmers efficiently water their fields.
- Demonstrations of robotic technologies with the potential to relieve repetitive movement and other workplace-related stressors.
- Development of a small ultrasound unit for crew health monitoring that has since been adapted to provide diagnostic care in remote areas on Earth.
Find more information about the space station’s benefits for humanity here.
Explore More 1 min read NASA Starts Up Gateway’s Power System for First Time Article 12 hours ago 4 min read NASA Celebrates Artemis II During Houston Texans Space City Day Article 1 day ago 4 min read Supernova Remnant Video From NASA’s Chandra Is Decades in Making Article 2 days agoLightning from Above
Lightning from Above
NASA astronaut Nichole Ayers captured this image of lightning while orbiting aboard the International Space Station more than 250 miles above Milan, Italy on July 1, 2025. Storm observations from space station help scientists study Earth’s upper atmosphere, which can improve weather models and protect communication systems and aircraft. Space station crew take photographs of Earth that record how the planet changes over time due to human activity and natural events. This record allows scientists to monitor disasters and direct response on the ground and study phenomena.
Image credit: NASA/Nichole Ayers
Algae Swirls Across a South African Reservoir
- Earth
- Earth Observatory
- Image of the Day
- EO Explorer
- Topics
- More Content
- About