
NASA News
Student Art Murals at Johnson Celebrate 25 Years of Humanity in Space
Select walls at NASA’s Johnson Space Center have been transformed into works of art. Each piece reflects creativity, collaboration, and the spirit of discovery. Painted by Texas students, the murals honor the legacy of the International Space Station and 25 years of continuous human presence in space.
The International Space Station Program Mural Project began in 2022 as part of a broader effort to bring color and inspiration into the workplace while connecting classrooms to NASA’s mission.
“Dream Big,” created by Texas City High School students with the International Space Station Program Mission and Program Integration team in 2025, symbolizes imagination becoming exploration.“The mural collection is a reminder that today’s dreams can be tomorrow’s realities,” said Space Operations Mission Directorate Deputy Associate Administrator Joel Montalbano. “The future of space exploration depends on the imagination of our students.”
As NASA prepares for the next giant leap through Artemis, the art on the walls serves as a reminder that every mission begins with creativity and courage. This initiative continues to inspire the next generation to Dare | Unite | Explore. While art allows for interpretation, each mural required careful planning, communication, and problem-solving, just like the work behind human spaceflight.
The most recent mural, “Dream Big,” was installed in the hallway leading to the International Space Station Program suite on the fifth floor of building 1. Created by Texas City High School students with the International Space Station Program Mission Integration and Operations team, the artwork shows a grayscale child pulling back a curtain to reveal rockets, astronauts, and bright planetary landscapes.
The mural’s design draws from both classic and modern art influences. The students were inspired by Van Gogh’s impressionistic style and Banksy’s Behind the Curtain, combining movement and curiosity to reflect how imagination can open the door to exploration.
“The National Art Honor Society was honored to take on this inspiring project,” said Texas City High School art teacher Jennifer Massie. “They chose ‘Where Creativity Meets Reality’ to show how a child’s creative mind keeps moving and evolving—and that with big dreams and hard work, kids can follow in their heroes’ footsteps.”
What started as an idea between Gary Johnson, technical manager in the International Space Station Mission Integration and Operations Office, and Raul Tijerina, then the program’s building graphics lead, has grown into a gallery-sized initiative that bridges science and creativity.
“We want students to have the unique opportunity to contribute to NASA’s legacy through their artwork,” Johnson said. “These murals show that every mission begins with imagination and that the next generation of explorers is already helping paint humanity’s future among the stars.”
“Dream Explore Discover” was the first art mural created by Friendswood High School students in 2022.NASA/Bill StaffordTwo murals are now housed in the hallway of the Neutral Buoyancy Laboratory’s International Space Development Integration Laboratory, known as the SDIL. The first, “Dream Explore Discover,” created by Friendswood High School students, was originally displayed in building 4 south. Under the guidance of art teacher Mandy Harris, more than 30 students designed and painted the 8-by-18-foot mural, starting with sketches and brainstorming sessions that considered how art could reflect human space exploration. The students combined their ideas into a single design celebrating the beauty and excitement of discovery.
Elements of the mural include an astronaut’s visor reflecting the Houston skyline, zinnias symbolizing life and science connecting beyond Earth, and a small floating teddy bear representing both the dreams of children who look up to the stars and the generations of explorers who carried small tokens of home into space. It serves as a reminder of the human heart behind every mission.
The mural also features the launch of NASA’s SLS (Space Launch System) rocket with NASA’s Orion spacecraft riding on top, heading for the next giant leap in exploration. Beside the capsule, the Orion constellation appears in the sky, symbolizing how the stars continue to guide humanity’s journey to the Moon, Mars, and beyond.
“The Moon Now,” created by La Marque High School students, depicts two astronauts on the lunar surface in Axiom spacesuits with mirrored visors.“The Moon Now,” created by students from La Marque High School, Blocker Middle School, and Giles Middle School, is also housed at the SDIL. The artwork depicts two astronauts on the lunar surface wearing Axiom spacesuits with mirrored visors that reflect the faces of the next generation who will carry humanity back to the Moon. Individual student artworks of the Milky Way and celestial objects were collaged into the final piece, creating a tapestry of imagination and exploration.
Dickinson High School’s “A Starry Night” reimagines classic artistry through the lens of modern spaceflight.NASA/Josh ValcarcelThe remaining murals are installed in building 4 south at Johnson. In 2023, the program expanded to include Dickinson High School, whose students created “A Starry Night,” a blend of Renaissance-style painting and modern space imagery. “Everyone wanted to be involved,” said art teacher Jennifer Sumrall. “The kids loved it and did their own research on how each of NASA’s missions impacts the world.”
“Absolute Equality: Breaking Boundaries” by Reginald C. Adams, symbolizes unity and humanity’s collective future in space exploration.“Absolute Equality: Breaking Boundaries” by Houston artist Reginald C. Adams symbolizes unity and humanity’s shared future in space exploration. Two figures share a single helmet. Patterns inspired by circuitry surround the faces and suggest the role of technology in connecting people around the world and beyond it.
La Marque High School students, art teacher Joan Finn, and artist Cheryl Evans painted “Collaboration” to illustrate the interconnected roles in space exploration.“Collaboration” was painted by La Marque High School students with art teacher Joan Finn and artist Cheryl Evans to depict the interconnected roles of visionaries, engineers, artists, and astronauts in exploration. Built from 10 stretched canvases bolted together — a nod to the station’s assembly across more than 40 missions — the mural includes the space station patch at the bottom to represent the collaboration of the 15 countries involved.
NASA Johnson thanks Joel Montalbano, who championed student engagement that connects classrooms to mission work during his tenure as International Space Station Program manager. The center also acknowledges Gary Johnson for conceiving the mural project and guiding its partnerships, Raul Tijerina for early design leadership that set the standard, Gordon Andrews for opening doors through behind-the-scenes tours, and art educators for mentoring the students who brought each mural to life.
Explore More 5 min read NASA Astronaut Jonny Kim Advances Research Aboard Space Station Article 22 hours ago 8 min read Sugars, ‘Gum,’ Stardust Found in NASA’s Asteroid Bennu Samples Article 2 days ago 6 min read The International Space Station Marks 25 Years of Continuous Human Presence Article 2 days agoNASA Rover Detects Electric Sparks in Mars Dust Devils, Storms
To view this video please enable JavaScript, and consider upgrading to a web browser that supports HTML5 video
Three Martian dust devils can be seen near the rim of Jezero Crater in this short video made of images taken by a navigation camera aboard NASA’s Perseverance rover on Sept. 6, 2025. The microphone on the rover’s SuperCam previously captured audio when a dust devil passed over.NASA/JPL-Caltech/SSIPerseverance confirmed a long-suspected phenomenon in which electrical discharges and their associated shock waves can be born within Red Planet mini-twisters.
NASA’s Perseverance Mars rover has recorded the sounds of electrical discharges —sparks — and mini-sonic booms in dust devils on Mars. Long theorized, the phenomenon has now been confirmed through audio and electromagnetic recordings captured by the rover’s SuperCam microphone. The discovery, published Nov. 26 in the journal Nature, has implications for Martian atmospheric chemistry, climate, and habitability, and could help inform the design of future robotic and human missions to Mars.
A frequent occurrence on the Red Planet, dust devils form from rising and rotating columns of warm air. Air near the planet’s surface becomes heated by contact with the warmer ground and rises through the denser, cooler air above. As other air moves along the surface to take the place of the rising warmer air, it begins to rotate. When the incoming air rises into the column, it picks up speed like spinning ice skaters bringing their arms closer to their body. The air rushing in also picks up dust, and a dust devil is born.
SuperCam has recorded 55 distinct electrical events over the course of the mission, beginning on the mission’s 215thMartian day, or sol, in 2021. Sixteen have been recorded when dust devils passed directly over the rover.
Decades before Perseverance landed, scientists theorized that the friction generated by tiny dust grains swirling and rubbing against each other in Martian dust devils could generate enough of an electrical charge to eventually produce electrical arcs. Called the triboelectric effect, it’s the phenomenon at play when someone walks over a carpet in socks and then touches a metal doorknob, generating a spark. In fact, that is about the same level of discharge as what a Martian dust devil might produce.
“Triboelectric charging of sand and snow particles is well documented on Earth, particularly in desert regions, but it rarely results in actual electrical discharges,” said Baptiste Chide, a member of the Perseverance science team and a planetary scientist at L’Institut de Recherche en Astrophysique et Planétologie in France. “On Mars, the thin atmosphere makes the phenomenon far more likely, as the amount of charge required to generate sparks is much lower than what is required in Earth’s near-surface atmosphere.”
Perseverance’s SuperCam instrument carries a microphone to analyze the sounds of the instrument’s laser when it zaps rocks, but the team has also captured the sounds of wind and even the first audio recording of a Martian dust devil. Scientists knew it could pick up electromagnetic disturbance (static) and sounds of electrical discharges in the atmosphere. What they didn’t know was if such events happened frequently enough, or if the rover would ever be close enough, to record one. Then they began to assess data amassed over the mission, and it didn’t take long to find the telltale sounds of electrical activity.
The SuperCam microphone on NASA’s Perseverance captured this recording of the sounds of electrical discharge as a dust devil passed over the Mars rover on Oct. 12, 2024. The three crackles can be heard in between the sounds of the dust devil’s front and trailing walls.Credit: NASA/JPL-Caltech/LANL/CNES/CNRS/ISAE-Supaero Crackle, pop
“We got some good ones where you can clearly hear the ‘snap’ sound of the spark,” said coauthor Ralph Lorenz, a Perseverance scientist at the Johns Hopkins Applied Physics Lab in Laurel, Maryland. “In the Sol 215 dust devil recording, you can hear not only the electrical sound, but also the wall of the dust devil moving over the rover. And in the Sol 1,296 dust devil, you hear all that plus some of the particles impacting the microphone.”
Thirty-five other discharges were associated with the passage of convective fronts during regional dust storms. These fronts feature intense turbulence that favor triboelectric charging and charge separation, which occurs when two objects touch, transfer electrons, and separate — the part of the triboelectric effect that results in a spark of static electricity.
Researchers found electrical discharges did not seem to increase during the seasons when dust storms, which globally increase the presence of atmospheric dust, are more common on Mars. This result suggests that electrical buildup is more closely tied to the localized, turbulent lifting of sand and dust rather than high dust density alone.
While exploring the rim of Jezero Crater on Mars, NASA’s Perseverance rover captured new images of multiple dust devils in January 2025. These captivating phenomena have been documented for decades by the agency’s Red Planet robotic explorers.Credit: NASA/JPL-Caltech/LANL/CNES/CNRS/INTA-CSIC/Space Science Institute/ISAE-Supaero/University of Arizona Profound effects
The proof of these electrical discharges is a discovery that dramatically changes our understanding of Mars. Their presence means that the Martian atmosphere can become sufficiently charged to activate chemical reactions, leading to the creation of highly oxidizing compounds, such as chlorates and perchlorates. These strong substances can effectively destroy organic molecules (which constitute some of the components of life) on the surface and break down many atmospheric compounds, completely altering the overall chemical balance of the Martian atmosphere.
This discovery could also explain the puzzling ability of Martian methane to vanish rapidly, offering a crucial piece of the puzzle for understanding the constraints life may have faced and, therefore, the planet’s potential to be habitable.
Given the omnipresence of dust on Mars, the presence of electrical charges generated by particles rubbing together would seem likely to influence dust transport on Mars as well. How dust travels on Mars plays a central role in the planet’s climate but remains poorly understood.
Confirming the presence of electrostatic discharges will also help NASA understand potential risks to the electronic equipment of current robotic missions. That no adverse electrostatic discharge effects have been reported in several decades of Mars surface operations may attest to careful spacecraft grounding practices. The findings could also inform safety measures developed for future astronauts exploring the Red Planet.
More about PerseveranceManaged for NASA by Caltech, the Jet Propulsion Laboratory in Southern California built and manages operations of the Perseverance rover on behalf of the agency’s Science Mission Directorate as part of NASA’s Mars Exploration Program portfolio.
To learn more about Perseverance visit:
https://science.nasa.gov/mission/mars-2020-perseverance
DC Agle
Jet Propulsion Laboratory, Pasadena, Calif.
818-393-9011
agle@jpl.nasa.gov
Karen Fox / Molly Wasser
NASA Headquarters, Washington
202-358-1600 / 240-419-1732
karen.c.fox@nasa.gov / molly.l.wasser@nasa.gov
2025-132
Share Details Last Updated Dec 03, 2025 Related Terms Explore More 6 min read NASA Tests Drones in Death Valley, Preps for Martian Sands and Skies Article 1 day ago 5 min read NASA Orbiter Shines New Light on Long-Running Martian Mystery Article 1 week ago 6 min read NASA’s Mars Spacecraft Capture Images of Comet 3I/ATLAS Article 2 weeks ago Keep Exploring Discover Related Topics Mars ExplorationMars is the only planet we know of inhabited entirely by robots. Learn more about the Mars Missions.
Mars Reconnaissance OrbiterNASA’s Mars Reconnaissance Orbiter (MRO) is the second longest-lived spacecraft to orbit Mars, after 2001 Mars Odyssey.
MRO ScienceOverview Among other ongoing achievements, data collected by Mars Reconnaissance Orbiter continues to help Mars scientists and engineers characterize potential…
Mars ExpressNASA Participation In partnership with their European colleagues, U.S. scientists are participating in the scientific instrument teams of the Mars…
Hubble Seeks Clusters in ‘Lost Galaxy’
This NASA/ESA Hubble Space Telescope image features the spiral galaxy NGC 4535, which is situated about 50 million light-years away in the constellation Virgo (the Maiden). Through a small telescope, this galaxy appears extremely faint, giving it the nickname ‘Lost Galaxy’. With a mirror spanning nearly eight feet (2.4 meters) across and its location above Earth’s light-obscuring atmosphere, Hubble can easily observe dim galaxies like NGC 4535 and pick out features like its massive spiral arms and central bar of stars.
This image features NGC 4535’s young star clusters, which dot the galaxy’s spiral arms. Glowing-pink clouds surround many of these bright-blue star groupings. These clouds, called H II (‘H-two’) regions, are a sign that the galaxy is home to especially young, hot, and massive stars that blaze with high-energy radiation. Such massive stars shake up their surroundings by heating their birth clouds with powerful stellar winds, eventually exploding as supernovae.
The image incorporates data from an observing program designed to catalog roughly 50,000 H II regions in nearby star-forming galaxies like NGC 4535. Hubble released a previous image of NGC 4535 in 2021. Both the 2021 image and this new image incorporate observations from the PHANGS observing program, which seeks to understand the connections between young stars and cold gas. Today’s image adds a new dimension to our understanding of NGC 4535 by capturing the brilliant red glow of the nebulae that encircle massive stars in their first few million years of life.
Image credit: ESA/Hubble & NASA, F. Belfiore, J. Lee and the PHANGS-HST Team
Hazardous Material Summary Tables (HMSTs)
3 min read
Preparations for Next Moonwalk Simulations Underway (and Underwater) A space toxicologist at NASA JSC.NASAHazardous Materials Summary Tables (HMSTs) are a compilation of the chemical, biological, and flammability hazards of materials on a given flight or mission. HMSTs are required by Safety for all Programs, including but not limited to ISS, Commercial Crew Program (CCP), Multi Purpose Crew Vehicle (MPCV), and Gateway. Johnson Space Center (JSC) toxicologists evaluate the toxic hazard level of all liquids, gases, particles, or gels flown on or to any manned U.S. spacecraft. The biosafety hazard level and flammability levels are assigned by JSC microbiologists and materials experts and are documented in an HMST and in a computerized in-flight version of the HMST called the HazMat (Hazardous Materials) database.
How To Obtain Toxicological Hazard Assessments“Requirements for Submission of Data Needed for Toxicological Assessment of Chemical and Biologicals to be Flown on Manned Spacecraft”
- JSC 27472 (PDF, 766KB) defines the terms “chemicals” and “biological materials” as applied to items being flown on or to any U.S. spacecraft. It explains who must submit information to the JSC toxicologists concerning the materials to be flown and specifies what information is needed. It provides schedules, formats, and contact information.
- Additional US requirements for biological materials can be found on the Biosafety Review Board (BRB) page.
- Additional US requirements for environmental control and life support (ECLS) assessments can be found in JSC 66869 (PDF, 698KB).
For all flights to ISS and all Artemis requests (Orion, Gateway, Human Lander System (HLS)), please submit data via the electronic hazardous materials summary table (eHMST) tool. If you do not have access to this tool, please submit a NAMS request for access to JSC – CMC External Tools. Please reference eHMST training for more information
NOTE: For experimental payloads/hardware planned for launch on a Russian vehicle, stowed and/or operated on the Russian Segment of ISS, or planned for return or disposal on a Russian vehicle, we strongly encourage payload providers to submit biological and chemical data to the Russian Institute for Biomedical Problems (moukhamedieva@imbp.ru OR barantseva@imbp.ru).
Hazard AssessmentsToxicological hazard assessments are conducted according to JSC 26895 – Guidelines for Assessing the Toxic Hazard of Spacecraft Chemicals and Test Materials. The resulting Toxicity Hazard Level (THL) in combination with the BioSafety Level (BSL) and Flammability Hazard Level (FHL) form the basis for the combined Hazard Response Level (HRL) used for labeling and operational response per flight rule B20-16.
Toxicology and Environmental Chemistry Share Details Last Updated Dec 03, 2025 EditorRobert E. LewisLocationJohnson Space Center Related Terms Explore More 5 min read Toxicology and Environmental Chemistry Article 3 years ago 3 min read Exposure Guidelines (SMACs and SWEGs) Article 3 years ago 4 min read Toxicology Analysis of Spacecraft Air Article 14 hours ago Keep Exploring Discover Related TopicsMissions
Humans in Space
Climate Change
Solar System
Toxicology Analysis of Spacecraft Air
4 min read
Preparations for Next Moonwalk Simulations Underway (and Underwater) SpaceX Crew-1 Pilot Victor Glover and Mission Specialist Shannon Walker work with a Grab Sample Container (GSC) in the SpaceX Crew Dragon Resilience spacecraft while en route to the ISS.NASAToxicology and Environmental Chemistry (TEC) monitors airborne contaminants in both spacecraft air and water. In-flight monitors are employed to provide real-time insight into the environmental conditions on ISS. Archival samples are collected and returned to Earth for full characterization of ISS air and water.
Real-time in-flight air analytical instruments include the Air Quality Monitors (AQM), carbon dioxide (CO2 monitors), and a compound specific analyzer for combustion products (CSA-CP). Real-time in-flight water monitoring capabilities include the colorimetric water quality monitoring kit (CWQMK) and the ISS total organic carbon analyzer (TOCA).
Post-flight analyses are performed on archival samples of spacecraft air and water obtained at specific times and locations during a mission. Air archival samples are collected using “grab sample containers” (GSC) and formaldehyde badges. The U.S. and Russian water recovery systems on the ISS process atmospheric moisture (U.S. and Russian systems) and urine distillate (U.S. system only) into clean, potable water for the crew to use. The Water Kit is utilized to collect archival samples of the potable water and are routinely returned to the ground to monitor the quality of the water produced by the systems. Samples of condensate and wastewater are also collected and returned to check for the presence of contaminants that could break through the water recovery systems.
Results of Post-Flight Analysis of In-Flight Air Samples (Most Recent First)- Increment 71 Report Including NG-21 Ingress and Boeing-CFT Ascent (1MB)
- Increment 69 Report Including Ax2 SpX28 NG19 Ingress (1MB)
- Increment 68 Report NG18 SpX26 SpX27 Ingress (845KB)
- Increment 65 Report with SpX22, MLM, NG16, SpX23 Ingresses (1.5MB)
- Increment 67 Report with OFT2 and SpX25 Ingress (962KB)
- Increment 66 Report SpX-24 NG-17 Ingress (835KB)
- Increment 64 including SpX-21 and NG-15 Ingress (897KB)
- Increment 63 Including HTV-9 and NG-14 Ingress (884KB)
- Increment 62-63 Benzene Anomaly Report (442KB)
- Increment 62 Including NG-13 and SpX-20 Ingress (747KB)
- Increment 61 including NG-12 and SpX-19 Egress (1.1MB)
- Increment 60 including SpX-18 and HTV8 Ingress (1.27MB)
- Increment 59 including NG-11 and SpX-17 Ingress (3.4MB)
- Increment 58 Report (2.78MB)
- Increment 57 including NG-10 and SpX-16 Ingress (2.71MB)
- SpaceX Demo-1 Ingress SM and DM1 Contingencies (792KB)
- Increment 56, HTV-7 and Node 1 Contingency Report (3.5MB)
- Increment 55 and SpX14 and OA9 Ingresses Report (1.9MB)
- Increment 54, including SpX-13 Ingress (877KB)
- Increment 53, including OA-8 Ingress and Node 1 Contingency Investigation (743KB)
- Increment 52 Report, including JEM odor contingency, SpX-11 and SpX-12 ingress, and WPA MF bed contingency samples
- Increment 51 and OA-7 Ingress Report (1.47MB)
- Increment 50 and HTV-6, SpX-10 Ingresses (2.72 MB)
- Increment 49 OA-5 Ingress and Oil Paint Odor Investigation Report (3.12MB)
- Increment 48, SpX-9 Ingress, and Oil Paint Odor Investigation Report (3.43MB)
- Increment 47, BEAM/OA-6/SpX-8 Ingresses, and Node 3 Siloxane Investigation Report (4.82MB)
- Increment 46 and Node 3 Contingency Report (4.4MB)
- Increment 45 and OA-4 Ingress (3MB)
- Increment 44 and HTV-5 Ingress Report (1.6MB)
- Increment 43, SpX-6 Ingress, Ethanol Investigation, and Node 1 Contingency Report (6.2MB)
- Increment 42 Report (4MB)
- Increment 41 Report (3.3MB)
- Space X-5 First Ingress Air Quality and Node 3 Contingency Report (2MB)
- SpaceX-4 First Ingress Air Quality Report (1.32MB)
- Increment 40, Orb-2/ATV-5 Ingresses, and SM Contingency (2.92 MB)
- Increment 39 and SpX-3 Ingress (5.75 MB)
- Increment 38 and Orb-1 Ingress (8.02 MB)
- Increment 37 and Orb-D1 Ingress (5.9 MB)
- Increment 36 and HTV-4 Ingress (7.22 MB)
- Increment 35 Report (4.04 MB)
- Increment 34 Report (5.64 MB)
- Feb. 2013 Contingency Sample Report (1.91 MB)
- Space X-2 First Entry Sample Analyses (1.56 MB)
- Soyuz 31S Return Samples (2.98 MB)
- Space X-1 First Entry Sample Analysis (39 KB)
- Revised Soyuz 30 Return Samples (7.46 MB)
- Space X-Demo First Entry Sample Analysis (767 KB)
- Soyuz 28 and Soyuz 29 Return Samples (1 MB)
- Soyuz 27 Return Samples (824 KB)
- STS-134, ULF7, 26S (2 MB)
- STS-133 / ISS-ULF5 (396 KB)
- Soyuz 25S Mission Report (286 KB)
- Soyuz 24S Return Samples of ISS Air (740 KB)
- Soyuz 23S Return Samples (593 KB)
- STS-132 / ISS-ULF4 (1.31 MB)
- STS-131 / ISS-19A (3.55 MB)
- STS-130 / ISS-20A (1.27 MB)
- STS-129 / ISS-ULF3 (1.4 MB)
Missions
Humans in Space
Climate Change
Solar System
NASA Astronaut Jonny Kim Advances Research Aboard Space Station
5 min read
Preparations for Next Moonwalk Simulations Underway (and Underwater) NASA astronaut Jonny Kim floats inside the Cupola of the International Space Station.NASANASA astronaut Jonny Kim is wrapping up his first mission aboard the International Space Station in early December. During his stay, Kim conducted scientific experiments and technology demonstrations to benefit humanity on Earth and advance NASA’s Artemis campaign in preparation for future human missions to Mars.
Here is a look at some of the science Kim completed during his mission:
Medical check-ups in microgravity NASANASA astronaut Jonny Kim, a medical doctor, completed several routine medical exams while aboard the International Space Station. NASA flight surgeons and researchers monitor crew health using a variety of tools, including blood tests, eye exams, and ultrasounds.
Kim conducts an ultrasound of his eye in the left image. Eye exams are essential as long-duration spaceflight may cause changes to the eye’s structure and affect vision, a condition known as spaceflight associated neuro-ocular syndrome, or SANS. In the right image, Kim draws blood from a fellow crew member. These blood sample collections provide important insights into crew cartilage and bone health, cardiovascular function, inflammation, stress, immune function, and nutritional status.
NASA astronauts complete regular medical exams before, during, and after spaceflight to monitor astronaut health and develop better tools and measures for future human exploration missions to the Moon and Mars.
Learn more about human research on space station.
Low light plant growth NASA NASANASA astronaut Jonny Kim photographs dwarf tomato sprouts grown using a nutrient supplement instead of photosynthesis as part of a study on plant development and gene expression. The plants are given an acetate supplement as a secondary nutrition source, which could increase growth and result in better yields, all while using less power and fewer resources aboard the space station and future spacecraft.
Learn more about Rhodium USAFA NIGHT.
Radioing future space explorers NASANASA astronaut Jonny Kim uses a ham radio to speak with students on Earth via an educational program connecting students worldwide with astronauts aboard the International Space Station. Students can ask about life aboard the orbiting laboratory and the many experiments conducted in microgravity. This program encourages an interest in STEM (science, technology, engineering, and mathematics) and inspires the next generation of space explorers.
Learn more about ISS Ham Radio.
Encoding DNA with data NASASecure and reliable data storage and transmission are essential to maintain the protection, accuracy, and accessibility of information. In this photo, NASA astronaut Jonny Kim displays research hardware that tests the viability of encoding, transmitting, and decoding encrypted information via DNA sequences. As part of this experiment, DNA with encrypted information is sequenced aboard the space station to determine the impact of the space environment on its stability. Using DNA to store and transmit data could reduce the weight and energy requirements compared to traditional methods used for long-duration space missions and Earth-based industries.
Learn more about Voyager DNA Decryption.
Remote robotics NASAFuture deep space exploration could rely on robotics remotely operated by humans. NASA astronaut Jonny Kim tests a technology demonstration that allows astronauts to remotely control robots on Earth from the International Space Station. Findings from this investigation could help fine-tune user-robot operating dynamics during future missions to the Moon, Mars, and beyond.
Learn more about Surface Avatar.
Blocking bone loss NASANASA astronaut Jonny Kim conducts an investigation to assess the effects of microgravity on bone marrow stem cells, including their ability to secrete proteins that form and dissolve bone. Bone loss, an age-related factor on Earth, is aggravated by weightlessness and is a health concern for astronauts. Researchers are evaluating whether blocking signals that cause loss could protect astronauts during long-duration spaceflights. The findings could also lead to preventative measures and treatments for bone loss caused by aging or disease on Earth.
Learn more about MABL-B.
Upscaling production NASANASA astronaut Jonny Kim tests new hardware installed to an existing crystallization facility that enables increased production of crystals and other commercially relevant materials, like golden nanospheres. These tiny, spherical gold particles have optical and electronic applications, and are biocompatible, making them useful for medication delivery and diagnostics. As part of this experiment aboard the space station, Kim attempted to process larger, more uniform golden nanospheres than those produced on the ground.
Learn more about ADSEP-ICC.
Nutrients on demand NASASome vitamins and nutrients in foods and supplements lose their potency during long-term storage, and insufficient intake of even a single nutrient can lead to diseases and other health issues. NASA astronaut Jonny Kim displays purple-pink production bags for an investigation aimed at producing nutrient-rich yogurt and kefir using bioengineered yeasts and probiotics. The unique color comes from a food-grade pH indicator that allows astronauts to visually monitor the fermentation process.
Learn more about BioNutrients-3.
Next-Gen medicine and manufacturing NASANASA astronaut Jonny Kim uses the Microgravity Science Glovebox to study how high-concentration protein fluids behave in microgravity. This study helps researchers develop more accurate models to predict the behavior of these complex fluids in various scenarios, which advances manufacturing processes in space and on Earth. It also can enable the development of next-generation medicines for treating cancers and other diseases.
Learn more about Ring Sheared Drop-IBP-2.
Observing colossal Earth events NASAOn Sept. 28, 2025, NASA astronaut Jonny Kim photographed Hurricane Humberto from the International Space Station. Located at 250 miles above Earth, the orbiting laboratory’s unique orbit allows crew members to photograph the planet’s surface including hurricanes, dust storms, and fires. These images are used to document disasters and support first responders on the ground.
Learn more about observing Earth from space station.
Keep Exploring Discover More Topics From NASALatest News from Space Station Research
Space Station Research Results
Humans In Space
International Space Station
Explore More 5 min read Student Art Murals at Johnson Celebrate 25 Years of Humanity in Space Article 10 hours ago 8 min read Sugars, ‘Gum,’ Stardust Found in NASA’s Asteroid Bennu Samples Article 2 days ago 6 min read The International Space Station Marks 25 Years of Continuous Human Presence Article 2 days agoNASA Awards Lunar Freezer System Contract
NASA has selected the University of Alabama at Birmingham to provide the necessary systems required to return temperature sensitive science payloads to Earth from the Moon.
The Lunar Freezer System contract is an indefinite-delivery/indefinite-quantity award with cost-plus-fixed-fee delivery orders. The contract begins Thursday, Dec. 4, with a 66-month base period along with two optional periods that could extend the award through June 3, 2033. The contract has a total estimated value of $37 million.
Under the contract, the awardee will be responsible for providing safe, reliable, and cost-effective hardware and software systems NASA needs to maintain temperature-critical science materials, including lunar geological samples, human research samples, and biological experimentation samples, as they travel aboard Artemis spacecraft to Earth from the lunar surface. The awarded contractor was selected after a thorough evaluation by NASA engineers of the proposals submitted. NASA’s source selection authority made the selection after reviewing the evaluation material based on the evaluation criteria contained in the request for proposals.
For information about NASA and other agency programs, visit:
-end-
Tiernan Doyle
Headquarters, Washington
202-358-1600
tiernan.doyle@nasa.gov
NASA’s Fly Foundational Robots Demo to Bolster In-Space Infrastructure
NASA and industry partners will fly and operate a commercial robotic arm in low Earth orbit through the Fly Foundational Robots mission set to launch in late 2027. This mission aims to revolutionize in-space operations, a critical capability for sustainably living and working on other planets. By enabling this technology demonstration, NASA is fostering the in-space robotics industry to unlock valuable tools for future scientific discovery and exploration missions.
“Today it’s a robotic arm demonstration, but one day these same technologies could be assembling solar arrays, refueling satellites, constructing lunar habitats, or manufacturing products that benefit life on Earth,” said Bo Naasz, senior technical lead for In-space Servicing, Assembly, and Manufacturing (ISAM) in the Space Technology Mission Directorate at NASA Headquarters in Washington. “This is how we build a dominant space economy and sustained human presence on the Moon and Mars.”
Artist concept of the FFR Mission’s robotic system payload atop the Astro Digital spacecraft. The robotic arm, provided by Motiv Space Systems, will perform robotic demonstrations in orbit.Motiv Space SystemsThe Fly Foundational Robots (FFR) mission will leverage a robotic arm from small business Motiv Space Systems capable of dexterous manipulation, autonomous tool use, and walking across spacecraft structures in zero or partial gravity. This mission could enable ways to repair and refuel spacecraft, construct habitats and infrastructure in space, maintain life support systems on lunar and Martian surfaces, and serve as robotic assistants to astronauts during extended missions. Advancing robotic systems in space could also enhance our understanding of similar technologies on Earth across industries including construction, medicine, and transportation.
To demonstrate FFR’s commercial robotic arm in space, NASA’s Space Technology Mission Directorate is contracting with Astro Digital to provide a hosted orbital test through the agency’s Flight Opportunities program.
Guest roboticists will have the opportunity to contribute to the FFR mission, and participation will allow them to use Motiv’s robotic platform as a testbed and perform unique tasks. NASA will serve as the inaugural guest operator and is currently seeking other interested U.S. partners to participate.
The future of in-space robotics relies on testing robotic operations in space prior to launching more complex and extensive servicing and refueling missions. Through FFR, the demonstration of Motiv’s robotic arm operations in space will begin to push open the door to endless possibilities.
NASA’s Fly Foundational Robots demonstration is funded through the NASA Space Technology Mission Directorate’s ISAM portfolio and managed by NASA’s Goddard Space Flight Center in Greenbelt, Maryland. Motiv Space Systems of Pasadena, California, will supply the mission’s robotic arm system through a NASA Small Business Innovation Research Phase III award. Astro Digital of Littleton, Colorado, will flight test Motiv’s robotic payload through NASA’s Flight Opportunities program managed by NASA’s Armstrong Flight Research Center in Edwards, California.
Learn more about In-space Servicing, Assembly, and Manufacturing at NASA.
By Colleen Wouters
NASA’s Goddard Space Flight Center, Greenbelt, Md.
Waxing Gibbous Moon
The waxing gibbous moon rises above Earth’s blue atmosphere in this photograph taken from the International Space Station on Oct. 3, 2025, as it orbited 263 miles above a cloudy Atlantic Ocean off the coast of Quebec, Canada.
In our entire solar system, the only object that shines with its own light is the Sun. That light always beams onto Earth and the Moon from the direction of the Sun, illuminating half of our planet in its orbit and reflecting off the surface of the Moon to create moonlight. Sometimes the entire face of the Moon glows brightly. Other times we see only a thin crescent of light. Sometimes the Moon seems to disappear. These shifts are called Moon phases. The waxing gibbous phase comes just before the full moon.
Image credit: NASA
NASA Tests Drones in Death Valley, Preps for Martian Sands and Skies
Next-generation drone flight software is just one of 25 technologies for the Red Planet that the space agency funded for development this year.
When NASA engineers want to test a concept for exploring the Red Planet, they have to find ways to create Mars-like conditions here on Earth. Then they test, tinker, and repeat.
That’s why a team from NASA’s Jet Propulsion Laboratory in Southern California took three research drones to California’s Death Valley National Park and the Mojave Desert earlier this year. They needed barren, featureless desert dunes to hone navigation software. Called Extended Robust Aerial Autonomy, the work is just one of 25 projects funded by the agency’s Mars Exploration Program this past year to push the limits of future technologies. Similar dunes on Mars confused the navigation algorithm of NASA’s Ingenuity Mars Helicopter during several of its last flights, including its 72nd and final flight on the Red Planet.
“Ingenuity was designed to fly over well-textured terrain, estimating its motion by looking at visual features on the ground. But eventually it had to cross over blander areas where this became hard,” said Roland Brockers, a JPL researcher and drone pilot. “We want future vehicles to be more versatile and not have to worry about flying over challenging areas like these sand dunes.”
Whether it’s new navigation software, slope-scaling robotic scouts, or long-distance gliders, the technology being developed by the Mars Exploration Program envisions a future where robots can explore all on their own — or even help astronauts do their work.
Desert dronesNASA scientists and engineers have been going to Death Valley National Park since the 1970s, when the agency was preparing for the first Mars landings with the twin Viking spacecraft. Rubbly volcanic boulders on barren slopes earned one area the name Mars Hill, where much of this research has taken place. Almost half a century later, JPL engineers tested the Perseverance rover’s precision landing system by flying a component of it in a piloted helicopter over the park.
For the drone testing, engineers traveled to the park’s Mars Hill and Mesquite Flats Sand Dunes in late April and early September. The JPL team received only the third-ever license to fly research drones in Death Valley. Temperatures reached as high as 113 degrees Fahrenheit (45 degrees Celsius); gathered beneath a pop-up canopy, team members tracked the progress of their drones on a laptop.
JPL researchers gather under a pop-up tent in Death Valley National Park while monitoring the performance of a research drone equipped with navigation software for Mars.NASA/JPL-CaltechThe test campaign has already resulted in useful findings, including how different camera filters help the drones track the ground and how new algorithms can guide them to safely land in cluttered terrain like Mars Hill’s.
“It’s incredibly exciting to see scientists using Death Valley as a proving ground for space exploration,” said Death Valley National Park Superintendent Mike Reynolds. “It’s a powerful reminder that the park is protected not just for its scenic beauty or recreational opportunities, but as a living laboratory that actively helps us understand desert environments and worlds beyond our own.”
For additional testing during the three-day excursion, the team ventured to the Mojave Desert’s Dumont Dunes. The site of mobility system tests for NASA’s Curiosity rover in 2012, the rippled dunes there offered a variation of the featureless terrain used to test the flight software in Death Valley.
“Field tests give you a much more comprehensive perspective than solely looking at computer models and limited satellite images,” said JPL’s Nathan Williams, a geologist on the team who previously helped operate Ingenuity. “Scientifically interesting features aren’t always located in the most benign places, so we want to be prepared to explore even more challenging terrains than Ingenuity did.”
One of three JPL drones used in recent tests flies over Mars Hill, a region of Death Valley National Park that has been visited by NASA Mars researchers since the 1970s, when the agency was preparing to land the twin Viking spacecraft on the Red Planet.NASA/JPL-Caltech Robot dogsThe California desert isn’t the only field site where Mars technology has been tested this year. In August, researchers from NASA’s Johnson Space Center in Houston ventured to New Mexico’s White Sands National Park, another desert location that has hosted NASA testing for decades.
They were there with a doglike robot called LASSIE-M (Legged Autonomous Surface Science In Analogue Environments for Mars). Motors in the robot’s legs measure physical properties of the surface that, when combined with other data, lets LASSIE-M shift gait as it encounters terrain that is softer, looser, or crustier — variations often indicative of scientifically interesting changes.
The team’s goal is to develop a robot that can scale rocky or sandy terrain — both of which can be hazardous to a rover — as it scouts ahead of humans and robots alike, using instruments to seek out new science.
Wings for MarsAnother Mars Exploration Program concept funded this past year is an autonomous robot that trades the compactness of the Ingenuity helicopter for the range that comes with wings. NASA’s Langley Research Center in Hampton, Virginia, has been developing the Mars Electric Reusable Flyer (MERF), which looks like a single wing with twin propellers that allow it to lift off vertically and hover in the air. (A fuselage and tail would be too heavy for this design.) While the flyer skims the sky at high speeds, instruments on its belly can map the surface.
At its full size, the MERF unfolds to be about as long as a small school bus. Langley engineers have been testing a half-scale prototype, sending it soaring across a field on the Virgina campus to study the design’s aerodynamics and the robot’s lightweight materials, which are critical to flying in Mars’ thin atmosphere.
With other projects focused on new forms of power generation, drills and sampling equipment, and cutting-edge autonomous software, there are many new ways for NASA to explore Mars in the future.
News Media Contacts
Andrew Good
Jet Propulsion Laboratory, Pasadena, Calif.
818-393-2433
andrew.c.good@jpl.nasa.gov
Alise Fisher / Alana Johnson
NASA Headquarters, Washington
202-617-4977 / 202-672-4780
alise.m.fisher@nasa.gov / alana.r.johnson@nasa.gov
2025-131
Share Details Last Updated Dec 02, 2025 Related Terms Explore More 6 min read NASA Rover Detects Electric Sparks in Mars Dust Devils, Storms Article 11 hours ago 5 min read NASA Orbiter Shines New Light on Long-Running Martian Mystery Article 1 week ago 6 min read NASA’s Mars Spacecraft Capture Images of Comet 3I/ATLAS Article 2 weeks ago Keep Exploring Discover Related Topics Mars ExplorationMars is the only planet we know of inhabited entirely by robots. Learn more about the Mars Missions.
Mars Reconnaissance OrbiterNASA’s Mars Reconnaissance Orbiter (MRO) is the second longest-lived spacecraft to orbit Mars, after 2001 Mars Odyssey.
MRO ScienceOverview Among other ongoing achievements, data collected by Mars Reconnaissance Orbiter continues to help Mars scientists and engineers characterize potential…
Mars ExpressNASA Participation In partnership with their European colleagues, U.S. scientists are participating in the scientific instrument teams of the Mars…
NASA’s Moon Rocket Celebrates 250 Years of American Innovation
NASA is marking America’s 250th year with a bold new symbol of the nation’s relentless drive to explore.
The America 250 emblem is now on the twin solid rocket boosters of the SLS (Space Launch System) rocket for Artemis II — the powerhouse that will launch a crew of four around the Moon next year. Unveiled Tuesday, the design echoes the America 250 Commission’s Spirit of Innovation theme, honoring a country that has never stopped pushing the horizon forward.
At NASA’s Kennedy Space Center in Florida, technicians spent recent weeks carefully applying the emblem on the rocket inside the Vehicle Assembly Building — the same place where rockets for Apollo once stood. Engineers are running final tests on SLS and the Orion spacecraft as preparations intensify for Artemis II.
The roughly 10-day Artemis II journey around the Moon will mark a defining moment in this new era of American exploration — paving the way for U.S. crews to land on the lunar surface and ultimately push onward to Mars.
America’s spirit of discovery is alive, and Artemis is carrying it to the Moon and beyond.
Image credit: NASA/Ben Smegelsky
Sugars, ‘Gum,’ Stardust Found in NASA’s Asteroid Bennu Samples
The asteroid Bennu continues to provide new clues to scientists’ biggest questions about the formation of the early solar system and the origins of life. As part of the ongoing study of pristine samples delivered to Earth by NASA’s OSIRIS-REx (Origins, Spectral Interpretation, Resource Identification, and Security-Regolith Explorer) spacecraft, three new papers published Tuesday by the journals Nature Geosciences and Nature Astronomy present remarkable discoveries: sugars essential for biology, a gum-like substance not seen before in astromaterials, and an unexpectedly high abundance of dust produced by supernova explosions.
Sugars essential to life
Scientists led by Yoshihiro Furukawa of Tohoku University in Japan found sugars essential for biology on Earth in the Bennu samples, detailing their findings in the journal Nature Geoscience. The five-carbon sugar ribose and, for the first time in an extraterrestrial sample, six-carbon glucose were found. Although these sugars are not evidence of life, their detection, along with previous detections of amino acids, nucleobases, and carboxylic acids in Bennu samples, show building blocks of biological molecules were widespread throughout the solar system.
For life on Earth, the sugars deoxyribose and ribose are key building blocks of DNA and RNA, respectively. DNA is the primary carrier of genetic information in cells. RNA performs numerous functions, and life as we know it could not exist without it. Ribose in RNA is used in the molecule’s sugar-phosphate “backbone” that connects a string of information-carrying nucleobases.
“All five nucleobases used to construct both DNA and RNA, along with phosphates, have already been found in the Bennu samples brought to Earth by OSIRIS-REx,” said Furukawa. “The new discovery of ribose means that all of the components to form the molecule RNA are present in Bennu.”
The discovery of ribose in asteroid samples is not a complete surprise. Ribose has previously been found in two meteorites recovered on Earth. What is important about the Bennu samples is that researchers did not find deoxyribose. If Bennu is any indication, this means ribose may have been more common than deoxyribose in environments of the early solar system.
Researchers think the presence of ribose and lack of deoxyribose supports the “RNA world” hypothesis, where the first forms of life relied on RNA as the primary molecule to store information and to drive chemical reactions necessary for survival.
A team of Japanese and US scientists have discovered the bio-essential sugars ribose and glucose in samples of asteroid Bennu that were collected by NASA’s OSIRIS-REx mission. This finding builds on the earlier discovery of nucleobases (the genetic components of DNA and RNA), phosphate, and amino acids (the building blocks of proteins) in the Bennu samples, showing that the molecular ingredients of life could have been delivered to early Earth by meteorites. Download this graphic from NASA’s Scientific Visualization Studio website: https://svs.gsfc.nasa.gov/14932NASA/Goddard/University of Arizona/Dan Gallagher“Present day life is based on a complex system organized primarily by three types of functional biopolymers: DNA, RNA, and proteins,” explains Furukawa. “However, early life may have been simpler. RNA is the leading candidate for the first functional biopolymer because it can store genetic information and catalyze many biological reactions.”
The Bennu samples also contained one of the most common forms of “food” (or energy) used by life on Earth, the sugar glucose, which is the first evidence that an important energy source for life as we know it was also present in the early solar system.
Mysterious, ancient ‘gum’
A second paper, in the journal Nature Astronomy led by Scott Sandford at NASA’s Ames Research Center in California’s Silicon Valley and Zack Gainsforth of the University of California, Berkeley, reveals a gum-like material in the Bennu samples never seen before in space rocks – something that could have helped set the stage on Earth for the ingredients of life to emerge. The surprising substance was likely formed in the early days of the solar system, as Bennu’s young parent asteroid warmed.
Once soft and flexible, but since hardened, this ancient “space gum” consists of polymer-like materials extremely rich in nitrogen and oxygen. Such complex molecules could have provided some of the chemical precursors that helped trigger life on Earth, and finding them in the pristine samples from Bennu is important for scientists studying how life began and whether it exists beyond our planet.
On this primitive asteroid that formed in the early days of the solar system, we’re looking at events near the beginning of the beginning.Scott SandFord
Astrophysicist, NASA's Ames Research Center
Bennu’s ancestral asteroid formed from materials in the solar nebula – the rotating cloud of gas and dust that gave rise to the solar system – and contained a variety of minerals and ices. As the asteroid began to warm, due to natural radiation, a compound called carbamate formed through a process involving ammonia and carbon dioxide. Carbamate is water soluble, but it survived long enough to polymerize, reacting with itself and other molecules to form larger and more complex chains impervious to water. This suggests that it formed before the parent body warmed enough to become a watery environment.
“With this strange substance, we’re looking at, quite possibly, one of the earliest alterations of materials that occurred in this rock,” said Sandford. “On this primitive asteroid that formed in the early days of the solar system, we’re looking at events near the beginning of the beginning.”
Using an infrared microscope, Sandford’s team selected unusual, carbon-rich grains containing abundant nitrogen and oxygen. They then began what Sandford calls “blacksmithing at the molecular level,” using the Molecular Foundry at Lawrence Berkeley National Laboratory (Berkeley Lab) in Berkeley, California. Applying ultra-thin layers of platinum, they reinforced a particle, welded on a tungsten needle to lift the tiny grain, and shaved the fragment down using a focused beam of charged particles.
A microscopic particle of asteroid Bennu, brought to Earth by NASA’s OSIRIS-REx mission, is manipulated under a transmission electron microscope. In order to move the fragment for further analysis, researchers first reinforced it with thin strips of platinum (the “L” shape on the particle’s surface) then welded a tungsten microneedle to it. The asteroid fragment measures 30 micrometers (about one-one thousandth of an inch) across.NASA/University of California, BerkeleyWhen the particle was a thousand times thinner than a human hair, they analyzed its composition via electron microscopy at the Molecular Foundry and X-ray spectroscopy at Berkeley Lab’s Advanced Light Source. The ALS’s high spatial resolution and sensitive X-ray beams enabled unprecedented chemical analysis.
“We knew we had something remarkable the instant the images started to appear on the monitor,” said Gainsforth. “It was like nothing we had ever seen, and for months we were consumed by data and theories as we attempted to understand just what it was and how it could have come into existence.”
The team conducted a slew of experiments to examine the material’s characteristics. As the details emerged, the evidence suggested the strange substance had been deposited in layers on grains of ice and minerals present in the asteroid.
It was also flexible – a pliable material, similar to used gum or even a soft plastic. Indeed, during their work with the samples, researchers noticed the strange material was bendy and dimpled when pressure was applied. The stuff was translucent, and exposure to radiation made it brittle, like a lawn chair left too many seasons in the sun.
“Looking at its chemical makeup, we see the same kinds of chemical groups that occur in polyurethane on Earth,” said Sandford, “making this material from Bennu something akin to a ‘space plastic.’”
The ancient asteroid stuff isn’t simply polyurethane, though, which is an orderly polymer. This one has more “random, hodgepodge connections and a composition of elements that differs from particle to particle,” said Sandford. But the comparison underscores the surprising nature of the organic material discovered in NASA’s asteroid samples, and the research team aims to study more of it.
By pursuing clues about what went on long ago, deep inside an asteroid, scientists can better understand the young solar system – revealing the precursors to and ingredients of life it already contained, and how far those raw materials may have been scattered, thanks to asteroids much like Bennu.
Abundant supernova dust
Another paper in the journal Nature Astronomy, led by Ann Nguyen of NASA’s Johnson Space Center in Houston, analyzed presolar grains – dust from stars predating our solar system – found in two different rock types in the Bennu samples to learn more about where its parent body formed and how it was altered by geologic processes. It is believed that presolar dust was generally well-mixed as our solar system formed. The samples had six-times the amount of supernova dust than any other studied astromaterial, suggesting the asteroid’s parent body formed in a region of the protoplanetary disk enriched in the dust of dying stars.
The study also reveals that, while Bennu’s parent asteroid experienced extensive alteration by fluids, there are still pockets of less-altered materials within the samples that offer insights into its origin.
An artistic visualization of the OSIRIS-REx spacecraft descending towards asteroid Bennu to collect a sample.NASA/Goddard/University of Arizona“These fragments retain a higher abundance of organic matter and presolar silicate grains, which are known to be easily destroyed by aqueous alteration in asteroids,” said Nguyen. “Their preservation in the Bennu samples was a surprise and illustrates that some material escaped alteration in the parent body. Our study reveals the diversity of presolar materials that the parent accreted as it was forming.”
NASA’s Goddard Space Flight Center provided overall mission management, systems engineering, and the safety and mission assurance for OSIRIS-REx. Dante Lauretta of the University of Arizona, Tucson, is the principal investigator. The university leads the science team and the mission’s science observation planning and data processing. Lockheed Martin Space in Littleton, Colorado, built the spacecraft and provided flight operations. Goddard and KinetX Aerospace were responsible for navigating the OSIRIS-REx spacecraft. Curation for OSIRIS-REx takes place at NASA’s Johnson Space Center in Houston. International partnerships on this mission include the OSIRIS-REx Laser Altimeter instrument from CSA (Canadian Space Agency) and asteroid sample science collaboration with JAXA’s (Japan Aerospace Exploration Agency’s) Hayabusa2 mission. OSIRIS-REx is the third mission in NASA’s New Frontiers Program, managed by NASA’s Marshall Space Flight Center in Huntsville, Alabama, for the agency’s Science Mission Directorate in Washington.
For more information on the OSIRIS-REx mission, visit:
https://www.nasa.gov/osiris-rex
Karen Fox / Molly Wasser
Headquarters, Washington
202-285-5155 / 240-419-1732
karen.c.fox@nasa.gov / molly.l.wasser@nasa.gov
The International Space Station Marks 25 Years of Continuous Human Presence
On Nov. 2, 2025, NASA honored 25 years of continuous human presence aboard the International Space Station. What began as a fragile framework of modules has evolved into a springboard for international cooperation, advanced scientific research and technology demonstrations, the development of a low Earth orbit economy, and NASA’s next great leaps in exploration, including crewed missions to the Moon and Mars.
The first expedition The Expedition One crew in the Zvezda Service module aboard the International Space Station. From left: commander William Shepherd, Soyuz commander Yuri Gidzenko and Flight Engineer Sergei Krikalev.NASAThis legacy of achievement in global human endeavors began with the first crew’s arrival to the space station on Nov. 2, 2000. Expedition 1 crew members NASA astronaut William M. Shepherd and Russian Aviation and Space Agency, now Roscosmos, cosmonauts Yuri P. Gidzenko and Sergei K. Krikalev launched from the Baikonur Cosmodrome in Kazakhstan two days prior. After a successful docking, the crew transferred aboard the station and began bringing it to life. Their primary tasks during their four-month mission included installing and activating the life support and communications systems and working with three visiting space shuttle crews to continue the station’s assembly. The trio returned to Earth in March 2001 aboard space shuttle Discovery, after having turned the station over to the Expedition 2 crew.
(Space)walking into history NASA astronaut Andrew Morgan conducts a spacewalk at the Port- 6 truss structure work site to upgrade International Space Station systems.NASA/Christina KochAssembly and maintenance of the International Space Station would not be possible without the skilled work of crew members performing intricate tasks, in bulky spacesuits, in the harsh environment of space. In addition to station upkeep, spacewalks provide a platform for testing and improving spacesuits and tools – critical information for future exploration of the Moon and Mars. Other spacewalks have included operations for scientific research. In Jan. 2025, for example, crew members collected samples for an investigation examining whether microorganisms have exited through station vents and can survive in space, to better inform spacecraft design that helps prevent human contamination of Mars and other destinations.
More than 270 spacewalks dedicated to the space station have been accomplished in the last quarter century. Several made station and human spaceflight history:
- May 1999: NASA astronaut Tamara Jernigan became the first woman to complete a spacewalk at the space station, in support of its construction.
- September 2000: Also during space station assembly, NASA astronaut Edward T. “Ed” Lu and Roscosmos cosmonaut Yuri I. Malenchenko conducted the first U.S.-Russian spacewalk.
- March 10, 2001: NASA astronauts James Voss and Susan Helms set the record for longest spacewalk in U.S. history, at 8 hours and 56 minutes.
- First spacewalks by international partners included:
- April 2001 – Canadian Space Agency astronaut Chris Hadfield
- July 2005 – Japan Aerospace Exploration Agency astronaut Soichi Noguchi
- Aug. 2006 – European Space Agency astronaut Thomas Reiter
- Feb. 26, 2004: NASA astronaut Mike Foale and Russian cosmonaut Aleksandr Y. Kaleri complete the first spacewalk with no one inside the station.
- Oct. 18, 2019: The first all-female spacewalk in history, conducted by NASA astronauts Christina Koch and Jessica Meir.
The International Space Station welcomed its first commercial crew members on May 31, 2020, when former NASA astronauts Robert Behnken and Douglas Hurley joined Expedition 63 Commander and NASA astronaut Chris Cassidy and Roscosmos cosmonauts Anatoly Ivanishin and Ivan Vagner aboard the orbiting laboratory.
Behnken and Hurley lifted off from Kennedy Space Center in Florida the day before on NASA’s SpaceX Demo-2 test flight – the first launch of American astronauts from U.S. soil since the space shuttle’s retirement in 2011.
The duo quickly integrated with the rest of the crew and participated in a number of scientific experiments, spacewalks, and public engagement events during their 62 days aboard station. Overall, the pair spent 64 days in orbit, completed 1,024 orbits around Earth, and contributed more than 100 hours of time to supporting the orbiting laboratory’s investigations before splashing down on Aug. 2.
Successful completion of the Demo-2 mission paved the way for regular SpaceX flights carrying astronauts to and from the space station. With another certified crew transportation system in place, the International Space Station Program added research time and increased the opportunity for discovery aboard humanity’s testbed for exploration, including preparations for human exploration of the Moon and Mars.
Frank Rubio’s record-breaking year in space NASA astronaut and Expedition 68 Flight Engineer Frank Rubio inside the cupola, the International Space Station’s “window to the world,” as the orbiting laboratory flew 263 miles above southeastern England on Oct. 1, 2022.NASA/Frank RubioOn Sept. 27, 2023, NASA astronaut Frank Rubio returned to Earth after spending 371 days aboard the International Space Station—the longest single spaceflight by a U.S. astronaut in history. His mission surpassed the previous record of 355 days, set by NASA astronaut Mark Vande Hei, and provided scientists with an unprecedented look at how the human body adapts to more than a year in microgravity.
Rubio’s record-setting mission supported six human research studies, including investigations into diet, exercise, and overall physiology and psychology. He was the first astronaut to test whether limited workout equipment could still maintain health and fitness, an important consideration for future spacecraft with tighter living quarters. He also contributed biological samples, surveys, and tests for NASA’s Spaceflight Standard Measures, a study that collects health data from astronauts to better understand how the body adapts to space—knowledge that helps prepare crews for the Artemis campaign to the Moon and future trips to Mars.
Alongside his fellow crew members, Rubio participated in dozens of investigations and technology demonstrations, from growing tomato plants with hydroponic and aeroponic techniques to materials science experiments that advance spacecraft design.
Long-duration missions help inform future spaceflight and lay the groundwork for the next era of human exploration.
A global foundation for growing a low Earth orbit economy Facilities around the world support the operation and management of the International Space Station. NASAThe space station is one of the most ambitious international collaborations ever attempted. It brings together international flight crews, multiple launch vehicles, globally distributed launch and flight operations, training, engineering, and development facilities, communications networks, and the international scientific research community for the benefit of all humanity.
An international partnership of space agencies operates the elements of the orbiting laboratory: NASA, Roscosmos, ESA (European Space Agency), JAXA (Japan Aerospace Exploration Agency), and CSA (Canadian Space Agency). Each partner takes primary responsibility for managing and running the station hardware it provides, as well as on-Earth construction, launch support, mission operations, communications, and research and technology facilities that support the station.
At least 290 individuals representing 26 countries, and the five international partners have visited the orbiting laboratory during its 25 years of continuous human presence. Some of those visitors flew to the station on private astronaut missions. These missions contribute to scientific, outreach, and commercial activities. They also help demonstrate the demand for future commercial space stations and are an important component of NASA’s strategy for enabling a robust and competitive commercial economy in low Earth orbit.
The results of the international partnership created through the space station and its accomplishments exemplifies how countries can work together to overcome complex challenges and achieve collaborative goals.
Explore More 8 min read Sugars, ‘Gum,’ Stardust Found in NASA’s Asteroid Bennu Samples Article 11 hours ago 5 min read Mark Elder: Building the Future of Spacewalking for Artemis and Beyond Article 2 days ago 3 min read Rings of Rock in the Sahara
In southeastern Libya, Jabal Arkanū’s concentric rock rings stand as relics of past geologic forces…
Article 5 days agoWhat is AI? (Grades 5-8)
This article is for students grades 5-8.
What is AI?Artificial intelligence, or AI, is a type of technology that helps machines and computers have “thinking” abilities similar to humans. Devices using AI can learn words and concepts, recognize objects, see patterns, or make predictions. They can also be taught how to work autonomously. AI is often used to help people understand and solve problems more quickly than they could on their own.
AI includes:
- Machine learning: This type of AI looks at large amounts of data and learns how to make fast and accurate predictions based on that data.
- Deep learning: This type helps computers operate much like the human brain. It uses several layers of “thought” to recognize patterns and learn new information. Deep learning is a type of machine learning.
- Generative AI: A human can use generative AI to create text, videos, images, and more. It is based on deep learning.
NASA has found uses for AI in many of its missions and programs.
For missions to the Moon, AI can use satellite imagery to create detailed 3D maps of dark craters. This data could help scientists plan missions, spot hazards, and even identify where future crews might find water ice. On Mars, the Perseverance rover uses AI to drive itself autonomously. It takes pictures of the ground, sees obstacles, and chooses the safest path.
AI also helps NASA search for planets outside our solar system. For example, AI has helped citizen scientists find over 10,000 pairs of binary stars. These pairs orbit each other and block each other’s light. This information could help scientists search for new planets and learn more about how stars form.
———————————————————————————————
Words to KnowAutonomous: acting or operating independently, without external control. An autonomous technology can perform duties without human intervention.
Citizen scientist: a member of the public, often a volunteer, who collects data that can be used by scientists. When members of the public participate in research in this way, it’s called citizen science.
———————————————————————————————
NASA also uses AI to support its work on Earth. The agency uses AI to aid disaster relief efforts during and after natural disasters like hurricanes or wildfires. For example, AI can count tarps on roofs in satellite images to measure damage after a storm. NASA is also supporting flight controllers and pilots by using AI to plan better flight routes, making air travel safer and more efficient.
AI is helping NASA explore space, protect people, and make amazing discoveries!
The blue tentacle-like arms containing gecko-like adhesive pads, attaBlue tentacle-like arms with gecko-like adhesive pads reach out and grapple a “capture cube” inside the International Space Station. The arms are attached to the cube-shaped Astrobee robotic free-flyer, right. The experimental grippers demonstrated techniques to autonomously perform tasks in low Earth orbit.NASA Advice From NASA AI Experts“AI is a great field for people who like solving problems, building things, or asking questions about how the world works. People use AI to help doctors understand diseases, to teach robots how to explore space, and to help communities prepare for things like floods or wildfires. If you like using technology to help people and discover new things, AI could be a great career for you!” – Krista Kinnard, NASA’s Deputy Chief AI Officer
In this illustration, astronauts work on the lunar surface as part of NASA’s Artemis program.NASA Start exploring coding and STEM activities like robotics clubs. Just remember to always stay curious, keep practicing, and don’t be afraid of making mistakes. This really helps you learn.Martin Garcia
AI Adoption and Innovation Lead, NASA’s Johnson Space Center
Career CornerNASA roles that may involve AI include:
Astronauts: Astronauts on the International Space Station can use an AI “digital assistant” to get medical recommendations. This is helpful when communication with Earth is interrupted. It could also be useful on future missions to distant destinations like Mars.
Engineers: Engineers can use AI to help them generate designs for things like new spacecraft.
Astronomers: AI helps astronomers analyze satellite and deep space telescope data to find stars and exoplanets.
Meteorologists: Weather experts can use machine learning to make climate projections.
Programmers: Programmers can use AI to update code used in older missions, bringing it up to modern standards.
IT professionals: AI can enable IT experts to understand outages across NASA, allowing them to get programs back up and running faster.
Program managers: Program managers can use AI to plan and model NASA missions.
Build Your Computer Science Skills With NASA
Gaining Traction on Mars Activity
NASA Space Detective: Can You Spot a Star or a Galaxy
Video: Hack Into Computer Science With NASA
Artificial Intelligence at NASA
Sagittarius B2 Molecular Cloud
The Mid-Infrared Instrument (MIRI) on NASA’s James Webb Space Telescope captured glowing cosmic dust heated by very young massive stars in unprecedented detail in this image of the Sagittarius B2 (Sgr B2) molecular cloud released on Sept. 24, 2025.
Sgr B2 is the most massive, and active star-forming region in our galaxy, located only a few hundred light years from our central supermassive black hole. While Sgr B2 has only 10% of the galactic center’s gas, it produces 50% of its stars. Astronomers want to figure out why it is so much more active than the rest of the galactic center.
MIRI has both a camera and a spectrograph that sees light in the mid-infrared region of the electromagnetic spectrum. MIRI’s view reveals colorful stars punctuated occasionally by bright clouds of gas and dust. Further research into these stars will reveal details of their masses and ages, which will help astronomers better understand the process of star formation in this dense, active galactic center region.
Image credit: Image: NASA, ESA, CSA, STScI, Adam Ginsburg (University of Florida), Nazar Budaiev (University of Florida), Taehwa Yoo (University of Florida); Image Processing: Alyssa Pagan (STScI)
Mark Elder: Building the Future of Spacewalking for Artemis and Beyond
For more than 25 years, Mark Elder has helped make human spaceflight safe and possible. As the International Space Station EVA hardware manager in the Extravehicular Activity (EVA) Office within the EVA and Human Surface Mobility Program, he leads the team responsible for the spacesuits, tools, and logistics that keep astronauts protected during spacewalks—and ensures NASA is ready for the next era of Artemis exploration.
Mark Elder with NASA’s Exploration Extravehicular Mobility Unit (xEMU) spacesuit at Johnson Space Center in Houston. NASA/Bill StaffordHis team is programmatically responsible for the Extravehicular Mobility Unit, or EMU, spacesuit. That means every bolt, bearing, and battery astronauts rely on outside the International Space Station ultimately falls under their watch. He also oversees the EVA Space Operations Contract, which provides engineering and technical support to keep spacesuit systems flight ready.
Elder’s work directly supports every EVA, or spacewalk, conducted at the station. His team coordinates with astronauts, engineers, and the Mission Control Center in Houston to make sure the suits and tools operate reliably in the most unforgiving environment imaginable. Their work helps ensure every EVA is conducted safely and successfully.
Elder’s passion for NASA began at an early age.
“When I was little, my parents gave me a book called ‘The Astronauts,’” he said. “It had drawings of a reusable spacecraft—the space shuttle—and I fell in love with it. From then on, I told everyone I was going to work at NASA.”
That dream took off at age 16, when he attended Space Academy in Huntsville, Alabama. “That cemented my dream of someday working at NASA, and it taught me a little bit more about the different roles within the agency,” he said.
While attending Case Western Reserve University as a mechanical engineering student, he learned about a new NASA program that allowed college students to design and build an experiment and then come to Johnson Space Center for a week to fly with their experiment on the Boeing KC-135 Stratotanker. “I jumped on the chance to be part of the team,” he said. “The experience further cemented my dream of working at NASA one day—Johnson in particular.”
After graduation, Elder worked with Pratt & Whitney on jet engines. While the experience was invaluable, he knew his heart belonged in human spaceflight. “I learned that one of Pratt’s fellow companies under the United Technologies umbrella was Hamilton Sundstrand, which was the prime contractor for the spacesuit,” he said. “I jumped at the chance to transfer, and my career at NASA finally began.”
Elder spent his first three years at Johnson performing tool-to-tool fit checks on spacewalking equipment, giving him hands-on experience with nearly every tool that he would eventually become responsible for as a hardware manager.
Mark Elder stands in front of the Space Shuttle Atlantis before the STS-117 launch on June 8, 2007.His early years coincided with the shuttle return-to-flight era, when he worked on reinforced carbon-carbon panel repairs and thermal protection systems. Those experiences built his technical foundation and prepared him for the leadership roles to come.
Over time, Elder took on increasingly complex assignments, eventually leading the team that developed the EVA Long Life Battery—the first human-rated lithium battery used in space. His team created a rigorous test plan to certify the battery for human spaceflight at a time when lithium batteries were under scrutiny for safety concerns.
“Finally signing the certification paperwork was satisfying, but watching an EVA powered by the batteries provided a great sense of pride,” he said.
This innovation set the stage for future generations of even safer, higher-capacity batteries that power today’s spacewalking operations and will eventually support lunar surface activities.
Looking back, Elder said some of his greatest lessons came from learning how to lead with purpose. “The great thing about NASA is the highly motivated and dedicated workforce,” he said. “When I first became a team lead, I thought success meant making quick decisions and moving fast. I learned that leadership is really about listening. Strong teams are built on trust and open communication.”
Another defining lesson, he said, has been learning to assume positive intent. “In a place like NASA, everyone is deeply passionate about what they do,” he said. “It’s easy to misinterpret a disagreement as opposition, but when you remember that everyone is working toward the same goal, the conversation changes. You focus on solving problems, not winning arguments.”
That mindset has guided Elder through some of NASA’s most complex programs and helped him build lasting partnerships across the agency.
Mark Elder receives an award at the 2024 Rotary National Award for Space Achievement Stellar Awards ceremony at the Hyatt Regency in downtown Houston. NASA/Josh ValcarcelToday, Elder’s work extends beyond the orbiting laboratory. As NASA prepares for Artemis missions to the Moon, his team’s experience maintaining and improving the EMU informs the design of next-generation exploration suits.
“The foundation we’ve built on the space station is critical for the future,” he said. “Every tool we’ve refined, every system we’ve upgraded—it all feeds into how we’ll operate on the lunar surface and eventually on Mars.”
Elder believes that the key to future success lies in perseverance. He advises the next generation to never stop dreaming. “My path wasn’t direct, and it would have been easy for me to give up,” he said. “But dreams have a way of guiding you if you don’t let go of them.”
When he’s not supporting those missions, Elder’s creativity takes shape in his workshop. “In my spare time, I love woodworking,” he said. “Building something useful from a pile of rough-sawn boards helps calm me and gives me a great sense of accomplishment. I love being able to build furniture for my family,” he added, after recently finishing a desk for his youngest son.
The same patience and precision he brings to woodworking defines his approach to exploration—steady progress, careful craftmanship, and attention to detail. “As NASA goes to the Moon and Mars, there will be challenges,” Elder said. “As long as we keep dreaming, we will see the next generation walking on the Moon and heading to Mars.”
Explore More 8 min read Sugars, ‘Gum,’ Stardust Found in NASA’s Asteroid Bennu Samples Article 11 hours ago 6 min read The International Space Station Marks 25 Years of Continuous Human Presence Article 14 hours ago 5 min read NASA’s 2025 Astronaut Candidates: Shaping Artemis Exploration Article 1 week agoA Glimpse of History in Benin City
In some ways, Benin City is like dozens of other fast-growing cities in Nigeria. Buoyed by burgeoning industrial and agricultural sectors, the city’s population rose by 1.7 million people over the past four decades as its footprint on the West African landscape expanded several times over.
Amid bustling new networks of roads, residential neighborhoods, markets, and workshops, lie signs of a much earlier era, when the city was the seat of a powerful pre-colonial kingdom. Remnants of ancient earthworks, thought to be among the longest in the world, can even be seen in images of the city captured from space.
Benin Iya (sometimes called the Benin Earthworks, the Walls of Benin, and the Benin Moat) is a vast, cellular network of interlocking earthen walls, ramparts, and ditches that radiate outward from a central moat at the heart of the city. Built in sections over hundreds of years between the 7th and 14th centuries, the system was key to marking defensive, political, and economic boundaries and played an important role in maintaining order and stability in the Kingdom of Benin.
The OLI-2 (Operational Land Imager-2) on Landsat 9 captured this image of the remains of earthworks on January 11, 2025. The features appear as dark green lines that trace arcing patterns in a densely settled area near the airport on the west bank of the Ikpoba River. Trees and vegetation growing in the moats give the features a dark green color.
Most of the earthworks consisted of relatively narrow and shallow linear ramparts and ditches that spread widely across the landscape. Many sections have been destroyed or are too small or too obscured by modern development to be easily detected by satellites or astronauts in orbit. However, some inner sections that run through the modern Oredo, Egor, and Ikpoba-Okha areas of the city had true walls and moats and are among the most visible in Landsat imagery.
Archaeological research indicates that the earthworks spanned more than 16,000 kilometers (10,000 miles) and enclosed roughly 6,500 square kilometers (2,500 square miles)—an area as large as the U.S. state of Delaware. Such length means the features hold the Guinness World Record for being the “longest earthworks of the pre-mechanical era.” By some measures, the features were together significantly longer than the Great Wall of China.
NASA Earth Observatory image by Lauren Dauphin, using Landsat data from the U.S. Geological Survey. Story by Adam Voiland.
References & Resources- Guinness World Records Longest earthworks of the pre-mechanical era. Accessed November 25, 2025.
- The Met (2025, May 31) Benin City Earthworks and Urban Planning, Nigeria. Accessed November 25, 2025.
- MOWAA The Benin Iya Survey. Accessed November 25, 2025.
- MOWAA Benin City’s Moat (Iya) System. Accessed November 25, 2025.
- Onwuanyi, N. et al. (2021) The Benin City Moat System: Functional Space or Urban Void? African Journal of Environmental Research, 3(1), 21-39.
- Schepers, C. et al. (2025) Current Condition of the Iya in Benin City, the Gates and Future Preservation Strategies. African Archaeological Review, 42, 519-537.
- UNESCO (1995) Benin Iya / Sungbo’s Eredo. Accessed November 25, 2025.
- World Monuments Fund (2025) Benin City Earthworks. Accessed November 25, 2025.
JPEG (5.09 MB)
You may also be interested in:
Stay up-to-date with the latest content from NASA as we explore the universe and discover more about our home planet.
Breaking New Ground in Mekele
5 min read
Researchers are using satellites to study development patterns in this fast-growing city in Ethiopia.
ArticleFrom Forest to Field in Pará
2 min read
The Santarem plateau in the northern Brazilian state displays a patchwork of cleared and uncleared land bordering a densely forested…
ArticleThe First Labor Day Parade
3 min read
New York City’s Manhattan Island was the site of the nation’s first Labor Day parade on September 5, 1882.
Article1
2
3
4
Next
Keep Exploring Discover More from NASA Earth Science Subscribe to Earth Observatory Newsletters
Subscribe to the Earth Observatory and get the Earth in your inbox.
Earth Observatory Image of the Day
NASA’s Earth Observatory brings you the Earth, every day, with in-depth stories and stunning imagery.
Explore Earth Science
Earth Science Data
Newly Found Organics in Enceladus’ Plumes
Dramatic plumes, both large and small, spray water ice out from many locations along the famed tiger stripes near the south pole of Saturn’s moon Enceladus in this image released on Feb. 23, 2010. A study published in October 2025 analyzed data from NASA’s Cassini mission and found evidence of previously undetected organic compounds in a plume of ice particles like the ones seen here. The ice particles were ejected from the ocean that lies under Enceladus’ frozen shell. Researchers spotted not only molecules they’ve found before but also new ones that lay a potential path to chemical or biochemical activity.
Learn more about what they discovered.
Image credit: NASA/JPL-Caltech/Space Science Institute
Rings of Rock in the Sahara
In northeastern Africa, within the driest part of the Sahara, dark rocky outcrops rise above pale desert sands. Several of these formations, including Jabal Arakanū, display striking ring-shaped structures.
Jabal Arkanū (also spelled Arkenu) lies in southeastern Libya, near the border with Egypt. Several other massifs are clustered nearby, including Jabal Al Awaynat (or Uweinat), located about 20 kilometers (12 miles) to the southeast. Roughly 90 kilometers to the west are the similarly named Arkenu structures. These circular features were once thought to have formed by meteorite impacts, but later fieldwork suggested they resulted from terrestrial geological processes.
Arkanū’s ring-shaped structures also have an earthly origin. They are thought to have formed as magma rose toward the surface and intruded into the surrounding rock. Repeated intrusion events produced a series of overlapping rings, their centers roughly aligned toward the southwest. The resulting ring complex—composed of igneous basalt and granite—is bordered to the north by a hat-shaped formation made of sandstone, limestone, and quartz layers.
This photograph, taken by an astronaut aboard the International Space Station on September 13, 2025, shows the massif casting long shadows across the desert. The ridges stand nearly 1,400 meters above sea level, or about 800 meters above the surrounding sandy plains. Notice several outwash fans of boulders, gravel, and sand spreading from the mountain’s base toward the bordering longitudinal dunes.
Two wadis, or typically dry riverbeds, wind through the structure. However, water is scarce in this part of the Sahara. Past research using data from NASA and JAXA’s now-completed Tropical Rainfall Measuring Mission (TRMM) indicated that southeastern Libya, along with adjacent regions of Egypt and northern Sudan, receives only about 1 to 5 millimeters of rain per year. Slightly higher accumulations, around 5 to 10 millimeters per year, occur near Jabal Arkanū and neighboring massifs, suggesting a modest orographic effect from the mountains.
Astronaut photograph ISS073-E-698446 was acquired on September 13, 2025, with a Nikon Z9 digital camera using a focal length of 800 millimeters. It is provided by the ISS Crew Earth Observations Facility and the Earth Science and Remote Sensing Unit, Johnson Space Center. The image was taken by a member of the Expedition 73 crew. The image has been cropped and enhanced to improve contrast, and lens artifacts have been removed. The International Space Station Program supports the laboratory as part of the ISS National Lab to help astronauts take pictures of Earth that will be of the greatest value to scientists and the public, and to make those images freely available on the Internet. Additional images taken by astronauts and cosmonauts can be viewed at the NASA/JSC Gateway to Astronaut Photography of Earth. Story by Kathryn Hansen.
References & Resources- Afkareen, M. M., et al. (2022) Lineament Mapping of Jabal Arkenu in Southern Libya. The Scientific Journal of University of Benghazi, 35(1).
- Alghariani, M. (2020) Applications of Remote Sensing for Exploration of Mineral Deposits and Gold in Jabal Arkenu. Fourth International Conference on Geospatial Technologies Libya GeoTec4 in Tripoli – Libya.
- Cigolini, C., et al. (2012) Endogenous and nonimpact origin of the Arkenu circular structures (al-Kufrah basin—SE Libya). Meteoritics & Planetary Science, 47(11), 1772-1788.
- Kelley, O. A. (2014) Where the Least Rainfall Occurs in the Sahara Desert, the TRMM Radar Reveals a Different Pattern of Rainfall Each Season. Journal of Climate, 27(18), 6919–6939.
- NASA Earth Observatory (2024, January 23) Water Beneath the Sand. Accessed October 30, 2025.
- NASA Earth Observatory (2013, March 9) Jebel Uweinat. Accessed October 30, 2025.
- NASA Earth Observatory (2008, November 10) Arkenu Craters, Libya. Accessed October 30, 2025.
JPEG (4.54 MB)
You may also be interested in:
Stay up-to-date with the latest content from NASA as we explore the universe and discover more about our home planet.
Nighttime Over the Eastern Pacific
2 min read
A long-exposure photo taken from low Earth orbit captured the brilliant illumination coming from airglow, lightning, and stars.
ArticleA Northwest Night Awash in Light
3 min read
The glow of city lights, the aurora, and a rising Moon illuminate the night along the northwest coast of North…
ArticleA Halo Above the Horizon
3 min read
A subtle arc, formed by the bending of light through high-altitude ice crystals, cradles the Moon above the darkened Earth.
Article1
2
3
4
Next
Keep Exploring Discover More from NASA Earth Science Subscribe to Earth Observatory Newsletters
Subscribe to the Earth Observatory and get the Earth in your inbox.
Earth Observatory Image of the Day
NASA’s Earth Observatory brings you the Earth, every day, with in-depth stories and stunning imagery.
Explore Earth Science
Earth Science Data
NASA Astronaut Chris Williams, Crewmates Arrive at Space Station
NASA astronaut Chris Williams, accompanied by Roscosmos cosmonauts Sergey Kud-Sverchkov and Sergei Mikaev, safely arrived at the International Space Station on Thursday, expanding the orbiting laboratory’s crew to 10 for the next two weeks.
The trio launched aboard the Soyuz MS-28 spacecraft at 4:27 a.m. EST (2:27 p.m. Baikonur time) from the Baikonur Cosmodrome in Kazakhstan. After a three-hour, two-orbit journey, the spacecraft docked at 7:34 a.m. to the space station’s Rassvet module.
Following hatch opening, expected about 10:10 a.m., the new arrivals will be welcomed by the Expedition 73 crew, including NASA astronauts Mike Fincke, Zena Cardman, and Jonny Kim; JAXA (Japan Aerospace Exploration Agency) astronaut Kimiya Yui; and Roscosmos cosmonauts Sergey Ryzhikov, Alexey Zubritsky, and Oleg Platonov.
NASA’s live coverage of hatch opening begins at 9:50 a.m. on NASA+, Amazon Prime, and YouTube. Learn how to watch NASA content through a variety of platforms, including social media.
During his stay aboard the space station, Williams will conduct scientific research and technology demonstrations aimed at advancing human space exploration and benefiting life on Earth. He will help install and test a new modular workout system for long-duration missions, support experiments to improve cryogenic fuel efficiency and grow semiconductor crystals in space, as well as assist NASA in designing new re-entry safety protocols to protect crews during future missions.
Expedition 74 is scheduled to begin on Monday, Dec. 8, following the departure of Kim, Ryzhikov, and Zubritsky, as they conclude an eight-month science mission aboard the orbital outpost.
Watch the change of command ceremony at 10:25 a.m. on Sunday, Dec. 7, as station leadership transfers from Ryzhikov to Fincke, live on NASA+.
Learn more about International Space Station, crews, research, and operations at:
-end-
Jimi Russell
Headquarters, Washington
202-358-1100
james.j.russell@nasa.gov
Sandra Jones / Joseph Zakrzewski
Johnson Space Center, Houston
281-483-5111
sandra.p.jones@nasa.gov / joseph.a.zakrzewski@nasa.gov
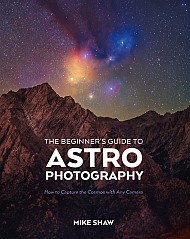
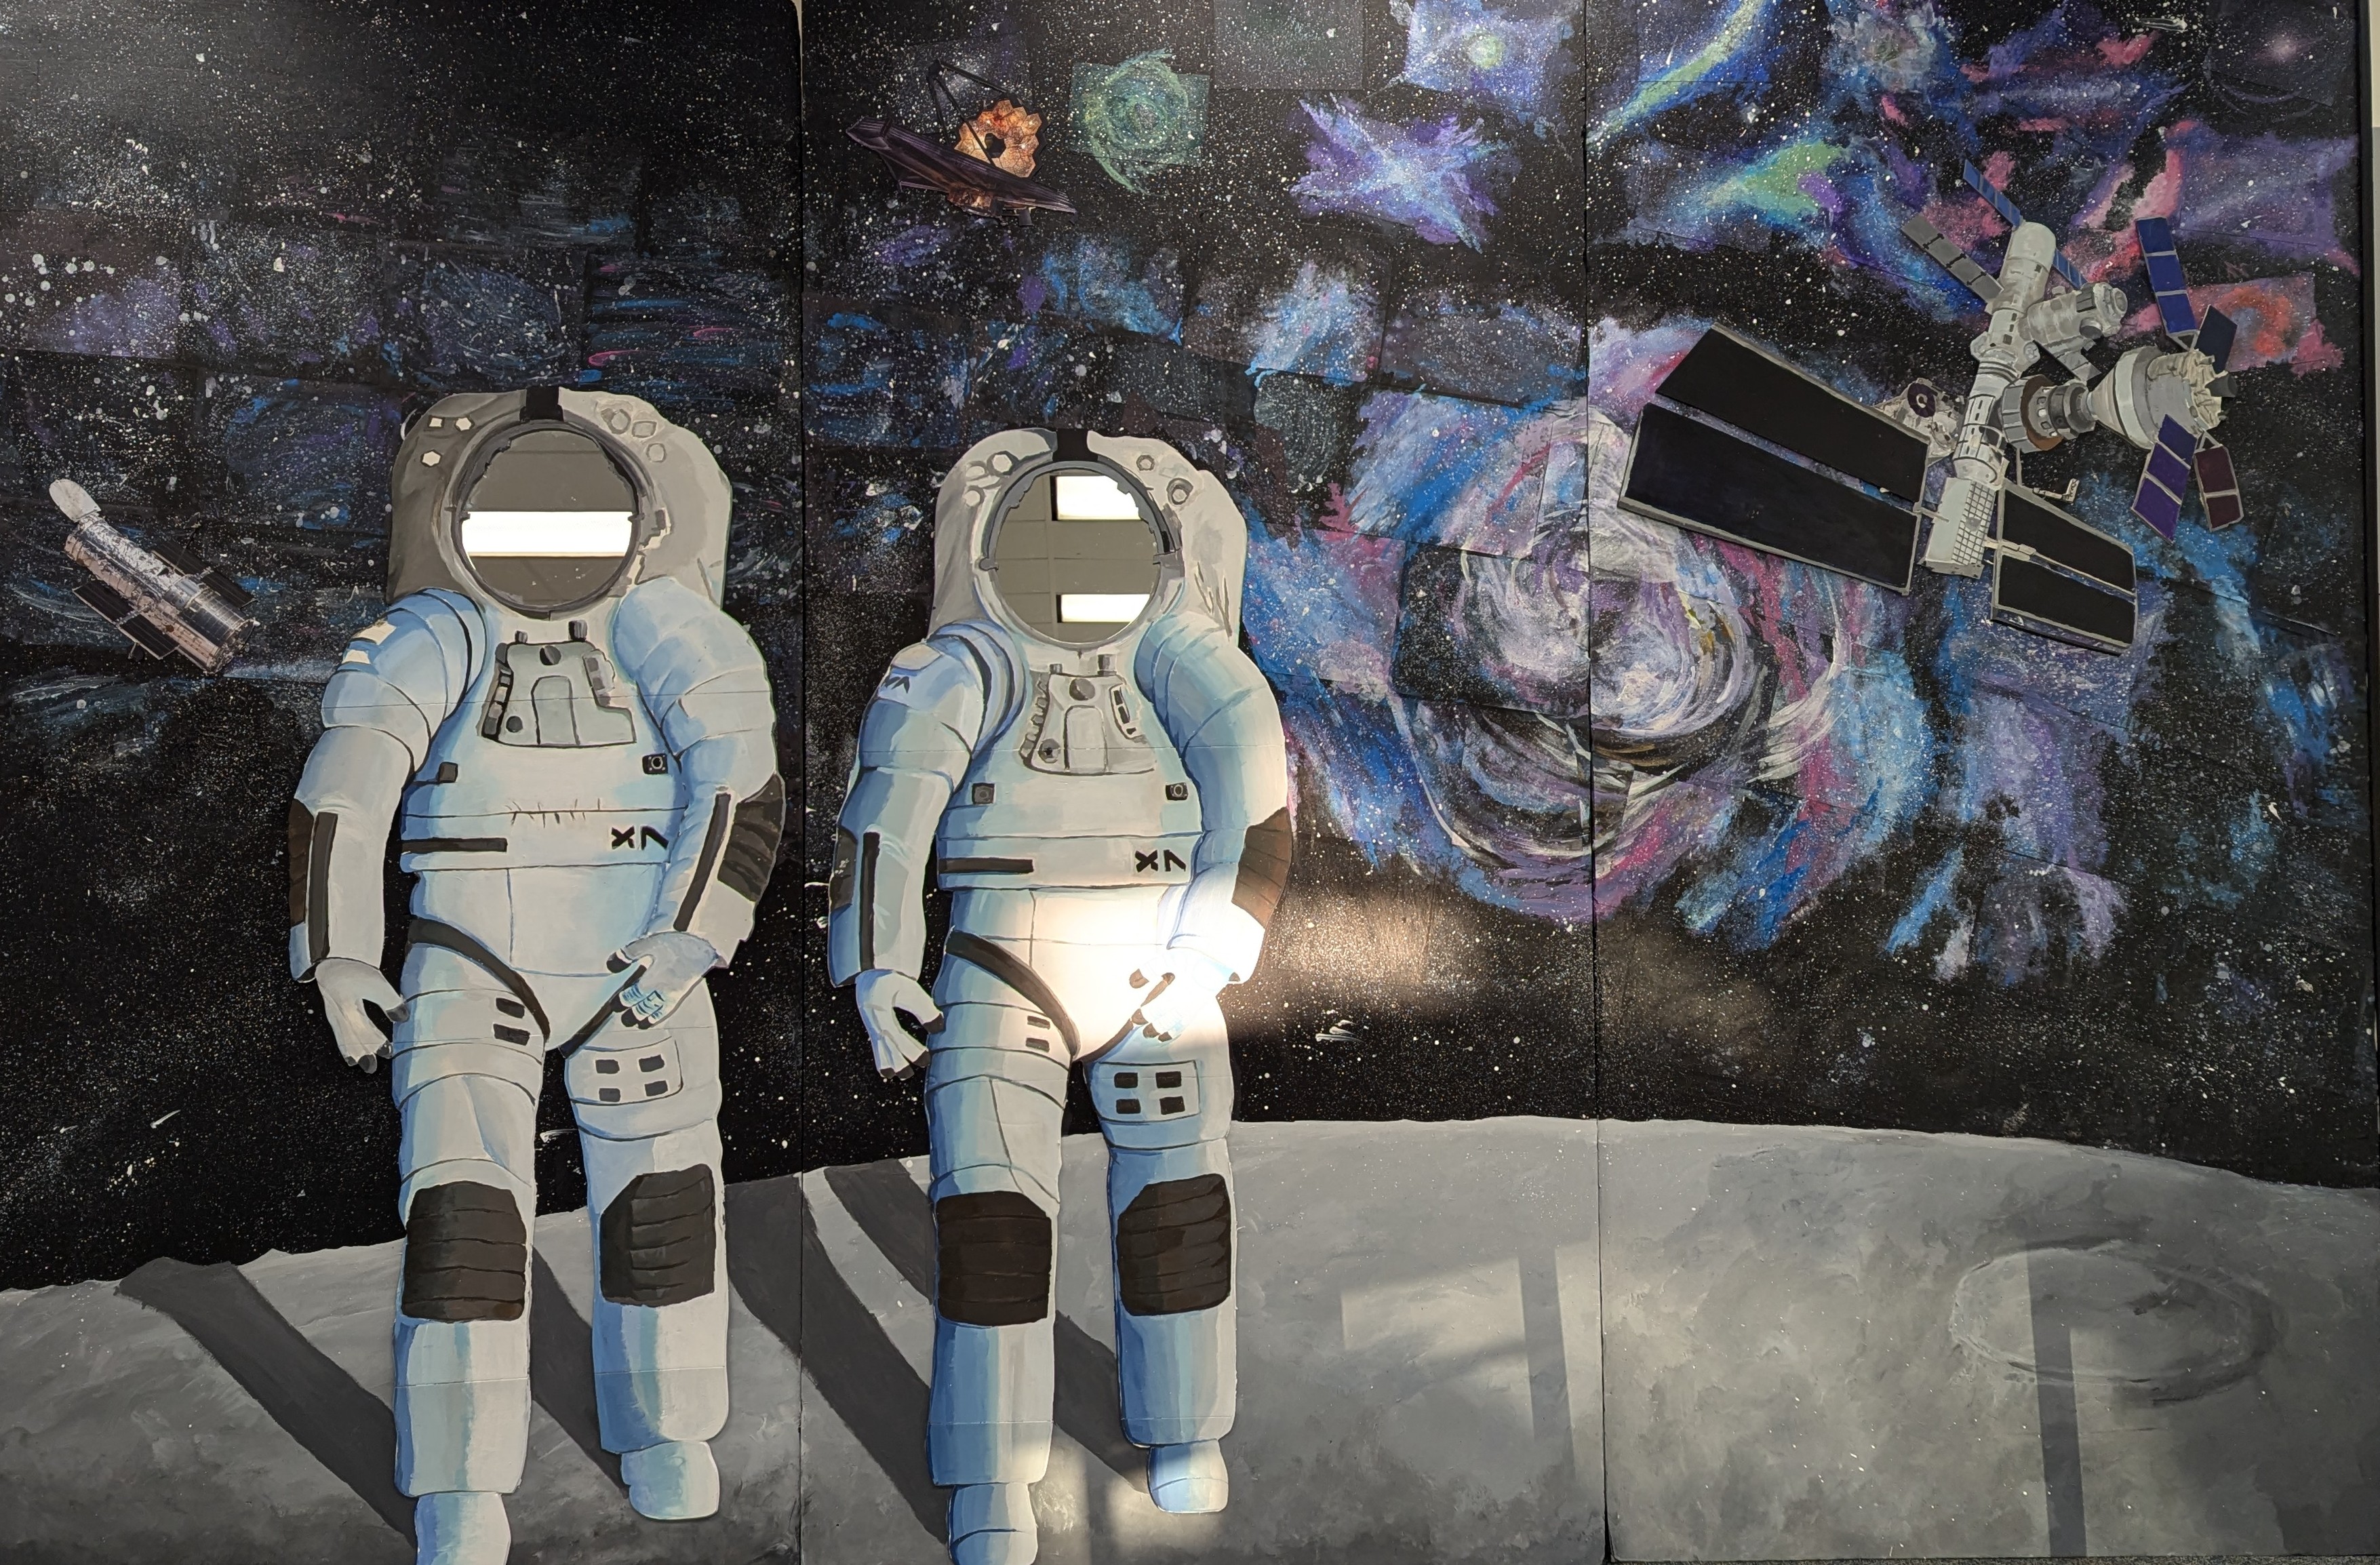
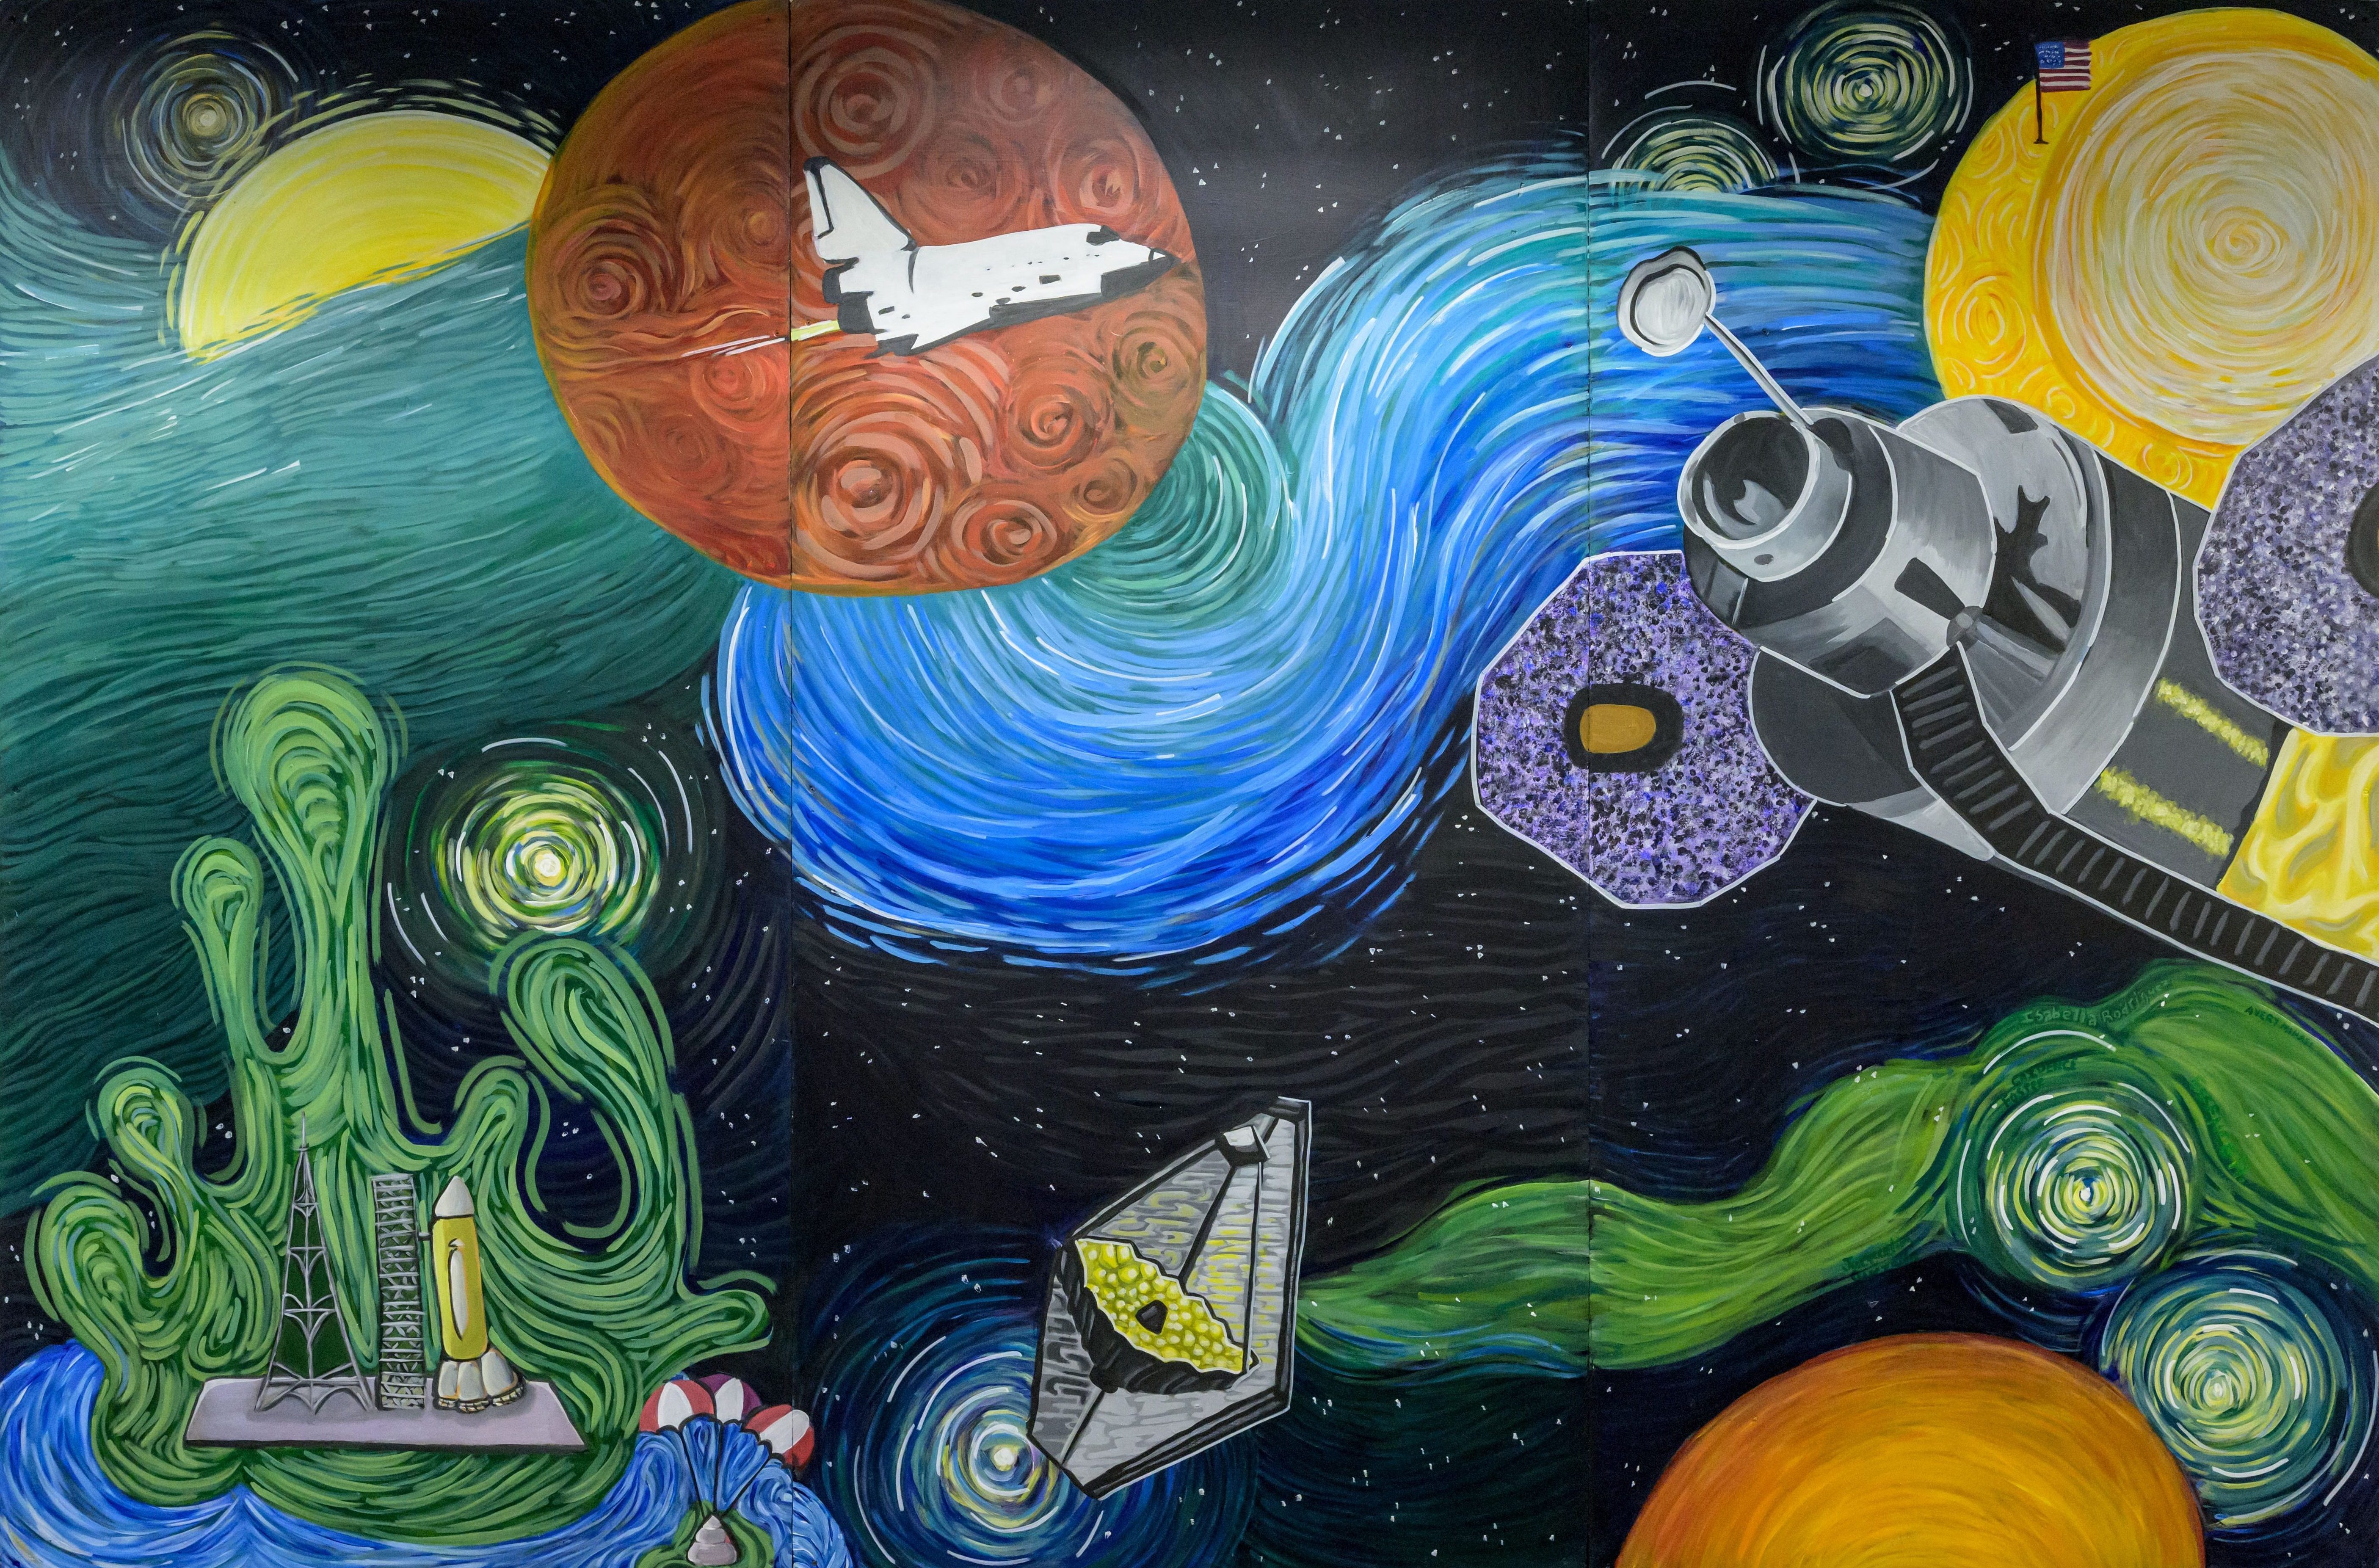
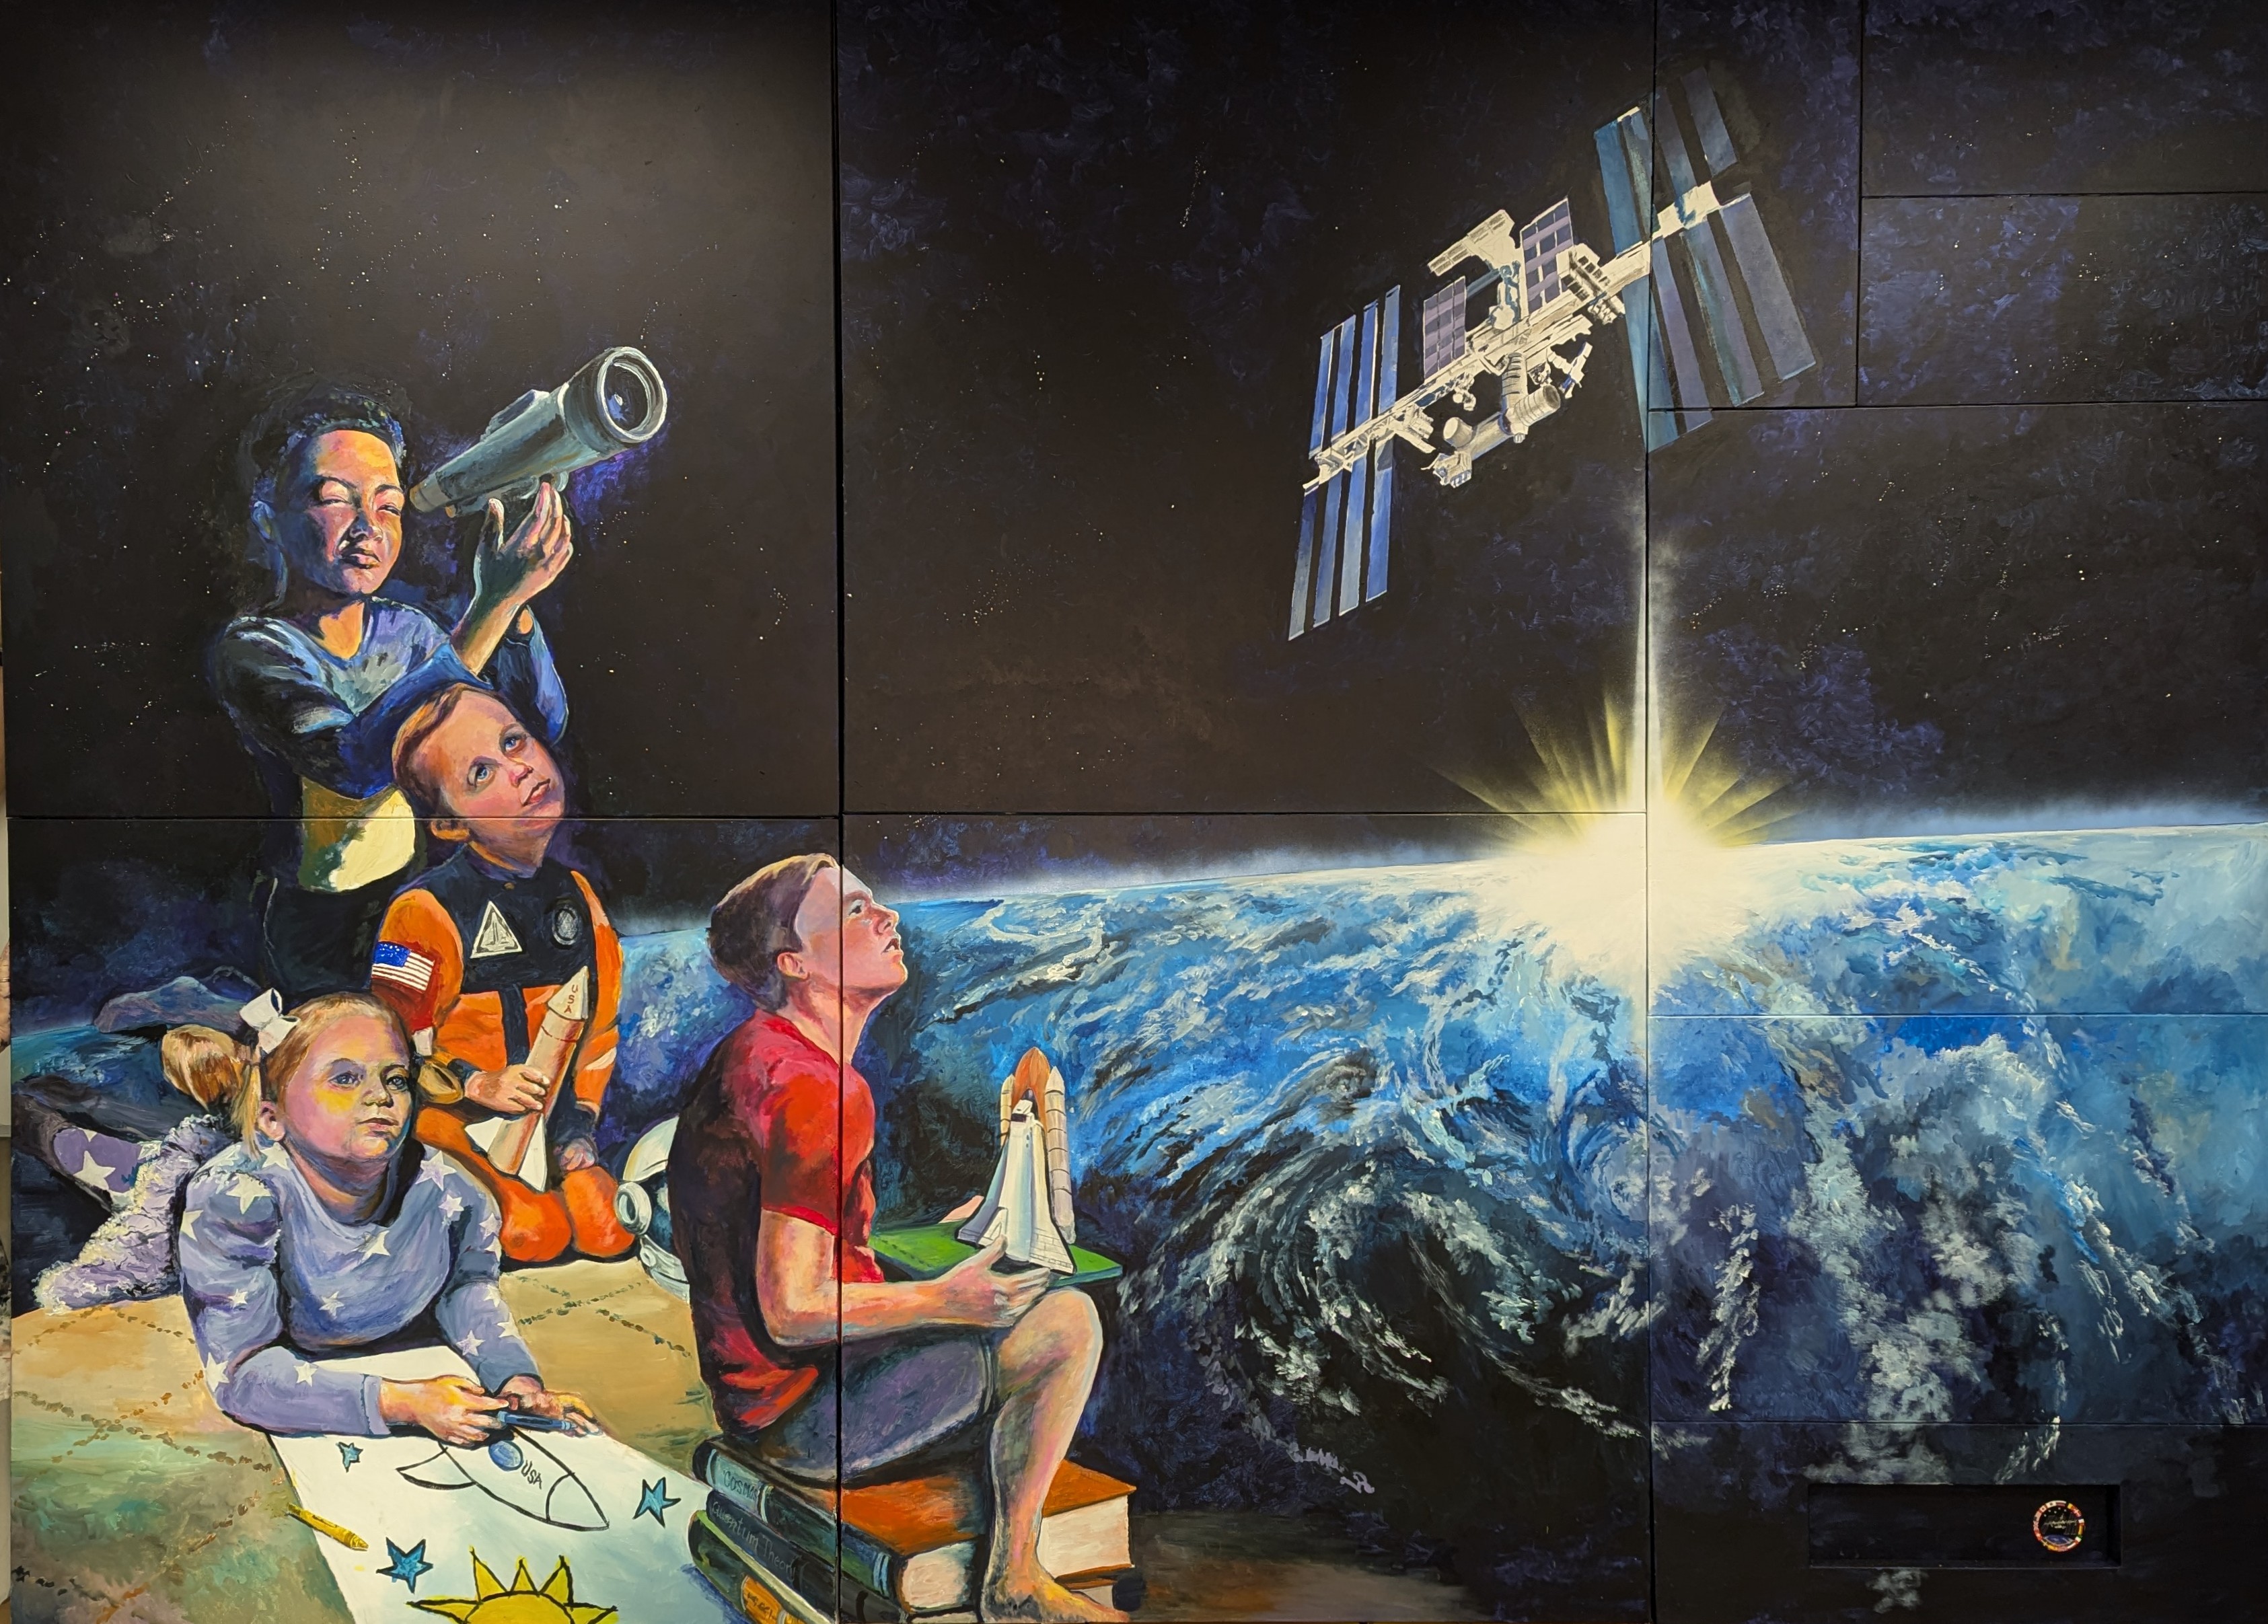
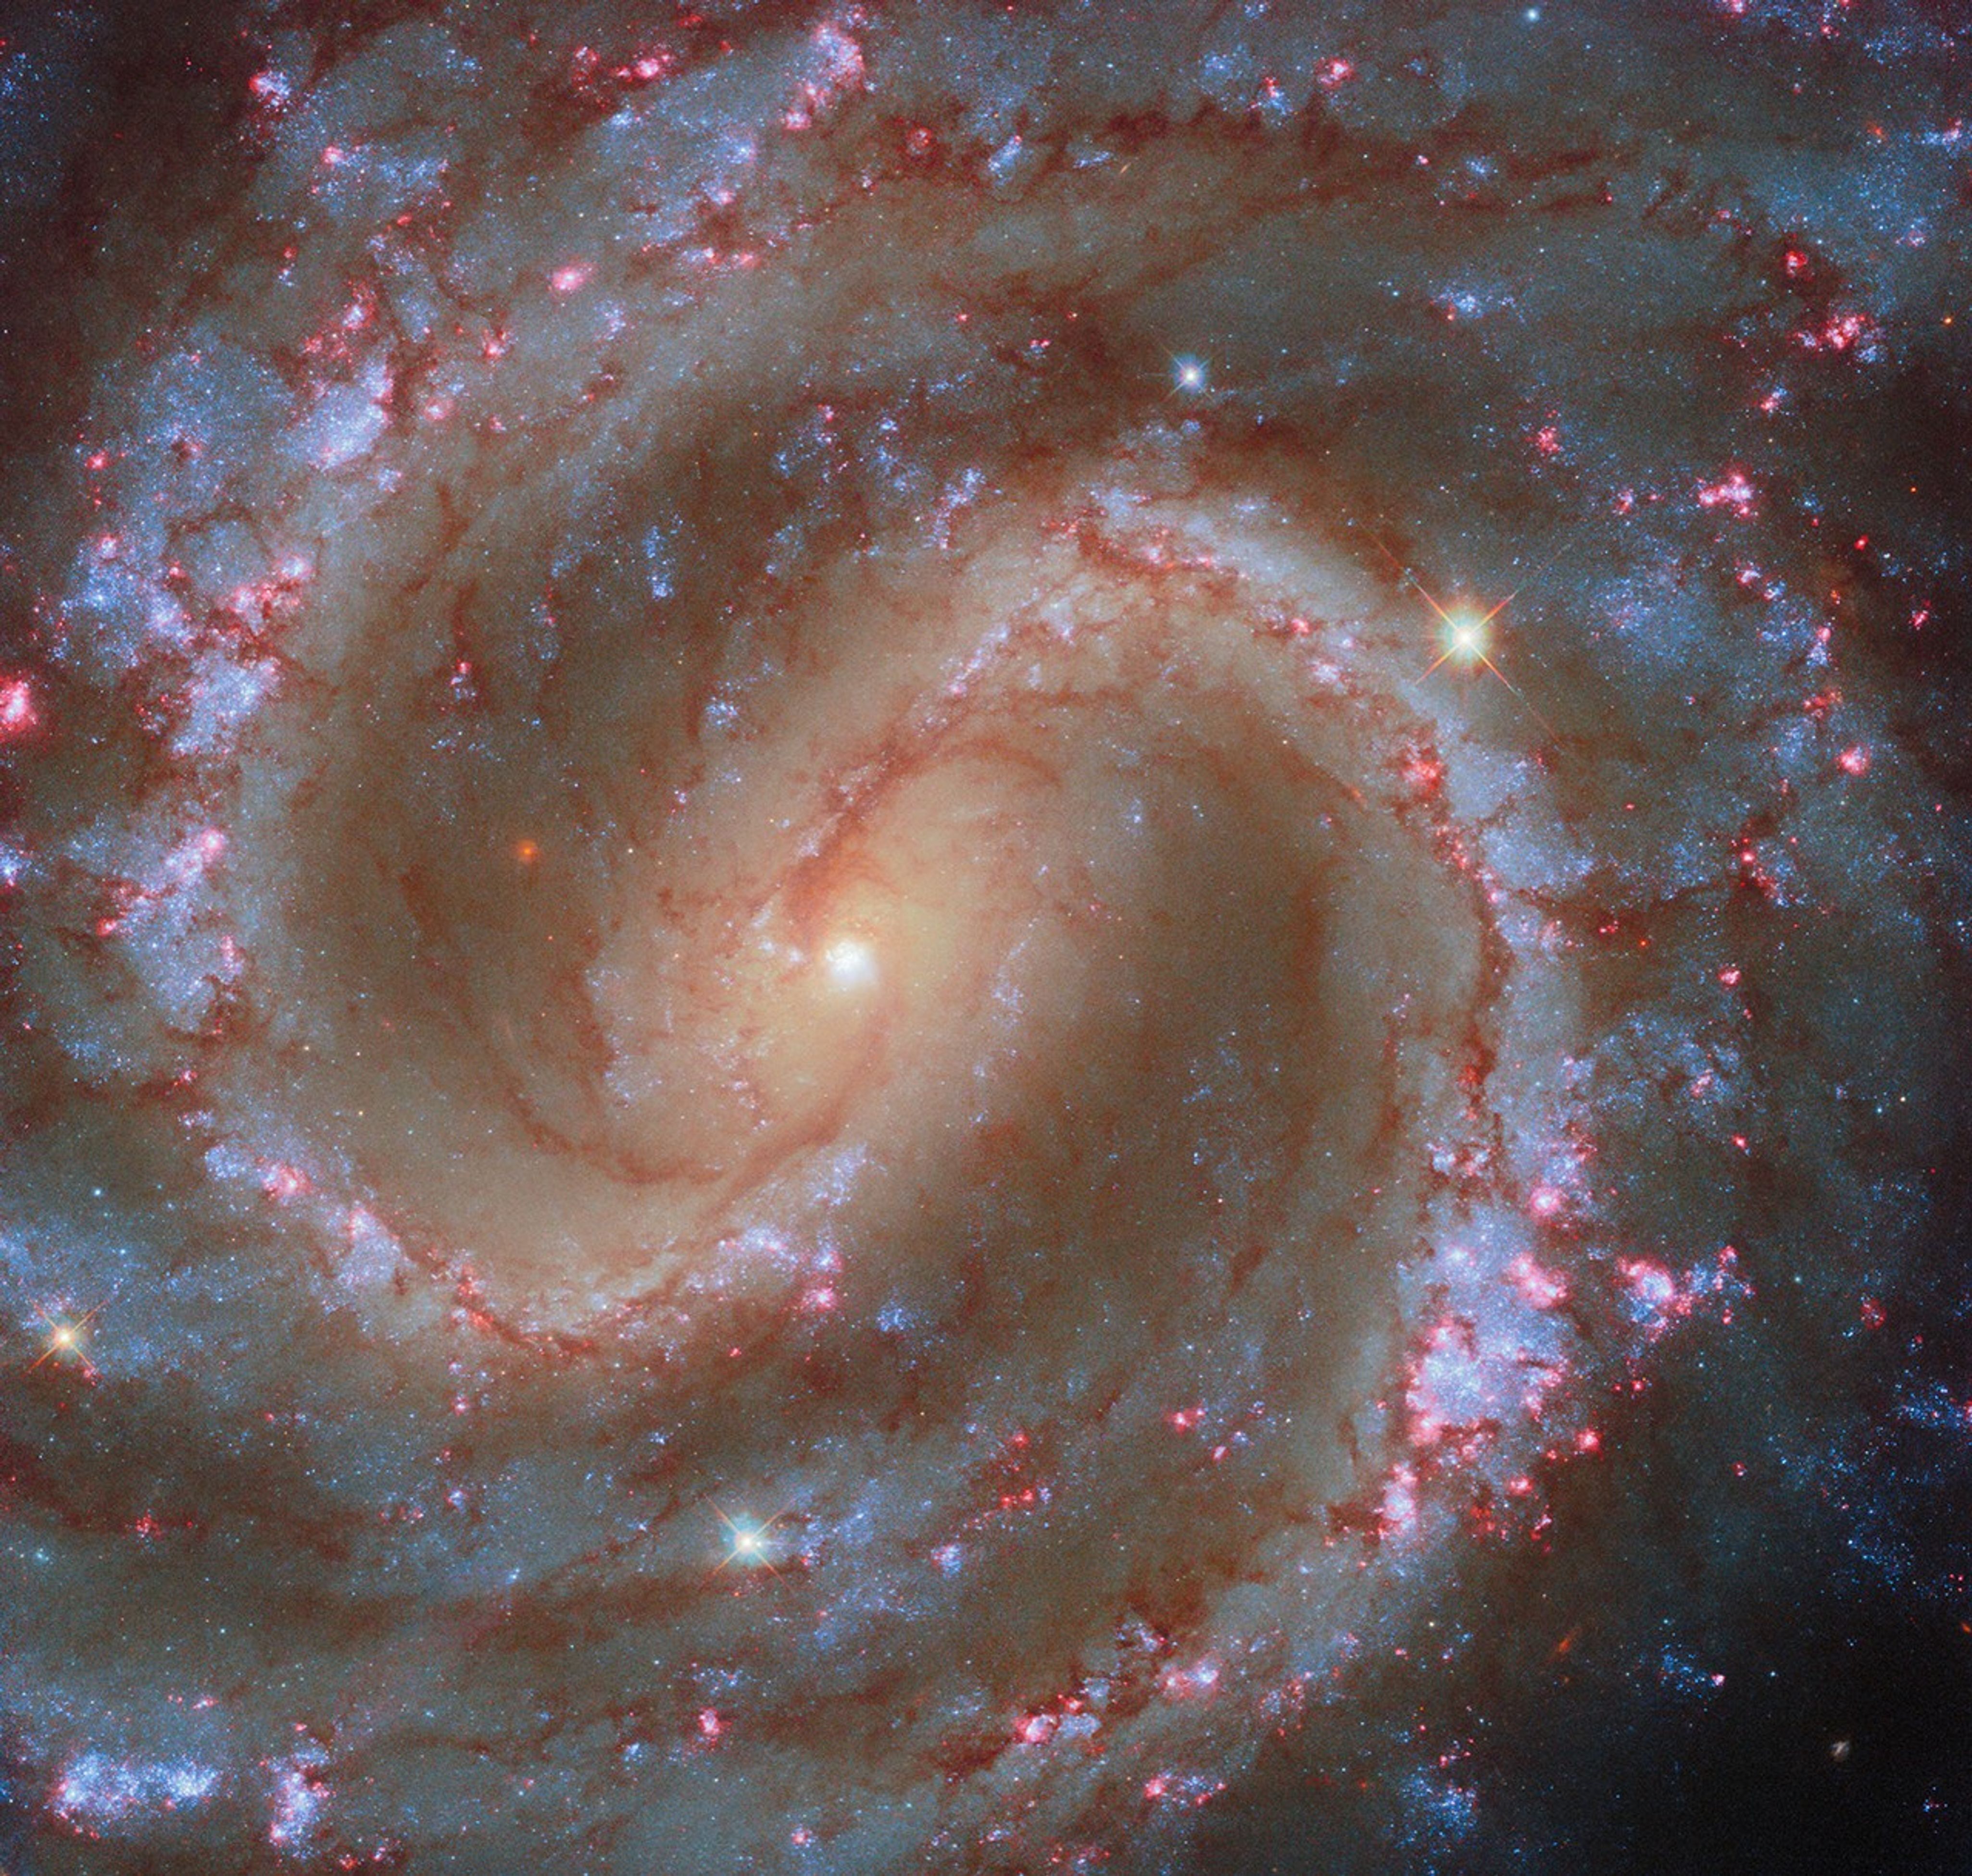
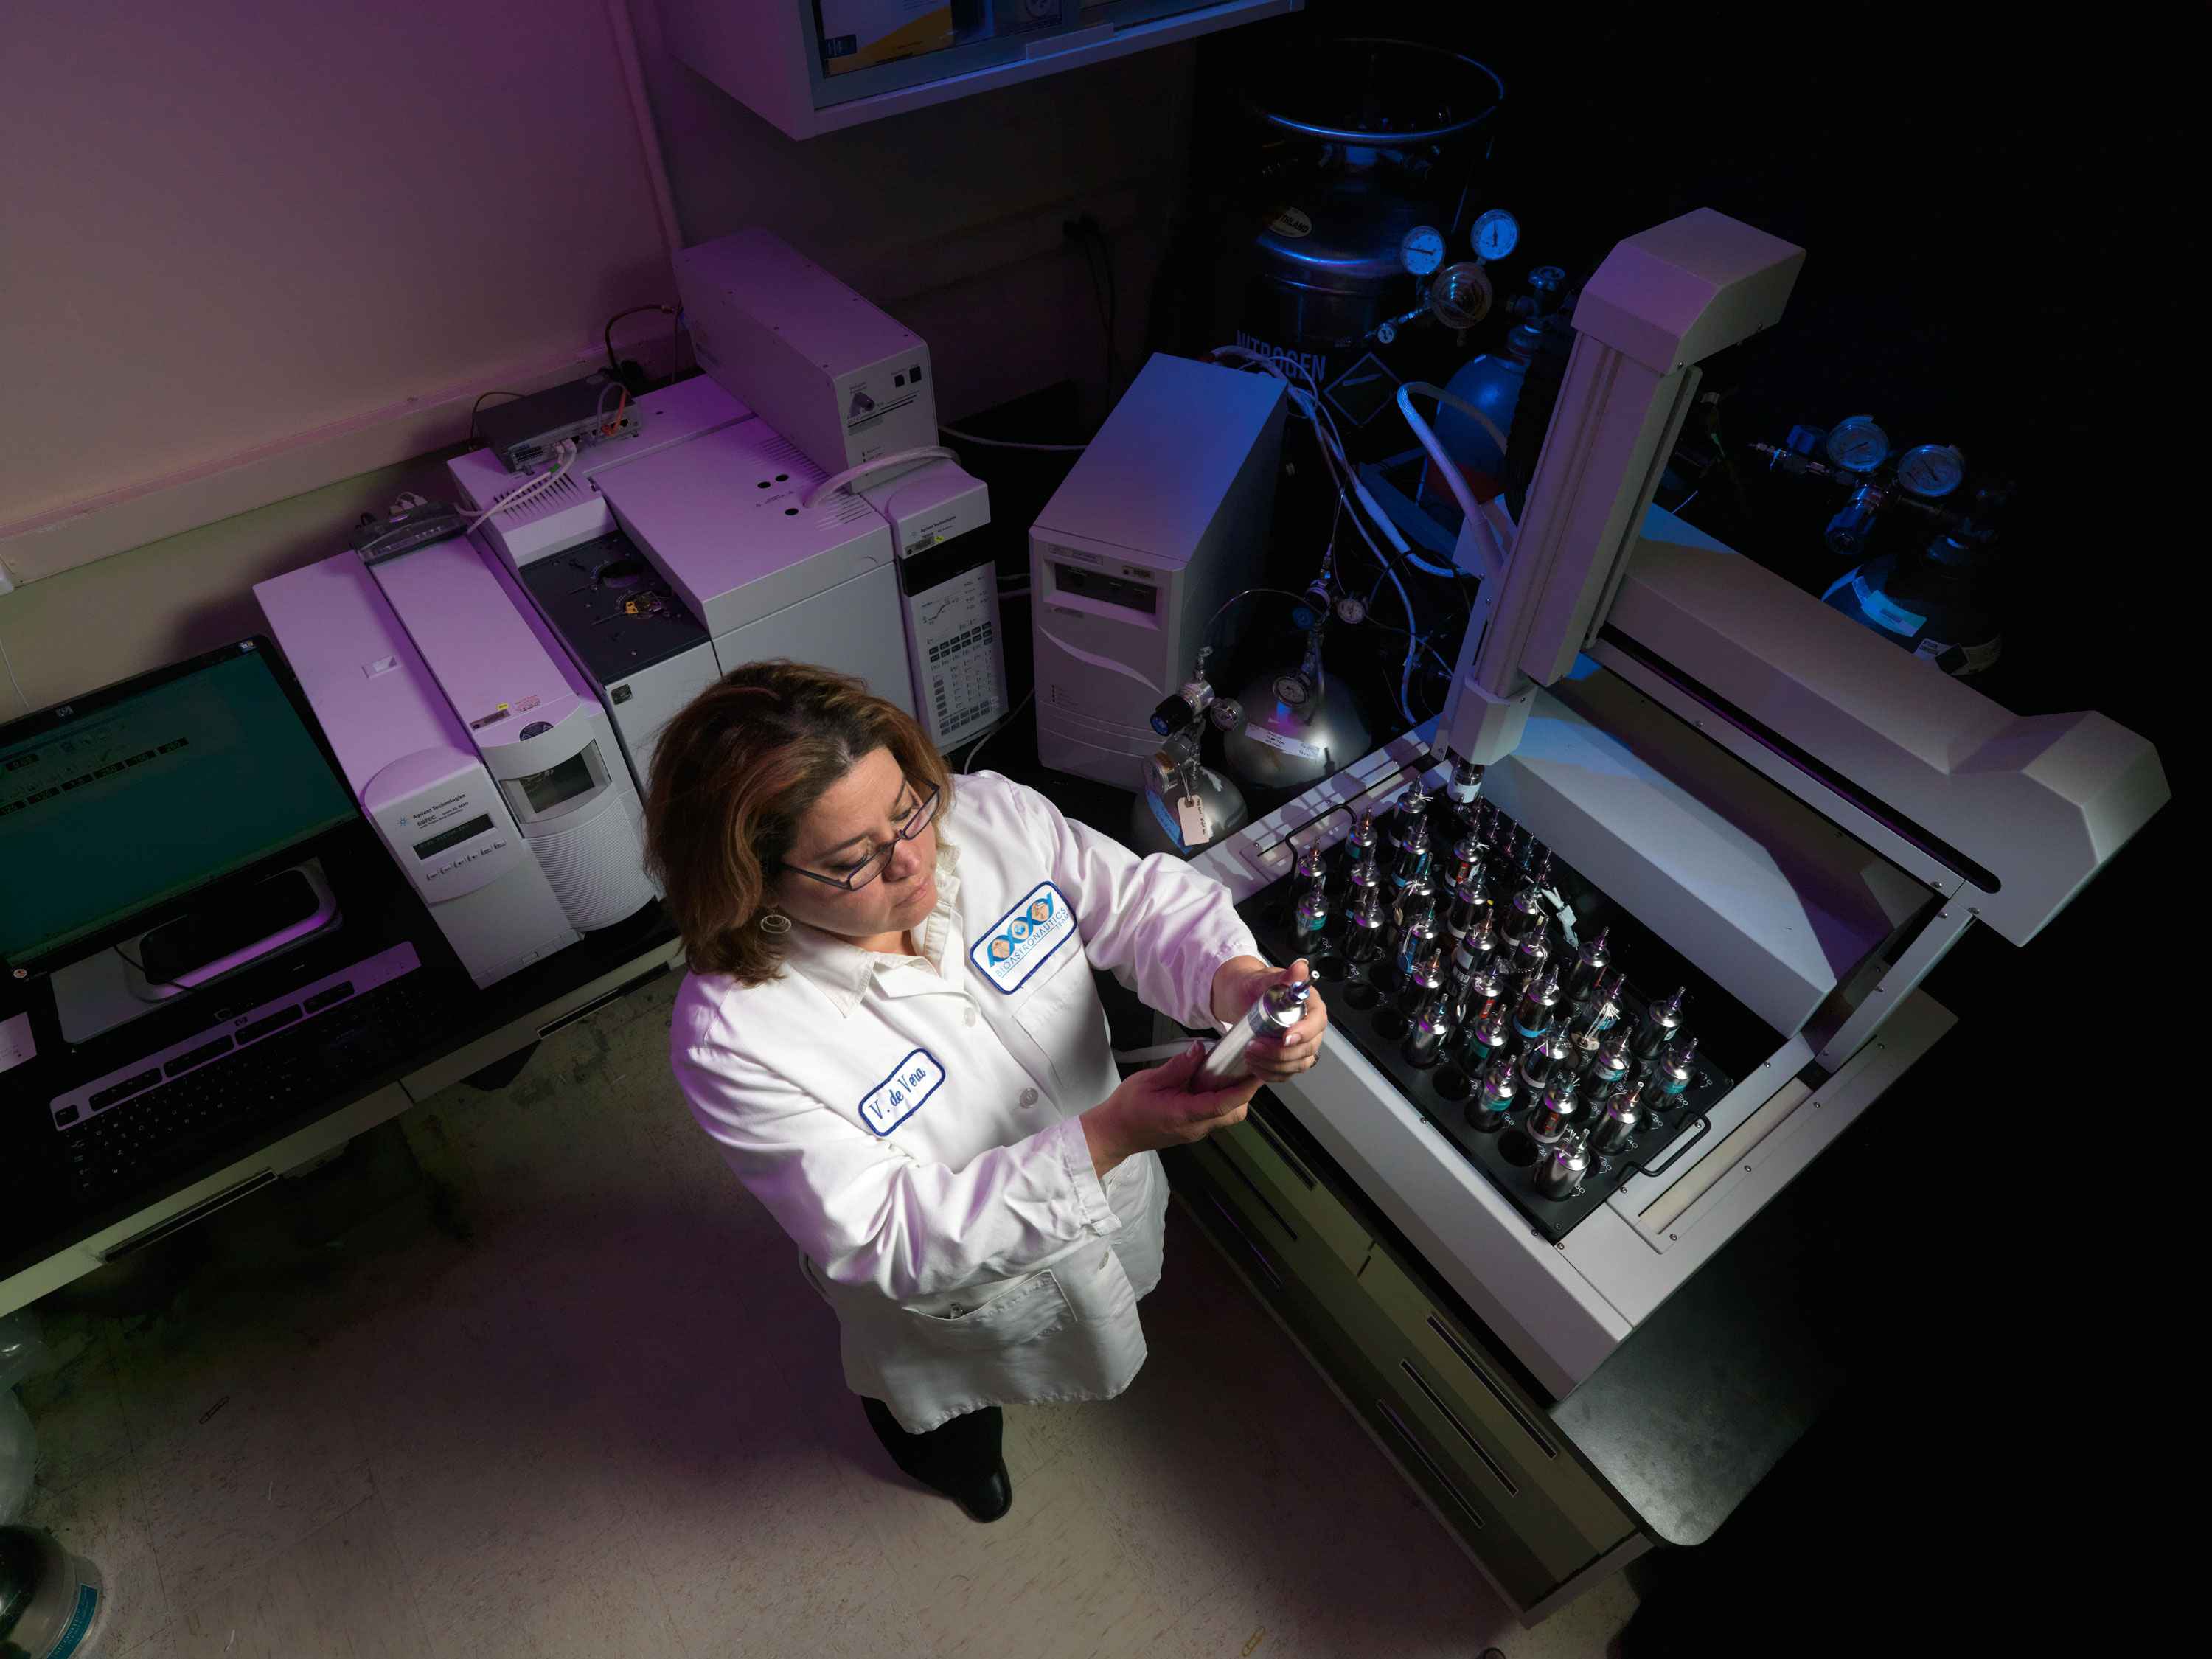
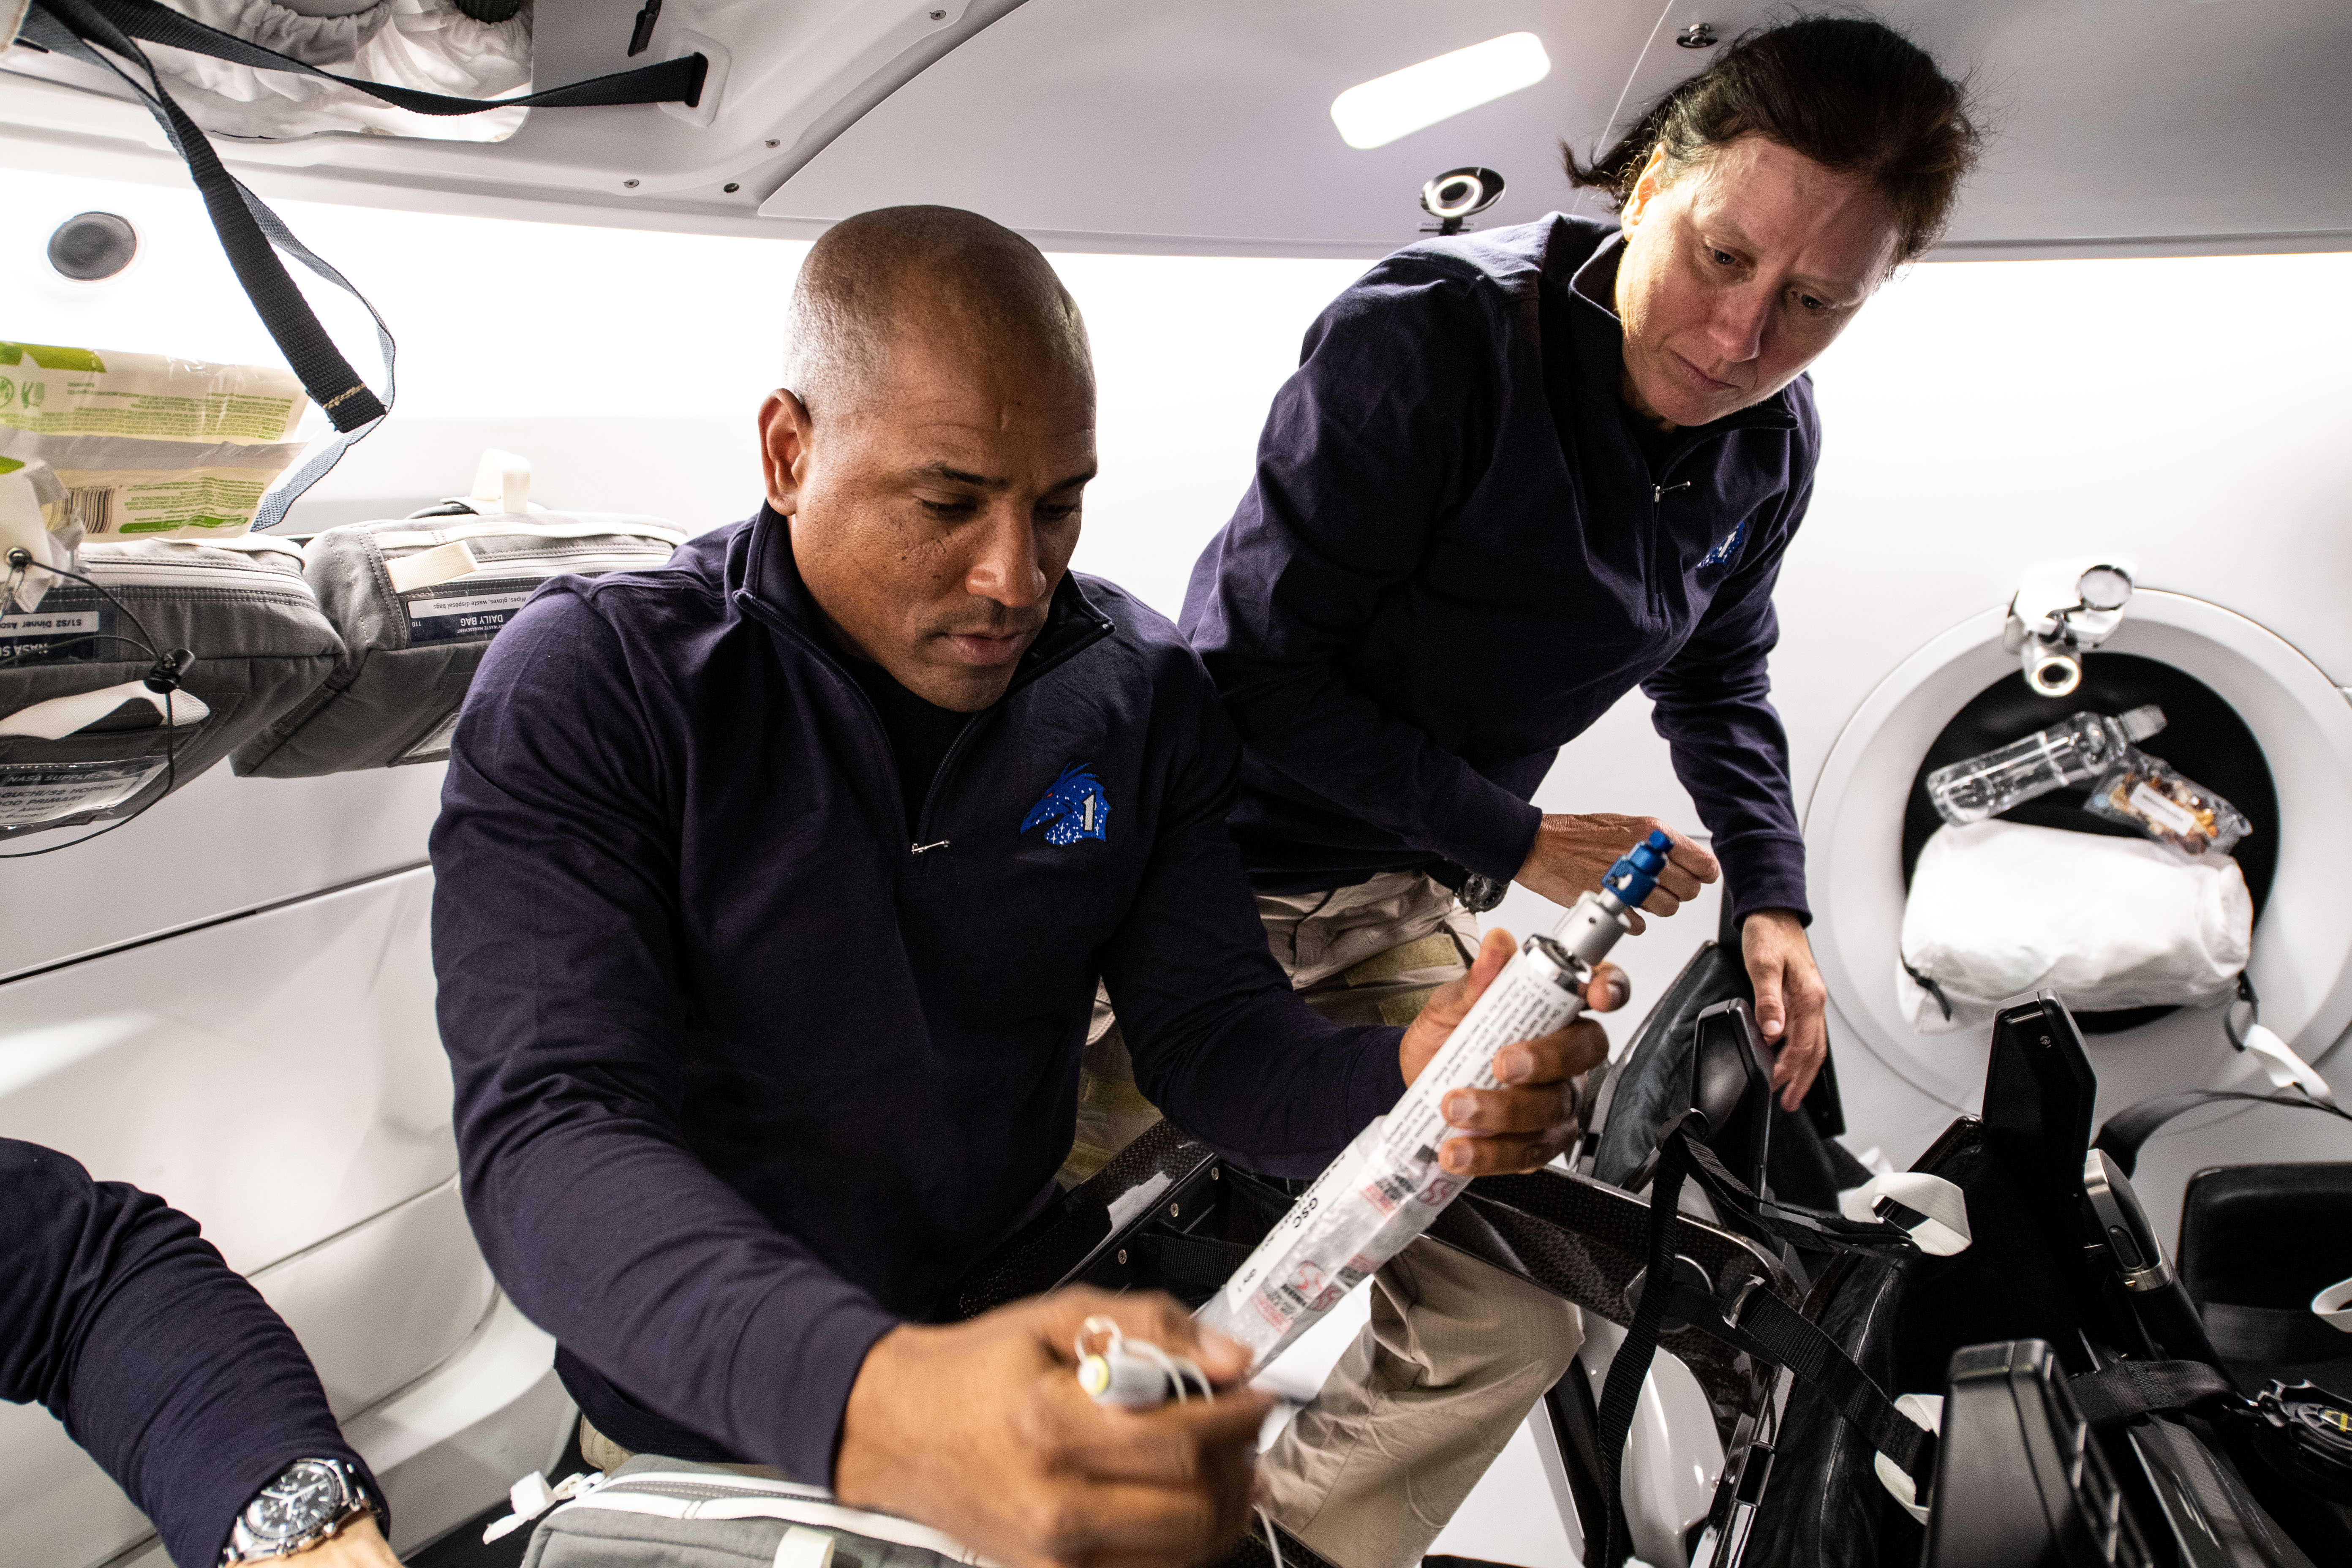
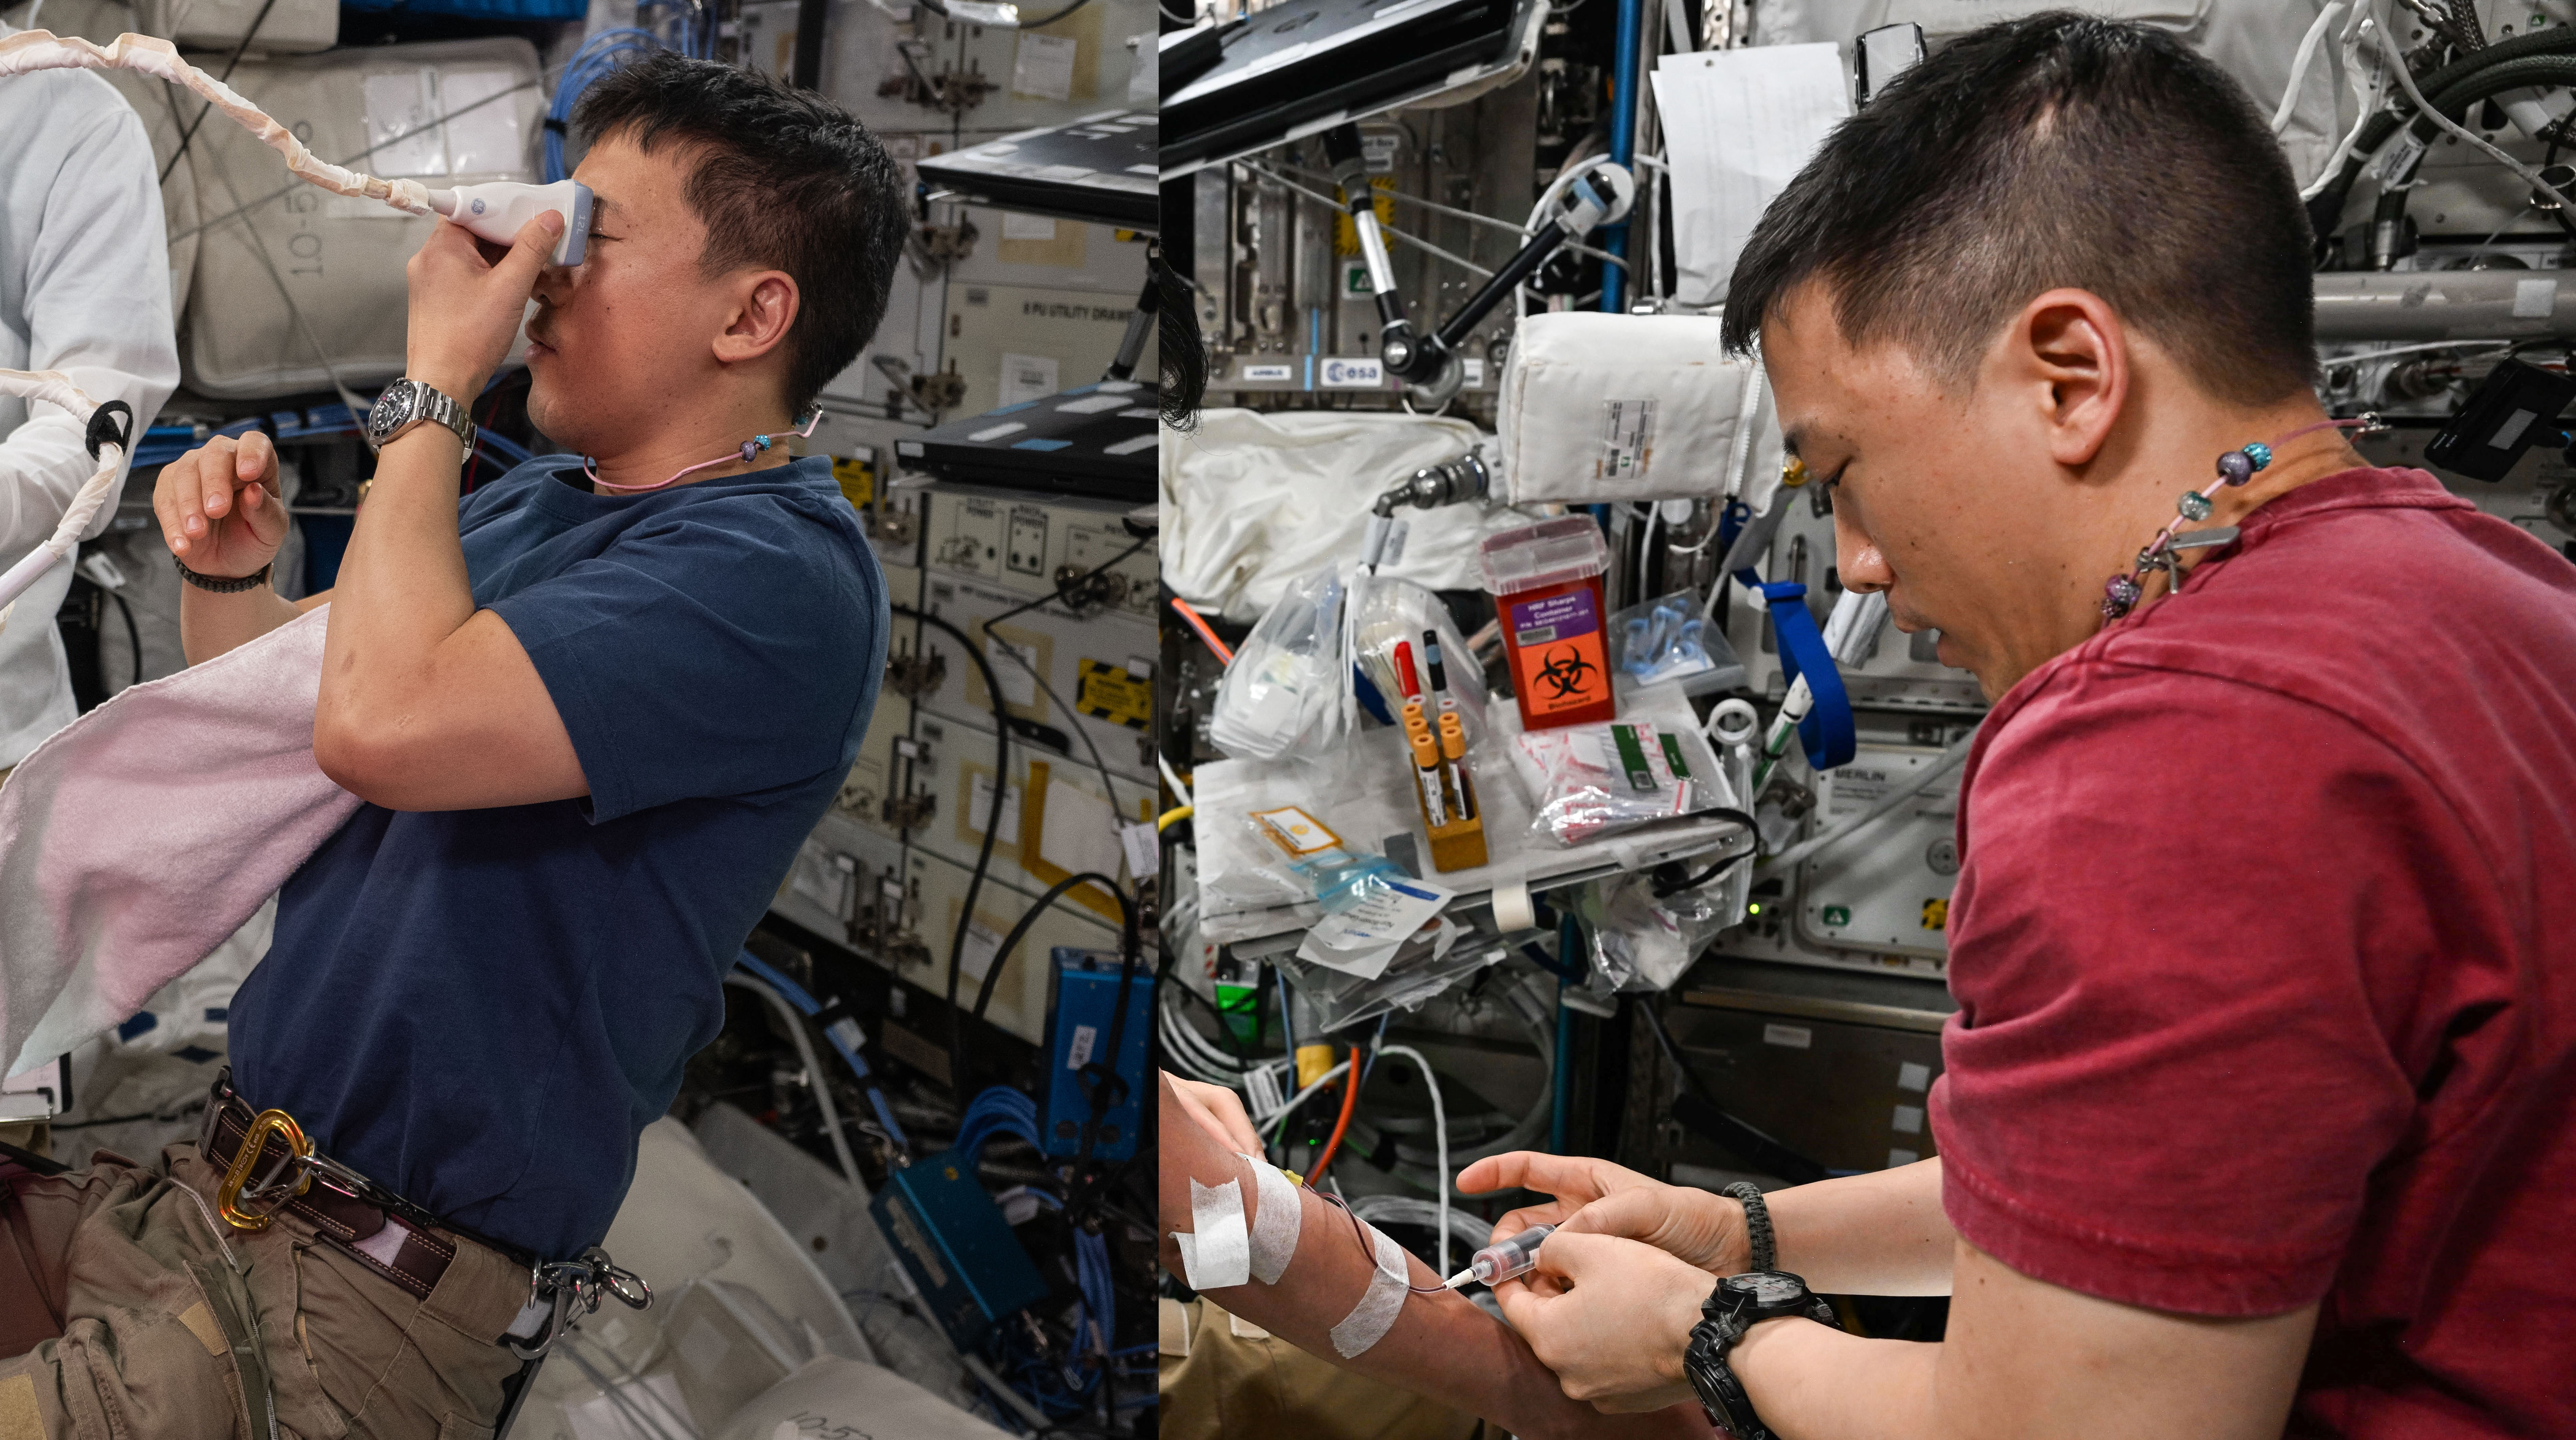
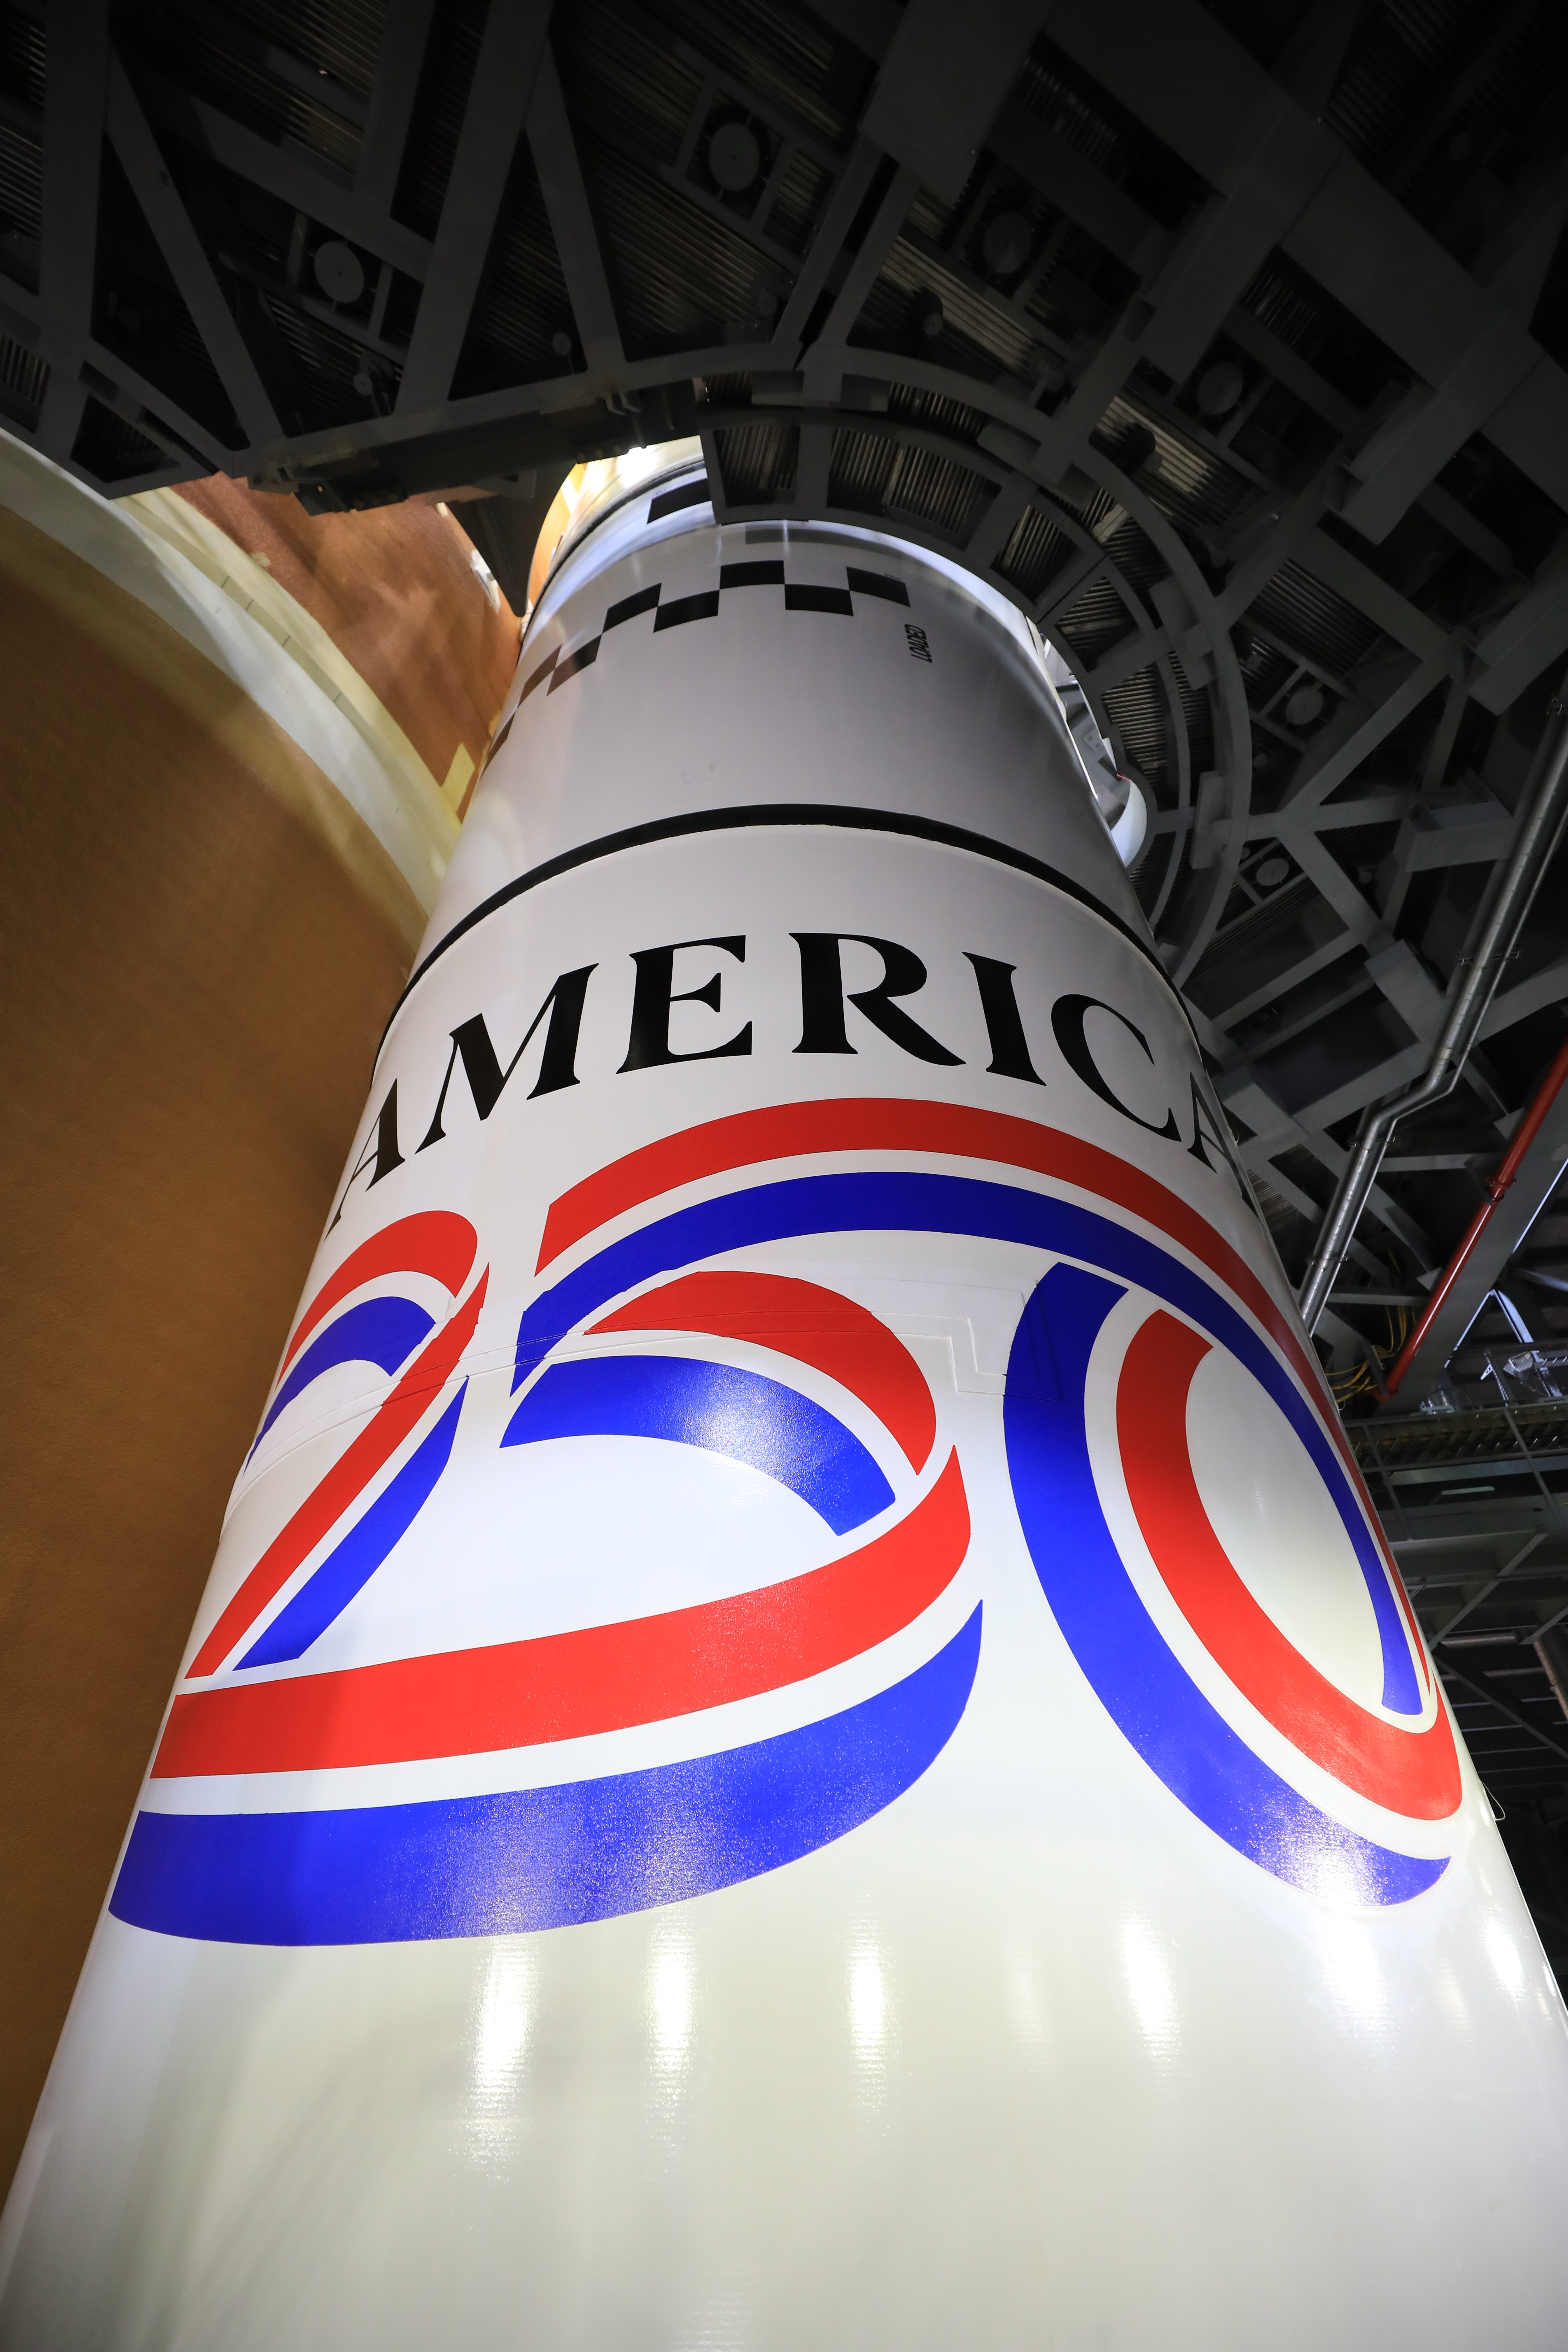
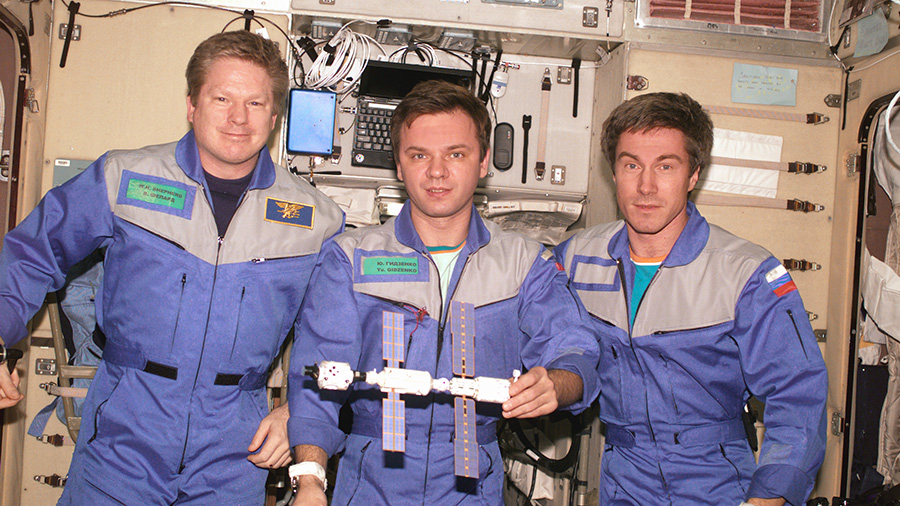
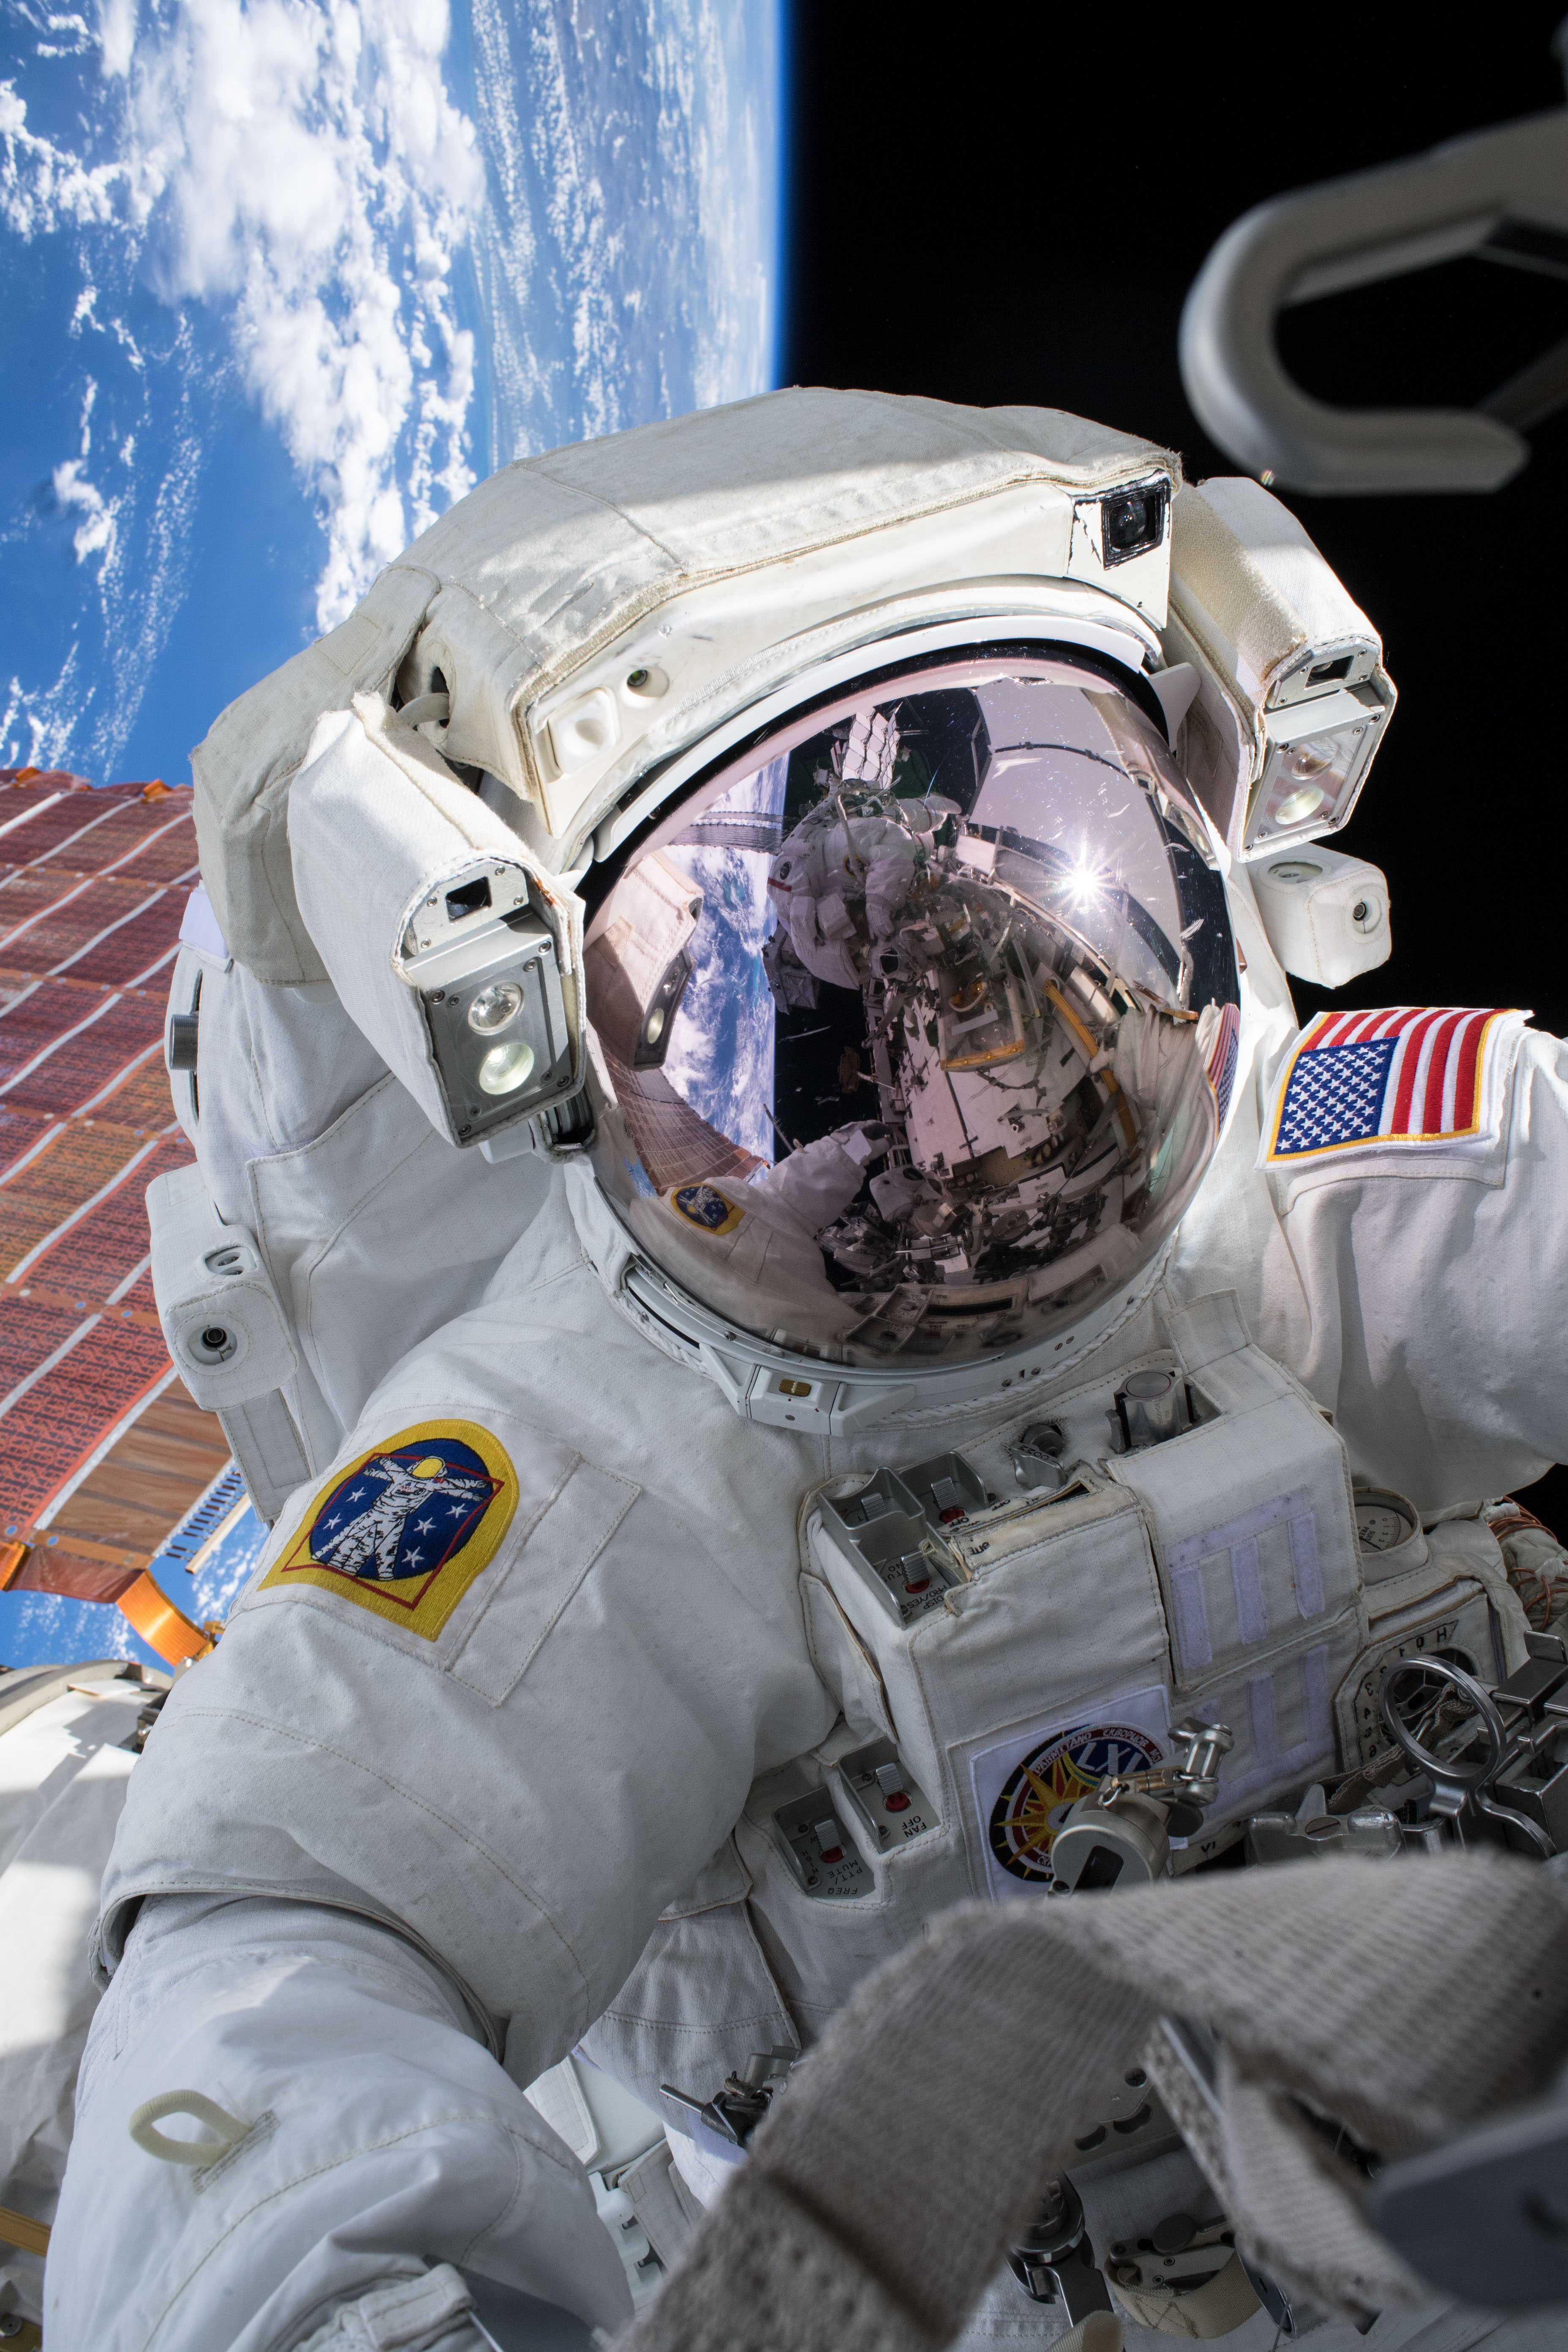
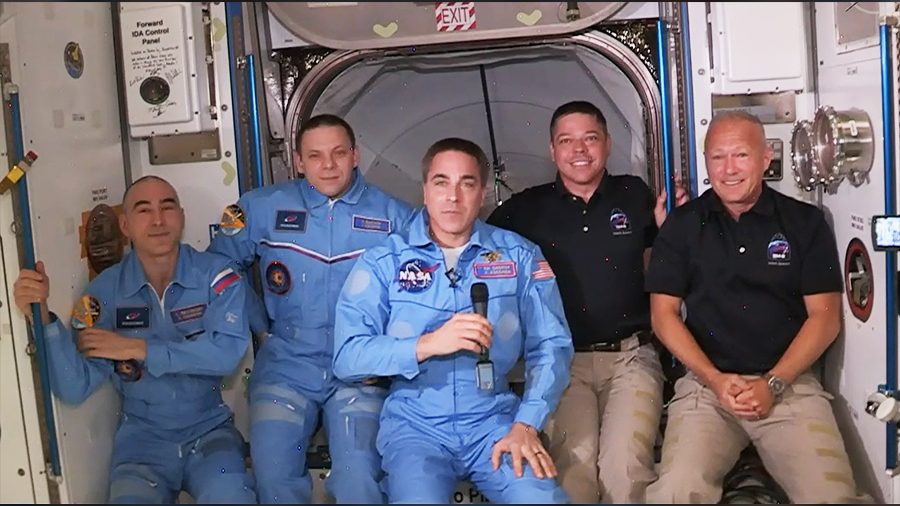
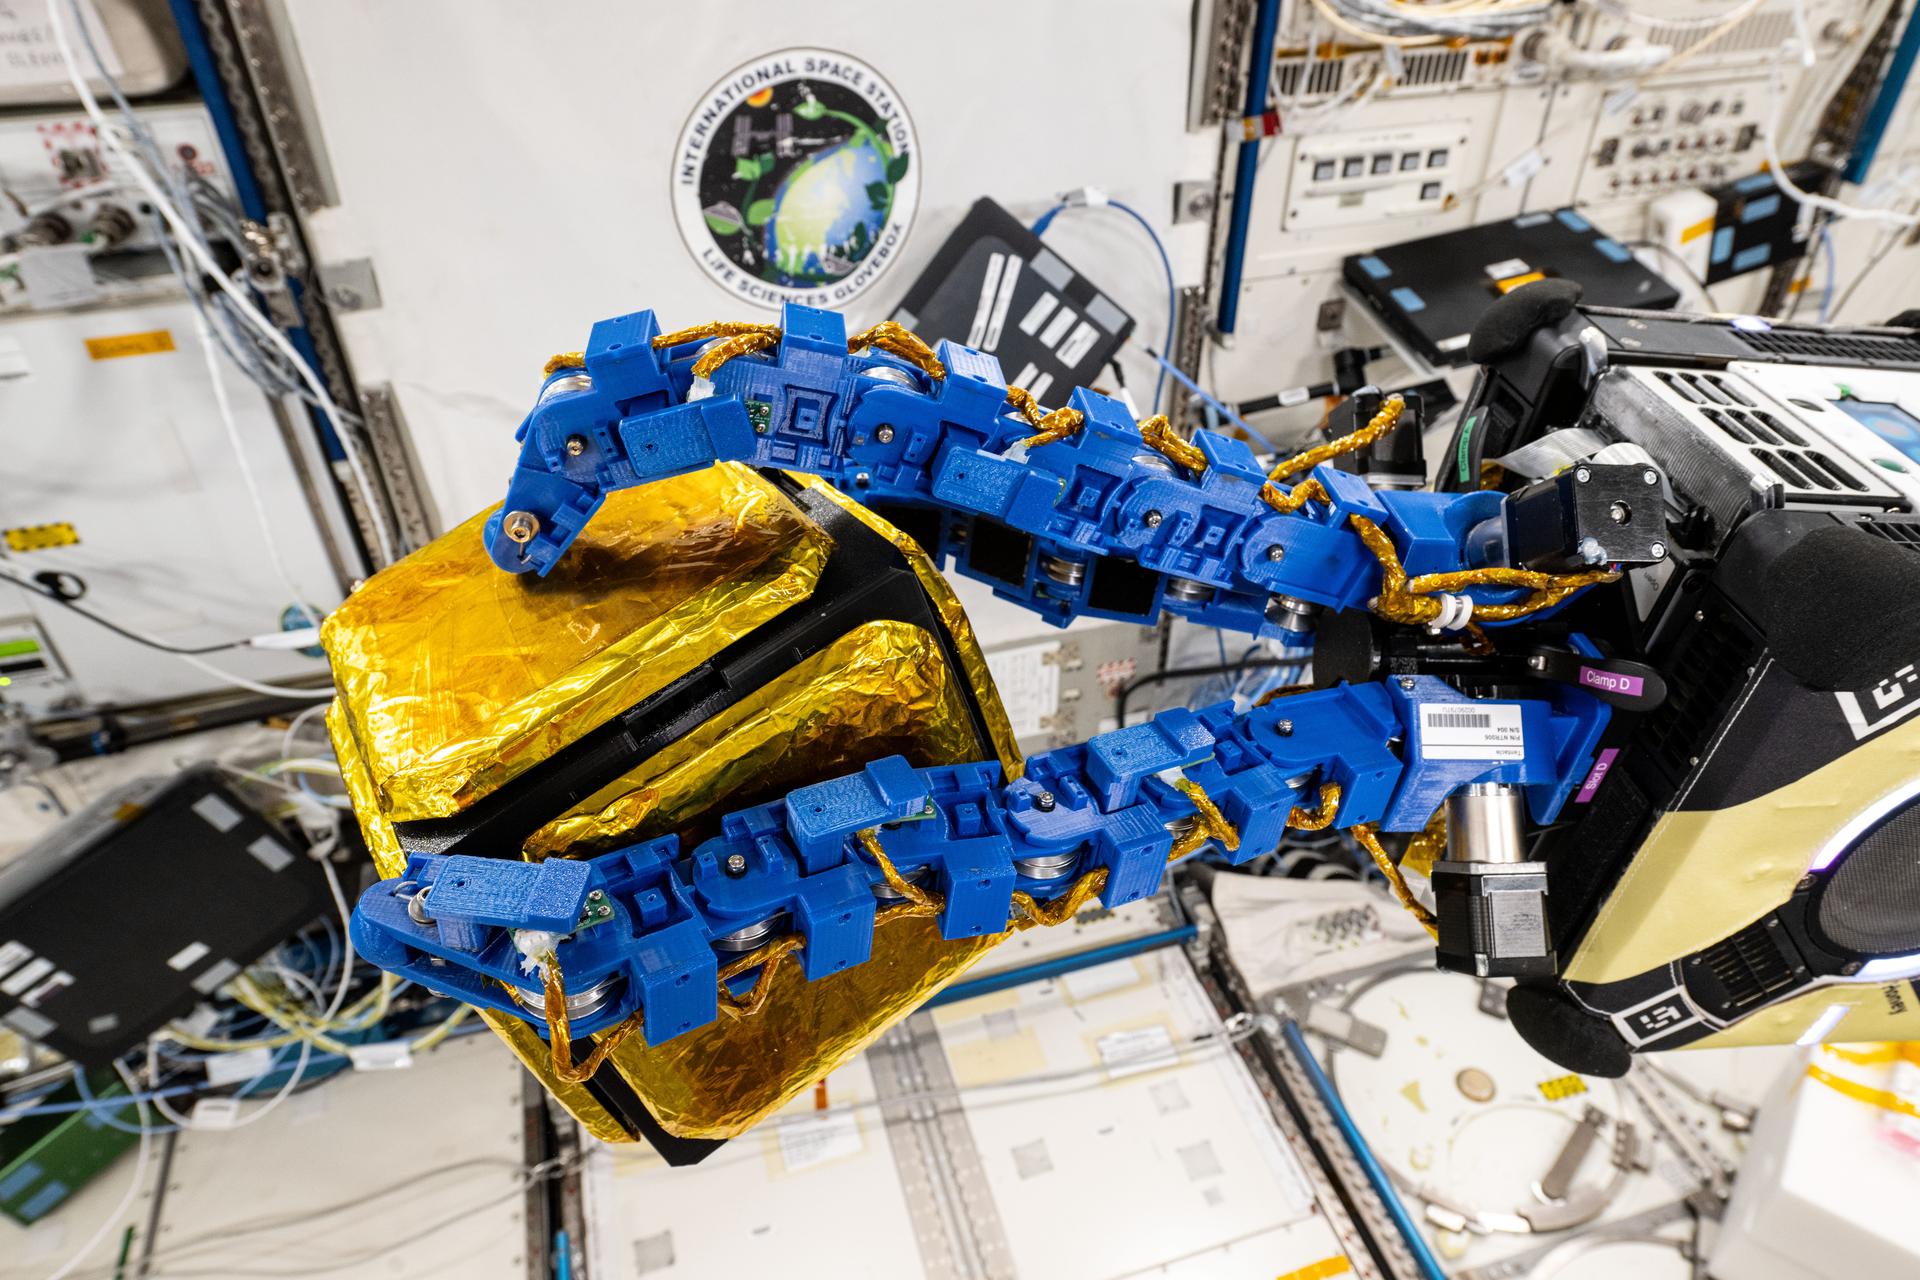
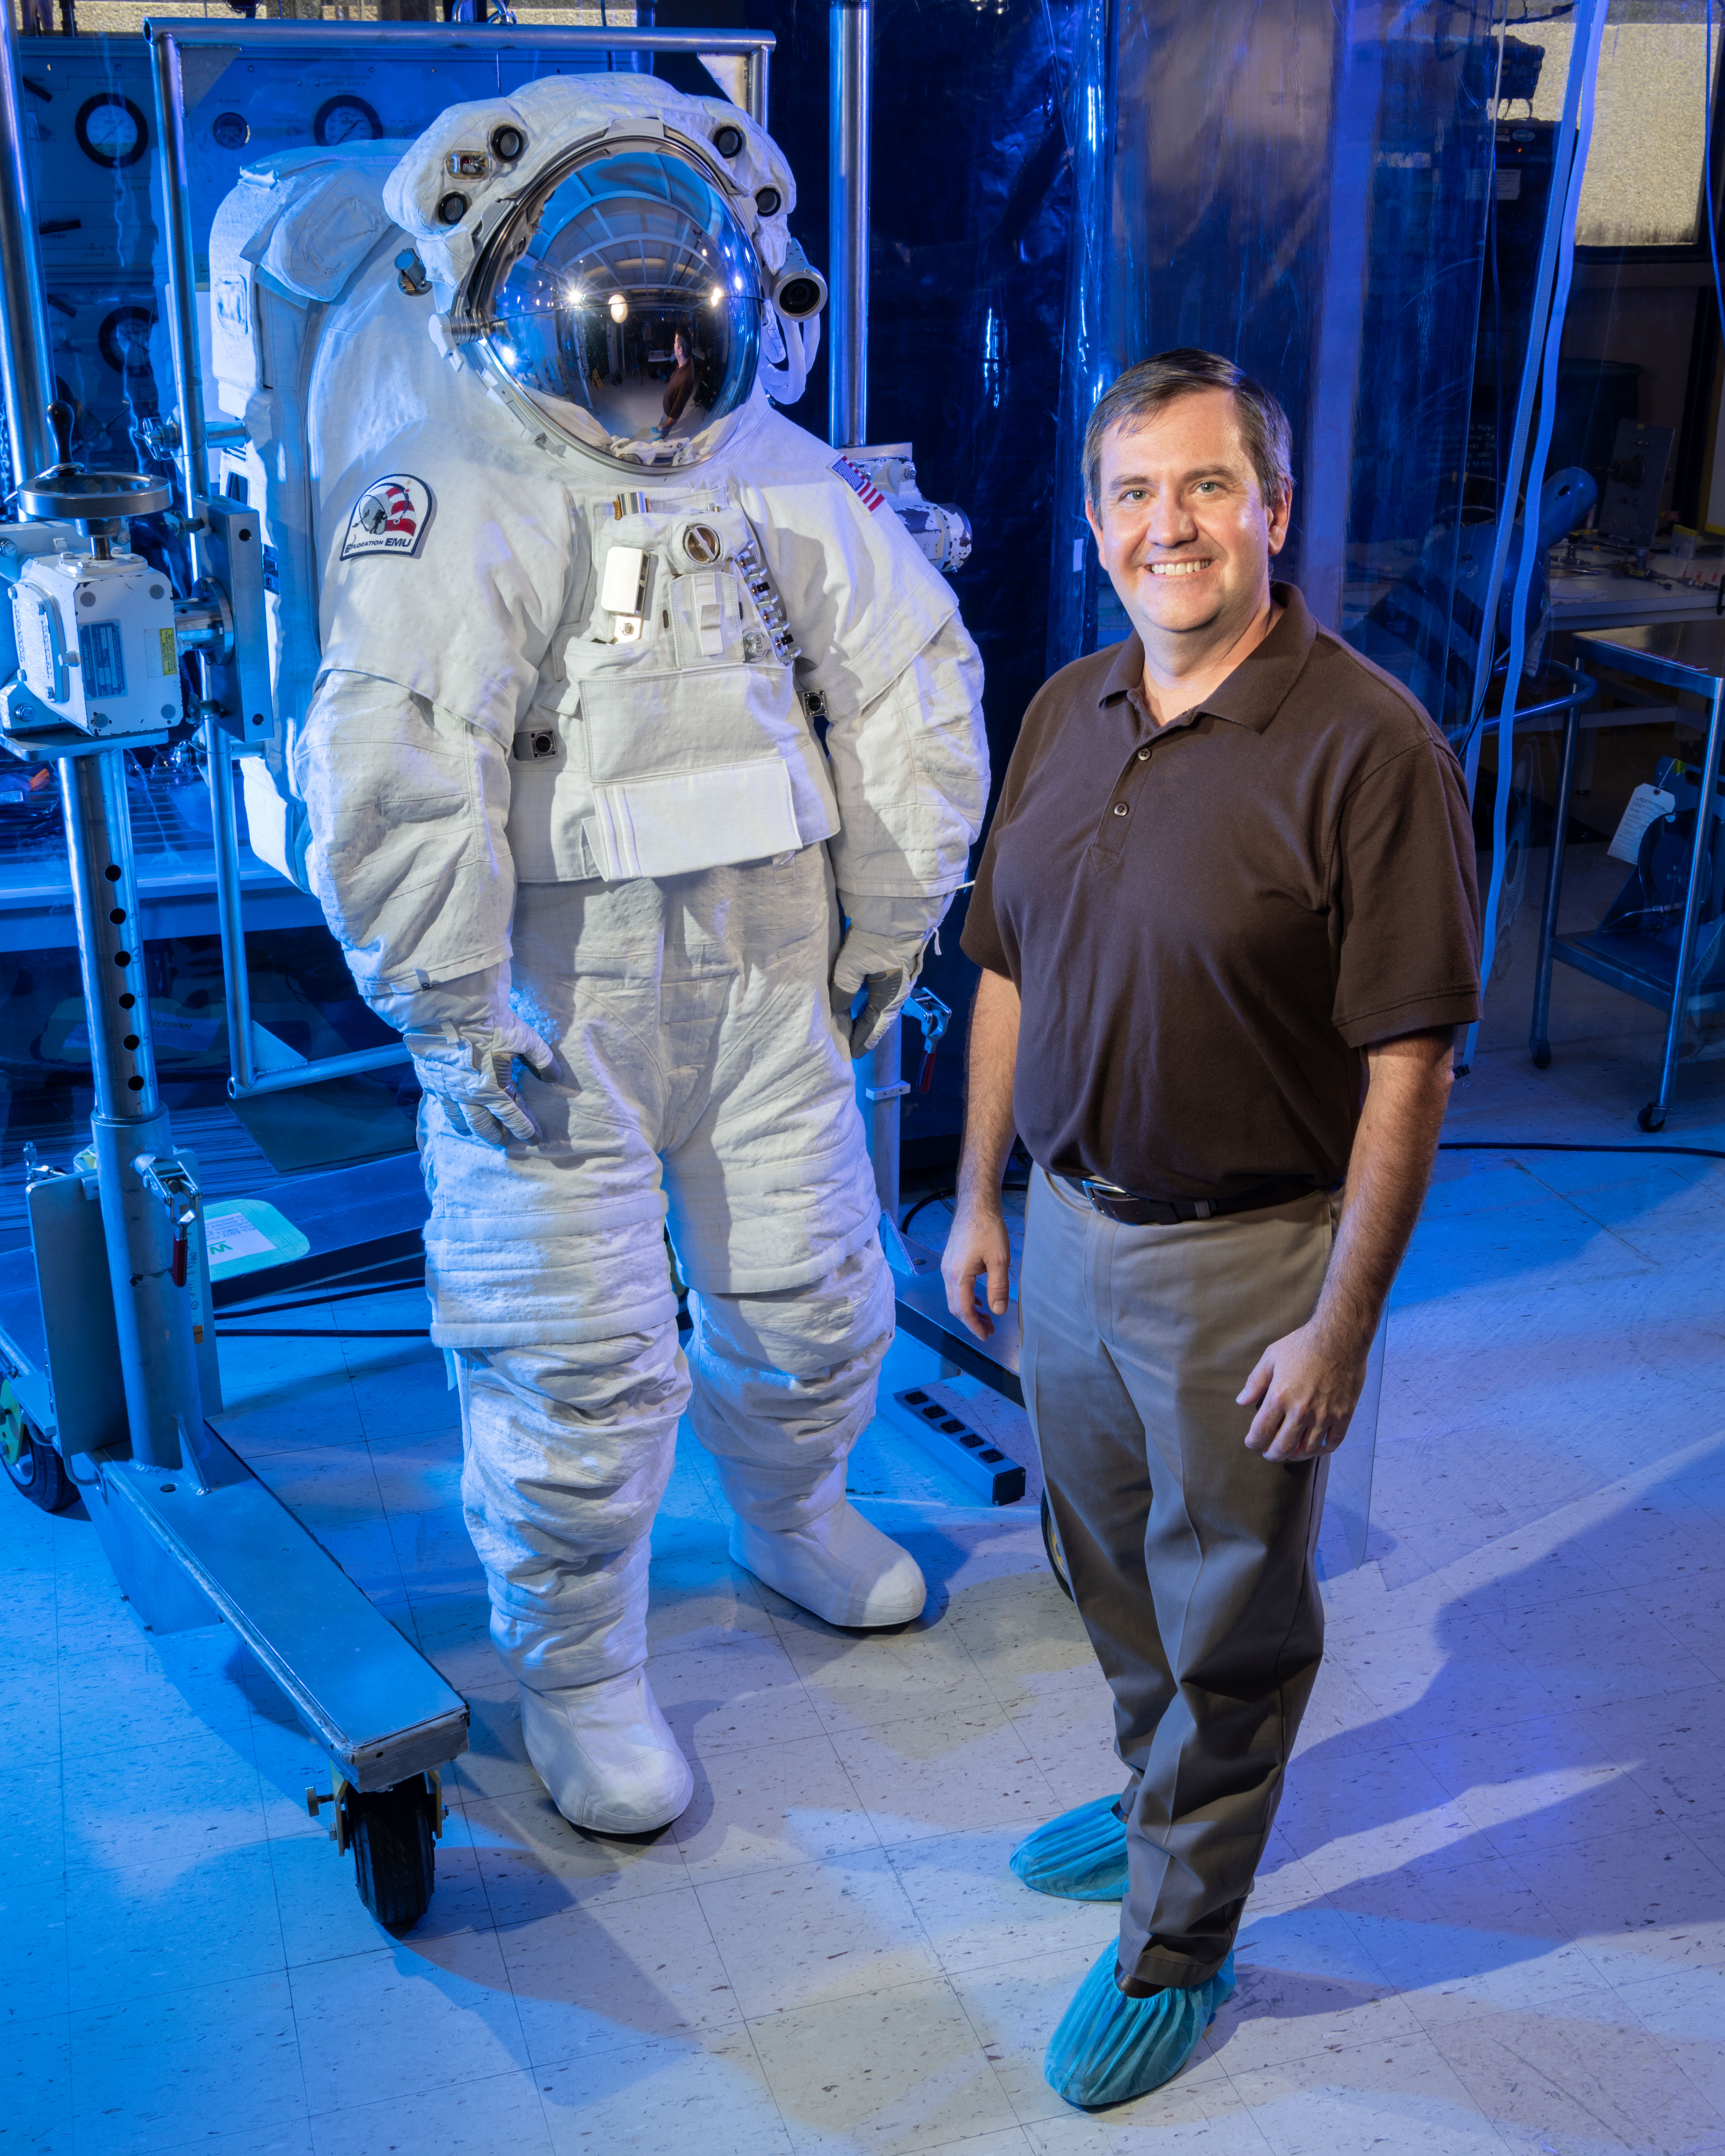
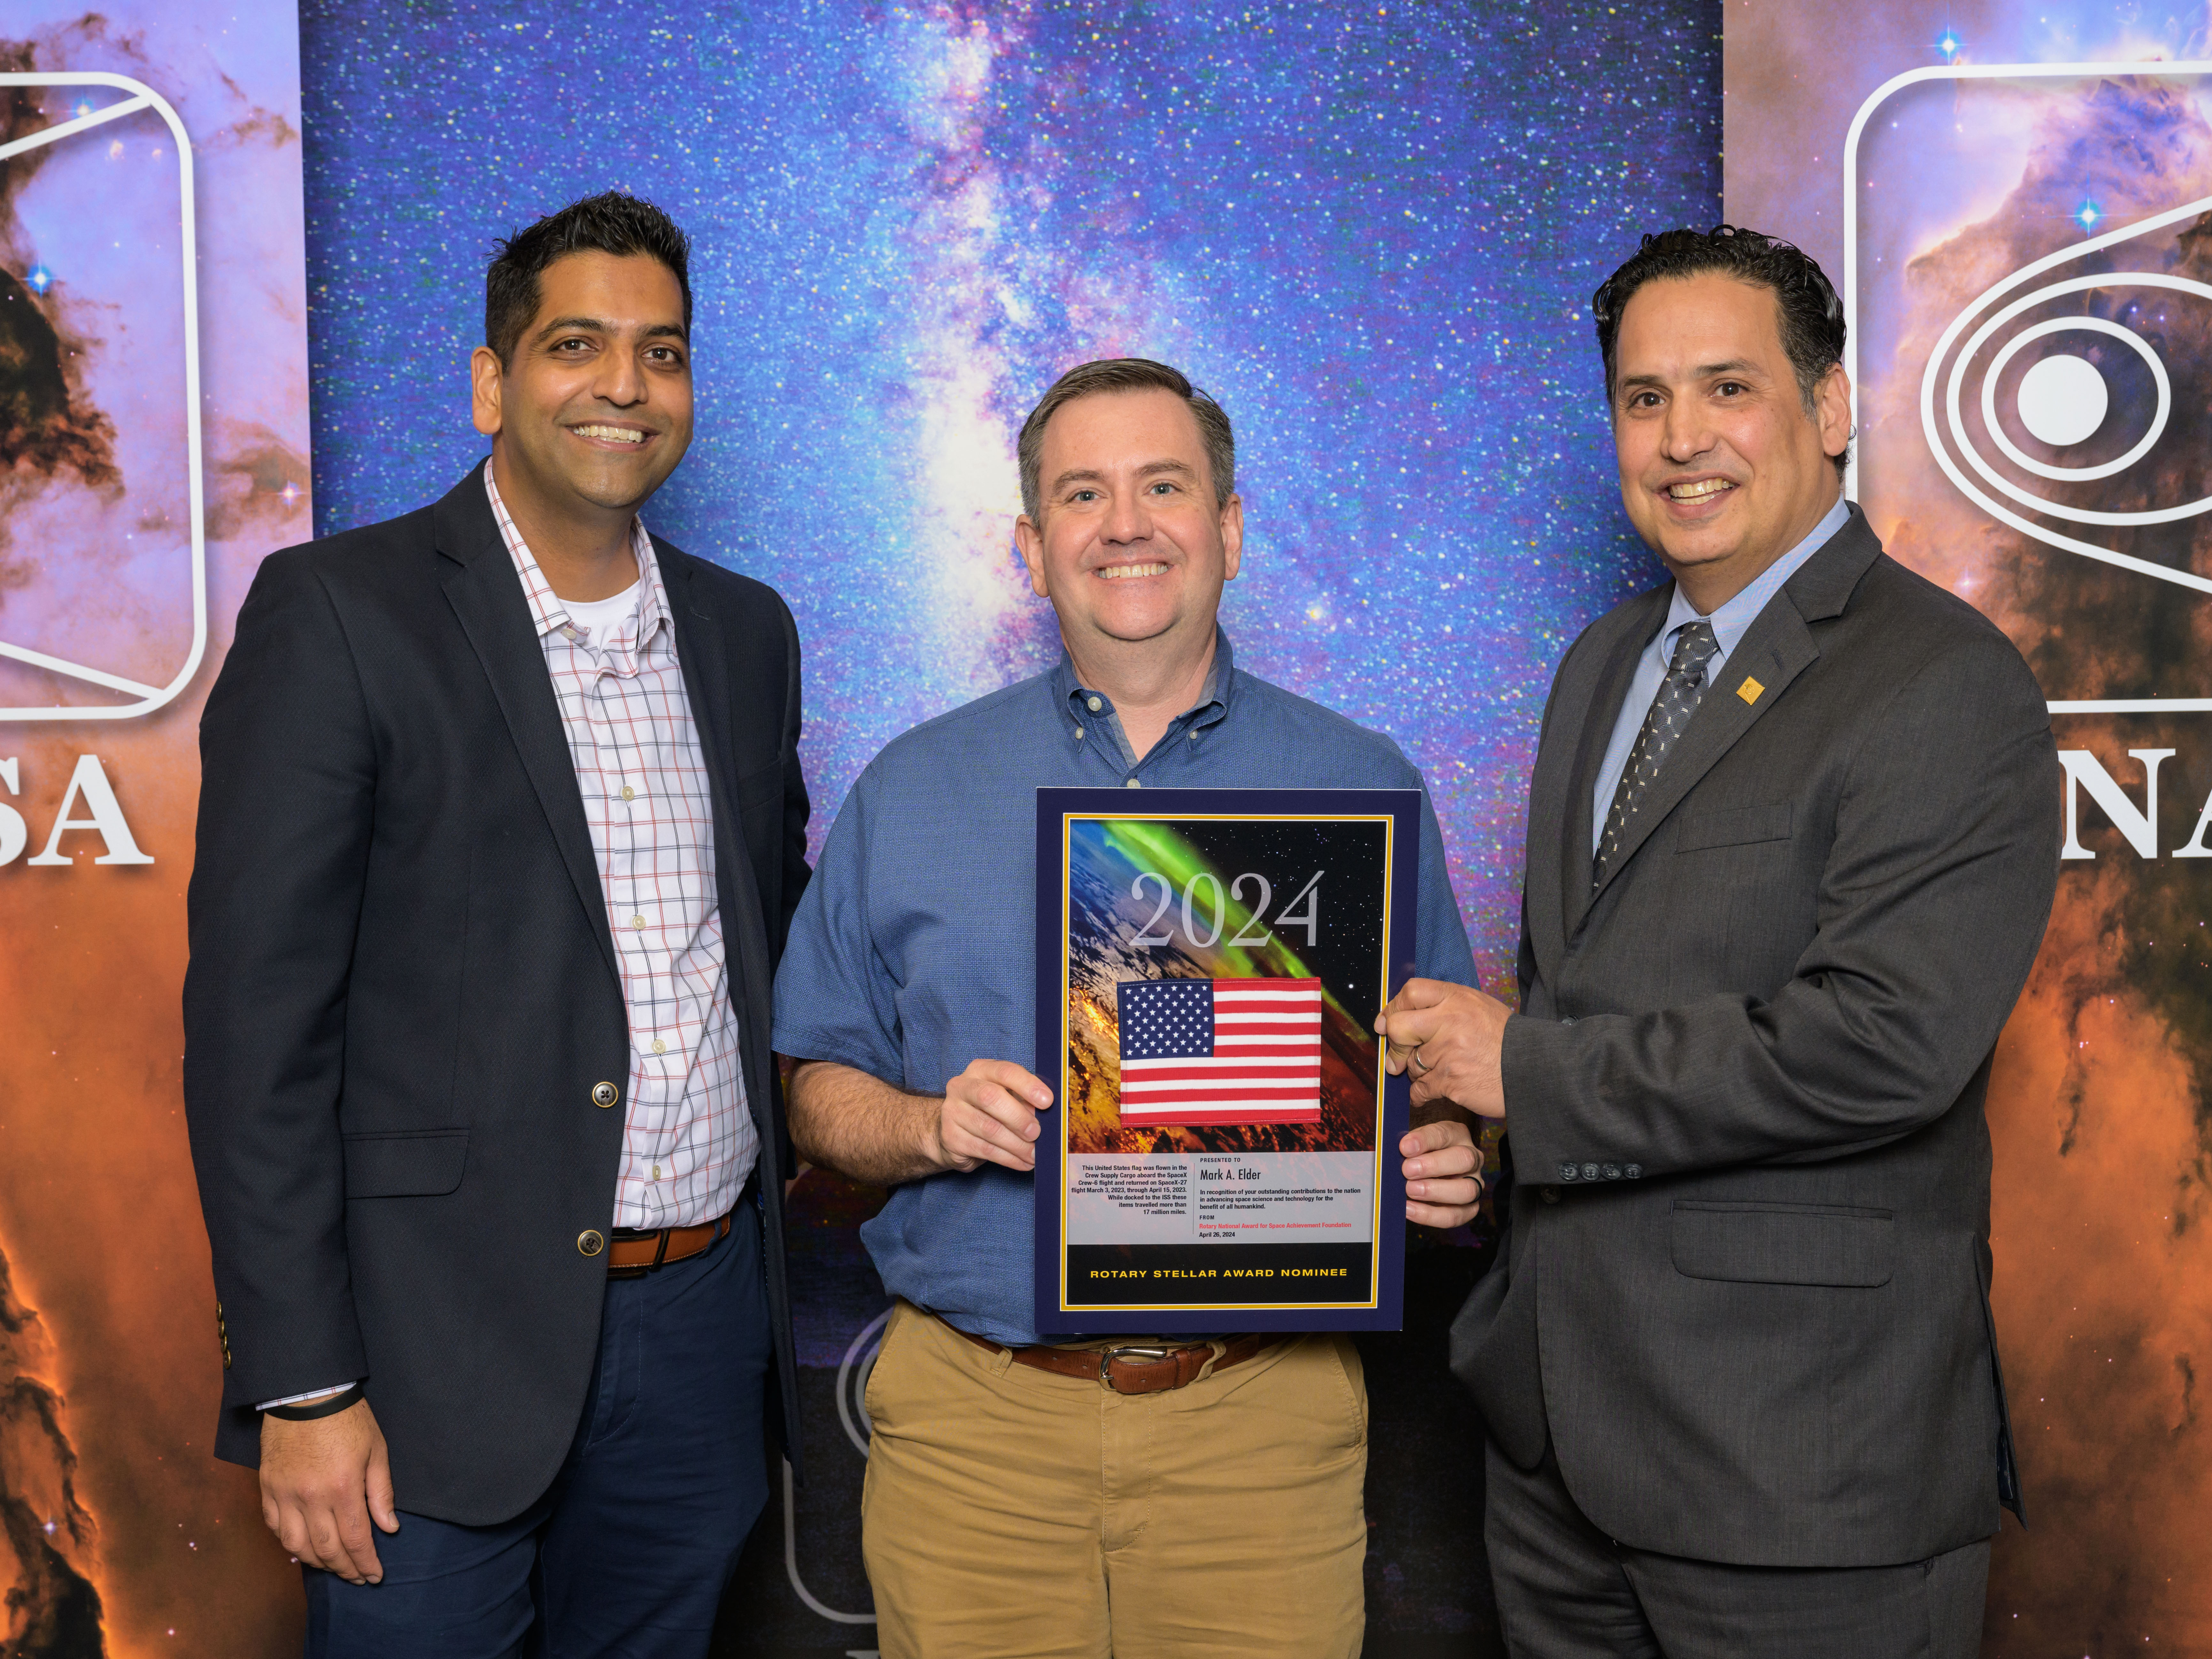