
Feed aggregator
Could natural hydrogen from underground help the UK get to net zero?
Webb Sees the Galaxies that Cleared Out the Cosmic Fog
The early universe was shrouded in darkness. Just hundreds of millions of years after the Big Bang, a thick fog of hydrogen gas choked the cosmos, blocking light from traveling far. At some point, this gas became ionized, stripped of its electrons. Thanks to the James Webb Space Telescope, astronomers have identified the culprit: low-mass starburst galaxies emitting huge amounts of ultraviolet light. In just one patch of sky. They discovered 83 of these galactic powerhouses in one part of the sky at a time when the Universe was only 800 million years old.
Telescopes in Chile Capture Images of the Earliest Galaxies in the Universe
An international team of astronomers using the [*Cosmology Large Angular Scale Surveyor*](https://sites.krieger.jhu.edu/class/) (CLASS) [reported the first-ever measurement](https://hub.jhu.edu/2025/06/11/telescopes-look-at-cosmic-dawn/) announced the first-ever detection of radiation from the cosmic microwave background (CMB) interacting with the first stars in the Universe.
Danny Boyle's long-awaited zombie sequel 28 Years Later is a triumph
Danny Boyle's long-awaited zombie sequel 28 Years Later is a triumph
See the moon rise alongside the giant planets Neptune and Saturn predawn on June 19
Curiosity Blog, Sols 4573-4574: Welcome to the Uyuni Quad
- Curiosity Home
- Science
- News and Features
- Multimedia
- Mars Missions
- Mars Home
3 min read
Curiosity Blog, Sols 4573-4574: Welcome to the Uyuni Quad NASA’s Mars rover Curiosity acquired this image, looking southwest toward the distant large boxwork structures in the Uyuni quad, using its Left Navigation Camera on June 15, 2025 — Sol 4571, or Martian day 4,571 of the Mars Science Laboratory mission — at 21:27:38 UTC. NASA/JPL-Caltech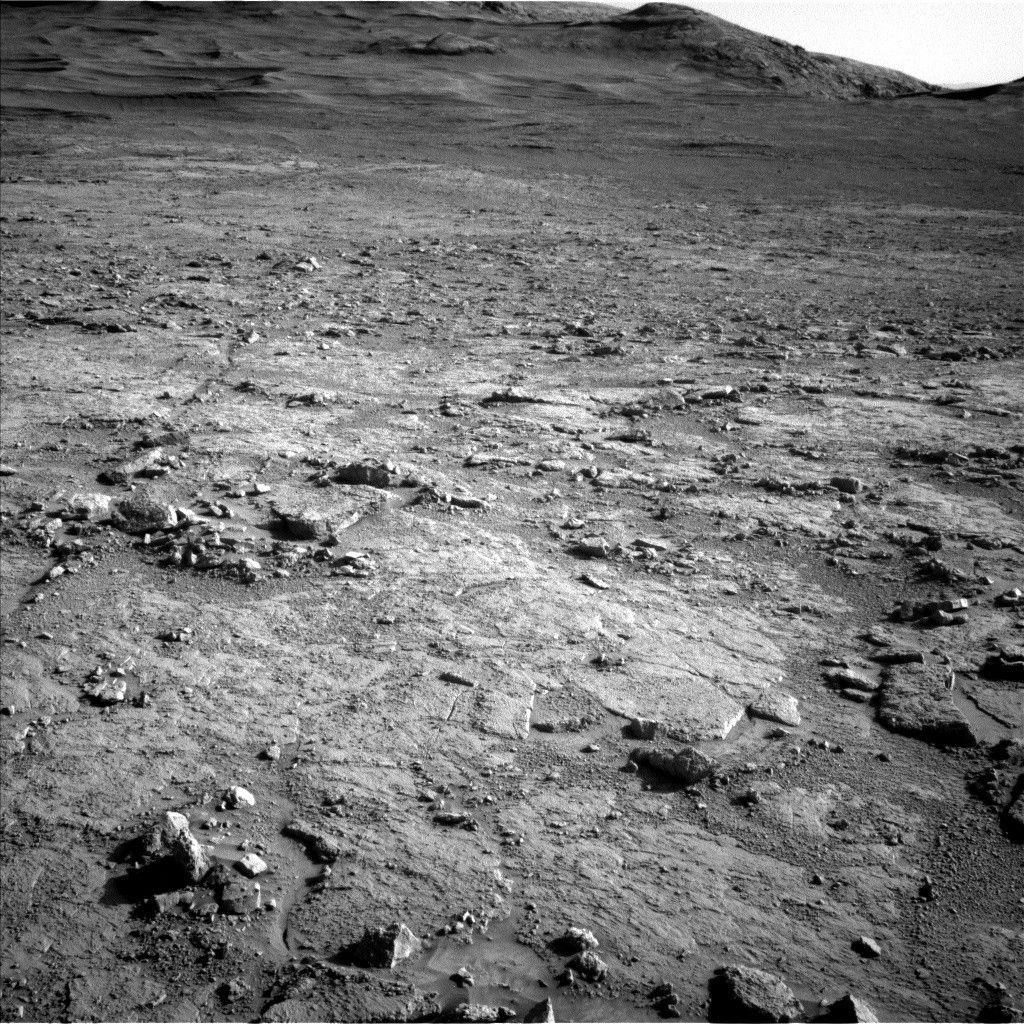
Written by Lauren Edgar, Planetary Geologist at USGS Astrogeology Science Center
Earth planning date: Monday, June 16, 2025
Over the weekend Curiosity successfully wrapped up activities at the “Altadena” drill site and got back on the road. The approximately 48-meter drive (about 157 feet) was successful, and placed the rover in the next mapping quadrangle (informally referred to as a quad).
As a reminder, the rover’s exploration area has been divided into 1.5 kilometer by 1.5 kilometer square quads, and each quad is named after a town of less than 100,000 people. As Curiosity explores features within a quad, we assign informal target names that correspond to geologic formations and features from that town on Earth.
Uyuni, Bolivia, is the gateway city near the world’s largest salt flats (salars), and it seems like an appropriate name as Curiosity explores drier depositional environments higher in the Mount Sharp stratigraphy. The team is excited to use some new target names that will draw from Uyuni and surrounding areas, including the Atacama Desert in Chile, which hosts many Mars analog sites including eolian features, studies of life in extreme environments, and some of the world’s great observatories. A fitting theme for this next phase of exploration!
As for today’s two-sol plan, we have a good balance of contact science, remote sensing, and another long drive. The team planned APXS and MAHLI on a nodular bedrock target named “Flamingo” to assess its chemistry and texture. In the targeted remote sensing block, the science team planned a Mastcam mosaic of “Los Patos” to characterize a depression which may be related to a small impact crater or boxwork structures, along with a Mastcam image of “La Lava” to investigate an interesting dark block. There are also several Mastcam mosaics of nearby troughs to assess active surface processes, and documentation images for ChemCam observations. The plan includes a ChemCam LIBS observation on a target named “Tacos” to assess the local bedrock, and a long-distance RMI mosaic to evaluate sedimentary structures at “Mishe Mokwa” butte. Then the rover will drive about 56 meters (about 184 feet) to the southwest, and take post-drive imaging to prepare for the next plan. On the second sol, Curiosity will complete a ChemCam calibration target activity, a Mastcam data management activity, and a few Navcam activities to monitor clouds and dust in the atmosphere.
We’re looking forward to exploring more of Uyuni as we work our way toward the larger exposure of boxwork structures that lie ahead, and the clues they hold to ancient Mars conditions.
For more Curiosity blog posts, visit MSL Mission Updates
Learn more about Curiosity’s science instruments
Share Details Last Updated Jun 18, 2025 Related Terms Explore More 3 min read Curiosity Blog, Sols 4570-4572: A Fond Farewell, With a Side of Frost
Article
4 days ago
2 min read Curiosity Blog, Sols 4568-4569: A Close Look at the Altadena Drill Hole and Tailings
Article
5 days ago
2 min read Curiosity Blog, Sols 4566-4567: Drilling Success
Article
7 days ago
Keep Exploring Discover More Topics From NASA Mars
Mars is the fourth planet from the Sun, and the seventh largest. It’s the only planet we know of inhabited…
All Mars Resources
Explore this collection of Mars images, videos, resources, PDFs, and toolkits. Discover valuable content designed to inform, educate, and inspire,…
Rover Basics
Each robotic explorer sent to the Red Planet has its own unique capabilities driven by science. Many attributes of a…
Mars Exploration: Science Goals
The key to understanding the past, present or future potential for life on Mars can be found in NASA’s four…
Curiosity Blog, Sols 4573-4574: Welcome to the Uyuni Quad
- Curiosity Home
- Science
- News and Features
- Multimedia
- Mars Missions
- Mars Home
3 min read
Curiosity Blog, Sols 4573-4574: Welcome to the Uyuni Quad NASA’s Mars rover Curiosity acquired this image, looking southwest toward the distant large boxwork structures in the Uyuni quad, using its Left Navigation Camera on June 15, 2025 — Sol 4571, or Martian day 4,571 of the Mars Science Laboratory mission — at 21:27:38 UTC. NASA/JPL-CaltechWritten by Lauren Edgar, Planetary Geologist at USGS Astrogeology Science Center
Earth planning date: Monday, June 16, 2025
Over the weekend Curiosity successfully wrapped up activities at the “Altadena” drill site and got back on the road. The approximately 48-meter drive (about 157 feet) was successful, and placed the rover in the next mapping quadrangle (informally referred to as a quad).
As a reminder, the rover’s exploration area has been divided into 1.5 kilometer by 1.5 kilometer square quads, and each quad is named after a town of less than 100,000 people. As Curiosity explores features within a quad, we assign informal target names that correspond to geologic formations and features from that town on Earth.
Uyuni, Bolivia, is the gateway city near the world’s largest salt flats (salars), and it seems like an appropriate name as Curiosity explores drier depositional environments higher in the Mount Sharp stratigraphy. The team is excited to use some new target names that will draw from Uyuni and surrounding areas, including the Atacama Desert in Chile, which hosts many Mars analog sites including eolian features, studies of life in extreme environments, and some of the world’s great observatories. A fitting theme for this next phase of exploration!
As for today’s two-sol plan, we have a good balance of contact science, remote sensing, and another long drive. The team planned APXS and MAHLI on a nodular bedrock target named “Flamingo” to assess its chemistry and texture. In the targeted remote sensing block, the science team planned a Mastcam mosaic of “Los Patos” to characterize a depression which may be related to a small impact crater or boxwork structures, along with a Mastcam image of “La Lava” to investigate an interesting dark block. There are also several Mastcam mosaics of nearby troughs to assess active surface processes, and documentation images for ChemCam observations. The plan includes a ChemCam LIBS observation on a target named “Tacos” to assess the local bedrock, and a long-distance RMI mosaic to evaluate sedimentary structures at “Mishe Mokwa” butte. Then the rover will drive about 56 meters (about 184 feet) to the southwest, and take post-drive imaging to prepare for the next plan. On the second sol, Curiosity will complete a ChemCam calibration target activity, a Mastcam data management activity, and a few Navcam activities to monitor clouds and dust in the atmosphere.
We’re looking forward to exploring more of Uyuni as we work our way toward the larger exposure of boxwork structures that lie ahead, and the clues they hold to ancient Mars conditions.
For more Curiosity blog posts, visit MSL Mission Updates
Learn more about Curiosity’s science instruments
Share Details Last Updated Jun 18, 2025 Related Terms Explore More 3 min read Curiosity Blog, Sols 4570-4572: A Fond Farewell, With a Side of Frost
Article
4 days ago
2 min read Curiosity Blog, Sols 4568-4569: A Close Look at the Altadena Drill Hole and Tailings
Article
5 days ago
2 min read Curiosity Blog, Sols 4566-4567: Drilling Success
Article
7 days ago
Keep Exploring Discover More Topics From NASA Mars
Mars is the fourth planet from the Sun, and the seventh largest. It’s the only planet we know of inhabited…
All Mars Resources
Explore this collection of Mars images, videos, resources, PDFs, and toolkits. Discover valuable content designed to inform, educate, and inspire,…
Rover Basics
Each robotic explorer sent to the Red Planet has its own unique capabilities driven by science. Many attributes of a…
Mars Exploration: Science Goals
The key to understanding the past, present or future potential for life on Mars can be found in NASA’s four…
2 Chinese spacecraft just met up 22,000 miles above Earth. What were they doing?
The best non-drug therapies to relieve the pain of knee osteoarthritis
The best non-drug therapies to relieve the pain of knee osteoarthritis
Supreme Court Skrmetti Decision Permits Ban on Gender-Affirming Care for Children
The Supreme Court has decided to uphold a state ban on gender-affirming care for minors in U.S. v. Skrmetti
Mars joins the Spring Triangle this week: Here’s when and how to see it
The Massive Ordnance Penetrator Bomb Israel Wants to Destroy Iran’s Fordo Nuclear Facility
American military engineers designed the GBU-57/B bomb to devastate deeply buried bunkers without radioactive fallout. It’s the only nonnuclear weapon that can reach Iran’s hardest target
NASA Astronauts to Answer Questions from Students in New York, Utah
Students from New York and Utah will hear from NASA astronauts aboard the International Space Station as they answer prerecorded questions in two separate events.
At 11:30 a.m. EDT on Monday, June 23, NASA astronauts Nichole Ayers and Anne McClain will answer questions submitted by students from P.S. 71 Forest Elementary School in Ridgewood, New York. Media interested in covering the event must RSVP by 5 p.m. Friday, June 20, to Regina Beshay at: rbeshay2@school.nyc.gov or 347-740-6165.
At 11:05 a.m. on Friday, June 27, Ayers and McClain will answer questions submitted by students from Douglas Space and Science Foundation, Inc., in Layton, Utah. Media interested in covering the event must RSVP by 5 p.m. Wednesday, June 25, to Sarah Merrill at: sarahmonique@gmail.com or 805-743-3341.
Watch the 20-minute Earth-to-space calls on NASA STEM YouTube Channel.
P.S. 71 Forest Elementary School will host kindergarten through fifth grade students. Douglas Space and Science Foundation will host participants from the Science, Technology, Achievement Research camp. Both events aim to inspire students to imagine a future in science, technology, engineering, and mathematics careers through ongoing collaborations, mentorship, and hands-on learning experiences.
For nearly 25 years, astronauts have continuously lived and worked aboard the space station, testing technologies, performing science, and developing skills needed to explore farther from Earth. Astronauts aboard the orbiting laboratory communicate with NASA’s Mission Control Center in Houston 24 hours a day through SCaN’s (Space Communications and Navigation) Near Space Network.
Important research and technology investigations taking place aboard the space station benefit people on Earth and lays the groundwork for other agency missions. As part of NASA’s Artemis campaign, the agency will send astronauts to the Moon to prepare for future human exploration of Mars; inspiring explorers and ensuring the United States continues to lead in space exploration and discovery.
See videos of astronauts aboard the space station at:
https://www.nasa.gov/stemonstation
-end-
Gerelle Dodson
Headquarters, Washington
202-358-1600
gerelle.q.dodson@nasa.gov
Sandra Jones
Johnson Space Center, Houston
281-483-5111
sandra.p.jones@nasa.gov
NASA’s Human Exploration Rover Challenge
NASA’s Human Exploration Rover Challenge
Two students guide their rover through an obstacle course in this April 11, 2025, image from the 2025 Human Exploration Rover Challenge. The annual engineering competition – one of NASA’s longest standing student challenges – is in its 31st year. This year’s competition challenged teams to design, build, and test a lunar rover powered by either human pilots or remote control. More than 500 students with 75 teams from around the world participated, representing 35 colleges and universities, 38 high schools, and two middle schools from 20 states, Puerto Rico, and 16 other nations.
Image credit: NASA/Charles Beason