
Feed aggregator
Tour 15 of the Brightest Stars on New Year's Eve (VIDEO)
Tour 15 of the sky's brightest stars all in one night on this New Year's Eve! This interactive Worldwide Telescope video will show you the way.
The post Tour 15 of the Brightest Stars on New Year's Eve (VIDEO) appeared first on Sky & Telescope.
Three supermassive black holes have been spotted merging into one
Three supermassive black holes have been spotted merging into one
NASA Telescopes Capture Colliding Spiral Galaxies in Sparkling Detail
Astronomers combined data from NASA’s JWST and Chandra X-ray Observatory to create a stunning new image of two merging spiral galaxies
When Stars Fail to Explode
A supernova observed by Chinese and Japanese astronomers in 1181 CE didn’t fully explode, instead it sputtered and left behind a rare “zombie star” surrounded by long filaments resembling fireworks. New research by Syracuse University physicist Eric Coughlin explains how these unusual structures formed. After the failed detonation, the surviving white dwarf launched a fast, dense wind that slammed into surrounding gas. The collision created finger-like plumes through a fluid instability, but a second instability that normally tears such structures apart never activated. In some sense, the stars didn’t quite die!
Space Mice Come Home and Start Families
A female mouse that spent two weeks aboard China’s space station has successfully given birth to healthy pups after returning to Earth. This marks the first time offspring have been born from mammals that have traveled in space. The birth demonstrates that short term spaceflight doesn’t impair reproductive capability and provides crucial data for understanding how space environments affect mammalian development, a critical question for future long-l duration human missions beyond Earth.
The duo kite-skiing 4000 kilometres across Antarctica for science
The duo kite-skiing 4000 kilometres across Antarctica for science
Hot Jupiters with a Memory of Their Past
How did hot Jupiters end up orbiting so close to their stars, thus earning their moniker? This is what a recent study published in The Astronomical Journal hopes to address as a team of researchers from The University of Tokyo investigated the orbital evolution of hot Jupiters ended, specifically regarding where their orbits started before orbiting so close to their stars. This study has the potential to help scientists better understand the formation and evolution of exoplanets and what this could mean for finding life beyond Earth.
2026 AAS Town Hall Schedule
2 min read
2026 AAS Town Hall Schedule247th American Astronomical Society (AAS) Meeting
SATURDAY, JANUARY 3
8:30AM – 6:0PM NASA’s Exoplanet Exploration Program Analysis Group (ExoPAG) 301D Josh Pepper, Dawn Gelino, Karl Stapelfeldt, Nick Siegler, Jessie ChristiansenSUNDAY, JANUARY 4
8:30AM – 12:15PM NASA’s Exoplanet Exploration Program Analysis Group (ExoPAG) 301D 9:00AM – 2:00PM NASA’s Cosmic Origins Program Analysis Group (COPAG) Peter Kurczynski 7:30PM – 9:30PM NASA’s Physics of the Cosmos Program Analysis Group (PhysPAG) Francesca Civano NASA’s Joint Program Analysis Group Shawn Domagal-GoldmanMONDAY, JANUARY 5
12:45 PM – 1:45 PM NASA Update West Building 301AB Shawn Domagal-Goldman 2:00 PM- 3:30 PM Beyond the Mid-Decadal: Community Inputs for Space Mission Concepts Toward Astro 2030 335BTUESDAY, JANUARY 6
9:30AM – 10:30AM Active Galatic Nuclei SIG 131A 10:00AM – 11:30AM NASA’s Habitable Worlds Observatory 224 B Robert Zellem 10:00AM – 11:30AM A NICER Look at the Energetic Universe 225 B 5:30PM – 6:30PM NASA’s Habitable Worlds Observatory Exhibit Hall B/C/D 6:00PM – 8:00PM NASA-DARES Community Update 126 CWEDNESDAY, JANUARY 7
9:30AM – 10:00AM NASA Cosmic Pathfinders Program 127 A/B 10:00AM – 11:30AM NASA Infrared Science and Technology Interest Group 231 A/B/C 10:00AM – 11:30AM Introducing NASA’s Astrophysics Cross-Observatory Science Support (ACROSS) Facility 226 B Brian Humensky 1:00PM – 2:30PM Get Involved with NASA Citizen Science 226 C 2:00PM – 3:30PM Meeting of NASA’s Active Galactic Nuclei Science Interest Group (AGN SIG) TBD 3:00PM – 4:30PM Get Involved with NASA Citizen Science Exhibit Hall B/C/D 5:30PM – 6:00PM NASA Artificial Intelligence Science and Technology Interest Group 231 A/B/C2026 AAS Town Hall Schedule
2 min read
2026 AAS Town Hall Schedule247th American Astronomical Society (AAS) Meeting
SATURDAY, JANUARY 3
8:30AM – 6:0PM NASA’s Exoplanet Exploration Program Analysis Group (ExoPAG) 301D Josh Pepper, Dawn Gelino, Karl Stapelfeldt, Nick Siegler, Jessie ChristiansenSUNDAY, JANUARY 4
8:30AM – 12:15PM NASA’s Exoplanet Exploration Program Analysis Group (ExoPAG) 301D 9:00AM – 2:00PM NASA’s Cosmic Origins Program Analysis Group (COPAG) Peter Kurczynski 7:30PM – 9:30PM NASA’s Physics of the Cosmos Program Analysis Group (PhysPAG) Francesca Civano NASA’s Joint Program Analysis Group Shawn Domagal-GoldmanMONDAY, JANUARY 5
12:45 PM – 1:45 PM NASA Update West Building 301AB Shawn Domagal-Goldman 2:00 PM- 3:30 PM Beyond the Mid-Decadal: Community Inputs for Space Mission Concepts Toward Astro 2030 335BTUESDAY, JANUARY 6
9:30AM – 10:30AM Active Galatic Nuclei SIG 131A 10:00AM – 11:30AM NASA’s Habitable Worlds Observatory 224 B Robert Zellem 10:00AM – 11:30AM A NICER Look at the Energetic Universe 225 B 5:30PM – 6:30PM NASA’s Habitable Worlds Observatory Exhibit Hall B/C/D 6:00PM – 8:00PM NASA-DARES Community Update 126 CWEDNESDAY, JANUARY 7
9:30AM – 10:00AM NASA Cosmic Pathfinders Program 127 A/B 10:00AM – 11:30AM NASA Infrared Science and Technology Interest Group 231 A/B/C 10:00AM – 11:30AM Introducing NASA’s Astrophysics Cross-Observatory Science Support (ACROSS) Facility 226 B Brian Humensky 1:00PM – 2:30PM Get Involved with NASA Citizen Science 226 C 2:00PM – 3:30PM Meeting of NASA’s Active Galactic Nuclei Science Interest Group (AGN SIG) TBD 3:00PM – 4:30PM Get Involved with NASA Citizen Science Exhibit Hall B/C/D 5:30PM – 6:00PM NASA Artificial Intelligence Science and Technology Interest Group 231 A/B/C2026 AAS Hyperwall Schedule
2 min read
2026 AAS Hyperwall Schedule247th American Astronomical Society (AAS) Meeting
Join NASA in the Exhibit Hall (Booth #401) for Hyperwall Storytelling by NASA experts. Full Hyperwall Agenda below.
SUNDAY, JANUARY 4
6:45 – 7:00 PM Nancy Grace Roman Space Telescope Dominic Benford 7:00 – 7:15 PM Storytelling with NASA: Eyes on Exoplanets Anjali Tripathi 7:15 – 7:30 PM Roman Space Telescope Update Julie McEnery 7:30 – 7:45 PM The Search for Life in the Universe with Habitable Worlds Observatory Giada Arney 7:45 – 8:00 PM The James Webb Space Telescope Engineering History Lee FeinbergMONDAY, JANUARY 5
9:00 – 9:15AM Galaxies Across Cosmic Time with JWST and Roman Aaron Yung 9:15 – 9:30AM The Hubble Space Telescope: Next Era of Discovery Jennifer Wiseman 9:30 – 9:45AM Cosmic Pathfinders Ron Gamble 9:45- 10:00AM Preliminary Findings from the NASA Technosignatures Database Nick Siegler 5:30 – 5:45PM Habitable Worlds ObservatoryFrom Gas to Galaxies to Life in the Universe Kevin France 5:45 – 6:00PM Space Servicing: From Hubble to Habitable Worlds John Grunsfeld 6:00 – 6:15PM Supernova Cosmology with Roman Rebekah Hounsell 6:15- 6:30PM What Even is Bayesian Analysis, and Why Do I Care? Natasha Latouf
TUESDAY, JANUARY 6
9:00 – 9:15AM Revealing the Faintest Galaxies in the Nearby Universe with Roman Aaron Yung 9:15 – 9:30AM Open Science Training for Researchers Jennifer Wiseman 9:30 – 9:45AM Universe in 24 hours Ron Gamble 9:45- 10:00AM Beyond ADS: SciX as the Next-Generation Platform for Earth and Space Science Research Nick Siegler 5:30 – 5:45PM From Ground Tests to Science with the Wide Field Instrument Kevin France 5:45 – 6:00PM Habitable Worlds Observatory and the Search for Life John Grunsfeld 6:00 – 6:15PM Laser Interferometry Space Antenna : Measuring Low Frequency Gravitational Waves from the Universe Rebekah Hounsell 6:15- 6:30PM Our Cosmic Roots, Kinship, and Destiny with the Habitable Worlds Observatory Natasha LatoufWEDNESDAY, JANUARY 7
9:00 – 9:15AM What Can Roman Do for You? Explore Its Four Community-Defined Surveys Karoline Gilbert 9:15 – 9:30AM Galaxies Benne Holwerda 9:30 – 9:45AM The NASA Exoplanet Science Institute: Making Exoplanet Science Easier Catherine Clark 5:30 – 5:45PM Science from the Roman Space Telescope Galactic Bulge Time-Domain Survey Robby Wilson 5:45 – 6:00PM The Pandora SmallSat: Exploring Exoplanet Atmospheres Thomas Barclay 6:00 – 6:15PM How Did the Universe Become Habitable? Get Involved with NASA’s Cosmic Origins Group Sabrina StierwaltTHURSDAY, JANUARY 8
9:00 – 9:15AM Science with Petabyte-Scale Data: Cloud Platforms Thomas Dutkiewicz 9:15 – 9:30AM The Future of the Transiting Exoplanet Survey Satellite Nicole Schanche 9:30 – 9:45AM Is There an Atmosphere on the Habitable-Zone Planet TRAPPIST-1 e? Nestor Espinoza2026 AAS Hyperwall Schedule
2 min read
2026 AAS Hyperwall Schedule247th American Astronomical Society (AAS) Meeting
Join NASA in the Exhibit Hall (Booth #401) for Hyperwall Storytelling by NASA experts. Full Hyperwall Agenda below.
SUNDAY, JANUARY 4
6:45 – 7:00 PM Nancy Grace Roman Space Telescope Dominic Benford 7:00 – 7:15 PM Storytelling with NASA: Eyes on Exoplanets Anjali Tripathi 7:15 – 7:30 PM Roman Space Telescope Update Julie McEnery 7:30 – 7:45 PM The Search for Life in the Universe with Habitable Worlds Observatory Giada Arney 7:45 – 8:00 PM The James Webb Space Telescope Engineering History Lee FeinbergMONDAY, JANUARY 5
9:00 – 9:15AM Galaxies Across Cosmic Time with JWST and Roman Aaron Yung 9:15 – 9:30AM The Hubble Space Telescope: Next Era of Discovery Jennifer Wiseman 9:30 – 9:45AM Cosmic Pathfinders Ron Gamble 9:45- 10:00AM Preliminary Findings from the NASA Technosignatures Database Nick Siegler 5:30 – 5:45PM Habitable Worlds ObservatoryFrom Gas to Galaxies to Life in the Universe Kevin France 5:45 – 6:00PM Space Servicing: From Hubble to Habitable Worlds John Grunsfeld 6:00 – 6:15PM Supernova Cosmology with Roman Rebekah Hounsell 6:15- 6:30PM What Even is Bayesian Analysis, and Why Do I Care? Natasha Latouf
TUESDAY, JANUARY 6
9:00 – 9:15AM Revealing the Faintest Galaxies in the Nearby Universe with Roman Aaron Yung 9:15 – 9:30AM Open Science Training for Researchers Jennifer Wiseman 9:30 – 9:45AM Universe in 24 hours Ron Gamble 9:45- 10:00AM Beyond ADS: SciX as the Next-Generation Platform for Earth and Space Science Research Nick Siegler 5:30 – 5:45PM From Ground Tests to Science with the Wide Field Instrument Kevin France 5:45 – 6:00PM Habitable Worlds Observatory and the Search for Life John Grunsfeld 6:00 – 6:15PM Laser Interferometry Space Antenna : Measuring Low Frequency Gravitational Waves from the Universe Rebekah Hounsell 6:15- 6:30PM Our Cosmic Roots, Kinship, and Destiny with the Habitable Worlds Observatory Natasha LatoufWEDNESDAY, JANUARY 7
9:00 – 9:15AM What Can Roman Do for You? Explore Its Four Community-Defined Surveys Karoline Gilbert 9:15 – 9:30AM Galaxies Benne Holwerda 9:30 – 9:45AM The NASA Exoplanet Science Institute: Making Exoplanet Science Easier Catherine Clark 5:30 – 5:45PM Science from the Roman Space Telescope Galactic Bulge Time-Domain Survey Robby Wilson 5:45 – 6:00PM The Pandora SmallSat: Exploring Exoplanet Atmospheres Thomas Barclay 6:00 – 6:15PM How Did the Universe Become Habitable? Get Involved with NASA’s Cosmic Origins Group Sabrina StierwaltTHURSDAY, JANUARY 8
9:00 – 9:15AM Science with Petabyte-Scale Data: Cloud Platforms Thomas Dutkiewicz 9:15 – 9:30AM The Future of the Transiting Exoplanet Survey Satellite Nicole Schanche 9:30 – 9:45AM Is There an Atmosphere on the Habitable-Zone Planet TRAPPIST-1 e? Nestor EspinozaCould TRAPPIST-1’s Seven Worlds Host Moons?
Scientists have discovered that moons could theoretically orbit all seven planets in the TRAPPIST-1 system despite the complex gravitational environment. Using computer simulations, a team of researchers have mapped stable zones where satellites could survive around each planet. They found that moons can remain stable up to about 40-45% of each planet’s sphere of gravitational influence. The neighbouring planets squeeze these stable zones slightly inward compared to isolated planets, but the effect is modest. Long term calculations suggest only tiny moons, roughly one ten millionth the mass of Earth, could survive the immense tidal forces.
Whooping Cough Deaths Rise in U.S. as Surge in Infections Continues
The brutal respiratory infection has infected tens of thousands and killed at least 13 people in the U.S. in 2025
Star that seemed to vanish more than 130 years ago is found again
Star that seemed to vanish more than 130 years ago is found again
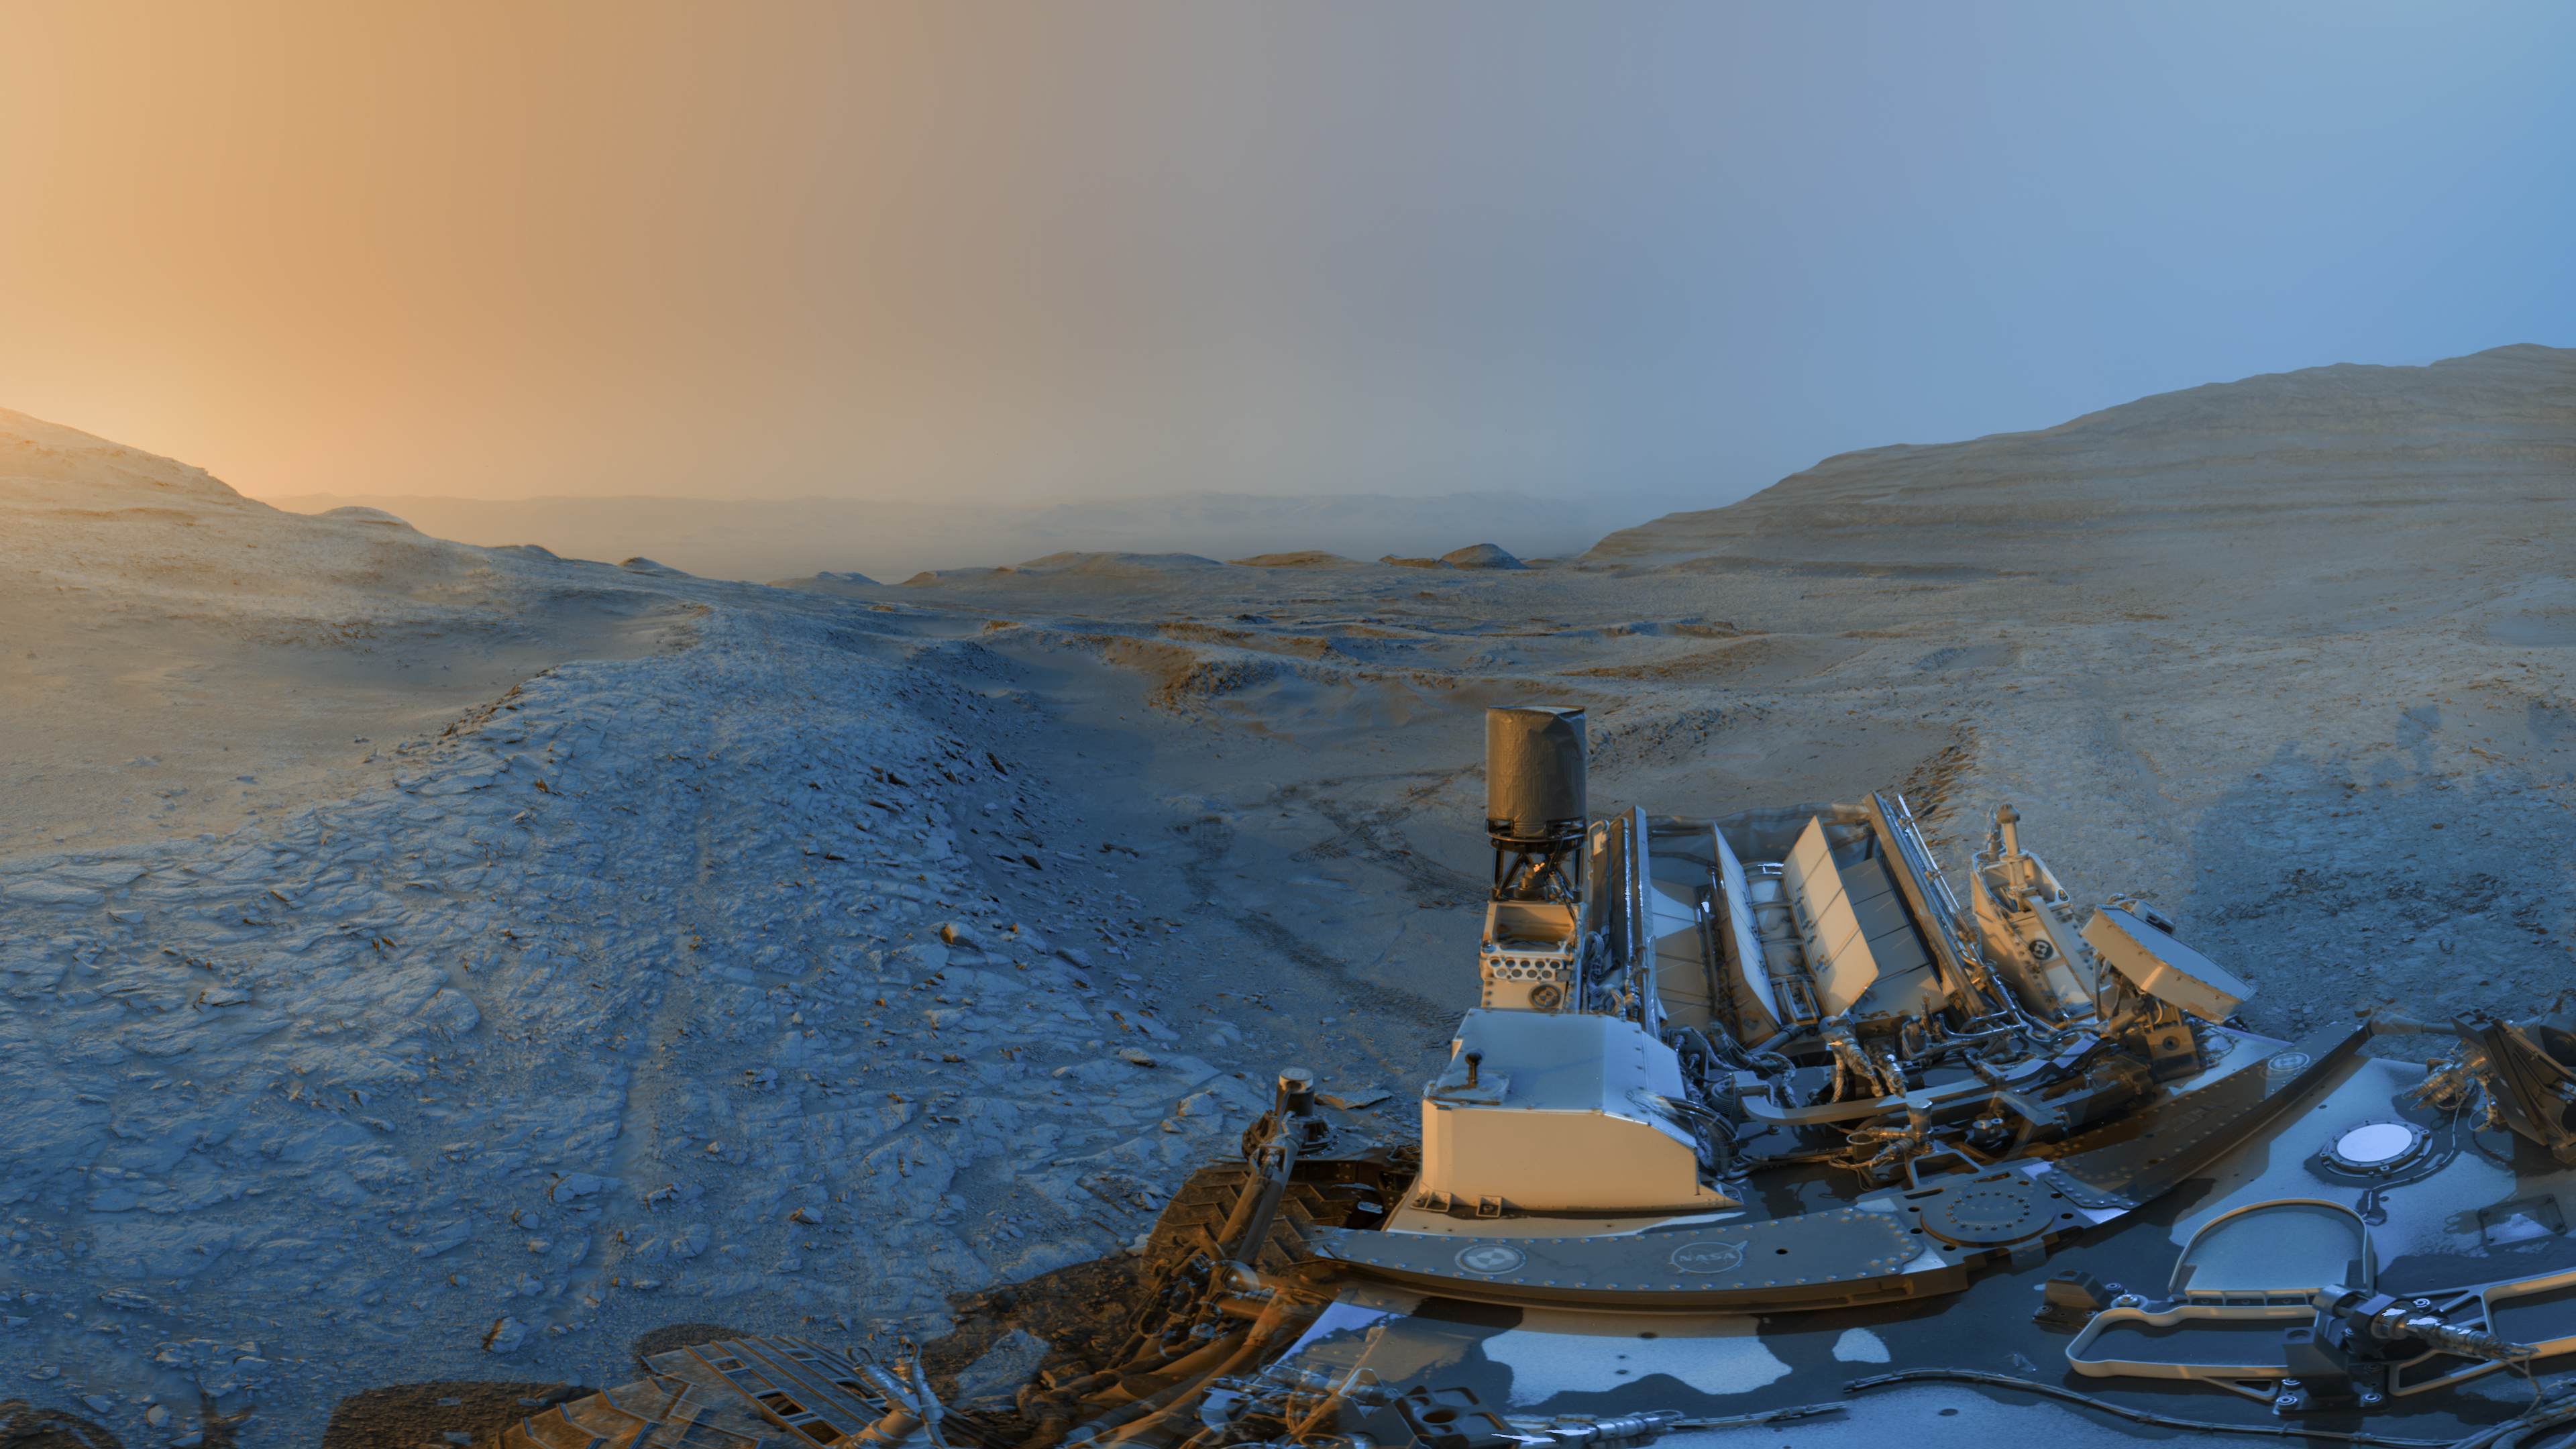
Curiosity Sends Holiday Postcard from Mars
Curiosity Sends Holiday Postcard from Mars
Team members working with NASA’s Curiosity Mars rover created this “postcard” by commanding the rover to take images at two times of day on Nov. 18, 2025, spanning periods that occurred on both the 4,722nd and 4,723rd Martian days, or sols, of the mission.
The panoramas were captured at 4:15 p.m. on Sol 4,722 and 8:20 a.m. on Sol 4,723 (both at local Mars time), then merged together. Color was later added for an artistic interpretation of the scene with blue representing the morning panorama and yellow representing the afternoon one. The resulting “postcard” is similar to ones the rover took in June 2023 and November 2021. Adding color to these kinds of merged images helps different details stand out in the landscape.
Credit: NASA/JPL-Caltech