
Feed aggregator
I'm calling it – 2026 is going to be the year of the galaxy
I'm calling it – 2026 is going to be the year of the galaxy
Why connecting with nature shouldn't mean disconnecting from science
The best new science-fiction shows of 2026
Why connecting with nature shouldn't mean disconnecting from science
The best new science-fiction shows of 2026
Big and Bright, Jupiter Beckons in January
Jupiter's having a special moment! Don't miss the giant planet at its best when it reaches opposition this week.
The post Big and Bright, Jupiter Beckons in January appeared first on Sky & Telescope.
The Race to Find Leonardo da Vinci’s DNA Just Took a Major Twist
Scientists have uncovered genetic evidence that they say may be linked to the Renaissance master, but some experts are more skeptical
RFK, Jr., Upsets Food Pyramid, Urging Americans to Eat More Meat
Nutritional guidelines released on Wednesday by Secretary of Health and Human Services Robert F. Kennedy, Jr., and the USDA emphasize “real food” that is high in saturated fat, departing from decades of evidence on healthful diets
Fossil Discovery of New Human Ancestor May Connect Us to Neandertals and Denisovans
Fossils of a human ancestor from 773,000 years ago may be near the base of the Homo sapiens lineage, representing a common ancestor of modern humans, Neandertals and Denisovans
How the Evidence for Alien Life on K2-18 b Evaporated
It feels like every time we publish an article about an exciting discovery of a potential biosignature on a new exoplanet, we have to publish a follow-up one a few months later debunking the original claims. That is exactly how science is supposed to work, and part of our job as science journalists is to report on the debunking as well as the original story, even if it might not be as exciting. In this particular case, it seems the discovery of dimethyl sulfide in the atmosphere of exoplanet K2-18 b was a false alarm, according to a new paper available in pre-print form on arXiv by Luis Welbanks of Arizona State University and his co-authors.
Antarctica Doomsday Glacier Rattled by Hundreds of Iceberg Earthquakes
Capsizing icebergs are violently clashing with the crumbling end of the Doomsday Glacier
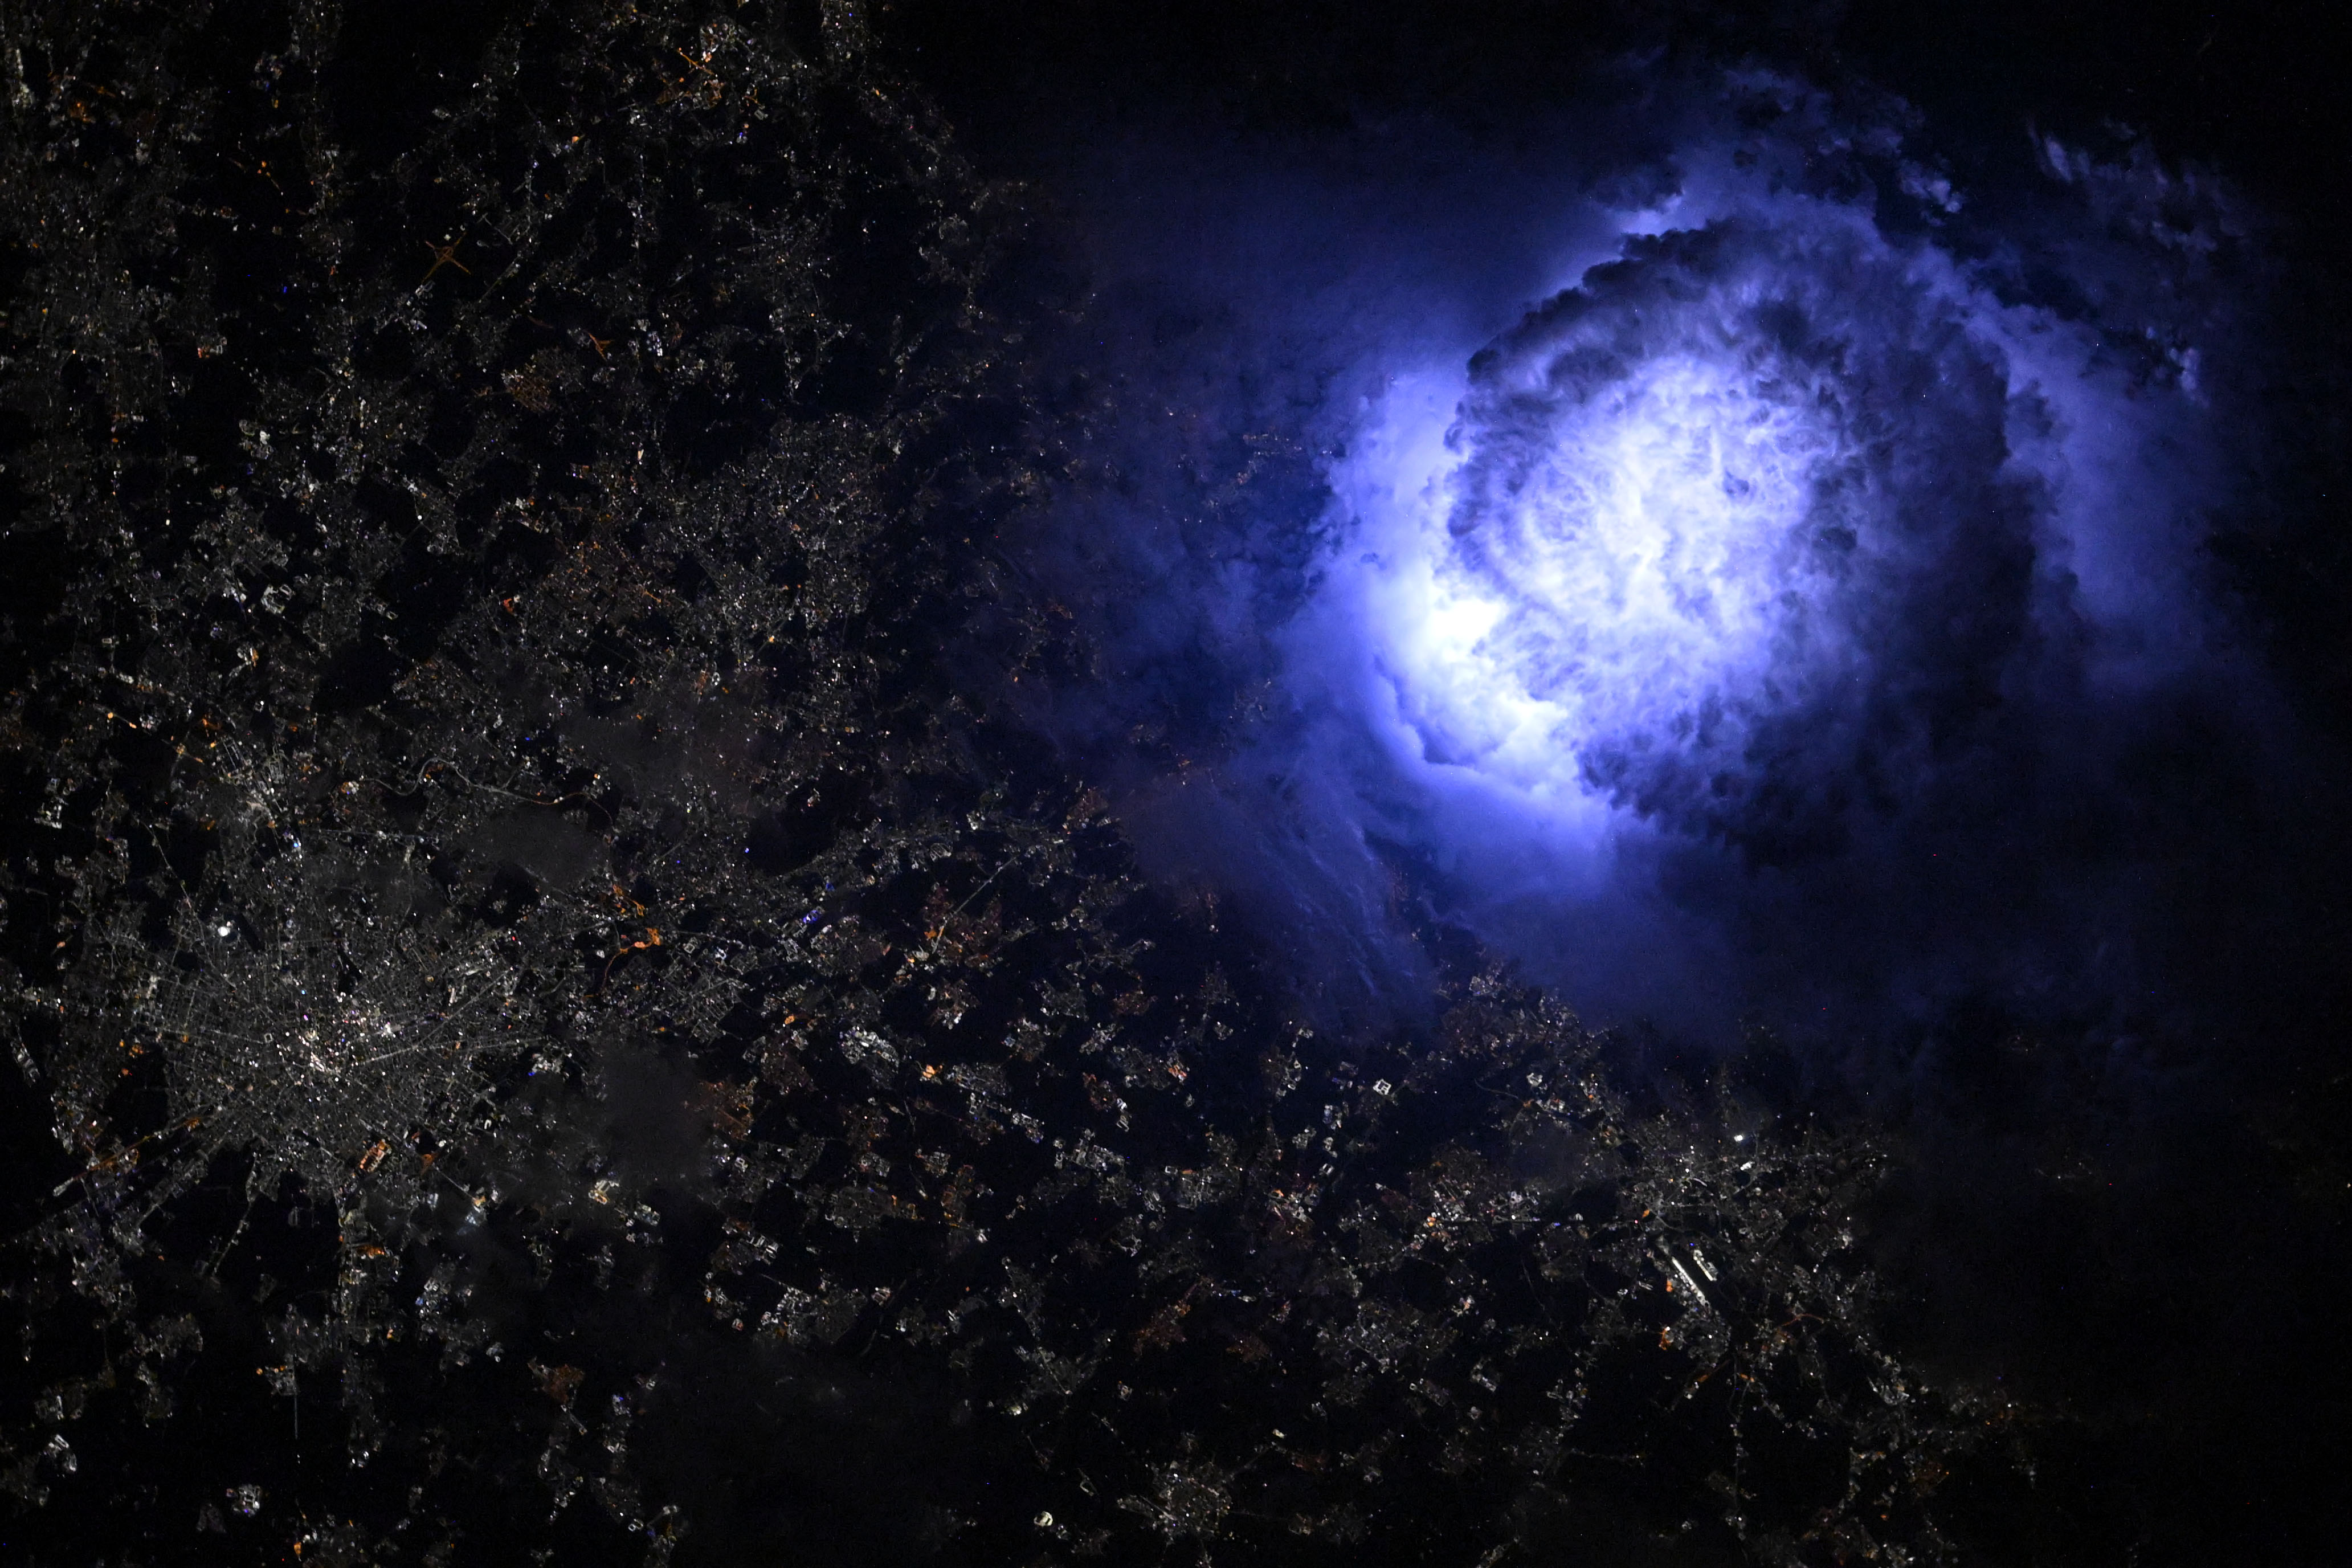
Lightning from Above
Lightning from Above
NASA astronaut Nichole Ayers captured this image of lightning while orbiting aboard the International Space Station more than 250 miles above Milan, Italy on July 1, 2025. Storm observations from space station help scientists study Earth’s upper atmosphere, which can improve weather models and protect communication systems and aircraft. Space station crew take photographs of Earth that record how the planet changes over time due to human activity and natural events. This record allows scientists to monitor disasters and direct response on the ground and study phenomena.
Image credit: NASA/Nichole Ayers