
Feed aggregator
Hubble Glimpses Galactic Gas Making a Getaway
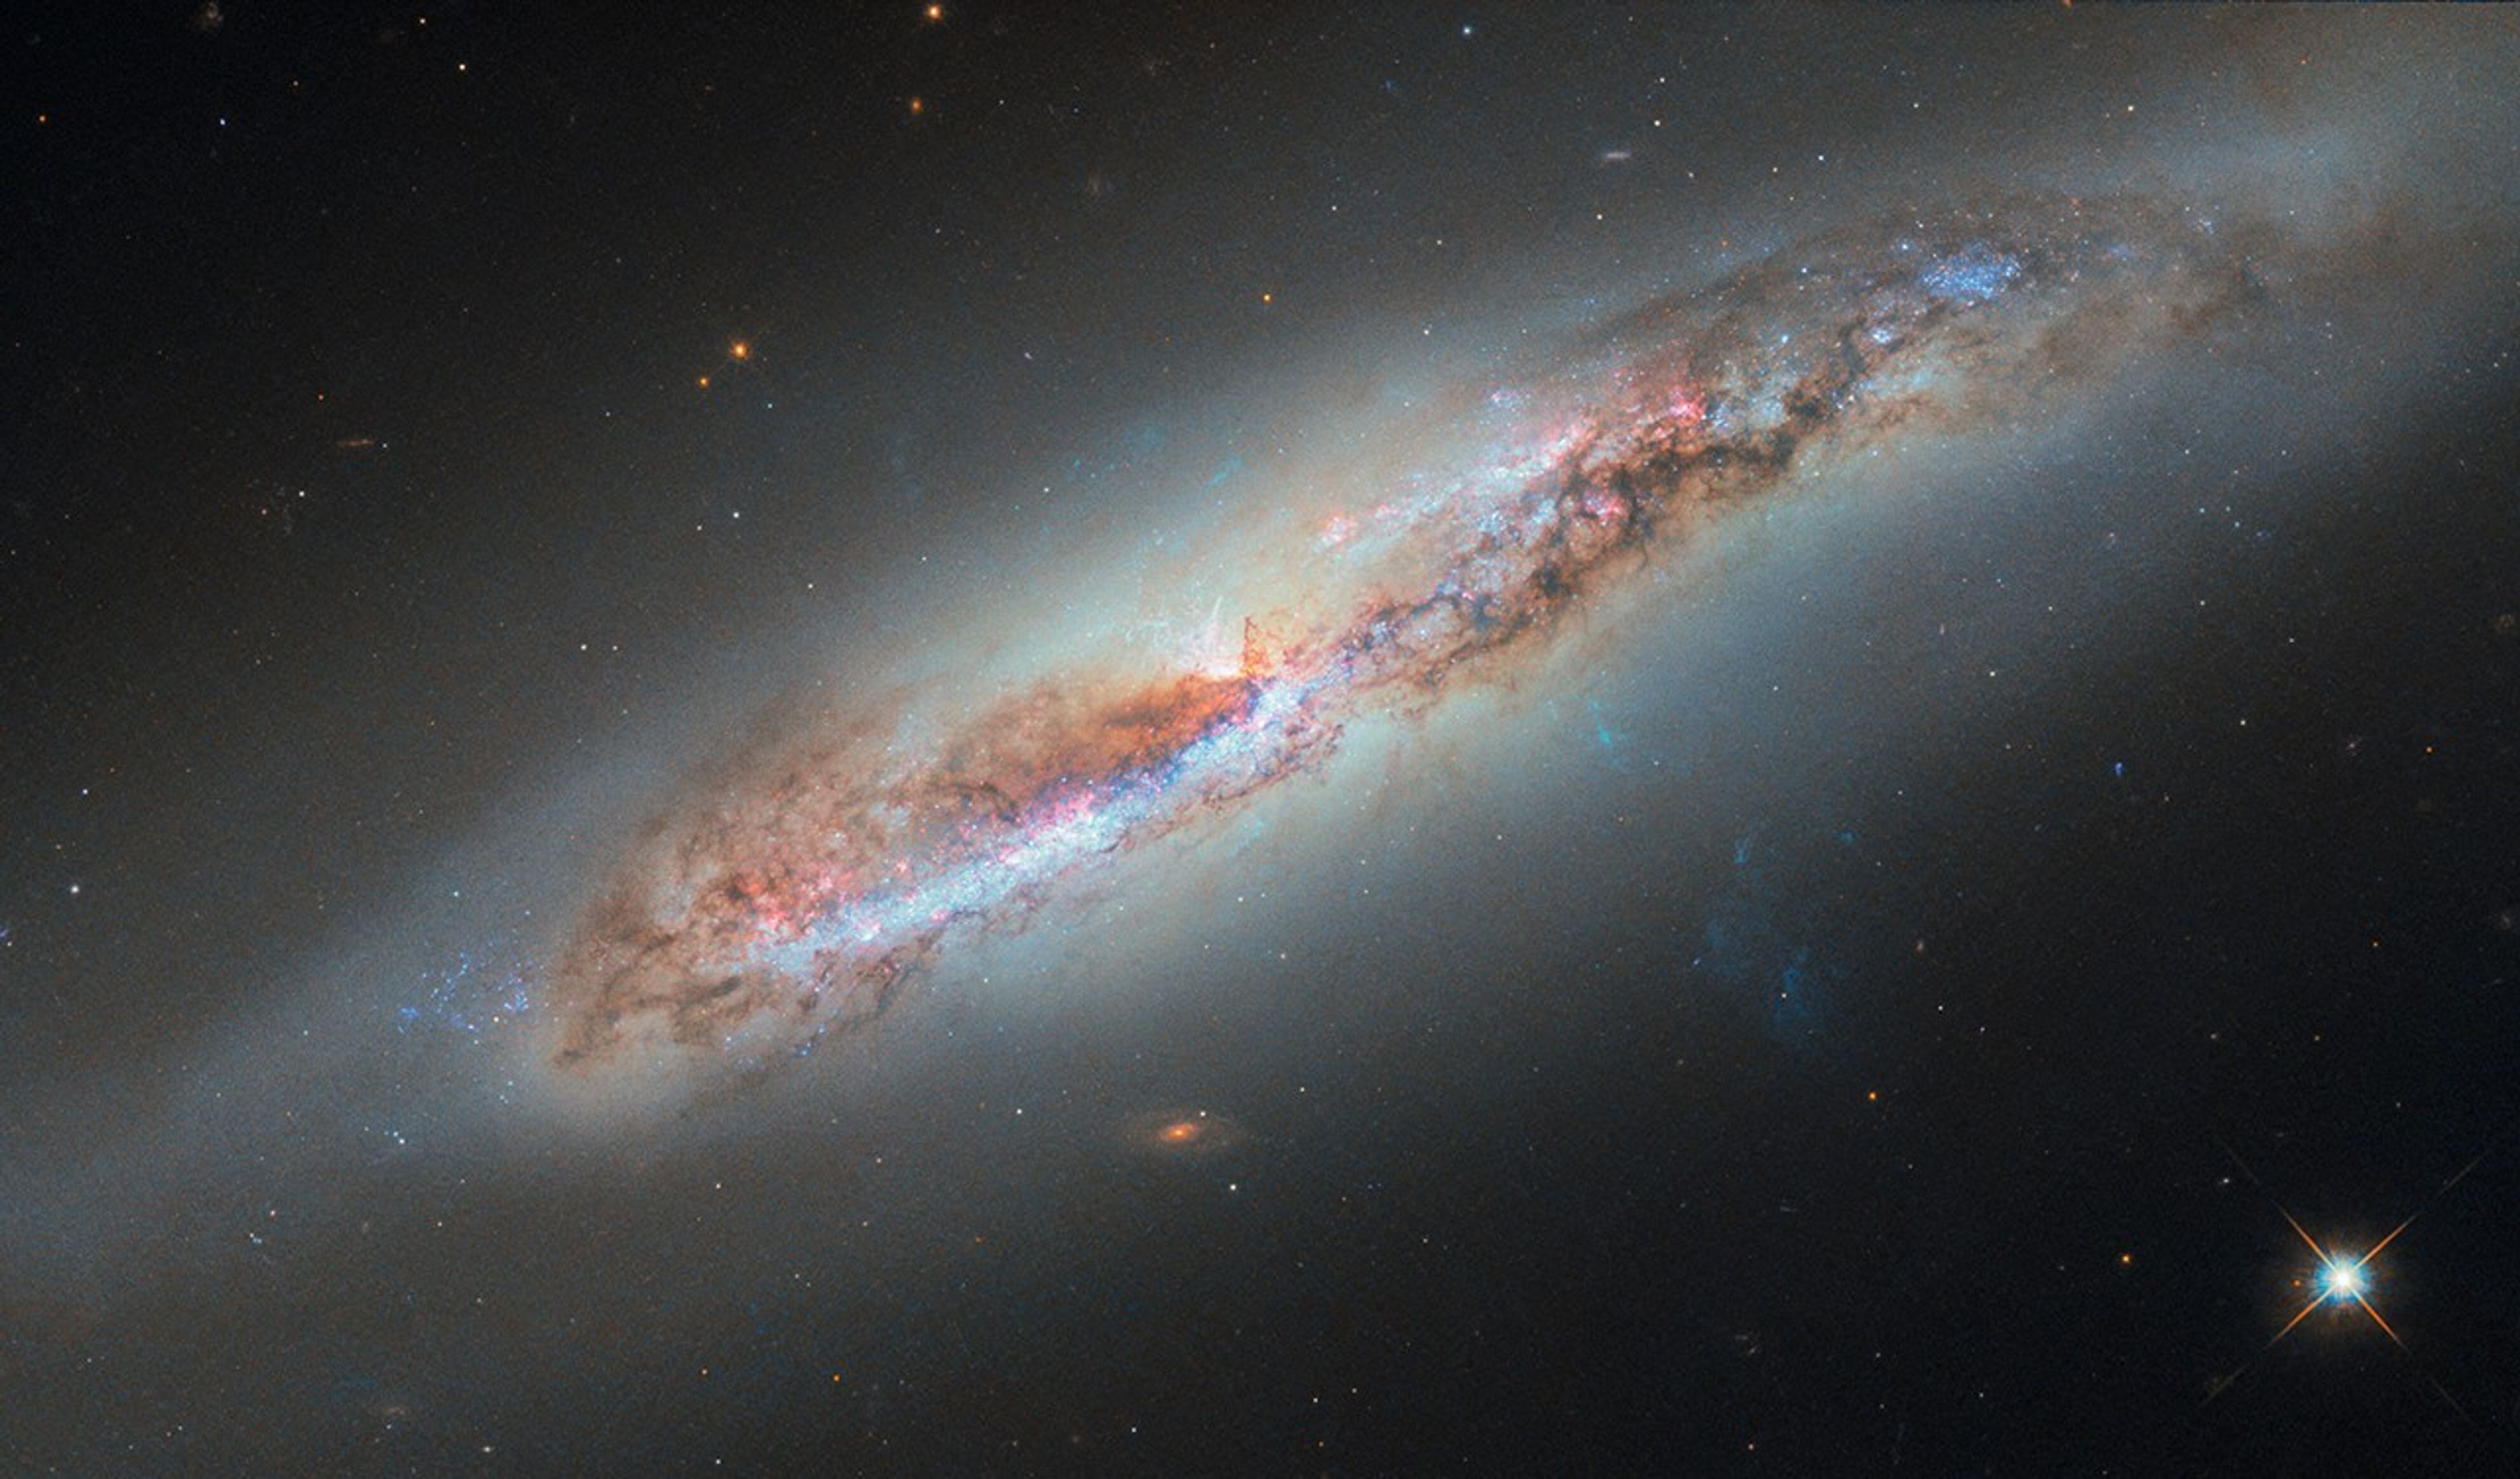
A sideways spiral galaxy shines in this NASA/ESA Hubble Space Telescope image. Located about 60 million light-years away in the constellation Virgo (the Maiden), NGC 4388 is a resident of the Virgo galaxy cluster. This enormous cluster of galaxies contains more than a thousand members and is the nearest large galaxy cluster to the Milky Way.
NGC 4388 appears to tilt at an extreme angle relative to our point of view, giving us a nearly edge-on prospect of the galaxy. This perspective reveals a curious feature that wasn’t visible in a previous Hubble image of this galaxy released in 2016: a plume of gas from the galaxy’s nucleus, here seen billowing out from the galaxy’s disk toward the lower-right corner of the image. But where did this outflow come from, and why does it glow?
The answer likely lies in the vast stretches of space that separate the galaxies of the Virgo cluster. Though the space between galaxies appears empty, this space is occupied by hot wisps of gas called the intracluster medium. As NGC 4388 moves within the Virgo cluster, it plunges through the intracluster medium. Pressure from hot intracluster gas whisks away gas from within NGC 4388’s disk, causing it to trail behind as NGC 4388 moves.
The source of the ionizing energy that causes this gas cloud to glow is more uncertain. Researchers suspect that some of the energy comes from the center of the galaxy, where a supermassive black hole spins gas around it into a superheated disk. The blazing radiation from this disk might ionize the gas closest to the galaxy, while shock waves might be responsible for ionizing filaments of gas farther out.
This image incorporates new data, including several additional wavelengths of light, that bring the ionized gas cloud into view. The image holds data from several observing programs that aim to illuminate galaxies with active black holes at their centers.
Image credit: ESA/Hubble & NASA, S. Veilleux, J. Wang, J. Greene
Hubble Glimpses Galactic Gas Making a Getaway
Solar Flares and Stellar Flares Hit Different
Sunspots and solar flares go hand in hand. They generally occur in the same region of the Sun around the same time. We've long thought the same would be true for other stars, but a new study finds that isn't the case.
The Quadrantid Meteors and Earth at Perihelion Usher in the New Skywatching Year
It sneaks up on us, every annual flip of the calendar into the new year. If skies are clear, keep an eye out for the brief but strong Quadrantid meteors this weekend. The Quadrantids or ‘Quads’ have a brief but strong annual peak just after New Year’s Day. This also makes the shower notoriously elusive for observers.
Why Astronomy Needs a Giant in the Canary Islands
Size matters when it comes to telescopes. The bigger they are, the farther they can see. Prioritizing constructing large ones is therefore high on the priority list for many observational organizations. But doing so comes at a cost, and not just in terms of money. Finding a suitable site can be a challenge, and that has been particularly true for the effort to build a 30-meter telescope in the Northern hemisphere. A new paper, available in pre-print on arXiv by Francesco Coti Zelati of the Spanish Institute of Space Sciences in Barcelona and his co-authors, makes the argument for building it at the Roque de los Muchachos Observatory in La Palma.
Gargantuan black hole may be a remnant from the dawn of the universe
Gargantuan black hole may be a remnant from the dawn of the universe
How Woodpeckers Turn Their Entire Bodies into Pecking Machines
These birds’ drilling approach is more like extreme tennis playing than weight lifting
The Pleiades Star Cluster Has a Secret Stellar Family
The “Seven Sisters” of the Pleiades are part of a much larger complex that can help reveal our galaxy’s deep history
This Week's Sky at a Glance, January 2 – 11
The bright Moon shines over Jupiter, Pollux and Castor on Friday evening the 2nd, then
groups right up among them on Saturday the 3rd.
The post This Week's Sky at a Glance, January 2 – 11 appeared first on Sky & Telescope.