
NASA - Breaking News
NASA Astronaut Nick Hague Retires
NASA astronaut Brig. Gen. Nick Hague has retired from the agency, concluding a distinguished career that included two spaceflight missions, 374 days in space, and multiple spacewalks in support of the International Space Station. Hague continues service in the U.S. Space Force.
Hague launched aboard the Soyuz MS-12 spacecraft in March 2019 from the Baikonur Cosmodrome in Kazakhstan for his first long-duration mission, serving as a flight engineer during Expeditions 59/60. During this 203-day mission, he conducted three spacewalks to upgrade the station’s power systems and support ongoing maintenance of the orbiting laboratory. Hague also contributed to a wide range of scientific investigations, spanning biology, human physiology, materials science, and technology demonstrations.
Hague originally was assigned to fly in 2018 as part of the Soyuz MS-10 crew. The mission experienced a launch anomaly shortly after liftoff, and Hague and his crewmate executed a high-G ballistic abort. The two landed safely and Hague returned to flight status within months, ultimately completing his 2019 mission.
He flew again during NASA’s SpaceX Crew-9 mission, launching in September 2024 alongside Roscosmos cosmonaut Aleksandr Gorbunov. It was the first human spaceflight mission launched from Space Launch Complex 40 at Cape Canaveral Space Force Station in Florida, and it also marked the first time a Space Force Guardian launched to space. Hague then joined the Expedition 72 crew, spending 171 days aboard the station before returning in March 2025 along with NASA astronauts Butch Wilmore and Suni Williams. During the mission, he conducted another spacewalk, bringing his career total to 25 hours and 56 minutes across four spacewalks.
“Nick’s determination and dedication to human space exploration are truly phenomenal,” said Vanessa Wyche, director of NASA’s Johnson Space Center in Houston. “His leadership and commitment to mission excellence have supported progress aboard the International Space Station and prepared us for future missions as we continue to explore farther into the solar system.”
Beyond his flight experience, Hague served in several technical and leadership roles within NASA. He supported the development of future spacecraft operations, contributed to astronaut training, and played a key role in human spaceflight safety initiatives, drawing on his firsthand experience during the MS-10 launch abort.
“Nick brought calm, clarity, and a spirit of teamwork to every situation,” said Scott Tingle, chief of the Astronaut Office at NASA Johnson. “From his work in orbit to his support of crew operations here on Earth, he exemplified what it means to be an astronaut. His impact will continue to shape the missions and the astronauts who follow.”
A native of Hoxie, Kansas, Hague is a brigadier general in the U.S. Space Force where he is responsible for the development and implementation of policy for all U. S. Space Force global operations, sustainment, training and readiness. He earned a bachelor’s degree in astronautical engineering from the U.S. Air Force Academy in Colorado and a master’s degree in astronautical engineering from the Massachusetts Institute of Technology. Before joining NASA in 2013, he served in developmental and test engineer roles supporting advanced Air Force technologies and operations at home and abroad.
“It has been an honor to serve as a NASA astronaut,” said Hague. “Working alongside incredible teams, on the ground and in space, has been the privilege of a lifetime. The International Space Station represents the very best of what humanity can accomplish when we work together. I am grateful to have contributed to that mission, and I look forward to watching NASA, our partners, and the next generation of explorers push even farther as we return to the Moon and journey on to Mars.”
To learn more about NASA’s astronauts and their contributions to space exploration, visit:
https://www.nasa.gov/astronauts
-end-
Shaneequa Vereen
Johnson Space Center, Houston
281-483-5111
shaneequa.y.vereen@nasa.gov
NASA’s Hubble Reveals Largest Found Chaotic Birthplace of Planets
- Hubble Home
- Overview
- Impact & Benefits
- Science
- Observatory
- Team
- Multimedia
- News
- More
Astronomers using NASA’s Hubble Space Telescope have imaged the largest protoplanetary disk ever observed circling a young star. For the first time in visible light, Hubble has revealed the disk is unexpectedly chaotic and turbulent, with wisps of material stretching much farther above and below the disk than astronomers have seen in any similar system. Strangely, more extended filaments are only visible on one side of the disk. The findings, which published Tuesday in The Astrophysical Journal, mark a new milestone for Hubble and shed light on how planets may form in extreme environments, as NASA’s missions lead humanity’s exploration of the universe and our place in it.
Located roughly 1,000 light-years from Earth, IRAS 23077+6707, nicknamed “Dracula’s Chivito,” spans nearly 400 billion miles — 40 times the diameter of our solar system to the outer edge of the Kuiper Belt of cometary bodies. The disk obscures the young star within it, which scientists believe may be either a hot, massive star, or a pair of stars. And the enormous disk is not only the largest known planet-forming disk; it’s also shaping up to be one of the most unusual.
“The level of detail we’re seeing is rare in protoplanetary disk imaging, and these new Hubble images show that planet nurseries can be much more active and chaotic than we expected,” said lead author Kristina Monsch of the Center for Astrophysics | Harvard & Smithsonian (CfA). “We’re seeing this disk nearly edge-on and its wispy upper layers and asymmetric features are especially striking. Both Hubble and NASA’s James Webb Space Telescope have glimpsed similar structures in other disks, but IRAS 23077+6707 provides us with an exceptional perspective — allowing us to trace its substructures in visible light at an unprecedented level of detail. This makes the system a unique, new laboratory for studying planet formation and the environments where it happens.”
The nickname “Dracula’s Chivito” playfully reflects the heritage of its researchers—one from Transylvania and another from Uruguay, where the national dish is a sandwich called a chivito. The edge-on disk resembles a hamburger, with a dark central lane flanked by glowing top and bottom layers of dust and gas.
This Hubble Space Telescope image shows the largest planet-forming disk ever observed around a young star. It spans nearly 400 billion miles — 40 times the diameter of our solar system. Image: NASA, ESA, STScI, Kristina Monsch (CfA); Image Processing: Joseph DePasquale (STScI) Puzzling asymmetryThe impressive height of these features wasn’t the only thing that captured the attention of scientists. The new images revealed that vertically imposing filament-like features appear on just one side of the disk, while the other side appears to have a sharp edge and no visible filaments. This peculiar, lopsided structure suggests that dynamic processes, like the recent infall of dust and gas, or interactions with its surroundings, are shaping the disk.
“We were stunned to see how asymmetric this disk is,” said co-investigator Joshua Bennett Lovell, also an astronomer at the CfA. “Hubble has given us a front row seat to the chaotic processes that are shaping disks as they build new planets — processes that we don’t yet fully understand but can now study in a whole new way.”
All planetary systems form from disks of gas and dust encircling young stars. Over time, the gas accretes onto the star, and planets emerge from the remaining material. IRAS 23077+6707 may represent a scaled-up version of our early solar system, with a disk mass estimated at 10 to 30 times that of Jupiter — ample material for forming multiple gas giants. This, plus the new findings, makes it an exceptional case for studying the birth of planetary systems.
“In theory, IRAS 23077+6707 could host a vast planetary system,” said Monsch. “While planet formation may differ in such massive environments, the underlying processes are likely similar. Right now, we have more questions than answers, but these new images are a starting point for understanding how planets form over time and in different environments.”
Credit: NASA’s Goddard Space Flight Center; Lead Producer: Paul MorrisThe Hubble Space Telescope has been operating for over three decades and continues to make ground-breaking discoveries that shape our fundamental understanding of the universe. Hubble is a project of international cooperation between NASA and ESA (European Space Agency). NASA’s Goddard Space Flight Center in Greenbelt, Maryland, manages the telescope and mission operations. Lockheed Martin Space, based in Denver, also supports mission operations at Goddard. The Space Telescope Science Institute in Baltimore, which is operated by the Association of Universities for Research in Astronomy, conducts Hubble science operations for NASA.
Facebook logo @NASAHubble @NASAHubble Instagram logo @NASAHubble Related Images & Videos Dracula’s Chivito (IRAS 23077+6707)This Hubble Space Telescope image shows the largest planet-forming disk ever observed around a young star. It spans nearly 400 billion miles — 40 times the diameter of our solar system.
Dracula’s Chivito (IRAS 23077+6707) Compass Image
Image of Dracula’s Chivito captured by Hubble’s WFC3 instrument, with compass arrows, scale bar, and color key for reference.
Hubble Spots Giant Vampire Sandwich? Video
Dracula’s Chivito isn’t just the largest protoplanetary disk ever imaged, it’s also a window into how planets are born and how systems like our solar system may have formed.
Claire Andreoli
NASA’s Goddard Space Flight Center
Greenbelt, Maryland
claire.andreoli@nasa.gov
Christine Pulliam
Space Telescope Science Institute
Baltimore, Maryland
Amy Oliver
Center for Astrophysics | Harvard & Smithsonian
Cambridge, Massachusetts
- Science Paper: Hubble reveals complex multi-scale structure in the edge-on protoplanetary disk IRAS 23077+6707 by K. Monsch et al.
Keep Exploring Discover More Topics From Hubble Hubble Space Telescope
Since its 1990 launch, the Hubble Space Telescope has changed our fundamental understanding of the universe.
Hubble Science Highlights
Hubble Images
Hubble News
I Am Artemis: Grace Lauderdale
Listen to this audio excerpt from Grace Lauderdale, exploration project manager for the Training Systems Office at NASA Johnson:
0:00 / 0:00
Your browser does not support the audio element.In preparation for their mission around the Moon inside NASA’s Orion spacecraft, the Artemis II crew will spend countless hours training inside the Orion Mission Simulator. The simulator replicates what the crew will experience inside the spacecraft and allows the astronauts and flight controllers to rehearse every phase of the mission.
As the exploration project manager for the Training Systems Office at Johnson, Grace Lauderdale leads the team that develops and operates the Orion Mission Simulator at NASA’s Johnson Space Center in Houston, playing a key role in making sure astronauts and flight control teams are ready for the first crewed mission of the Artemis campaign.
"This simulator trains the flight control team and the crew all the way from launch to splashdown. Every button, every display, every view out the window is as lifelike as possible.”Grace Lauderdale
Exploration Project Manager for the Training Systems Office at NASA Johnson
The simulator is more than a mock-up. It connects directly to Johnson’s Mission Control Center, sending real-time data, audio, and video — just like the spacecraft will during flight. That means the flight control team trains in parallel, seeing and hearing exactly what they would throughout the mission.
“One of our major goals is to make the data they see on their displays look like the real vehicle,” Lauderdale said. “We also simulate the near space and deep space networks, including all the communication delays. It’s all about realism.”
That realism is powered by a complex software system developed in collaboration with partners like Lockheed Martin. Lauderdale’s team works behind the scenes to ensure the simulator runs smoothly — writing code, troubleshooting issues, and even creating custom malfunctions to challenge the crew during training.
Grace Lauderdale, exploration project manager for the Training Systems Office at NASA’s Johnson Space Center in Houston, sits inside the Orion Mission Simulator used for training the Artemis II crew and flight control team.Credits: NASA/Rad SinyakTo prepare astronauts for the unexpected, instructors work with Lauderdale’s team to simulate problems that could occur during the mission, some of which require creative solutions.
“There are times when the instructors will ask for malfunctions or capabilities that the sim doesn’t automatically do,” she said. “Part of our role is to come up with ways to make that happen.”
Her team plans, develops, and executes training scenarios in the Orion Mission Simulator across multiple Artemis missions, often simultaneously. “Currently, we’re planning for future crewed missions, developing Artemis III, and executing Artemis II,” she said.
The work is demanding, but deeply personal, according to Lauderdale.
“I’ve known I wanted to work at NASA since the seventh grade. Every class I took, the degree I earned — it was all to get here.”Grace Lauderdale
Exploration Project Manager for the Training Systems Office at NASA Johnson
That passion shows in her leadership. Her team often works nights, weekends, and holidays to ensure the simulator is ready. During a recent 30-hour simulation, they spent days preparing, fixing memory issues, and ensuring the system wouldn’t crash. It didn’t.
“I’m very proud of my team,” she said. “They’ve put in countless hours of work to make sure this simulator reacts exactly as it would in the real mission.”
For Lauderdale, helping send astronauts around the Moon isn’t just a job—it’s a dream realized.
“Being part of getting us back to the Moon is very personal to me,” she said. “And I’m proud to be part of the team that will help get our astronauts there.”
Reid Wiseman and Victor Glover train for the Artemis II mission inside the Orion Mission Simulator at NASA’s Johnson Space Center in Houston. NASA/Bill Stafford About the AuthorErika Peters Share Details Last Updated Dec 22, 2025 Related Terms Explore More 3 min read Get In, We’re Going Moonbound: Meet NASA’s Artemis Closeout Crew Article 6 days ago 4 min read Artemis II Flight Crew, Teams Conduct Demonstration Ahead of Launch Article 6 days ago 6 min read NASA Kennedy Top 20 Stories of 2025 Article 7 days ago Keep Exploring Discover More Topics From NASAMissions
Humans in Space
Climate Change
Solar System
Curiosity Blog, Sols 4750-4762: See You on the Other Side of the Sun
- Curiosity Home
- Science
- News and Features
- Multimedia
- Mars Missions
- Mars Home
3 min read
Curiosity Blog, Sols 4750-4762: See You on the Other Side of the Sun NASA’s Mars rover Curiosity acquired this image, with the boxwork terrain in the foreground and Gale crater rim in the far background, using its Right Navigation Camera. Curiosity captured the image on Dec. 21, 2025 — Sol 4755, or Martian day 4,755 of the Mars Science Laboratory mission — at 15:57:21 UTC. NASA/JPL-CaltechWritten by Lucy Thompson, Planetary Scientist and APXS team member, University of New Brunswick, Canada
Earth planning date: Monday, Dec. 22, 2025
As we all prepare for the holiday season here on Earth, we have been planning a few last activities before Curiosity and the team of scientists and engineers take a well-deserved, extended break. This holiday season coincides with conjunction — every two years, because of their different orbits, Earth and Mars are obstructed from one another by the Sun; this one will last from Dec. 27 to Jan. 20. We do not like to send commands through the Sun in case they get scrambled, so we have been finishing up a few last scientific observations before preparing Curiosity for its quiet conjunction break.
As part of a pre-planned transect between our two recent drill holes, “Valle de la Luna” (hollow) and “Nevado Sajama” (ridge), we successfully completed chemical analyses and imaging of a ridge wall. These observations were acquired to document changes in texture, structure, and composition between the two drill holes and to elucidate why we see such contrasting physical features of resistant ridges and eroded hollows in this region. Mastcam and ChemCam also imaged a little further afield. ChemCam continued observations of the “Mishe Mokwa” butte and captured textures in the north facing wall of the next, adjacent hollow. Mastcam imaged the central fracture along the “Altiplano” ridge above the wall we were parked at, as well as polygonal features in our previous workspace.
The rover engineers then successfully orchestrated Curiosity’s drive back up onto the nearby ridge to ensure a safe parking spot over conjunction. We documented the drive with a MARDI sidewalk video, tracking how the terrain beneath the rover changes as we drive. Although we could not use APXS and MAHLI on the robotic arm from Friday on, owing to constraints that need to be in place prior to conjunction, we were able to use the rover’s Mastcam to image areas of interest in the near field, which will help us with our planned activities when we return from conjunction. These will hopefully include getting chemistry (with APXS and ChemCam) and imaging (with MAHLI) of some freshly broken rock surfaces that we drove over.
The environmental scientists were also very busy. Navcam observations included: Navcam suprahorizon and zenith movies to monitor clouds; Navcam line-of-sight observations; and Navcam dust-devil movies and surveys as we enter the dust storm season on Mars. Mastcam tau observations were acquired to monitor the optical depth of the atmosphere, and APXS analyses of the atmosphere were also planned to monitor seasonal variations in argon.
Today we are uplinking the last plan before Mars disappears behind the Sun and we all take a break (the actual conjunction plan to take us through sols 4763-4787 was uplinked a couple of weeks ago). Because of constraints put in place to make sure Curiosity stays safe and healthy, we were limited to very few activities in today’s plan. These include more APXS atmospheric argon measurements and Hazcam and Navcam imaging including monitoring for dust-devil activity.
As usual, our plans also included background DAN, RAD, and REMS observations, which continue through conjunction.
It has been a pleasure to be a part of this amazing team for another year. We are all looking forward to coming back in January, when Mars reappears from behind the Sun, to another exciting year of roving in Gale crater.
-
Want to read more posts from the Curiosity team?
-
Want to learn more about Curiosity’s science instruments?
Article
3 days ago
3 min read Curiosity Blog, Sols 4743-4749: Polygons in the Hollow
Article
4 days ago
2 min read Hi ya! Hyha
Article
5 days ago
Keep Exploring Discover More Topics From NASA Mars
Mars is the fourth planet from the Sun, and the seventh largest. It’s the only planet we know of inhabited…
All Mars Resources
Explore this collection of Mars images, videos, resources, PDFs, and toolkits. Discover valuable content designed to inform, educate, and inspire,…
Rover Basics
Each robotic explorer sent to the Red Planet has its own unique capabilities driven by science. Many attributes of a…
Mars Exploration: Science Goals
The key to understanding the past, present or future potential for life on Mars can be found in NASA’s four…
Holidays in Space: 25 Years of Space Station Celebrations
In the quarter century that humans have lived and worked aboard the International Space Station, astronauts and visitors from around the world have celebrated countless holidays more than 250 miles above Earth while traveling 17,500 miles per hour. Crews have marked Thanksgiving, Christmas and Hanukkah, New Year’s, birthdays, and national holidays as they circle the planet every 90 minutes.
Holiday traditions in space often look familiar, just adapted for microgravity. NASA astronauts share special meals packed by the Space Food Systems Laboratory at the agency’s Johnson Space Center in Houston, where crews select their menus with help from nutritionists and food scientists before launch. Cargo launches arriving before special occasions often deliver Holiday Bulk Overwrapped Bags filled with foods like clams, oysters, turkey, green beans, and smoked salmon, along with shelf-stable treats such as candies, icing, almond butter, and hummus.
Crew members exchange small gifts that float through the modules, add festive decorations around the station, and connect with loved ones through video calls. Astronauts also send holiday greetings to Earth, a reminder that even in space, home is never far away.
The Expedition 73 crew share a holiday message aboard the International Space Station in Dec. 2025.Enjoy 25 years of celebrations below.
NASA astronauts Nick Hague and Suni Williams, Expedition 72 flight engineer and commander, share snacks and goodies on Christmas Eve in 2024 inside the gallery of the space station’s Unity module.NASA Four Expedition 70 crewmates join each other inside the space station’s Unity module for a Christmas Day meal in Dec. 2023. From left are, Flight Engineer Koichi Wakata from JAXA (Japan Aerospace Exploration Agency); Commander Andreas Mogensen from ESA (European Space Agency); and NASA Flight Engineers Loral O’Hara and Jasmin Moghbeli.NASA ESA astronaut Samantha Cristoforetti pictured aboard the space station on Dec. 20, 2014, during Expedition 42.NASA Expedition 4 crew members, former NASA astronauts Daniel Bursch and Carl Walz, along with Roscosmos cosmonaut Yuri Onufriyenko, pose for a Christmas photo in Dec. 2001. NASA The Expedition 64 crew celebrate Christmas in 2019 with a brunch inside the space station’s Unity module decorated with stockings, flashlight “candles” and a Christmas tree banner. Clockwise from bottom left are, NASA Flight Engineers Jessica Meir and Christina Koch, Roscosmos Flight Engineers Oleg Skripochka and Alexander Skvortsov, NASA Flight Engineer Drew Morgan, and Commander Luca Parmitano of ESA. Expedition 13 crew members, Roscosmos cosmonaut Valery I. Tokarev, left, and former NASA astronaut William McArthur, pose with Christmas stockings in Dec. 2005.NASA The six Expedition 30 crew members assemble in the U.S. Destiny laboratory aboard the space station for a Christmas celebration in Dec. 2011. NASA Four Expedition 70 crewmates join each other inside the space station’s Unity module for Christmas Eve festivities in 2023. From left are, NASA Flight Engineers Jasmin Moghbeli and Loral O’Hara; Flight Engineer Koichi Wakata from JAXA; and Commander Andreas Mogensen from ESA.NASA Expedition 22 crew members celebrate the holidays aboard the orbital outpost in Dec. 2009. In the front row are former NASA astronaut Jeffrey Williams, commander (right), and Russian cosmonaut Maxim Suraev, flight engineer. In the back row, from left, are Russian cosmonaut Oleg Kotov, former NASA astronaut T.J. Creamer, and JAXA astronaut Soichi Noguchi, all flight engineers. NASA Expedition 50 crew members celebrate the holidays aboard the orbiting laboratory in Dec. 2016.NASA NASA astronauts Don Pettit and Suni Williams, Expedition 72 flight engineer and commander, pose for a fun holiday season portrait while speaking on a ham radio inside the space station’s Columbus laboratory module.NASA NASA astronaut and Expedition 72 Commander Suni Williams shows off a holiday decoration of a familiar reindeer aboard the space station on Dec. 16, 2024. The decoration was crafted with excess hardware, cargo bags, and recently-delivered Santa hats.NASAThe space station remains a vital scientific platform, providing the foundation needed to survive and thrive as humanity ventures into the unexplored territories of our universe.
Learn more about the space station’s 25 years of continuous human presence and explore stories, images, and research at:
https://www.nasa.gov/international-space-station/iss25
Explore More 3 min read Get In, We’re Going Moonbound: Meet NASA’s Artemis Closeout Crew Article 2 days ago 4 min read Artemis II Flight Crew, Teams Conduct Demonstration Ahead of Launch Article 2 days ago 6 min read NASA Kennedy Top 20 Stories of 2025 Article 3 days agoSentinels in the Sky: 50 Years of GOES Satellite Observations
15 min read
Sentinels in the Sky: 50 Years of GOES Satellite ObservationsIntroduction
In an era where satellite observations of Earth are commonplace, it’s easy to forget that only a few decades ago, the amount of information available about the state of Earth’s environment was limited; observations were infrequent and data were sparsely located.
As far back as the late 1950s, there were primitive numerical weather prediction (NWP) models that could produce an accurate (or what a forecaster would call “skillful”) forecast given a set of initial conditions. However, the data available to provide those initial conditions at that time were limited. For example, the weather balloon network circa 1960 only covered about 10% of the troposphere and did not extend into the Southern Hemisphere, the tropics, or over the ocean.
Weather forecasters of the pre-satellite era typically relied upon manual analysis of plotted weather maps, cloud observations, and barometric pressure readings when making forecasts. They combined this limited dataset with their own experience issuing forecasts in a particular area to predict upcoming weather and storm events. While those pioneering forecasters made the most of the limited tools available to them, poor data – or simply the lack of data – inevitably led to poor forecasts, which usually weren’t accurate beyond two days. This time duration was even less than that in the Southern Hemisphere. As a result, the forecasts issued typically lacked the specificity and lead time required to adequately prepare a community before a snowstorm or hurricane.
Although the first satellite observations (e.g., from the Television Infrared Observation Satellite (TIROS) program or early Nimbus missions) whet forecasters’ appetites for what might be possible in terms of improving weather forecasting, polar orbiting satellites could only observe a given location twice a day. Those snapshots from above were insufficient for tracking rapidly evolving weather phenomena (e.g., thunderstorms, tornadoes, and intensification of hurricanes). Beyond cloud information, forecasters required data on temperature, moisture, and wind profiles in the atmosphere in addition to output from NWP models.
It was the advent of geostationary observations (also called geosynchronous) that truly led to revolutionary advances in weather forecasting. This approach enabled continuous monitoring of the atmosphere over a particular region on Earth. Hence, the development and evolution of NOAA’s Geostationary Operational Environmental Satellites (GOES) has been a major achievement for weather forecasting.
For 50 years, GOES have kept a constant vigil over the Western Hemisphere and monitored the Sun and the near-Earth environment – see Visualization 1. Since 1975, the National Oceanic and Atmospheric Administration (NOAA) and NASA have partnered to advance NOAA satellite observations from geostationary orbit. GOES satellites serve as sentinels in the sky, keeping constant watch for severe weather and environmental hazards on Earth as well as dangerous space weather. This narrative will focus on the development and evolutions of the Earth observing instruments on GOES with a mention of several of the space weather instruments.
Visualization 1. A YouTube video, created for the 50th anniversary of GOES, examines the partnership between the National Oceanic and Atmospheric Administration (NOAA) and NASA to advance NOAA satellite observations from geostationary orbit to monitor for weather and environmental hazards on Earth as well as dangerous space weather.Visualization credit: NOAA/NASA
Reaching a half-century of operation is a remarkable achievement for GOES, or any mission. The Earth Observer has published several articles chronicling the milestones of Earth observing missions, including The Vanguard of Earth-Observing Satellites [March–April 2019, 31:2, 7–18], Nimbus Celebrates Fifty Years [March–April 2015, 27:2, 18–31], and NASA Participates in Pecora 22 Symposium and Celebrates Landsat 50th Anniversary [Nov.–Dec. 2022, 34:6, 4–9]. This article, reflecting on GOES accomplishments, will join that list.
The article provides the history leading up to the development of GOES and traces the development of GOES from the earliest launch in 1975 to the last launch in late 2024, which completed the GOES–R series – see Figure 1. The article ends with a look at the plans for Geostationary Extended Observations (GeoXO), which seeks to extend the GOES legacy to the middle of the 21st century, followed by some concluding thoughts.
Figure 1. Timeline of GOES launches including key technological developments associated with each “generation” of satellites.Figure credit: NOAA/NASAGOES Heritage Missions: ATS and SMS
The heritage of GOES can be traced to the Applications Technology Satellite (ATS) series, which consisted of a set of six NASA spacecraft launched from December 7, 1966 to May 30, 1974. These missions were created to explore and flight-test new technologies and techniques for communications, meteorological, and navigation satellites. ATS was a multipurpose engineering satellite series, testing technology in communications and meteorological applications from geosynchronous orbit.
ATS satellites aimed to test the theory that gravity would anchor a satellite in a synchronous orbit, 22,300 statute miles (37,015 km) above the Earth. This orbit allowed the satellites to move at the same rate as the Earth, thus seeming to remain stationary. Although the ATS satellites were intended mainly as testbeds, they also collected and transmitted meteorological data and functioned at times as communications satellites. For example, ATS-6, the last in the series, was the first to use an education and experimental direct broadcast system, which is now commonplace on Earth observing satellites (e.g., Terra).
Also included in the ATS payload was a spin-scan camera that Verner Suomi and associates had developed in the early 1960s. The device was so named because it compensated for the motion of the satellite and still obtained clear visible (television-like) photographs. The University of Wisconsin, Madison’s (UWM) Space Science and Engineering Center (SSEC), which Suomi and colleagues at UWM had just recently established, funded the camera’s development and NASA approved its inclusion as part of the ATS payload. The spin-scan camera on ATS-1 produced spectacular full disk images of Earth; a few years later the camera on ATS-3 produced similar images, this time in color.
Although designed primarily to test and demonstrate new technologies, imagery captured by the ATS payload led to some serendipitous science. Analysis of spin-scan camera images, while labor intensive and expensive and not practical for use operationally, led to new discoveries about storm origins that had never before been available. For example, Tetsuya Fujita analyzed ATS camera images of storms in the Midwest United States in 1968 as part of his in-depth studies of tornadoes. This work led to the development of the Fujita Scale for tornado intensity. Also in 1968, “Hurricane Hunter” aircraft data and radar imagery, along with ATS images allowed meteorologists to observe the complete life cycle of Hurricane Gladys. Today, this approach is routine, but at the time it was groundbreaking.
Following the success of the ATS “technology demonstration” series, NASA and NOAA began to develop an operational prototype of the dedicated geosynchronous weather satellite, the Synchronous Meteorological Satellite (SMS). SMS-1 was launched in 1974, with SMS-2 following the next year. Owned and operated by NASA, the SMS satellites were the first operational satellites designed to sense meteorological conditions in geostationary orbit over a fixed location on the Earth’s surface. The ATS spin-scan camera manufacturers – SSEC and Santa Barbara Research – altered their ATS camera design, replacing the television-like photographic apparatus with an imaging radiometer with eight visible and three infrared channels. The revised instrument became known as the Visible and Infrared Spin-Scan Radiometer (VISSR). They also added a telescope that would allow for high-resolution imaging of smaller portions of Earth, allowing researchers to study storm formation in more detail.
First Generation: GOES 1–3
The GOES era began in October 1975 with the launch of GOES-1 (initially called SMS-3). The first three GOES missions were spin-stabilized satellites. The VISSR instrument, initially developed for the SMS missions, became the workhorse instrument for the first generation of GOES missions. VISSR provided high-quality day and night observations of cloud and surface temperatures, cloud heights, and wind fields – see Figure 2.
The early GOES missions also focused on monitoring space weather. The first generation of GOES featured a Space Environment Monitor (SEM) to measure proton, electron, and solar X-ray fluxes as well as magnetic fields around the satellites. This technology became standard on all subsequent GOES satellite missions.
Figure 2. First image from GOES-1 obtained on October 25, 1975.Figure credit: NOAAThe new satellites quickly began providing critical information about the location and trajectory of hurricanes. The earliest generation of GOES provided crucial data about Tropical Storm Claudette and Hurricane David in 1979 – both of which devastated regions of the United States.
Second Generation: GOES 4–7
The second generation of GOES began in 1980, with the launch of GOES-4. NASA, NOAA, and SSEC collaborated to make further enhancements to the VISSR instrument, adding temperature sounding capabilities. The development of the VISSR Atmospheric Sounder (VAS) was particularly helpful for the study and forecasting of severe storms. While there were sounders on polar orbiting satellites of this era (e.g., TIROS and Nimbus), polar orbiters, which take measurements of the same location twice daily, often missed events that occurred on shorter timescales, such as thunderstorms. By contrast, VAS on GOES could image the same area every half-hour, allowing for more detailed tracking of storms, leading to improved severe storm forecasting and enabling more advanced warning of the storm’s arrival. VAS became the basis for the establishment of an extensive severe storm research program during the 1980s.
The second generation GOES missions were capable of obtaining vertical profiles of temperature and moisture throughout the various layers of the atmosphere. This added dimension gave forecasters a more accurate picture of a storm’s extent and intensity, allowed them to monitor rapidly changing events, and helped to predict fog, frost, and freeze, as well as dust storms, flash floods, and even the likelihood of tornadoes.
The second generation of GOES helped forecasters track and forecast the impacts from the 1982–1983 El Niño event – one of the strongest El Niño–Southern Oscillation (ENSO) events on record that led to significant economic losses. This generation of GOES satellites also gave forecasters vital information about Hurricane Juan in 1985 and Hurricane Hugo in 1989, both destructive storms for areas of the United States – see Figure 3.
Figure 3. GOES-7 infrared image of Hurricane Hugo on September 22, 1989.Figure credit: NOAAGOES-7, launched in 1987, added the new capability of detecting distress signals from emergency beacons. These GOES satellites have helped to rescue thousands of people as part of the Search and Rescue Satellite-Aided Tracking (SARSAT) system developed to detect and locate mariners, aviators, and other recreational users in distress. This system uses a satellite network to detect and locate distress signals from emergency beacons on aircraft and vessels and from handheld personal locator beacons (PLBs) quickly. The SARSAT transponder on GOES immediately detects distress signals from emergency beacons and relays them to ground stations. In turn, this signal is routed to a SARSAT mission control center and then sent to a rescue coordination center, which dispatches a search and rescue team to the location of the distress call.
Third Generation: GOES 8–12
In 1994, advances in two technologies enabled another significant leap forward in capabilities for GOES: improved three-axis stabilization of the spacecraft and separating the imager and sounder into two distinct instruments with separate optics (e.g., GOES Imager and GOES Sounder). Simultaneous imaging and sounding gave forecasters the ability to use multiple measurements of weather phenomena, resulting in more accurate forecasts. Another improvement was flexible scanning, where the satellites could temporarily suspend their routine scans of the hemisphere to concentrate on a small area to monitor quickly evolving events. This capability allowed meteorologists to study local weather trouble spots, improving short-term forecasts.
In 2001, forecasters used GOES-8 to track the slow-moving remnants of Tropical Storm Allison, stalled over the Gulf Coast. During the next four days, Allison dropped more than three feet of rain across portions of coastal Texas and Louisiana, causing severe flooding, particularly in the Houston area.
GOES-12, the final satellite in the third generation, launched in 2001. It included a new Solar X-ray Imager (SXI) as part of its payload. SXI was the first X-ray telescope that could take a full-disk image of the Sun, which enabled forecasters to detect solar storms and better monitor and predict space weather that could affect Earth. Some geomagnetic storms can damage satellites, disrupting communications and navigation systems, impacting power grids, and harming astronauts in space.
Fourth Generation: GOES 13–15
By the mid-2000s, the fourth generation of GOES, known as the GOES-N series, enhanced the mission with improvements to the Image Navigation and Registration subsystem, including star-trackers, to better determine the coordinates of intense storms. Improvements in batteries and power systems allowed this generation to provide continuous imaging. GOES-13 also added an Extreme Ultraviolet Sensor, which monitored ultraviolet emissions from the Sun as well as the solar impact on satellite orbit drag and radio communications.
In April 2011, GOES-13 monitored the record-breaking tornado outbreak that hit the Southeastern United States – see Visualization 2. From April 25–28, 362 tornadoes carved a path across a dozen states, leaving an estimated 321 people dead. In 2012, NOAA operated GOES-14, the on-orbit backup satellite, in a special rapid-scan test mode, providing one-minute imagery of Tropical Storm Isaac and Hurricane Sandy, both destructive storms.
Visualization 2. GOES-13 visible imagery showing clusters of severe thunderstorms on April 27, 2011, that spawned several tornadoes.Visualization credit: NOAAThe GOES-R Series: GOES-16–19
NASA launched the first satellite in the GOES-R Series for NOAA in 2016. The GOES-R Series brought new state-of-the-art instruments into orbit, including the Advanced Baseline Imager (ABI), a high-resolution imager with 16 channels, and the Geostationary Lightning Mapper, the first lightning mapper flown in geostationary orbit. The satellites also gained the ability to concurrently provide a full-disk image every ten minutes, a contiguous United States image every five minutes, and two smaller localized images every 60 seconds (or one domain every 30 seconds). For the first time, meteorologists could see the big picture while simultaneously zooming in on a specific weather event or environmental hazard.
The latest GOES satellite series brought revolutionary improvements, providing minute-by-minute information to forecasters, decision-makers, and first responders to give early warning that severe weather is forming, monitor and track the movement of storms, estimate hurricane intensity, detect turbulence, and even spot fires before they are reported on the ground.
The GOES-R Series satellites also carry a suite of sophisticated solar imaging and space weather monitoring instruments. The final satellite in the series, GOES-19, is also equipped with NOAA’s first compact coronagraph (CCOR-1). This instrument images the solar corona (the outer layer of the Sun’s atmosphere) to detect and characterize coronal mass ejections, which can disrupt Earth’s magnetosphere, leading to geomagnetic storms, auroras, and potential disruptions to technology, including electricity and satellite communications.
In 2017, Hurricane Maria knocked out Puerto Rico’s radar just before landfall. With this critical technology disabled and a major hurricane approaching, forecasters used 30-second data from GOES-16 to track the storm in real-time – see Visualization 3. The satellite’s rapid scanning rate allowed forecasters to analyze cloud patterns and understand the evolution of Maria’s position and movement as well as discern the features within the hurricane’s eye to estimate intensity.
To view this video please enable JavaScript, and consider upgrading to a web browser that supports HTML5 video
Visualization 3. GOES-16 GeoColor image of Hurricane Maria over Puerto Rico as it made landfall on September 20, 2017. Visualization credit: NOAA/CIRAThe most recent generation of satellites also significantly improved fire detection and monitoring. During California’s Camp Fire in 2018, GOES-16 played a crucial role in monitoring the fire’s progression and smoke plumes, assisting the efforts to contain the fire – see Visualization 4. The satellite provided an extremely detailed picture of fire conditions, quick detection of hot spots, and the ability to track the fire’s progression and spread in real-time. Forecasters used ABI data from GOES-16 to track the fire’s movement and intensity even before ground crews could fully see it due to thick smoke. Not only did the data help firefighters fight the fire more effectively, but it also helped keep firefighters safe during the disaster.
To view this video please enable JavaScript, and consider upgrading to a web browser that supports HTML5 video
Visualization 4. Fire hot spots and a large plume of smoke are seen in this GOES-16 fire temperature red-green-blue imagery with GeoColor enhancement of the Camp Fire in northern California on November 8, 2018.Visualization credit: NOAA/CIRAWhat’s Next? GeoXO
NOAA, NASA, and industry partners are now developing the future generation of geostationary satellites. The Geostationary Extended Observations (GeoXO) will provide continuity of observation from geostationary orbit as the GOES-R series nears the end of its operational lifetime. The first GeoXO launch is planned for launch in the early 2030s.
GeoXO will prioritize and advance forecasting and warning of severe weather. Similar to GOES, the information GeoXO gathers will also be used to detect and monitor environmental hazards (e.g., wildfires, smoke, dust, volcanic ash, drought, and flooding).
The more advanced observing capabilities will allow forecasters to provide earlier warning to decision makers, improve the skillfulness of short-term forecasting, and allow for greater lead times for warnings of severe weather and other hazards that threaten the security and well-being of everyone in the Western Hemisphere well into the 2050s.
Conclusion
For 50 years, GOES satellites have provided the only continuous coverage of the Western Hemisphere. Their data have been the backbone of short-term forecasts and warnings of severe weather and environmental hazards. GOES detect and monitor events as they unfold, providing forecasters with real-time information to track hazards as they happen. They are also part of a global ring of satellites that contribute data to numerical weather prediction models. GOES also monitors the Sun and provides critical data for forecasts and warnings of space weather hazards.
Each successive generation of GOES has brought advancements and new capabilities that have improved the skill of short-term weather forecasts and our ability to prepare for and respond to severe weather and natural disasters. The information the satellites supply is essential for public safety, protection of property, and efficient economic activity. Meteorologists, emergency managers, first responders, local officials, aviators, mariners, researchers, and the general public depend on GOES. Everyone in the Western Hemisphere benefits from GOES data each and every day.
Acknowledgment
The primary source for the information provided in the section on “GOES Heritage Missions” was Conway, Eric: Atmospheric Science at NASA: A History (2008), pp. 140–41.
Michelle Smith
NOAA Satellite and Information Service
michelle.smith@noaa.gov
Alan Ward
NASA’s Goddard Space Flight Center/Global Science & Technology Inc.
alan.b.ward@nasa.gov
Keeping Up with PACE: Summary of the 2025 PAC3 Meeting
12 min read
Keeping Up with PACE: Summary of the 2025 PAC3 MeetingIntroduction
Launched in Feb. 2024, NASA’s Plankton, Aerosol, Cloud, ocean Ecosystem (PACE) mission is a cornerstone of Earth system science designed to deepen our understanding of how these environmental and biological components come together to influence our climate, carbon cycle, and ecosystems. PACE has funded three supporting components: the PACE Postlaunch Airborne eXperiment (PACE–PAX), the third PACE Science and Applications Team (SAT3), and the PACE Validation Science Team (PVST). Each group serves distinct but interdependent roles in advancing the scientific objectives of the mission through product development and rigorous assessment of data quality.
Recognizing the interconnected focus areas among these groups, the organizers consolidated this year’s separate gatherings into one comprehensive event – the “PAC3” meeting. The combined meeting took place from Feb. 18–21, 2025 at NASA’s Goddard Institute for Space Studies (GISS) in New York City, just 10 days after the first anniversary of the PACE launch – see Photo 1 and Photo 2.
Photo 1. Plankton, Aerosol, Cloud, ocean Ecosystem (PACE) scientists celebrated the one-year anniversary of the satellite’s orbit (February 8, 2025) during the PAC3 meeting. A “birthday” celebration took place during the meeting, complete with cake. Shown here are [left to right]: Ivona Cetinić [NASA’s Goddard Space Flight Center (GSFC)/Morgan State University, Ocean Ecology Laboratory (OEL)—PACE Validation Science Team lead, PACE-PAX Deputy Mission Scientist], Erin Urquhart Jephson [NASA Headquarters (HQ)—Program Manager of the NASA Earth Action Water Resources Program, PACE Program Applications Lead], Cecile Rousseaux [GSFC, OEL—PACE Science and Applications Team Lead], Kirk Knobelspiesse [GSFC, OEL—PACE Polarimeter Lead, PACE-PAX Mission Scientist], Jeremy Werdell [GSFC, OEL—PACE Project Scientist], Laura Lorenzoni [NASA HQ—Ocean Biology and Biogeochemistry Program Scientist, PACE Program Scientist], Brian Cairns [NASA Goddard Institute for Space Studies (GISS)—PACE Deputy Project Scientist, PACE-PAX Deputy Mission Scientist], and Bryan Franz [GSFC, OEL—PACE Science Data Segment Lead].Photo credit: Judy Alfter [NASA Ames Research Center (ARC)/Bay Area Environmental Research Institute (BAER)] Photo 2. With over 100 in-person and virtual attendees, the PAC3 meeting brought together representatives from each of the three overlapping activities for discussions on the status and plans for Plankton, Aerosol, Cloud, ocean Ecosystem (PACE) and related activities. The recently renovated meeting space at the NASA Goddard Institute for Space Studies (GISS) in New York City provided an ideal venue for interdisciplinary discussions and knowledge-sharing.Photo credit: Sabrina Hosein [NASA GISS/Adnet Systems]The PACE Mission and Payload
PACE’s long-term objectives focus on understanding ocean and terrestrial ecosystem productivity, detecting harmful algal blooms, exploring relationships between aerosols and clouds, and integrating these insights into Earth system science to enhance both research and decision-making capacities. These goals are accomplished by the advanced suite of three complementary instruments.
The Ocean Color Instrument (OCI) is a hyperspectral radiometer that measures ocean ecosystems’ biological, biogeochemical, and physical dynamics by capturing light over hundreds of narrow wavelengths from the deep ultraviolet to the infrared. Additionally, the broad spectral range and spectral resolution of the measurements allow the research community to characterize aerosols, clouds, land surfaces, and trace gases.
The Hyper-Angular Rainbow Polarimeter #2 (HARP2) is a multiangle polarimeter with a wide swath, four visible–near infrared (VIS–NIR) spectral channels, and between 10 and 60 viewing angles (i.e., the hyperangular capability) in each spectral channel. HARP2 is designed for retrieval of cloud and aerosol properties.
The Spectropolarimeter for Planetary Exploration (SPEXone) is also a multiangle polarimeter with different and complementary properties to HARP2. SPEXone has a narrow swath and five viewing angles with a spectral sensitivity of 100 bands from the ultraviolet to the near infrared. It is optimized for the retrieval of aerosol properties.
More details about the PACE mission can be found at its website.
PACE Mission Updates
The PAC3 meeting included a review of the PACE mission’s status and recent developments. This overview included meeting status updates on OCI, SPEXone, and HARP2 from their respective instrument scientists: Gerhard Meister [NASA’s Goddard Space Flight Center (GSFC)], Otto Hasekamp [Space Research Organization, Netherlands (SRON)], and Vanderlei Martins [University of Maryland, Baltimore County (UMBC)]. This section of the meeting covered updates on the early mission data availability and accessibility, including a review of the PACE data website. These details are summarized on the PACE data availability website and the ‘help hub’.
OCI
Meister reported that OCI has exceeded radiometric performance requirements, delivering highly accurate hyperspectral data. He noted that, with the release of Version 3 (V3) data reprocessing, OCI calibration now uses only on-orbit solar diffuser measurements to improve temporal stability. Key improvements of V3 include enhanced corrections for atmospheric absorbing gas effects and updated bidirectional reflectance distribution function (BRDF) parameters. Meister said that analysis of temporal trends has revealed solar diffuser degradation in the ultraviolet range, with ongoing corrections being made. For example, he cited how the team is using the solar diffuser that is only exposed once a month to correct the observations of the solar diffuser that is exposed daily. He also discussed other anomalies, including striping around 10° scan angle, reduced accuracy in the 590–610 nm region and implementation of crosstalk correction to compensate for reduced accuracy of wavelength measurements in the ultraviolet (i.e., for wavelengths shorter than 340 nm).
SPEXone
Hasekamp reported that SPEXone is delivering quality radiometric and polarimetric data. The team has developed the Remote Sensing of Trace Gases and Aerosol Products (RemoTAP) algorithm, an advanced aerosol retrieval algorithm that determines the total atmospheric column of aerosols, aerosol size distribution information, energy absorbed by aerosols, and vertical extent of the aerosol layer. Hasekamp showed that observations demonstrate minimal bias in size distribution retrievals across low aerosol optical depth (AOD) environments and these observations have good agreement with observations from ground-based Sun photometers that are part of the Aerosol Robotic Network (AERONET). He added that future updates will address radiometric calibration discrepancies with OCI.
HARP2
Martins reported that HARP2 continues to perform well and is delivering polarization-sensitive observations of aerosols and clouds. He noted that plans include making continued geolocation and calibration refinements, as well as cross-calibration with OCI and SPEXone to harmonize all the PACE radiometric data products.
PACE Data Access and Website Resources
Several presentations outlined the tools and platforms available to make data from the PACE mission accessible to the broader scientific community.
Alicia Scott [GSFC/Science Applications International Corporation (SAIC)] described capabilities provided by the Ocean Biology Distributed Active Archive Center (OB.DAAC). The OB.DAAC stores and processes data from all PACE instruments using tools, such as Earthdata Search and earthaccess Python libraries that enable user-friendly data retrieval pipelines. Training resources and tutorials are available to streamline usage.
Carina Poulin [GSFC/Science Systems and Applications, Inc (SSAI)] provided an overview of the PACE Data Website, which serves as a central hub for accessing datasets, reprocessing information, and product tutorials. The V3 landing page provides details on calibration updates, validation results, and pathways for integrating PACE data into user workflows.
EarthCARE Mission Updates
Many of PACE’s science objectives dovetail with that of the Earth Clouds, Aerosols, and Radiation Explorer (EarthCARE), a joint venture by the European Space Agency (ESA) and Japan Aerospace Exploration Agency (JAXA). Hence, the PAC3 meeting included participation from the EarthCARE teams. The EarthCARE observatory has four advanced instruments: a high spectral resolution ATmospheric LIDar (ATLID), a doppler capable Cloud Profiling Radar (CPR), a Multi-Spectral Imager (MSI), and a Broad-Band Radiometer (BBR). The measurements from EarthCARE complement those of PACE and enable cross validation, enriching scientific knowledge of complex Earth system processes. The synergistic nature of these missions also means that validation activities for one are well suited to both. For example, the Plankton, Aerosol, Cloud, ocean Ecosystem Postlaunch Airborne eXperiment (PACE-PAX) field campaign (discussed later in this article) incorporated validation activities for EarthCARE, and EarthCARE funded campaigns have made observations during PACE overpasses.
Rob Koopman [ESA] outlined progress on EarthCARE, including preparation for validation activities as part of ESA and JAXA’s joint efforts. He reported that the mission’s ATLID lidar data products are in excellent alignment with airborne High Spectral Resolution Lidar (HSRL) datasets (flown during PACE-PAX). Koopman showed preliminary results from underflights with NASA aircraft that demonstrate high accuracy for cloud and aerosol retrieval, albeit with some calibration challenges that will require further refinement. He also said that several EarthCARE–PACE mutual validation campaigns are planned to ensure inter-mission consistency across critical science products.
PACE–PAX Sessions
The first component of the PAC3 meeting focused on PACE–PAX, a field campaign conducted in California and adjacent coastal regions during Sept. 2024 – see Figure 1. Kirk Knobelspiesse [GSFC, OEL—PACE Polarimeter Lead, PACE-PAX Mission Scientist], Ivona Cetinić [NASA’s Goddard Space Flight Center (GSFC)/Morgan State University, Ocean Ecology Laboratory (OEL)—PACE Validation Science Team lead, PACE-PAX Deputy Mission Scientist], and Brian Cairns [NASA Goddard Institute for Space Studies (GISS)—PACE Deputy Project Scientist, PACE-PAX Deputy Mission Scientist] led the campaign, which, in addition to personnel from most NASA Centers, had participation from academia (e.g., University of Maryland, Baltimore County), other government agencies (e.g., Naval Postgraduate School and National Oceanic and Atmospheric Administration), and international space agencies (e.g., Space Research Organization, Netherlands).
Figure 1. Montage of activities during the Plankton, Aerosol, Cloud, ocean Ecosystem Postlaunch Airborne eXperiment (PACE–PAX) field campaign, which successfully concluded on Sept. 30, 2024. The campaign made atmospheric, ocean, and land surface measurements to validate observations from the recently launched NASA PACE and European Space Agency (ESA) and Japan Aerospace Exploration Agency (JAXA) Earth Clouds, Aerosols, and Radiation Explorer (EarthCARE) missions. Clockwise from top left: Mike Ondrusek [NOAA R/V Shearwater Mission Scientist] waves to the Naval Postgraduate School (NPS) Twin Otter as it performs a low altitude sample. Photo of the Bridge fire from Kirt Stallings [NASA ARC Earth Resources-2 (ER-2) Pilot]. Carl Goodwin [NASA/Jet Propulsion Laboratory] performs calibration at Ivanpah Playa, CA, the primary reference site for space-based remote sensing observations located in the Mojave Desert. Scott Freeman and Harrison Smith [both GSFC] deploy instrumentation from the R/V Shearwater in the Santa Barbara Channel. Instrument integration on the NASA ER-2 in preparation for PACE-PAX. San Francisco observed by the NPS Twin Otter as it samples at low altitude over the San Francisco Bay. The R/V Shearwater seen from the NPS Twin Otter. Figure credit(s): Clockwise from top left: NASA; Kirt Stallings; Regina Eckert [NASA/Jet Propulsion Laboratory]; Luke Dutton [National Oceanic and Atmospheric Administration]; Martijn Smit [Space Research Organization, Netherlands]; Luke Ziemba [NASA’s Langley Research Center (LaRC)]; Luke Ziemba.Campaign Overview
The PACE–PAX mission supported the PACE Science Data Product Validation Plan. This included validation of new PACE and EarthCARE products, data collection during instrument overpasses, verification of radiometric and polarimetric measurements, and targeted investigation of region-specific phenomena (e.g., multilayer aerosols and phytoplankton blooms).
Operational Highlights
PACE–PAX used a diverse array of platforms to collect atmospheric and oceanic data, including aircraft [e.g., NASA Earth Resources-2 (ER-2) and the Naval Postgraduate School’s Center for Interdisciplinary Remotely Piloted Aircraft Studies (CIRPAS) Twin Otter], research vessels (NOAA’s R/V Shearwater and the 30-foot sailboat R/V Blissfully), and ground-based instruments such as Sun photometers and lidars. Key achievements include 13 ER-2 and 17 Twin Otter science flights, 15 RV Shearwater and 9 R/V Blissfully day cruises. These flights and ocean surveys supported 16 days of observations during a PACE overpass, six days of observations during an EarthCARE overpass, ground vicarious calibration at Ivanpah Playa, CA, numerous overflights of AERONET ground sites. Beyond validation, several unique events were observed that may be of interest for scientific purposes. Intense wildfires (e.g., the Bridge, Airport, and Line fires in 2024) were observed in Southern California in mid-September, while a red tide outbreak was observed later in the month along the Northern California coast – see Figure 2. Additionally, elements of the PVST coordinated their own validation efforts with the PACE–PAX campaign.
Figure 2. Red tide blooms in Northern California as seen from three remote sensing tools on the Plankton, Aerosol, Cloud, ocean Ecosystem Postlaunch Airborne eXperiment (PACE–PAX). [Left] An image taken from the NPS Twin Otter on Sept. 24, 2024. [Right] The PACE Ocean Color Instrument (OCI) image collected on Sept. 27, 2024 with modified red-tide index applied to OCI data. [Center Inset] An Imaging FlowCytobot (IFCB) image taken on Sept. 27, 2024 at the Santa Cruz, CA pier.Figure Credits: [Left] Eddie Winstead [NASA’s Langley Research Center (LaRC)]; [right] NASA; [inset] Clarissa Anderson [University of California, San Diego]Preliminary Findings
Highlights of the PACE-PAX sessions demonstrated:
- validation of EarthCARE and PACE aerosol and cloud products using the HSRL2 on NASA ER-2,
- validation of PACE cloud products using polarimeters operating on the NASA ER-2 and in situ sensors on the CIRPAS Twin Otter,
- numerous successful matchups of hyperspectral data from OCI on PACE with field measurements of chlorophyll-a captured during ship campaigns, and
- observations of diverse phenomena (e.g., marine stratocumulus clouds and transported wildfire aerosols over clouds), which supported the testing of new retrieval algorithms.
The early results show the critical role that validation activities, such as PACE–PAX, play in creating a bridge between orbital science and ground truth.
PACE Science and Application Team (SAT3) Session
SAT3, with a focus on both science and applications, offered a compelling second component of the PAC3 meeting. The Earth Observer has previously reported on PACE applications, most recently in the 2023 article, Preparing for Launch and Assessing User Readiness: The 2023 PACE Applications Workshop [Nov–Dec 2023, 35:6, 25–32]. The SAT3 team convened during PAC3 to explore how PACE data could enhance research in diverse scientific fields and support applied uses for societal benefit. Dedicated sessions provided updates on ongoing NASA-funded projects to retrieve new geophysical variables, improve data assimilation, and refine product development pipelines.
SAT3 teams presented early results including studies that use PACE’s OCI to make pigment-specific absorption measurements, study diatom biomass retrieval, and gather chlorophyll concentration estimation. These studies emphasized new tools for tracking individual phytoplankton groups, such as diatoms and cyanobacteria that are vital for ecosystem research and understanding phytoplankton dynamics. Participants also showcased efforts to develop predictive models for the detection of harmful algal blooms (HABs) and improvement of early warning systems to mitigate public health impacts and economic consequences in both coastal regions and the Great Lakes. Several presentations highlighted new aerosol absorption and scattering measurements that are using polarimetry (i.e., SPEXone and HARP2) and how these findings are being incorporated into models of aerosol–cloud radiative forcing. Presenters also described how machine learning tools can integrate PACE measurements into Earth system models, through innovations in data assimilation, with promising results for global climate monitoring.
The SAT3 discussions highlighted PACE’s potential to impact disciplines ranging from oceanography to climate science.
PACE Validation Science Team Sessions
Sessions dedicated to the PACE PVST emphasized the ongoing role of PVST initiatives in confirming the reliability, accuracy, and long-term stability of PACE data products. Topics of focus for the PVST group included algorithm development and validation, cross-mission synergies, field-based campaign integration, and cloud products.
Some of the presenters shared updates on validation pipelines for radiometric and polarimetric products, with an emphasis on comparing against well-characterized datasets from AERONET Sun photometers, HSRL, and the Pan-and-Tilt Hyperspectral Radiometer (PANTHR) developed by Vlaams Instituut voor de Zee (VLIZ), or the Flanders Marine Institute, Belgium – see Photo 3. This radiometer was installed on a 30-m (~98-ft) tower in the Chesapeake Bay in May 2024 and is part of WATERHYPERNET network, which seeks to provide time series of hyperspectral water reflectance data from oceanic, coastal, and inland waters for the validation of satellite data at all wavelengths in the range 400–900 nm.
Photo 3. Inia Soto Ramos [Goddard Space Flight Center/Morgan State University] leads a Plankton, Aerosol, Cloud, ocean Ecosystem (PACE) Validation Science Team (PVST) breakout group discussion.Photo credit: Judy Alfter [NASA Ames Research Center (ARC)/ Bay Area Environmental Research Institute (BAER)]Reports from PVST members highlighted how data from PACE–PAX campaigns and satellite overpasses are contributing to the validation of error budgets developed prelaunch and refined uncertainty characterization. Other presentations highlighted the development of validation strategies for PACE-derived cloud properties, including cloud optical thickness, top height, and droplet size distributions with significant contributions from EarthCARE observations. Ocean observation validation was represented as well, with presentations from many groups that are focusing on retrieval of not only oceanic optical properties but biological components. This data offers crucial validation for the advanced phytoplankton composition and general ocean productivity products from PACE.
The PVST’s work continues to provide the foundation for confidence in PACE data products. Their accuracy ensures broad usability of those products across global science applications.
Conclusion
The PAC3 meeting, held at NASA’s GISS, highlighted the collective efforts of the PACE mission’s diverse teams to address a broad range of Earth system science challenges. By combining the meetings for PACE–PAX, SAT3, and PVST, participants were able to strengthen collaborations, align ongoing efforts, and lay the groundwork for future research and validation activities.
Roundtable discussions and team updates also revealed the critical role of PACE in addressing long-standing Earth system science questions, such as understanding the influence of aerosols on cloud formation and characterizing the impacts of oceanic changes on global biogeochemical cycles at a global scale. The meeting concluded with participants compiling action items for further exploration. Topics identified for future efforts included strategies for ensuring long-term data calibration, improving data delivery pipelines, and refining algorithm development processes.
This meeting was one of the last significant events hosted at GISS before the facility’s closure at the end of May 2025. The findings and outcomes from PAC3 continue to inform and inspire PACE mission science, further enhancing its importance in advancing our understanding of the Earth system.
Kirk Knobelspiesse
NASA’s Goddard Space Flight Center
kirk.d.knobelspiesse@nasa.gov
Cecile S. Rousseaux
NASA’s Goddard Space Flight Center
cecile.s.rousseaux@nasa.gov
Ivona Cetinić
NASA’s Goddard Space Flight Center/Morgan State University
ivona.cetinic@nasa.gov
Andrew Sayer
NASA’s Goddard Space Flight Center
andrew.sayer@nasa.gov
Sentinel-6B Extends Global Ocean Height Record
7 min read
Sentinel-6B Extends Global Ocean Height RecordIntroduction
On November 16, 2025, the Sentinel-6B satellite launched from Vandenberg Space Force Base (VSFB) in California. The mission is a partnership between NASA, the National Oceanic and Atmospheric Administration (NOAA), and several European partners – the European Space Agency (ESA), the European Organisation for the Exploitation of Meteorological Satellites (EUMETSAT), the French Centre National d’Études Spatiales (CNES), and the European Commission. Its objective is to continue collecting data to extend the ocean height record, which was started in 1992 with the U.S./French TOPEX/Poseidon satellite mission. During the past three decades, NASA and its partners have operated a satellite in the same orbit, precisely tracking the height of the oceans across the globe, once every 10 days.
Sentinel-6B took to the skies almost five years to the day after its twin, Sentinel-6A, which launched November 20, 2020, also from VSFB, and was renamed Sentinel–6 Michael Freilich, honoring the former head of NASA’s Earth Science Division – see The Editor’s Corner [March–April 2020, 32:1, 1–2]. Together, the two missions comprise the international Sentinel-6/Jason – Continuity of Service (CS) mission, which will provide continuity with past missions from TOPEX/Poseidon through Jason-3. Sentinel-6B will continue to measure sea level to about one inch (2.5 cm), extend the record of atmospheric temperatures, and continue sea level observations through the end of the 2020s.
The article that follows briefly introduces Sentinel-6B’s payload (which is the same as Sentinel–6 Michael Freilich). It then describes the planned science applications of the mission, followed by a brief conclusion.
Sentinel-6B Payload
The Sentinel-6B satellite carries several instruments to support the mission’s science goals – see Figure 1. A Radar Altimeter bounces signals off the ocean surface to determine the distance to the ocean. An Advanced Microwave Radiometer (AMR) retrieves the amount of water vapor between the satellite and ocean, which affects the travel speed of radar pulses, providing a critical correction to the distance measured by the radar. Other onboard instruments are used to precisely determine the satellite’s position [e.g., Doppler Orbitography by Radiopositioning Integrated on Satellite (DORIS) and Laser Retroreflector Array]. The height of the ocean surface can be calculated by combining the satellite’s position with the distance to the ocean. In addition, S- and X-band antennas perform data downlinks, and a solar array supplies power.
Beyond these instruments, Sentinel-6B contains Global Navigation Satellite System Radio Occultation (GNSS-RO) instrument that will aid with weather prediction. Observations made between the spacecraft instrument and other GNSS satellites as they disappear over Earth’s limb, or horizon, will provide detailed information about variations in the layers of the atmosphere. This information will contribute to computer models that predict the weather and enhance forecasting capabilities.
Figure 1. Sentinel-6B contains an array of instruments to continue to measure ocean height and gather other integral information about the global ocean.Figure credit: NASA/JPLSentinel-6B Science
The subsections that follow give a short preview of Sentinel-6B’s science capabilities, which are identical to those of Sentinel-6 Michael Freilich and similar – albeit enhanced – to the capabilities of previous satellite altimetry missions.
Measuring Ocean Height
Ocean height is a critical measurement because it provides a host of information about the movement of surface currents, transfer of energy around the planet, and an early warning system for large-scale climate phenomena, like El Niño–Southern Oscillation (ENSO) – see further discussion of ENSO below. Satellites obtain this data using altimeters, which send a radar pulse to the ocean surface every second and measure the time it takes to return. Pairing these data with the satellite’s precise location provides a measure of the height of the ocean water with an accuracy of within a few centimeters.
But the simplicity of the measurement belies the volumes of information that can be gleaned from the height of the oceans. As water moves from one place to another, it tilts the surface of the ocean, and by measuring this tilt the sea level satellites allow scientists to calculate ocean currents – see Figure 2.
Figure 2. Surface current estimates calculated using the Ocean Surface Current Analyses Real-time (OSCAR) global surface current database – which is made based on input from satellites that measure ocean height. Sentinel-6B will be the latest satellite to provide real-time data that are accurate enough for OSCAR to compute these currents. This will allow forecasters to accurately predict ocean currents and marine weather conditions globally, every single day.Figure credit: Severine Fournie [JPL]Tracking the Expansion and Contraction of Water in the Ocean
Ocean height data also provide information about ocean water temperature. Since water expands as it warms, a warm patch of ocean measures several inches taller than a cold patch – see Figure 3. Ocean height measurements thus can be used to reveal how the ocean stores and redistributes heat and energy, which are key drivers of Earth’s climate.
By observing ocean heights, Sentinel-6B will help improve forecasters’ ability to predict storm intensity and scientists’ ability to track long-term trends in heat storage. Information on ocean height also outlines ocean currents, eddies, and tides, which helps scientists understand how heat, nutrients, carbon, and energy are transported around Earth. These observations are essential for understanding Earth’s energy balance, ocean circulation, and the role of the ocean in shaping weather and climate patterns.
Figure 3. Ocean height data obtained on September 8, 2025, from Sentinel-6 Michael Freilich for the Pacific Ocean, where blue shows lower than normal heights along the equator in the east associated with a mild to moderate La Niña event.Figure credit: NASAUsing Ocean Height Measurements to Track ENSO
The movement of heat within the ocean is linked to weather and climate conditions across the globe. For reasons not completely understood, the waters of the Pacific Ocean experience a periodic fluctuation between warm and cool in the eastern tropical Pacific; this cycle is called ENSO. During an El Niño event in the Pacific Ocean, unusually warm water (which is visible in the satellite data as higher than normal sea levels) builds up along the equator in the east. The pool of warm water shifts rainfall patterns across the United States and Canada. This change is telescoped around the globe, altering normal weather patterns. Conversely, La Niña events develop when cooler waters accumulate along the eastern Pacific (and hence, lower than normal sea levels). In this way, the satellite observations of sea level help scientists and forecasters better see how the ocean is changing and the type of weather conditions to expect in the coming months – see Figure 4.
Higher sea levels usually mean warmer waters, not just at the surface, but over a range of depths. This means that high sea levels can also herald rapidly intensifying storms. Meteorologists can use this information when tracking tropical storms that gain energy from warm patches of ocean water and intensify into hurricanes – often rapidly.
Figure 4. As Hurricane Milton passed over the warm waters of the Gulf of Mexico on its approach to Florida in October 2024, the storm experienced a period of rapid intensification. This image pair shows ocean heat estimates based on observations from Jason-CS on October 7, 2024 [top] and October 9, 2024 [bottom]. Red and yellow indicate warmer than normal temperatures, where blue and green represent cooler than normal temperatures. A satellite image of the hurricane is overlaid to indicate the storm’s position as it moved toward Florida’s west coast. Notice that the period of rapid intensification corresponds to the storm moving over the patch of anomalously warm water that can be seen in the center of the image [red].Figure credit: NOAAMonitoring Ocean Changes
Sentinel-6B can also monitor changes in sea level. Over 90% of the heat trapped by the Earth is stored in the oceans. That heat warms the water, which takes up more space and accounts for about one-third of the observed global rise in sea level. The remainder is driven by melting glaciers and ice sheets, which add water to the oceans as well. The result is a long-term rise in sea level by more than 10 cm (4 in) since the early 1990s, when TOPEX/Poseidon was launched.
A record of global mean sea level change for the past three decades reveals an annual oscillation that reflects the natural movement of water between the ocean and the land, much like the heartbeat of the planet – see Figure 5. The rate of rise is not steady. The change in sea level in the 1990s was less than half the rate of rise in the most recent decade.
Figure 5. Sentinel-6B will continue to monitor the rise of the oceans. This record is composed of data from several different satellite altimetry missions dating back to TOPEX/Poseidon in 1992.Figure credit: NASA’s Scientific Visualization StudioConclusion
This unbroken record of sea level change stands as a crowning achievement to the accuracy, stability, and consistency of a series of satellite missions across more than three decades. This approach remains one of the most successful international collaborations to study our ever-changing Earth from space, and the launch of Sentinel-6B will stretch the record to nearly 40 years. With a vibrant international community of several hundred scientists and expert users, the discoveries made, and the value created by these observations will no doubt extend through 2030 and beyond. Although Sentinel-6B is nearly identical to its predecessor, a broad community of scientists, forecasters, operational users, and policymakers anxiously await its observations and the discoveries and utility they will bring through the remainder of this decade.
Joshua Willis
NASA/Jet Propulsion Laboratory
joshua.k.willis@jpl.nasa.gov
Severine Fournier
NASA/Jet Propulsion Laboratory
severine.fournier@jpl.nasa.gov
NASA Kennedy Top 20 Stories of 2025
Teams at NASA’s Kennedy Space Center in Florida spent 2025 preparing the launch vehicle and its powerhouse SLS (Space Launch System) rocket to launch four astronauts around the Moon for Artemis II in early 2026. The center also celebrated milestones by conducting science experiments at the International Space Station to studying the Sun’s solar wind impacts on Earth to traveling to Mars in hopes of one day exploring the Red Planet in person.
JANUARY
NASA Kennedy Marks New Chapter for Florida Space Industry
Kennedy Space Center Director Janet Petro and charter members of the Florida University Space Research Consortium sign a memorandum of understanding in research and development to assist with missions and contribute to NASA’s Moon to Mars exploration approach.
From left: Jennifer Kunz, Associate Director, Technical, Kennedy Space Center; Kelvin Manning, Deputy Director, Kennedy Space Center; Dr. Kent Fuchs, Interim President, University of Florida; Janet Petro, Director, Kennedy Space Center; Jeanette Nuñez, Florida Lieutenant Governor; Dr. Alexander Cartwright, President, University of Central Florida; Dr. Barry Butler, President, Embry-Riddle Aeronautical University. NASA/Kim ShiffletFirefly Launches Blue Ghost Mission One
Firefly Aerospace launched Blue Ghost Mission One lunar lander with a suite of NASA scientific instruments on January 15, from Launch Complex 39A at NASA Kennedy. The lander and instruments landed March 2 on the Moon.
Creating a golden streak in the night sky, a SpaceX Falcon 9 rocket carrying Firefly Aerospace’s Blue Ghost Mission One lander soars upward after liftoff from Launch Complex 39A at NASA’s Kennedy Space Center in Florida on Wednesday, Jan. 15, 2025 as part of NASA’s CLPS (Commercial Lunar Payload Services) initiative. NASA/Cory S HustonFEBRUARY
Intuitive Machines Launches to the Moon
Intuitive Machines’ IM-2 Nova C lunar lander launched Feb. 26 from Launch Complex 39A, carrying NASA science and technology demonstrations to the Mons Mouton region of the Moon. IM-2 reached the surface of the Moon on March 6.
Creating a golden streak in the night sky, a SpaceX Falcon 9 rocket carrying Intuitive Machines’ Nova-C lunar lander (IM-2) soars upward after liftoff from Launch Complex 39A at NASA’s Kennedy Space Center in Florida at 7:16 p.m. EST Wednesday, Feb. 26, 2025, as part of NASA’s CLPS (Commercial Lunar Payload Services) initiative. NASA/Frank MichauxMARCH
NASA’s SpaceX Crew-10 Launch
NASA astronauts Anne McClain and Nicole Ayers, JAXA (Japan Aerospace Exploration Agency) Takuya Onishi, and Roscosmos cosmonaut Kirill Peskov launched March 14 from Launch Complex 39A to the International Space Station for a five-month science mission.
Members of NASA’s SpaceX Crew-10, from left, Roscosmos cosmonaut Kirill Peskov, mission specialist; NASA astronauts Nichole Ayers, pilot and Anne McClain, commander; and JAXA (Japan Aerospace Exploration Agency) astronaut Takuya Onishi, mission specialist. SpaceXNASA’s SPHEREx, PUNCH Missions Launch
A SpaceX Falcon 9 rocket launched on March 11, from Space Launch Complex 4 East at Vandenberg Space Force Base in California carrying NASA’s SPHEREx (Spectro-Photometer for the History of the Universe, Epoch of Reionization and Ices Explorer) and PUNCH (Polarimeter to Unify the Corona and Heliosphere) missions. NASA’s Launch Services Program, based at NASA Kennedy managed the launch service for SPHEREx.
NASA’s SPHEREx observatory is installed in the Titan Thermal Vacuum (TVAC) test Chamber at BAE Systems in Boulder, Colorado, in June 2024. As part of the test setup, the spacecraft and photon shield are covered in multilayer insulation and blankets and surrounded by ground support equipment. Jet Propulsion LaboratoryNASA’s SpaceX Crew-9 Returns
NASA astronauts Nick Hague, Suni Williams, and Butch Wilmore were greeted by dolphins and recovery teams after their SpaceX Dragon spacecraft splashed down on March 18, off the coast of Tallahassee, Florida following their long-duration mission at the International Space Station.
Support teams work around a SpaceX Dragon spacecraft shortly after it landed with NASA astronauts Nick Hague, Suni Williams, Butch Wilmore, and Roscosmos cosmonaut Aleksandr Gorbunov aboard in the water off the coast of Tallahassee, Florida, Tuesday, March 18, 2025. Hague, Gorbunov, Williams, and Wilmore are returning from a long-duration science expedition aboard the International Space Station. NASA/Keegan BarberNASA Causeway Bridge Opens
The Florida Department of Transportation opened the westbound portion of the NASA Causeway Bridge on March 19, completing construction in both directions spanning the Indian River Lagoon and connecting NASA Kennedy and Cape Canaveral Space Force Station to the mainland.
Cars drive over the newly completed westbound portion (right side of photo) of the NASA Causeway Bridge leading away from NASA’s Kennedy Space Center in Florida on Wednesday, March 19, 2025. The Florida Department of Transportation (FDOT) opened the span on Tuesday, March 18, 2025, alongside its twin on the eastbound side, which has accommodated traffic in both directions since FDOT opened it on June 9, 2023. NASA/Glenn BensonNASA Artemis Teams Complete URT-12
Teams from NASA and the Department of War train during a week-long Underway Recovery Test-12 in March off the coast of California for Artemis II test flight crewmembers and the Orion spacecraft. The series of tests demonstrate and evaluate the processes, procedures, and hardware used in recovery operations for crewed lunar missions.
Waves break inside USS Somerset as the Crew Module Test Article, a full scale mockup of the Orion spacecraft, is tethered during Underway Recovery Test-12 off the coast of California, Wednesday, March 26, 2025. During the test, NASA and Department of Defense teams are practicing to ensure recovery procedures are validated as NASA plans to send Artemis II astronauts around the Moon and splashdown in the Pacific Ocean. NASA/Joel KowskyAPRIL
NASA’s SpaceX 32nd Commercial Resupply Mission
A SpaceX Falcon 9 rocket and a Dragon spacecraft carrying nearly 6,700 pounds of scientific investigations, food, supplies, and equipment launched on April 21 from Launch Complex 39A to the International Space Station.
The SpaceX Falcon 9 rocket carrying the Dragon spacecraft lifts off from Launch Complex 39A at NASA’s Kennedy Space Center in Florida on Monday, April 21, on the company’s 32nd commercial resupply services mission for the agency to the International Space Station. SpaceXJULY
Artemis III Begins Processing
NASA’s Artemis III SLS engine section and boat-tail made the journey from the Space Systems Processing Facility at NASA Kennedy to the spaceport’s Vehicle Assembly Building in July to complete integration and check-out testing. Beginning with the Artemis III hardware, NASA moved certain operations to NASA Kennedy to streamline the manufacturing process and enable simultaneous production operations of two core stages.
Teams from NASA’s Kennedy Space Center in Florida integrate NASA’s Artemis III SLS (Space Launch System) core stage engine section with its boat-tail inside the spaceport’s Vehicle Assembly Building on Wednesday, July 30, 2025. The boat-tail is a fairing-like structure that protects the bottom end of the core stage, while the engine section is one the most complex and intricate parts of the rocket stage that will help power the Artemis missions to the Moon. NASA/Ronald BeardAUGUST
NASA’s SpaceX Crew-11 Launches
NASA astronauts Zena Cardman and Mike Fincke, JAXA (Japan Aerospace Exploration Agency) astronaut Kimiya Yui, and Roscosmos cosmonaut Oleg Platonov launched aboard a SpaceX Dragon spacecraft and its Falcon 9 rocket on Aug. 1 from Launch Complex 39A bound for a long-duration mission to the International Space Station.
NASA’s SpaceX Crew-11 mission is the eleventh crew rotation mission of the SpaceX Dragon spacecraft and Falcon 9 rocket to the International Space Station as part of the agency’s Commercial Crew Program.NASA/Joel KowskyNASA’s SpaceX Crew-10 Returns
NASA astronauts Anne McClain and Nicole Ayers, JAXA (Japan Aerospace Exploration Agency) astronaut Takuya Onishi, and Roscosmos cosmonaut Kirill Peskov became the first Commercial Crew to splash down in the Pacific Ocean off the coast of California on Aug. 9, completing their nearly five-month mission at the orbiting outpost as part of the agency’s Commercial Crew Program.
Roscosmos cosmonaut Kirill Peskov, left, NASA astronauts Nichole Ayers, Anne McClain, and JAXA (Japan Aerospace Exploration Agency) astronaut Takuya Onishi returned after 147 days in space as part of Expedition 73 aboard the International Space Station.NASA/Keegan BarberNASA’s SpaceX 33rd Commercial Resupply Mission
A SpaceX Falcon 9 launched the company’s Dragon spacecraft carrying more than 5,000 pounds of food, crew supplies, science investigations, spacewalk equipment, and more to the space station on Aug. 24 from Launch Complex 39A.
A SpaceX Dragon cargo spacecraft with its nosecone open and carrying over 5,000 pounds of science, supplies, and hardware for NASA’s SpaceX CRS-33 mission approaches the International Space Station for an automated docking to the Harmony module’s forward port. NASAOrion Tested, Stacked With Hardware
Teams transported NASA’s Orion spacecraft from Kennedy’s Multi-Payload Processing Facility to the Launch Abort System Facility in August where crews integrated the 44-foot-tall launch abort system. The Orion spacecraft will send NASA astronauts Reid Wiseman, Victor Glover, Christina Koch, and CSA (Canadian Space Agency) astronaut Jeremy Hansen around the Moon for the Artemis II mission in early 2026. The launch abort system is designed to carry the crew to safety in the event of an emergency atop the SLS.
The launch abort tower on NASA’s Artemis II Orion spacecraft is pictured inside the Launch Abort System Facility at the agency’s Kennedy Space Center in Florida on Wednesday, Aug. 27, 2025, after teams with NASA’s Exploration Ground Systems Program installed the tower on Wednesday, Aug. 20, 2025. Positioned at the top of Orion, the 44-foot-tall launch abort system is designed to carry the crew to safety in the event of an emergency during launch or ascent, with its three solid rocket motors working together to propel Orion – and astronauts inside – away from the rocket for a safe landing in the ocean, or detach from the spacecraft when it is no longer needed. The final step to complete integration will be the installation of the ogive fairings, which are four protective panels that will shield the crew module from the severe vibrations and sounds it will experience during launch. NASA/Cory HustonSEPTEMBER
NASA Launches IMAP Mission
NASA’s IMAP (Interstellar Mapping and Acceleration Probe) launched from Launch Complex 39A on Sept. 24, to help researchers better understand the boundary of the heliosphere, a huge bubble created by the Sun surrounding and protecting our solar system.
A SpaceX Falcon 9 rocket carrying NASA’s IMAP (Interstellar Mapping and Acceleration Probe), the agency’s Carruthers Geocorona Observatory, and National Oceanic and Atmospheric Administration’s (NOAA) Space Weather Follow On–Lagrange 1 (SWFO-L1) spacecraft lifts off from Launch Complex 39A at NASA’s Kennedy Space Center in Florida at 7:30 a.m. EDT Wednesday, Sept. 24, 2025. The missions will each focus on different effects of the solar wind — the continuous stream of particles emitted by the Sun — and space weather — the changing conditions in space driven by the Sun — from their origins at the Sun to their farthest reaches billions of miles away at the edge of our solar system.BAE Systems/Benjamin FryNASA’s Northrop Grumman Commercial Resupply Mission
A Northrop Grumman Cygnus XL spacecraft atop a SpaceX Falcon 9 rocket lifted off from Launch Complex 39A to the International Space Station delivering NASA science investigations, supplies, and equipment as part of the agency’s partnership to resupply the orbiting laboratory.
Northrop Grumman’s Cygnus XL cargo craft, carrying over 11,000 pounds of new science and supplies for the Expedition 73 crew, is pictured in the grips of the International Space Station’s Canadarm2 robotic arm following its capture. Both spacecraft were orbiting 257 miles above Tanzania. Cygnus XL is Northrop Grumman’s expanded version of its previous Cygnus cargo craft increasing its payload capacity and pressurized cargo volume.NASAOCTOBER
Orion Integrated With SLS Rocket
Teams stacked NASA’s Orion spacecraft with its launch abort system on the agency’s SLS rocket in High Bay 3 of the Vehicle Assembly Building at NASA Kennedy on Oct. 20 for the agency’s Artemis II mission. Teams will begin conducting a series of verification tests ahead of rolling out the integrated SLS rocket to Launch Complex 39B for the wet dress rehearsal.
NASA’s Artemis II Orion spacecraft with its launch abort system is stacked atop the agency’s SLS (Space Launch System) rocket in High Bay 3 of the Vehicle Assembly Building at NASA’s Kennedy Space Center in Florida on Monday, Oct. 20, 2025. NASA/Kim ShiflettNOVEMBER
NASA’s ESCAPADE Begins Journey to Mars
NASA’s ESCAPADE (Escape and Plasma Acceleration and Dynamics Explorers) twin spacecraft launched aboard Blue Origin’s New Glenn rocket on Nov. 13 from Launch Complex 36 at Cape Canaveral Space Force Station. Its twin orbiters will take simultaneous observations from different locations around Mars to reveal how the solar wind interacts with Mars’ magnetic environment and how this interaction drives the planet’s atmospheric escape.
Near Cape Canaveral Lighthouse, Blue Origin’s New Glenn rocket carrying NASA’s twin ESCAPADE (Escape and Plasma Acceleration and Dynamics Explorers) spacecraft launches at 3:55 p.m. EST, Thursday, Nov. 13, 2025, from Launch Complex 36 at Cape Canaveral Space Force Station in Florida. The ESCAPADE mission, built by Rocket Lab, will study how solar wind and plasma interact with Mars’ magnetosphere and how this interaction drives the planet’s atmospheric escape to prepare for future human missions on Mars.Blue OriginNASA, European Partners Launch Sea Satellite
A SpaceX Falcon 9 rocket carrying the U.S.-European Sentinel-6B satellite launched at Nov. 16 from Space Launch Complex 4 East at Vandenberg Space Force Base in California. Sentinel-6B will observe Earth’s ocean, measuring sea levels to improve weather forecasts and flood predictions, safeguard public safety, benefit commercial industry, and protect coastal infrastructure.
A SpaceX Falcon 9 rocket carrying the international Sentinel-6B spacecraft lifts off from Space Launch Complex 4 East at Vandenberg Space Force Base in California at 9:21 p.m. PST Sunday, Nov. 16, 2025. A collaboration between NASA, ESA (European Space Agency), EUMETSAT (European Organisation for the Exploitation of Meteorological Satellites), and the National Oceanic and Atmospheric Administration (NOAA), Sentinel-6B is designed to measure sea levels down to roughly an inch for about 90% of the world’s oceans.SpaceXDECEMBER
NASA astronauts Reid Wiseman, Victor Glover, Christina Koch, and CSA astronaut Jeremy Hansen participated in a dry dress rehearsal at NASA Kennedy on Dec. 20 to mimic launch day operations for the Artemis II launch. The crew donned their spacesuits, exited the Neil A. Operations and Checkout Building, and took the journey to the Vehicle Assembly Building, up the mobile launcher to the crew access arm, and entered the Orion spacecraft that will take them around the Moon and back to Earth.
From right to left, NASA astronauts Christina Koch, mission specialist; Reid Wiseman, commander; Victor Glover, pilot; and CSA (Canadian Space Agency) astronaut Jeremy Hansen, mission specialist are seen as they depart the Neil A. Armstrong Operations and Checkout Building to board their Orion spacecraft atop NASA’s Space Launch System rocket inside the Vehicle Assembly Building as part of the Artemis II countdown demonstration test, Saturday, Dec. 20, 2025, at NASA’s Kennedy Space Center in Florida. For this operation, the Artemis II crew and launch teams are simulating the launch day timeline including suit-up, walkout, and spacecraft ingress and egress. Through the Artemis campaign, NASA will send astronauts to explore the Moon for scientific discovery, economic benefits, and to build the foundation for the first crewed missions to Mars, for the benefit of all. NASA/Aubrey GemignaniA Dance of Galaxies
NASA’s James Webb Space Telescope captured two nearby dwarf galaxies interacting with each other in this image released on Dec. 2, 2025. Dwarf galaxies can give us insights into galaxies in the early universe, which were thought to have less mass than galaxies like the Milky Way, and also contain a lot of gas, relatively few stars, and typically have small amounts of elements heavier than helium. Observing dwarf galaxies merge can tell us how galaxies billions of years ago might have grown and evolved.
Read more about this cosmic pair.
Image credit: ESA/Webb, NASA & CSA, A. Adamo (Stockholm University), G. Bortolini, and the FEAST JWST team
NASA Armstrong Advances Flight Research and Innovation in 2025
12 min read
Preparations for Next Moonwalk Simulations Underway (and Underwater)In 2025, NASA’s Armstrong Flight Research Center in Edwards, California, advanced work across aeronautics, Earth science, exploration technologies, and emerging aviation systems, reinforcing its role as one of the agency’s primary test sites for aeronautics research. From early concept evaluations to full flight test campaigns, teams enhanced measurement tools, refined safety systems, and generated data that supported missions across NASA. Operating from the Mojave Desert, NASA Armstrong continued applying engineering design with real-world performance, carrying forward research that informs how aircraft operate today and how new systems may function in the future.
The year’s progress also reflects the people behind the work – engineers, technicians, pilots, operators, and mission support staff who navigate complex tests and ensure each mission advances safely and deliberately. Their efforts strengthened partnerships with industry, small businesses, and universities while expanding opportunities for students and early career professionals. Together they sustained NASA Armstrong’s long-standing identity as a center where innovation is proven in flight and where research helps chart the course for future aviation and exploration.
“We executed our mission work safely, including flight of the first piloted NASA X-plane in decades, while under challenging conditions,” said Brad Flick, center director of NASA Armstrong. “It tells me our people embrace the work we do and are willing to maintain high levels of professionalism while enduring personal stress and uncertainty. It’s a testimony to the dedication of our NASA and contractor workforce.”
Teams continued advancing key projects, supporting partners, and generating data that contributes to NASA’s broader mission.
Quiet supersonic flight and the Quesst mission NASA’s F-15D research aircraft conducts a calibration flight of a shock-sensing probe near NASA’s Armstrong Flight Research Center in Edwards, California. The shock-sensing probe is designed to measure the signature and strength of shock waves in flight. The probe was validated during dual F-15 flights and will be flown behind NASA’s X-59 to measure small pressure changes caused by shock waves in support of the agency’s Quesst mission.NASA/Jim RossNASA Armstrong continued its quiet supersonic research, completing a series of activities in support of NASA’s Quesst mission. On the X-59 quiet supersonic research aircraft, the team performed electromagnetic interference tests and ran engine checks to prepare the aircraft for taxi tests. The Schlieren, Airborne Measurements, and Range Operations for Quesst (SCHAMROQ) team completed aircraft integration and shock-sensing probe calibration flights, refining the tools needed to characterize shock waves from the X-59. These efforts supported the aircraft’s progression toward its first flight on Oct. 28, marking a historic milestone and the beginning of its transition to NASA Armstrong for continued testing.
The center’s Commercial Supersonic Technology (CST) team also conducted airborne validation flights using NASA F-15s, confirming measurement systems essential for Quesst’s next research phase. Together, this work forms the technical backbone for upcoming community response studies, where NASA will evaluate whether quieter supersonic thumps could support future commercial applications.
- The X-59 team completed electromagnetic interference testing on the aircraft, verifying system performance and confirming that all its systems could reliably operate together.
- NASA’s X-59 engine testing concluded with a maximum afterburner test that demonstrated the engine’s ability to generate the thrust required for supersonic flight.
- Engineers conducted engine speed-hold evaluations to assess how the X-59’s engine responds under sustained throttle conditions, generating data used to refine control settings for upcoming flight profiles.
- NASA Armstrong’s SCHAMROQ team calibrated a second shock-sensing probe to expand measurement capability for future quiet supersonic flight research.
- NASA Armstrong’s CST team validated the tools that will gather airborne data in support the second phase of the agency’s Quesst mission.
- NASA’s X-59 team advanced preparations on the aircraft through taxi tests, ensuring aircraft handling systems performed correctly ahead of its first flight.
- NASA Armstrong’s photo and video team documented X-59 taxi tests as the aircraft moved under its own power for the first time.
- The X-59 team evaluated braking, steering, and integrated systems performance after the completion of the aircraft’s low-speed taxi tests marking one of the final steps before flight.
- NASA Armstrong teams advanced the X-59 toward first flight by prioritizing safety at every step, completing checks, evaluations, and system verifications to ensure the aircraft was ready when the team was confident it could move forward.
- NASA and the Lockheed Martin contractor team completed the X-59’s historic first flight, delivering the aircraft to NASA Armstrong for the start of its next phase of research.
Across aeronautics programs, Armstrong supported work that strengthens NASA’s ability to study sustainable, efficient, and high-performance aircraft. Teams conducted aerodynamic measurements and improved test-article access for instrumentation, enabling more precise evaluations of advanced aircraft concepts. Engineers continued developing tools and techniques to study aircraft performance under high-speed and high-temperature conditions, supporting research in hypersonic flight.
- The Sustainable Flight Demonstrator research team measured airflow over key wing surfaces in a series of wind tunnel tests, generating data used to refine future sustainable aircraft designs.
- Technicians at NASA Armstrong installed a custom structural floor inside the X-66 demonstrator, improving access for instrumentation work and enabling more efficient modification and evaluation.
- Armstrong engineers advanced high-speed research by maturing an optical measurement system that tracks heat and structural strain during hypersonic flight, supporting future test missions.
NASA Armstrong supported multiple aspects of the nation’s growing air mobility ecosystem. Researchers conducted tests and evaluations to better understand aircraft performance, airflow, and passenger experience. Additional work included assessing drone-based inspection techniques, developing advanced communication networks, performing drop tests, and refining methods to evaluate emerging mobility aircraft.
These studies support NASA’s broader goal of integrating new electric, autonomous, and hybrid aircraft safely into the national airspace.
- A small business partnership demonstrated drone-based inspection techniques that could reduce maintenance time and improve safety for commercial aircraft operations.
- NASA Armstrong researchers tested air traffic surveillance technology against the demands of air taxis flying at low altitudes through densely populated cities, using the agency’s Pilatus PC-12 to support safer air traffic operations.
- Researchers at NASA Armstrong collected airflow data from Joby using a ground array of sensors to examine how its circular wind patterns might affect electric air taxi performance in future urban operations.
- NASA Armstrong’s Ride Quality Laboratory conducted air taxi passenger comfort studies in support of the agency’s Advanced Air Mobility mission to better understand how motion, vibration, and other factors affect ride comfort, informing the industry’s development of electric air taxis and drones.
Earth science campaigns at NASA Armstrong contributed to the agency’s ability to monitor environmental changes and improve satellite data accuracy. Researchers tested precision navigation systems that keep high-speed aircraft on path, supporting more accurate atmospheric and climate surveys. Airborne measurements and drone flights documented wildfire behavior, smoke transport, and post-fire impacts while gathering temperature, humidity, and airflow data during controlled burns. These efforts also supported early-stage technology demonstrations, evaluating new wildfire sensing tools under real flight conditions to advance fire response research. High-altitude aircraft contributed to missions that improved satellite calibration, refined atmospheric measurements, and supported snowpack and melt studies to enhance regional water-resource forecasting.
- Researchers at NASA Armstrong tested a new precision‑navigation system that can keep high‑speed research aircraft on exact flight paths, enabling more accurate Earth science data collection during airborne environmental and climate‑survey missions.
- NASA’s B200 King Air flew over wildfire‑affected regions equipped with the Compact Fire Infrared Radiance Spectral Tracker (c‑FIRST), collecting thermal‑infrared data to study wildfire behavior, smoke spread, and post‑fire ecological impacts in near real time.
- NASA Armstrong’s Alta X drone carried a 3D wind sensor and a radiosonde to measure temperature, pressure, humidity, and airflow during a prescribed burn in Geneva State Forest, gathering data to help improve wildland fire behavior models and support firefighting agencies.
- NASA’s ER‑2 aircraft carried the Airborne Lunar Spectral Irradiance (air-LUSI) instrument on night flights, measuring moonlight reflectance to generate calibration data – improving the accuracy of Earth‑observing satellite measurements.
- The center’s ER-2 also flew above cloud layers with specialized instrumentation to collect atmospheric and cloud measurements. These data help validate and refine Earth observing satellite retrievals, improving climate, weather, and aerosol observations.
- Airborne campaigns at NASA Armstrong measured snowpack and melt patterns in the western U.S., providing data to improve water-resource forecasting for local communities.
NASA Armstrong supported exploration technologies that will contribute to agency’s return to the Moon and future missions deeper into the solar system, including sending the first astronauts – American astronauts – to Mars. Teams advanced sensor systems and conducted high-altitude drop tests to capture critical performance data, supporting the need for precise entry, descent, and landing capabilities on future planetary missions.
Contributions from NASA Armstrong also strengthen the systems and technologies that help make Artemis – the agency’s top priority – safer, more reliable, and more scientifically productive, supporting a sustained human presence on the Moon and preparing for future human exploration of Mars.
- The EPIC team at NASA Armstrong conducted research flights to advance sensor technology for supersonic parachute deployments, evaluating performance during high-speed, high-altitude drops relevant to future planetary missions.
- Imagery from the EPIC test flights at NASA Armstrong highlights the parachute system’s high-altitude deployment sequence and demonstrated its potential for future Mars delivery concepts.
The center expanded outreach, education, and workforce development efforts throughout the year. Students visited NASA Armstrong for hands-on exposure to careers in aeronautics, while staff and volunteers supported a regional robotics competition that encouraged exploration of the field. Educators brought aeronautics concepts directly into classrooms across the region, and interns from around the country gained experience supporting real flight research projects.
NASA Armstrong also highlighted unique career pathways and recognized employees whose work showcases the human side of NASA missions. A youth aviation program launched with a regional museum provided additional opportunities for young learners to explore flight science, further strengthening the center’s community impact:
- Students from Palmdale High School Engineering Club visited NASA Armstrong, where staff engaged with them to explore facilities, discuss aerospace work, and promote STEM careers as part of the center’s community outreach.
- NASA Armstrong staff and volunteers mentored high school teams at the 2025 Aerospace Valley FIRST Robotics Competition, helping students build and test robots and providing hands-on experience with engineering to foster interest in STEM careers.
- In April, NASA Armstrong expanded outreach in 2025 by bringing aeronautics concepts to students through classroom workshops, presentations, and hands-on activities, giving young learners direct exposure to NASA research and inspiring possible future careers in science and engineering.
- Students from across the country participated in internships at NASA Armstrong, gaining hands-on experience in flight research and operations while contributing to real-world aerospace projects.
- In May, a NASA Armstrong videographer earned national recognition for work that highlights the people behind the center’s research missions, showing how scientists, engineers, and flight crews collaborate to advance aeronautics and space exploration.
- Daniel Eng, a systems engineer with NASA’s Air Mobility Pathfinders project, shared his career path from the garment industry to aerospace, illustrating how diverse experiences contribute to the center’s technical workforce and support its advanced flight research and engineering projects.
- In June, NASA Armstrong recognized one of its interns for hands-on work with the center’s aircraft. With more than a decade in the auto industry, they demonstrated how early career engineers can gain real-world experience and develop skills for careers in aerospace and flight research.
- NASA Armstrong partnered with a regional museum to create a youth aviation program that introduces students to flight science and operations, providing hands-on learning opportunities and inspiring interest in aerospace and STEM careers.
Facility improvements and new platforms strengthened NASA Armstrong’s research capabilities. A rooftop operation removed a historic telemetry pedestal to make way for updated infrastructure, while preserving an important artifact of the center’s flight test heritage. Engineers also completed a new subscale research aircraft, providing a flexible, cost-effective platform for evaluating aerodynamics, instrumentation, and flight control concepts in preparation for full-scale testing:
- The center improved workspace access and supported a re-roofing project during a helicopter crew operation that removed a 2,500-pound telemetry pedestal from a building rooftop, preserving a piece of the center’s flight history heritage.
- Engineers at NASA Armstrong built a new subscale experimental aircraft to replace the center’s aging MicroCub. The 14-foot wingspan, 60-pound aircraft provides a flexible, cost-effective platform for testing aerodynamics, instrumentation, and flight control concepts while reducing risk before full-scale or crewed flight tests.
NASA Armstrong will continue advancing flight research across aeronautics and Earth science, building on this year’s achievements. Upcoming efforts include additional X-59 flights, expanded quiet supersonic studies, new air mobility evaluations, high-altitude science campaigns, and maturing technologies that support hypersonic research and the Artemis program for future planetary missions.
“Next year will be a year of continuity, but also change,” Flick said. “The agency’s new Administrator, Jared Isaacman, will bring a renewed mission-first focus to the agency, and NASA Armstrong will push the boundaries of what’s possible. But the most important thing we can do is safely and successfully execute our portfolio of work within budget and schedule.”
For more than seven decades, NASA Armstrong has strengthened the nation’s understanding of flight. This year’s work builds on that legacy, helping shape the future of aviation and exploration through research proven in the air.
To explore more about NASA Armstrong’s missions, research, and discoveries, visit:
https://www.nasa.gov/armstrong
Share Details Last Updated Dec 22, 2025 EditorDede DiniusContactNicolas Cholulanicolas.h.cholula@nasa.govLocationArmstrong Flight Research Center Related Terms Explore More 6 min read NASA Announces 2025 International Space Apps Challenge Global Winners Article 5 days ago 5 min read NASA, Boeing Test How to Improve Performance of Longer, Narrower Aircraft Wings Article 5 days ago 3 min read NASA Works with Boeing, Other Collaborators Toward More Efficient Global Flights Article 2 weeks ago Keep Exploring Discover More Topics From NASAArmstrong Flight Research Center
Humans in Space
Climate Change
Solar System
Artemis II Crew Rehearse Launch Day Demonstration
The four astronauts set to fly around the Moon during NASA’s Artemis II test flight depart the Neil A. Armstrong Operations and Checkout Building at the agency’s Kennedy Space Center in Florida, during a dress rehearsal for launch day on Dec. 20, 2025. From left are CSA (Canadian Space Agency) astronaut Jeremy Hansen, NASA astronauts Victor Glover, Reid Wiseman, and Christina Koch.
The launch day rehearsal, called a countdown demonstration test, simulated the launch day timeline, including the crew suiting up in their spacesuits and climbing in and out of their Orion spacecraft. Because the SLS (Space Launch System) rocket upon which they will launch is not yet at the launch pad, the crew boarded Orion inside Kennedy’s Vehicle Assembly Building, where engineers are conducting final preparations on the spacecraft, rocket, and ground systems.
Through Artemis, NASA will send astronauts to explore the Moon for scientific discovery, economic benefits, and build the foundation for the first crewed missions to Mars.
Photo Credit: NASA/Jim Ross
Wind-Sculpted Landscapes: Investigating the Martian Megaripple ‘Hazyview’
- Perseverance Home
- Science
- News and Features
- Multimedia
- Mars Missions
- Mars Home
Written by Noah Martin, Ph.D. student and Candice Bedford, Research Scientist at Purdue University
While much of Perseverance’s work focuses on ancient rocks that record Mars’ long-lost rivers and lakes, megaripples offer a rare opportunity to examine processes that are still shaping the surface today. Megaripples are sand ripples up to 2 meters (about 6.5 feet) tall that are mainly built and modified by wind. However, when water in the atmosphere interacts with dust on the ripple surface, a salty, dusty crust can form. When this happens, it is much harder for the wind to move or shape the megaripple. As such, megaripples on Mars are largely considered inactive, standing as records of past wind regimes and atmospheric water interactions over time. However, some have shown signs of movement, and it is possible that periods of high wind speeds may erode or reactivate these deposits again.
Despite Mars’ thin atmosphere today (2% of the Earth’s atmospheric density), wind is one of the main drivers of change at the surface, eroding local bedrock into sand-sized grains and transporting these grains across the ripple field. As a result, megaripple studies help us understand how wind has shaped the surface in Mars’ most recent history and support planning for future human missions, as the chemistry and cohesion of Martian soils will influence everything from mobility to resource extraction.
Following the successful investigation of the dusty, inactive megaripples at “Kerrlaguna,” Perseverance recently explored a more expansive field of megaripples called “Honeyguide.” This region hosts some of the largest megaripples Perseverance has seen along its traverse so far, making it an ideal location for a comprehensive study of these features. The megaripples at “Honeyguide” rise higher, extend farther, and have sharply defined crests with more uniform orientation compared to those at “Kerrlaguna.” The consistent orientation of the megaripples at “Honeyguide” suggests that winds in this area have blown predominantly from the same direction (north-south) for a long period of time.
At “Honeyguide,” Perseverance studied the “Hazyview” megaripple, where over 50 observations were taken across the SuperCam, Mastcam-Z, MEDA, PIXL and WATSON instruments, looking for grain movement, signs of early morning frost, and changes in mineralogy from crest to trough. The investigation of the “Hazyview” bedform builds directly on the results from “Kerrlaguna” and represents the most detailed look yet at these intriguing wind-formed deposits. As Perseverance continues its journey on the crater rim, these observations will provide a valuable reference for interpreting other wind-blown features and for understanding how Mars continues to change, one grain of sand at a time.
-
Want to read more posts from the Perseverance team?
-
Want to learn more about Perseverance’s science instruments?
Explore this collection of Mars images, videos, resources, PDFs, and toolkits. Discover valuable content designed to inform, educate, and inspire,…
Rover BasicsEach robotic explorer sent to the Red Planet has its own unique capabilities driven by science. Many attributes of a…
Mars Exploration: Science GoalsThe key to understanding the past, present or future potential for life on Mars can be found in NASA’s four…
Mars Perseverance RoverThe Mars Perseverance rover is the first leg the Mars Sample Return Campaign’s interplanetary relay team. Its job is to…
NASA Shares SpaceX Crew-12 Assignments for Space Station Mission
As part of NASA’s SpaceX Crew-12 mission, four crew members from three space agencies will launch no earlier than Sunday, Feb. 15, 2026, to the International Space Station for a long-duration science expedition.
NASA astronauts Jessica Meir and Jack Hathaway will serve as spacecraft commander and pilot, respectively, and will be accompanied by ESA (European Space Agency) astronaut Sophie Adenot and Roscosmos cosmonaut Andrey Fedyaev, who will both serve as mission specialists. Crew-12 will join Expedition 74 crew members currently aboard the space station.
The flight is the 12th crew rotation with SpaceX to the orbiting laboratory as part of NASA’s Commercial Crew Program. Crew-12 will conduct scientific investigations and technology demonstrations to help prepare humans for future exploration missions to the Moon and Mars, as well as benefit people on Earth.
This will be the second flight to the space station for Meir, who was selected as a NASA astronaut in 2013. The Caribou, Maine, native earned a bachelor’s degree in biology from Brown University, a master’s degree in space studies from the International Space University, and a doctorate in marine biology from Scripps Institution of Oceanography in San Diego. On her first spaceflight, Meir spent 205 days as a flight engineer during Expedition 61/62, and she completed the first three all-woman spacewalks with fellow NASA astronaut Christina Koch, totaling 21 hours and 44 minutes outside of the station. Since then, she has served in various roles, including assistant to the chief astronaut for commercial crew (SpaceX), deputy for the Flight Integration Division, and assistant to the chief astronaut for the human landing system.
A commander in the United States Navy, Hathaway was selected as part of the 2021 astronaut candidate class. This will be Hathaway’s first spaceflight. The South Windsor, Connecticut, native holds a bachelor’s degree in physics and history from the U.S. Naval Academy and master’s degrees in flight dynamics from Cranfield University and national security and strategic studies from the U.S. Naval War College, respectively. Hathaway also is a graduate of the Empire Test Pilot’s School, Fixed Wing Class 70 in 2011. At the time of his selection, Hathaway was deployed aboard the USS Truman, serving as Strike Fighter Squadron 81’s prospective executive officer. He has accumulated more than 2,500 flight hours in 30 different aircraft, including more than 500 carrier arrested landings and 39 combat missions.
The Crew-12 mission will be Adenot’s first spaceflight. Before her selection as an ESA astronaut in 2022, Adenot earned a degree in engineering from ISAE-SUPAERO in Toulouse, France, specializing in spacecraft and aircraft flight dynamics. She also earned a master’s degree in human factors engineering at Massachusetts Institute of Technology in Cambridge. After earning her master’s degree, she became a helicopter cockpit design engineer at Airbus Helicopters and later served as a search and rescue pilot at Cazaux Air Base from 2008 to 2012. She then joined the High Authority Transport Squadron in Villacoublay, France, and served as a formation flight leader and mission captain from 2012 to 2017. Between 2019 and 2022, Adenot worked as a helicopter experimental test pilot in Cazaux Flight Test Center with DGA (Direction Générale de l’Armement – the French Defence Procurement Agency). She has logged more than 3,000 hours flying 22 different helicopters.
This will be Fedyaev’s second long-duration stay aboard the orbiting laboratory. He graduated from the Krasnodar Military Aviation Institute in 2004, specializing in aircraft operations and air traffic organization, and earned qualifications as a pilot engineer. Prior to his selection as a cosmonaut, he served as deputy commander of an Ilyushin-38 aircraft unit in the Kamchatka Region, logging more than 600 flight hours and achieving the rank of second-class military pilot. Fedyaev was selected for the Gagarin Research and Test Cosmonaut Training Center Cosmonaut Corps in 2012 and has served as a test cosmonaut since 2014. In 2023, he flew to the space station as a mission specialist during NASA’s SpaceX Crew-6 mission, spending 186 days in orbit, as an Expedition 69 flight engineer. For his achievements, Fedyaev was awarded the title Hero of the Russian Federation and received the Yuri Gagarin Medal.
For more than 25 years, people have lived and worked continuously aboard the International Space Station, advancing scientific knowledge and making research breakthroughs that are not possible on Earth. The station is a critical testbed for NASA to understand and overcome the challenges of long-duration spaceflight and to expand commercial opportunities in low Earth orbit. As commercial companies concentrate on providing human space transportation services and destinations as part of a robust low Earth orbit economy, NASA is focusing its resources on deep space missions to the Moon as part of the Artemis campaign in preparation for future human missions to Mars.
Learn more about International Space Station research and operations at:
-end-
Joshua Finch / Jimi Russell
Headquarters, Washington
202-358-1100
joshua.a.finch@nasa.gov / james.j.russell@nasa.gov
Shaneequa Vereen
Johnson Space Center, Houston
281-483-5111
shaneequa.y.vereen@nasa.gov
NASA Johnson’s 2025 Milestones
NASA’s Johnson Space Center in Houston closed 2025 with major progress across human spaceflight, research, and exploration. From Artemis II mission preparations to science aboard the International Space Station, teams at Johnson helped prepare for future missions to the Moon and, ultimately, Mars.
Orion Stacked for Artemis II, Orion Mission Evaluation Room Unveiled NASA’s Artemis II Orion spacecraft with its launch abort system is stacked atop the agency’s SLS (Space Launch System) rocket in High Bay 3 of the Vehicle Assembly Building at NASA’s Kennedy Space Center in Florida on Oct. 20, 2025.NASA/Kim ShiflettAs NASA prepares for the crewed Artemis II mission, a 10-day journey around the Moon and back in early 2026, teams at Johnson continue work to ensure the Orion spacecraft is flight-ready. The mission will carry NASA astronauts Reid Wiseman, Victor Glover, Christina Koch, and CSA (Canadian Space Agency) astronaut Jeremy Hansen.
In October, NASA completed stacking of the Orion spacecraft and launch abort system atop the agency’s SLS (Space Launch System) rocket inside the Vehicle Assembly Building at NASA’s Kennedy Space Center in Florida. Following Orion stacking, teams completed testing critical communications systems between SLS and Orion, and confirmed the interfaces function properly between the rocket, Orion, and the ground systems.
The new Orion Mission Evaluation Room inside the Mission Control Center at NASA’s Johnson Space Center in Houston.NASA/Bill StaffordTeams also unveiled the Orion Mission Evaluation Room inside NASA’s Mission Control Center in Houston. The new facility will support Artemis II by allowing engineers to monitor Orion spacecraft systems in real time and assess vehicle performance throughout the mission, strengthening flight operations beyond low Earth orbit.
These milestones were made possible by teams across Johnson, including the Orion Program, Flight Operations Directorate, Systems Engineering and Integration Office, Crew and Thermal Systems Division, and the Human Health and Performance Directorate, working closely with other NASA centers and industry partners.
These accomplishments mark steady progress toward Artemis II and reflect the work underway across NASA to advance the next era of human spaceflight.
Gateway Lunar Space Station The primary structure of Gateway’s Power and Propulsion Element (PPE) undergoing assembly, integration, and testing at Lanteris Space Systems in Palo Alto, California, on September 29, 2025.Lanteris Space SystemsTogether with international and industry partners, the Gateway Program continued progress toward building humanity’s first lunar space station. The powerhouse reached a major milestone this fall with its successful initial power on.
NASA Selects 2025 Astronaut Candidate Class NASA’s new astronaut candidates greet the crowd for the first time at Johnson Space Center.NASA/James BlairNASA’s 10 new astronaut candidates were introduced Sept. 22 following a competitive selection process of more than 8,000 applicants from across the United States. The class will complete nearly two years of training before becoming eligible for flight assignments supporting missions to low Earth orbit, the Moon, and Mars.
When they graduate, they will join NASA’s active astronaut corps, advancing research aboard the space station and supporting Artemis missions that will carry human exploration farther than ever before.
A Space Station Anniversary NASA and its partners have supported humans continuously living and working in space since November 2000.NASA/Jonny KimOn Nov. 2, 2025, NASA marked 25 years of continuous human presence aboard the space station. What began as a set of connected modules has grown into a cornerstone of international partnership, scientific discovery, and technology development in low Earth orbit.
For a quarter of century, the orbiting laboratory has supported research that advances human health, drives innovation, and prepares NASA for future crewed missions to the Moon and Mars.
A truly global endeavor, the space station has been visited by more than 290 people from 26 countries and a variety of international and commercial spacecraft. The unique microgravity laboratory has hosted more than 4,000 experiments from over 5,000 researchers from 110 countries. The orbital outpost also is facilitating the growth of a commercial market in low Earth orbit for research, technology development, and crew and cargo transportation.
After 25 years of habitation, the space station remains a symbol of international cooperation and a proving ground for humanity’s next giant leaps.
Record-Breaking Spacewalks NASA astronaut and Expedition 72 Commander Suni Williams is pictured during a six-hour spacewalk for science and maintenance on the International Space Station. At upper right, is the SpaceX Dragon crew spacecraft docked to the Harmony module’s space-facing port.NASANASA astronauts Nick Hague, Suni Williams, and Butch Wilmore began 2025 with two successful spacewalks, completing key maintenance and research tasks. Their work included removing an antenna assembly and collecting surface material samples for analysis at Johnson’s Astromaterials Research and Exploration Services, or ARES, division.
With her latest spacewalks, Williams now holds the record for the most cumulative spacewalking time by a woman–62 hours and 6 minutes–placing her fourth among the most experienced spacewalkers.
NASA astronauts Anne McClain and Nichole Ayers also conducted spacewalk operations, installing a mounting bracket to prepare for the future installation of an additional set of International Space Station Rollout Solar Arrays and relocating a space station communications antenna.
These achievements were made possible by countless Johnson teams across the International Space Station, Flight Operations Directorate, and Exploration Architecture, Integration, and Science Directorate.
Two Expeditions Take FlightNASA’s SpaceX Crew-10 arrived at the space station on March 15 and returned to Earth on on Aug. 9. Crew-10 included NASA astronauts Anne McClain and Nichole Ayers, JAXA (Japan Aerospace Exploration Agency) astronaut Takuya Onishi, and Roscosmos cosmonaut Kirill Peskov—all of whom are trained pilots. Crew-9 also splashed down off Florida’s coast on March 18.
NASA astronaut Jonny Kim launched aboard the Soyuz MS-27 spacecraft on April 8, marking his first mission to the space station. Expedition 73 officially began following the departure of NASA astronaut Don Pettit aboard Soyuz MS-26 on April 19. NASA astronaut Chris Williams then launched aboard the Soyuz MS-28 spacecraft on Nov. 27 with Kim returning to Earth shortly after on Dec. 9, marking the start of Expedition 74.
A Year of Lunar Firsts Firefly’s Blue Ghost lunar lander captured a bright image of the Moon’s South Pole (on the far left) through the cameras on its top deck, while it travels to the Moon as part of NASA’s CLPS (Commercial Lunar Payload Services) initiative and Artemis campaign.Firefly AerospaceFirefly Aerospace’s Blue Ghost Mission 1 launched delivering 10 NASA science and technology instruments to the Moon on March 2. The lander touched down near Mons Latreille in Mare Crisium, a basin on the near side of the Moon. Just days later on March 6, Intuitive Machines’ IM-2 mission landed closer to the lunar South Pole than any previous lander.
Part of NASA’s Commercial Lunar Payload Services (CLPS) and Artemis campaign, these lunar deliveries are helping scientists address challenges like lunar dust mitigation, resource utilization, and radiation tolerance.
These milestones were made possible by the collaborative efforts of Johnson teams across NASA’s CLPS initiative, as well as the Engineering; Exploration Architecture, Integration, and Science; and Flight Operations directorates—along with support from other NASA centers.
First Asteroid-Detecting Space Telescope Completes Testing The instrument enclosure of NASA’s Near-Earth Object Surveyor is prepared for critical environmental tests inside the historic Chamber A at the Space Environment Simulation Laboratory at NASA’s Johnson Space Center.NASANASA’s Near-Earth Object (NEO) Surveyor—its first space-based telescope designed specifically for planetary defense—has successfully completed thermal vacuum testing in Johnson’s Space Environment Simulation Laboratory in Chamber A.
Set to launch no earlier than late 2027, NEO Surveyor will seek out, measure, and characterize hard-to-detect asteroids and comets that could pose a hazard to Earth. The spacecraft is now at NASA’s Jet Propulsion Laboratory in Southern California for continued development.
Explore the capabilities and scientific work enabled by the thermal testing conducted in Johnson’s Chamber A.
These achievements were made possible by countless Johnson teams across the ARES Division and Engineering Directorate.
First Houston AutoBoative Show Johnson Space Center employees present the Artemis Exhibit at the 2025 Houston AutoBoative Show at NRG Center.NASA/Robert MarkowitzFor the first time, NASA rolled out its Artemis exhibit at the Houston AutoBoative Show at NRG Center from Jan. 29 to Feb. 2. Johnson employees introduced vehicle enthusiasts to the technologies NASA and its commercial partners will use to explore more of the lunar surface than ever before.
The Artemis exhibit stood alongside some of the world’s most advanced cars and boats, offering visitors an up-close look at the future of human space exploration.
Attendees explored Artemis II and Artemis III mission road maps, practiced a simulated Orion docking with Gateway in lunar orbit, and tested their skills driving a virtual lunar rover simulator.
NASA showcased lunar rover concepts, highlighting vehicles under development to help Artemis astronauts travel farther across the Moon’s surface.
All three Lunar Terrain Vehicle (LTV) contractors, Astrolab, Intuitive Machines, and Lunar Outpost, completed their Preliminary Design Review milestones in June 2025, marking the end of Phase 1 feasibility study task orders that began in May 2024. NASA is preparing to award Phase 2 of the Lunar Terrain Vehicle Services contract with a demonstration mission task order that will result in the development, delivery, and demonstration of an LTV on the Moon later this decade.
First Dual NBL Run for NASA’s Artemis III Lunar Spacesuit NASA astronauts Loral O’Hara (left) and Stan Love (right) pose during the first dual spacesuit run at NASA’s Neutral Buoyancy Laboratory in Houston on Sept. 24, 2025. The astronauts wore Axiom Space’s Artemis III lunar spacesuit, known as the Axiom Extravehicular Mobility Unit (AxEMU), during the final integrated underwater test, confirming the spacesuit and facility are ready to support Artemis training.NASANASA and Axiom Space teams held the first dual spacesuit run at NASA’s Neutral Buoyancy Laboratory with NASA astronauts Stan Love and Loral O’Hara. Both crewmembers wore Axiom Space’s lunar spacesuit, called the Axiom Extravehicular Mobility Unit (AxEMU), while performing simulated lunar surface operations underwater to test the spacesuit’s functionality and mobility. This was the final integration test in the pool, proving both the spacesuit and facility are ready to support NASA Artemis training. To date, the Axiom team has conducted over 700 hours of manned, pressurized testing of the Artemis III lunar spacesuit. Axiom Space is scheduled to complete the critical design review in 2026.
These efforts were made possible by teams across Johnson’s Joint Extravehicular Activity and Human Surface Mobility Test Team.
Watch how astronauts, engineers, and scientists are preparing for the next giant leap on the lunar surface.
OSIRIS-REx Team Honored for Asteroid Sample Return NASA’s OSIRIS-REx team poses inside a cleanroom at Johnson Space Center after successfully freeing fasteners on the TAGSAM (Touch-and-Go Sample Acquisition Mechanism) head, allowing access to samples collected from asteroid Bennu. NASA/Robert MarkowitzNASA’s OSIRIS-REx curation team earned an Agency Group Achievement Award for their dedication to acquiring, preserving, and distributing asteroid samples from Bennu—the agency’s first asteroid sample return mission.
“The curation team ensured we were ready to receive and safeguard the samples, prepare and allocate them, and make them available to the broader scientific community,” said Jemma Davidson, Astromaterials curator and branch chief of the Astromaterials Acquisition and Curation Office.
After years of preparation, the team overcame unforeseen technical challenges to recover and preserve more than 120 grams of asteroid material—now accessible to scientists worldwide for research into the origins of our solar system.
These achievements were made possible by Johnson teams across the ARES Division and the Exploration Architecture, Integration, and Science Directorate.
Axiom Mission 4 Marks International Firsts in Space Station Mission The official crew portrait of the Axiom Mission-4 private astronaut mission to the International Space Station. From left are, Pilot Shubhanshu Shukla from India, Commander Peggy Whitson from the U.S., and Mission Specialists Sławosz Uzanański-Wiśniewksi from Poland and Tibor Kapu from Hungary.Axiom SpaceThe Axiom Mission 4 crew successfully returned to Earth after an 18-day mission aboard the space station, conducting more than 60 experiments and educational outreach activities. Launched aboard a SpaceX Dragon spacecraft on June 25, the crew docked with the orbiting laboratory the following day to begin a packed schedule of science and outreach.
The mission marked the first space station flight for India, Poland, and Hungary. Led by former NASA astronaut and Axiom Space director of human spaceflight Peggy Whitson, the crew included ISRO (Indian Space Research Organization) astronaut Shubhanshu Shukla, ESA (European Space Agency) project astronaut Sławosz Uznański-Wiśniewski of Poland, and Hungarian to Orbit (HUNOR) astronaut Tibor Kapu.
These achievements were made possible by Johnson’s dedicated teams across the International Space Station Program, Commercial Low Earth Orbit Development Program, and Flight Operations Directorate.
Johnson-Built Mars Hardware on Display at the Smithsonian At left is NASA’s Perseverance Mars rover, with a circle indicating the location of the calibration target for the rover’s SHERLOC instrument. At right is a close-up of the calibration target. Along the bottom row are five swatches of spacesuit materials that scientists are studying as they de-grade.NASA/Malin Space Science Systems Scanning Habitable Environments with Raman & Luminescence for Organics & Chemicals (SHERLOC) calibration target built at NASA’s Johnson Space Center is on display in the Smithsonian National Air and Space Museum’s Futures in Space gallery in Washington, D.C. NASA/Smithsonian National Air and Space MuseumA piece of NASA Johnson Space Center’s Mars legacy has landed at the Smithsonian National Air and Space Museum in Washington, D.C.
Nearly 10 years in the making, the Scanning Habitable Environments with Raman & Luminescence for Organics & Chemicals (SHERLOC) calibration target—built by Johnson’s ARES Division with partners at NASA’s Jet Propulsion Laboratory and Amentum—now has a permanent place in the museum’s Futures in Space gallery.
The palm-sized device is displayed beside an R2-D2 replica, connecting the wonder of space travel with the inspiration of seeing real flight hardware up close.
The calibration target, still in use aboard NASA’s Perseverance rover after more than four years of operations in Jezero Crater, Mars, helps keep SHERLOC’s laser, cameras, and spectrometers precisely tuned as it searches for ancient signs of life on Mars. Mounted on the rover’s front, the target carries 10 known samples so engineers can check SHERLOC’s performance during routine operations.
Trevor Graff, an ARES scientist who conceived the idea and led the team that designed and built SHERLOC’s calibration device, said the project highlights the unique role of geology in space exploration. “What excites me most is the practical application of geology—where science enables exploration and exploration enables science,” he said.
SHERLOC itself sits on the rover’s seven-foot robotic arm and combines a laser, camera, and chemical analyzers to look for signs that water once altered the Martian surface, potentially revealing evidence of past microscopic life. Several calibration targets are made from spacesuit material samples, allowing Johnson scientists to study how fabrics endure the harsh Martian environment to protect future explorers.
Explore More 4 min read NASA’s Wideband Technology Demo Proves Space Missions are Free to RoamJust like your cellphone stays connected by roaming between networks, NASA’s Polylingual Experimental Terminal, or…
Article 3 days ago 2 min read NASA’s Two-in-One Satellite Propulsion Demo Begins In-Space Test Article 5 days ago 6 min read NASA’s Push Toward Commercial Space Communications Gains Momentum Article 5 days agoNASA’s Wideband Technology Demo Proves Space Missions are Free to Roam
Just like your cellphone stays connected by roaming between networks, NASA’s Polylingual Experimental Terminal, or PExT, technology demonstration is proving space missions can do the same by switching seamlessly between government and commercial communications networks.
NASA missions rely on critical data to navigate, monitor spacecraft health, and transmit scientific information back to Earth, and this game-changing technology could provide multiple benefits to government and commercial missions by enabling more reliable communications with fewer data interruptions.
“This mission has reshaped what’s possible for NASA and the U.S. satellite communications industry,” said Kevin Coggins, deputy associate administrator for the agency’s SCaN (Space Communications and Navigation) Program at NASA Headquarters in Washington. “PExT demonstrated that interoperability between government and commercial networks is possible near-Earth, and we’re not stopping there. The success of our commercial space partnerships is clear, and we’ll continue to carry that momentum forward as we expand these capabilities to the Moon and Mars.”
This mission has reshaped what’s possible for NASA and the U.S. satellite communications industry.Kevin Coggins
Deputy Associate Administrator for SCaN
Wideband technology enables data exchange across a broad range of frequencies, helping bridge government and commercial networks as NASA advances commercialization of space communications. By providing interoperability between government and commercial assets, this technology unlocks new advantages not currently available to agency missions.
As commercial providers continue to advance their technology and add new capabilities to their networks, missions equipped with wideband terminals can integrate these enhancements even after launch and during active operations. The technology also supports NASA’s network integrity by allowing missions to seamlessly switch back and forth between providers if one network faces critical disruptions that would otherwise interfere with timely communications.
An artist’s concept of the BARD mission in space. NASA/Dave Ryan“Today, we take seamless cellphone roaming for granted, but in the early days of mobile phones, our devices only worked on one network,” said Greg Heckler, SCaN’s capability development lead at NASA Headquarters. “Our spaceflight missions faced similar limitations—until now. These revolutionary tests prove wideband terminals can connect spacecraft to multiple networks, a huge benefit for early adopter missions transitioning to commercial services in the 2030s.”
On July 23, the communications demo launched into low Earth orbit aboard the York Space Systems’ BARD mission. Designed by Johns Hopkins Applied Physics Laboratory, the compact wideband terminal communicates over a broad range of the Ka-band frequency, which is commonly used by NASA missions and commercial providers. After completing a series of tests that proved the BARD spacecraft and the demonstration payload were functioning as expected, testing kicked off with NASA’s TDRS (Tracking and Data Relay Satellite) fleet and commercial satellite networks operated by SES Space & Defense and Viasat.
During each demonstration, the terminal completed critical space communications and navigation operations, ranging from real-time spacecraft tracking and mission commands to high-rate data delivery. By showcasing end-to-end services between the BARD spacecraft, multiple commercial satellites, and mission control on Earth, the wideband terminal showed future NASA missions could become interoperable with government and commercial infrastructure.
An artist’s concept of the Polylingual Experimental Terminal transmitting data in space.NASA/Morgan JohnsonDue to the flexibility of wideband technology and the innovative nature of this mission, NASA recently extended the Polylingual Experiment Terminal demonstration for an additional 12 months of testing. Extended mission operations will include new direct-to-Earth tests with the Swedish Space Corporation, scheduled to begin in early 2026.
This technology demonstration will continue testing spaceflight communications capabilities through April 2027. By 2031, NASA plans to purchase satellite relay services for science missions in low Earth orbit from one or more U.S. companies.
To learn more about this wideband technology demonstration visit:
The Polylingual Experimental Terminal technology demonstration is funded and managed by NASA’s SCaN Program within the Space Operations Mission Directorate at NASA Headquarters in Washington. York Space Systems provided the host spacecraft. Johns Hopkins Applied Physics Laboratory developed the demonstration payload. Commercial satellite relay demonstrations were conducted in partnership with SES Space & Defense and Viasat.
An artist’s concept of the BARD mission in space. NASA/Dave Ryan Share Details Last Updated Dec 19, 2025 Related Terms Keep Exploring Discover More Topics From NASACommunicating with Missions
PExT
Wideband Technology
Commercializing Space Communications
Water Droplet Science
NASA astronaut Don Pettit demonstrates electrostatic forces using charged water droplets and a knitting needle made of Teflon. This series of overlapping frames from Feb. 19, 2025, displays the unique attraction-repulsion properties of Teflon and charged droplets, similar to how charged particles from the Sun behave when they come in contact with Earth’s magnetic field. Highly energetic particles from space that collide with atoms and molecules in the atmosphere create the aurora borealis.
Explore more of what Pettit has coined “science of opportunity.”
Image credit: NASA/Don Pettit
Metrics
Click here to view the FY25 Services Catalog
The catalogs provide service description, chargeback rate, unit of measure, and service level indicators for each NSSC service.
Service Level Agreement (SLA)Click here to view the Service Level Agreement
The SLA provides information about roles, responsibilities, rates, and service level indicators for all NASA Centers. The SLA is negotiated on an annual basis in line with the fiscal year. A single SLA is shared by all NASA Centers and signed by the Associate Administrator, Chief Financial Officer, Chief Information Officer, and the Office of Inspector General. The SLA provides for the delivery of specific services from the NSSC to NASA Centers and Headquarters Operations in the areas of:
- Financial Management
- Procurement
- Human Resources
- Information Technology
- Agency Business Services
*** On-Line Course Management and Training Purchases have been realigned to the OLC &Training Purchases section of the bill in accordance with the realignment of training funds. Center Special Projects have been consolidated into one Special Projects bill with the funding Center identified for each project.***
FY 2026 – Utilization Reports
October 2025
November 2025
FY 2025 – Utilization Reports
September 2025
August 2025
July 2025
June 2025
May 2025
April 2025
March 2025
February 2025
January 2025
December 2024
November 2024
October 2024
FY 2024 – Utilization Reports
September 2024
August 2024
July 2024
June 2024
May 2024
April 2024
March 2024
February 2024
January 2024
December 2023
November 2023
October 2023
Hubble Glimpses Galactic Gas Making a Getaway
- Hubble Home
- Overview
- Impact & Benefits
- Science
- Observatory
- Team
- Multimedia
- News
- More
2 min read
Hubble Glimpses Galactic Gas Making a Getaway This NASA/ESA Hubble Space Telescope image features the galaxy NGC 4388, a member of the Virgo galaxy cluster. ESA/Hubble & NASA, S. Veilleux, J. Wang, J. GreeneA sideways spiral galaxy shines in this NASA/ESA Hubble Space Telescope image. Located about 60 million light-years away in the constellation Virgo (the Maiden), NGC 4388 is a resident of the Virgo galaxy cluster. This enormous cluster of galaxies contains more than a thousand members and is the nearest large galaxy cluster to the Milky Way.
NGC 4388 appears to tilt at an extreme angle relative to our point of view, giving us a nearly edge-on prospect of the galaxy. This perspective reveals a curious feature that wasn’t visible in a previous Hubble image of this galaxy released in 2016: a plume of gas from the galaxy’s nucleus, here seen billowing out from the galaxy’s disk toward the lower-right corner of the image. But where did this outflow come from, and why does it glow?
The answer likely lies in the vast stretches of space that separate the galaxies of the Virgo cluster. Though the space between galaxies appears empty, this space is occupied by hot wisps of gas called the intracluster medium. As NGC 4388 moves within the Virgo cluster, it plunges through the intracluster medium. Pressure from hot intracluster gas whisks away gas from within NGC 4388’s disk, causing it to trail behind as NGC 4388 moves.
The source of the ionizing energy that causes this gas cloud to glow is more uncertain. Researchers suspect that some of the energy comes from the center of the galaxy, where a supermassive black hole spins gas around it into a superheated disk. The blazing radiation from this disk might ionize the gas closest to the galaxy, while shock waves might be responsible for ionizing filaments of gas farther out.
This image incorporates new data, including several additional wavelengths of light, that bring the ionized gas cloud into view. The image holds data from several observing programs that aim to illuminate galaxies with active black holes at their centers.
Facebook logo @NASAHubble @NASAHubble Instagram logo @NASAHubbleMedia Contact:
Claire Andreoli (claire.andreoli@nasa.gov)
NASA’s Goddard Space Flight Center, Greenbelt, MD
Since its 1990 launch, the Hubble Space Telescope has changed our fundamental understanding of the universe.
Explore the Night Sky
Hubble & Citizen Science
Hubble Science Operations
Betelgeuse and the Crab Nebula: Stellar Death and Rebirth
NASA, ESA, G. Dubner (IAFE, CONICET-University of Buenos Aires) et al.; A. Loll et al.; T. Temim et al.; F. Seward et al.; VLA/NRAO/AUI/NSF; Chandra/CXC; Spitzer/JPL-Caltech; XMM-Newton/ESA; and Hubble/STScI
What happens when a star dies? In 2019, Betelgeuse dimmed in brightness, sparking speculation that it may soon explode as a supernova. While it likely won’t explode quite yet, we can preview its fate by observing the nearby Crab Nebula.
A view of the constellations Orion and Taurus, along with notable features: Betelgeuse in Orion, and Aldebaran and the Crab Nebula in Taurus. Stellarium WebBetelgeuse is easy to find as the red-hued shoulder star of Orion. A variable star, Betelgeuse, usually competes with the brilliant blue-white Rigel for the position of the brightest star in Orion. Betelgeuse is a young star, estimated to be a few million years old, but due to its giant size, it leads a fast and furious life. This massive star, known as a supergiant, exhausted the hydrogen fuel in its core and began to fuse helium instead, which caused the outer layers of the star to cool and swell dramatically in size. Betelgeuse is one of the few stars for which we have any detailed surface observations, due to its vast size – somewhere between the diameters of the orbits of Mars and Jupiter – and its relatively close distance of about 642 light-years. Betelgeuse is also a “runaway star,” with its remarkable speed possibly triggered by a merger with a smaller companion star. If that is the case, Betelgeuse may actually have millions of years left! So, Betelgeuse may not explode soon after all, or it might explode tomorrow! We have much more to learn about this intriguing star.
This image of the Crab Nebula combines data from five different telescopes: The Very Large Array (radio) in red; Spitzer Space Telescope (infrared) in yellow; Hubble Space Telescope (visible) in green; XMM-Newton (ultraviolet) in blue; and Chandra X-ray Observatory (X-ray) in purple. It is known as the expanding gaseous remnant from a star that self-detonated as a supernova, briefly shining as brightly as 400 million suns. NASA, ESA, G. Dubner (IAFE, CONICET-University of Buenos Aires) et al.; A. Loll et al.; T. Temim et al.; F. Seward et al.; VLA/NRAO/AUI/NSF; Chandra/CXC; Spitzer/JPL-Caltech; XMM-Newton/ESA; and Hubble/STScIThe Crab Nebula (M1) is relatively close to Betelgeuse in the sky, in the nearby constellation of Taurus. Its ghostly, spidery gas clouds result from a massive explosion; a supernova observed by astronomers in 1054! A backyard telescope allows you to see some details. Still, only advanced telescopes reveal the rapidly spinning neutron star found in its center: the last stellar remnant from that cataclysmic event. These gas clouds were created during the giant star’s violent demise and expand ever outward to enrich the universe with heavy elements like silicon, iron, and nickel. These element-rich clouds are like a cosmic fertilizer, making rocky planets like our own Earth possible. Supernovae also send out powerful shock waves that help trigger star formation. In fact, if it weren’t for a long-ago supernova, our solar system – along with all of us – wouldn’t exist! You can learn much more about the Crab Nebula in a video from NASA’s James Webb Space Telescope: bit.ly/CrabNebulaVisual
Want to know more about the life cycle of stars? Explore stellar evolution with “The Lives of Stars” activity and handout at bit.ly/starlifeanddeath, part of our SUPERNOVA! toolkit.
Originally posted by Dave Prosper: February 2020
Last Updated by Kat Troche: December 2025
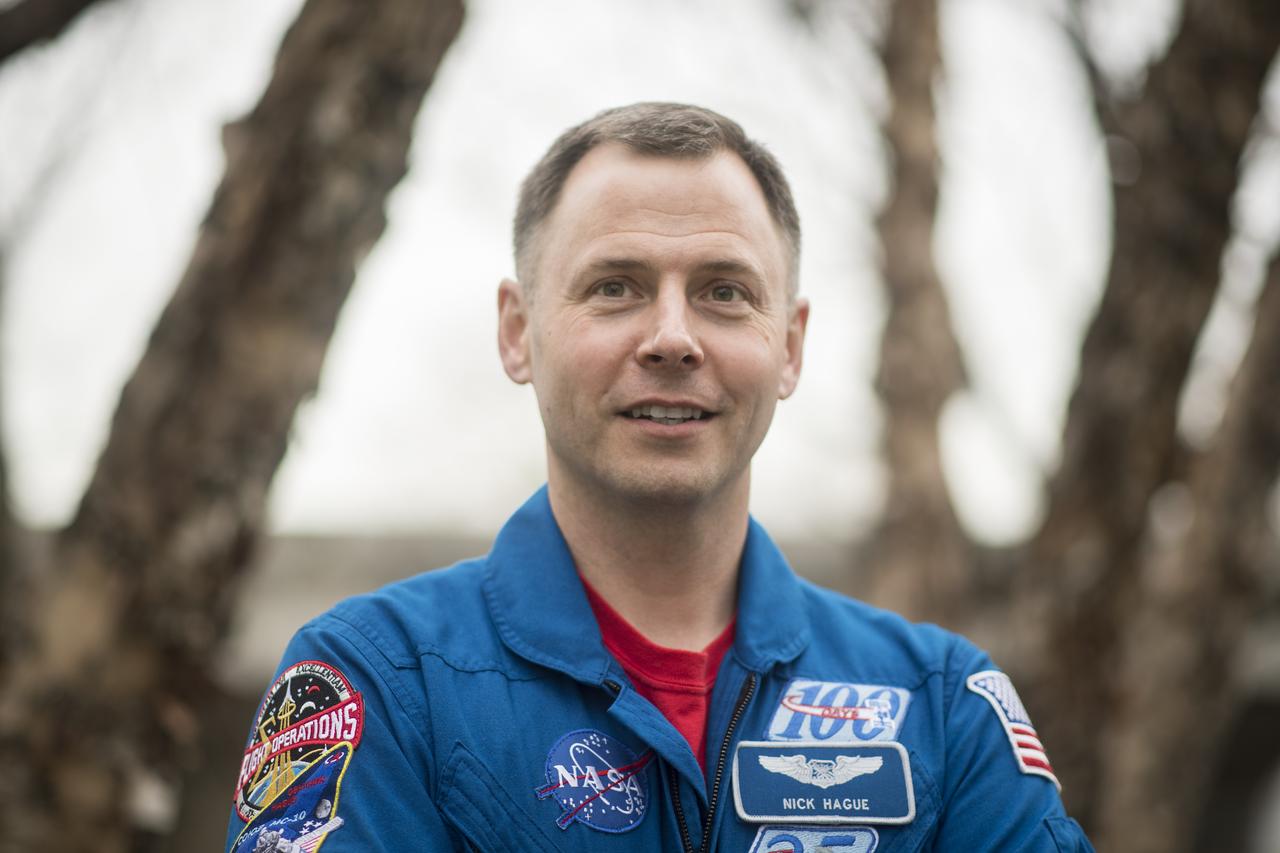
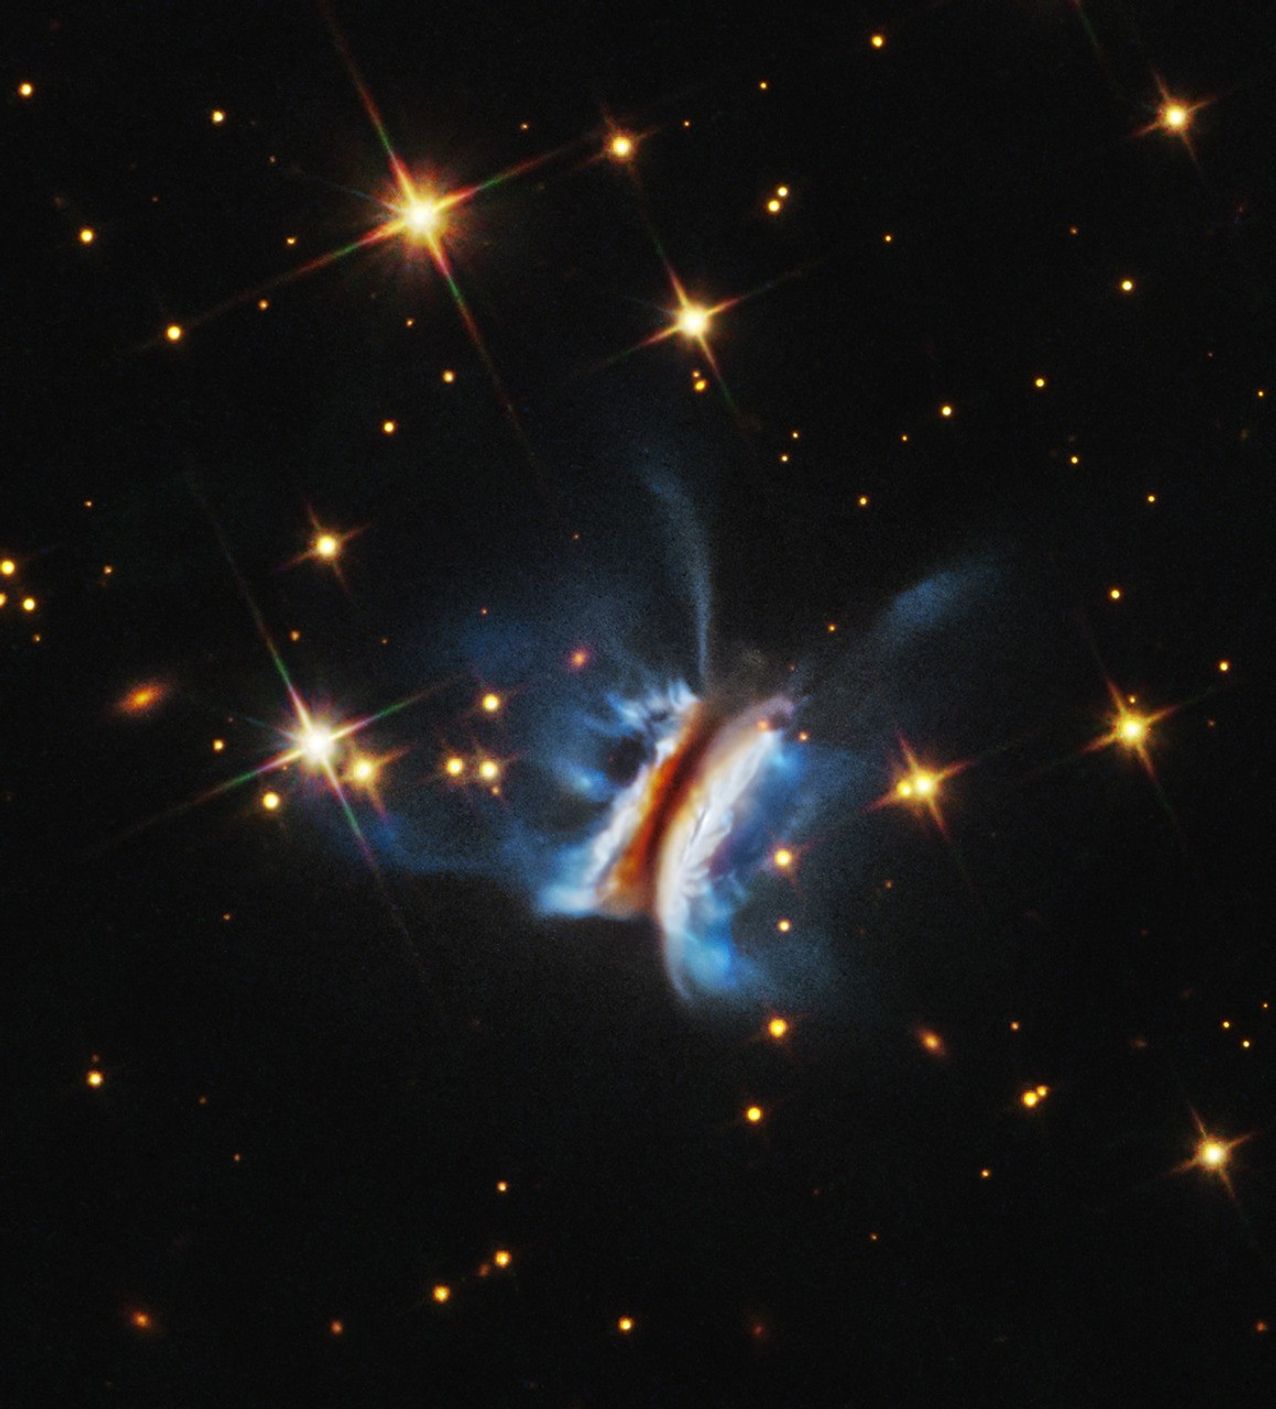
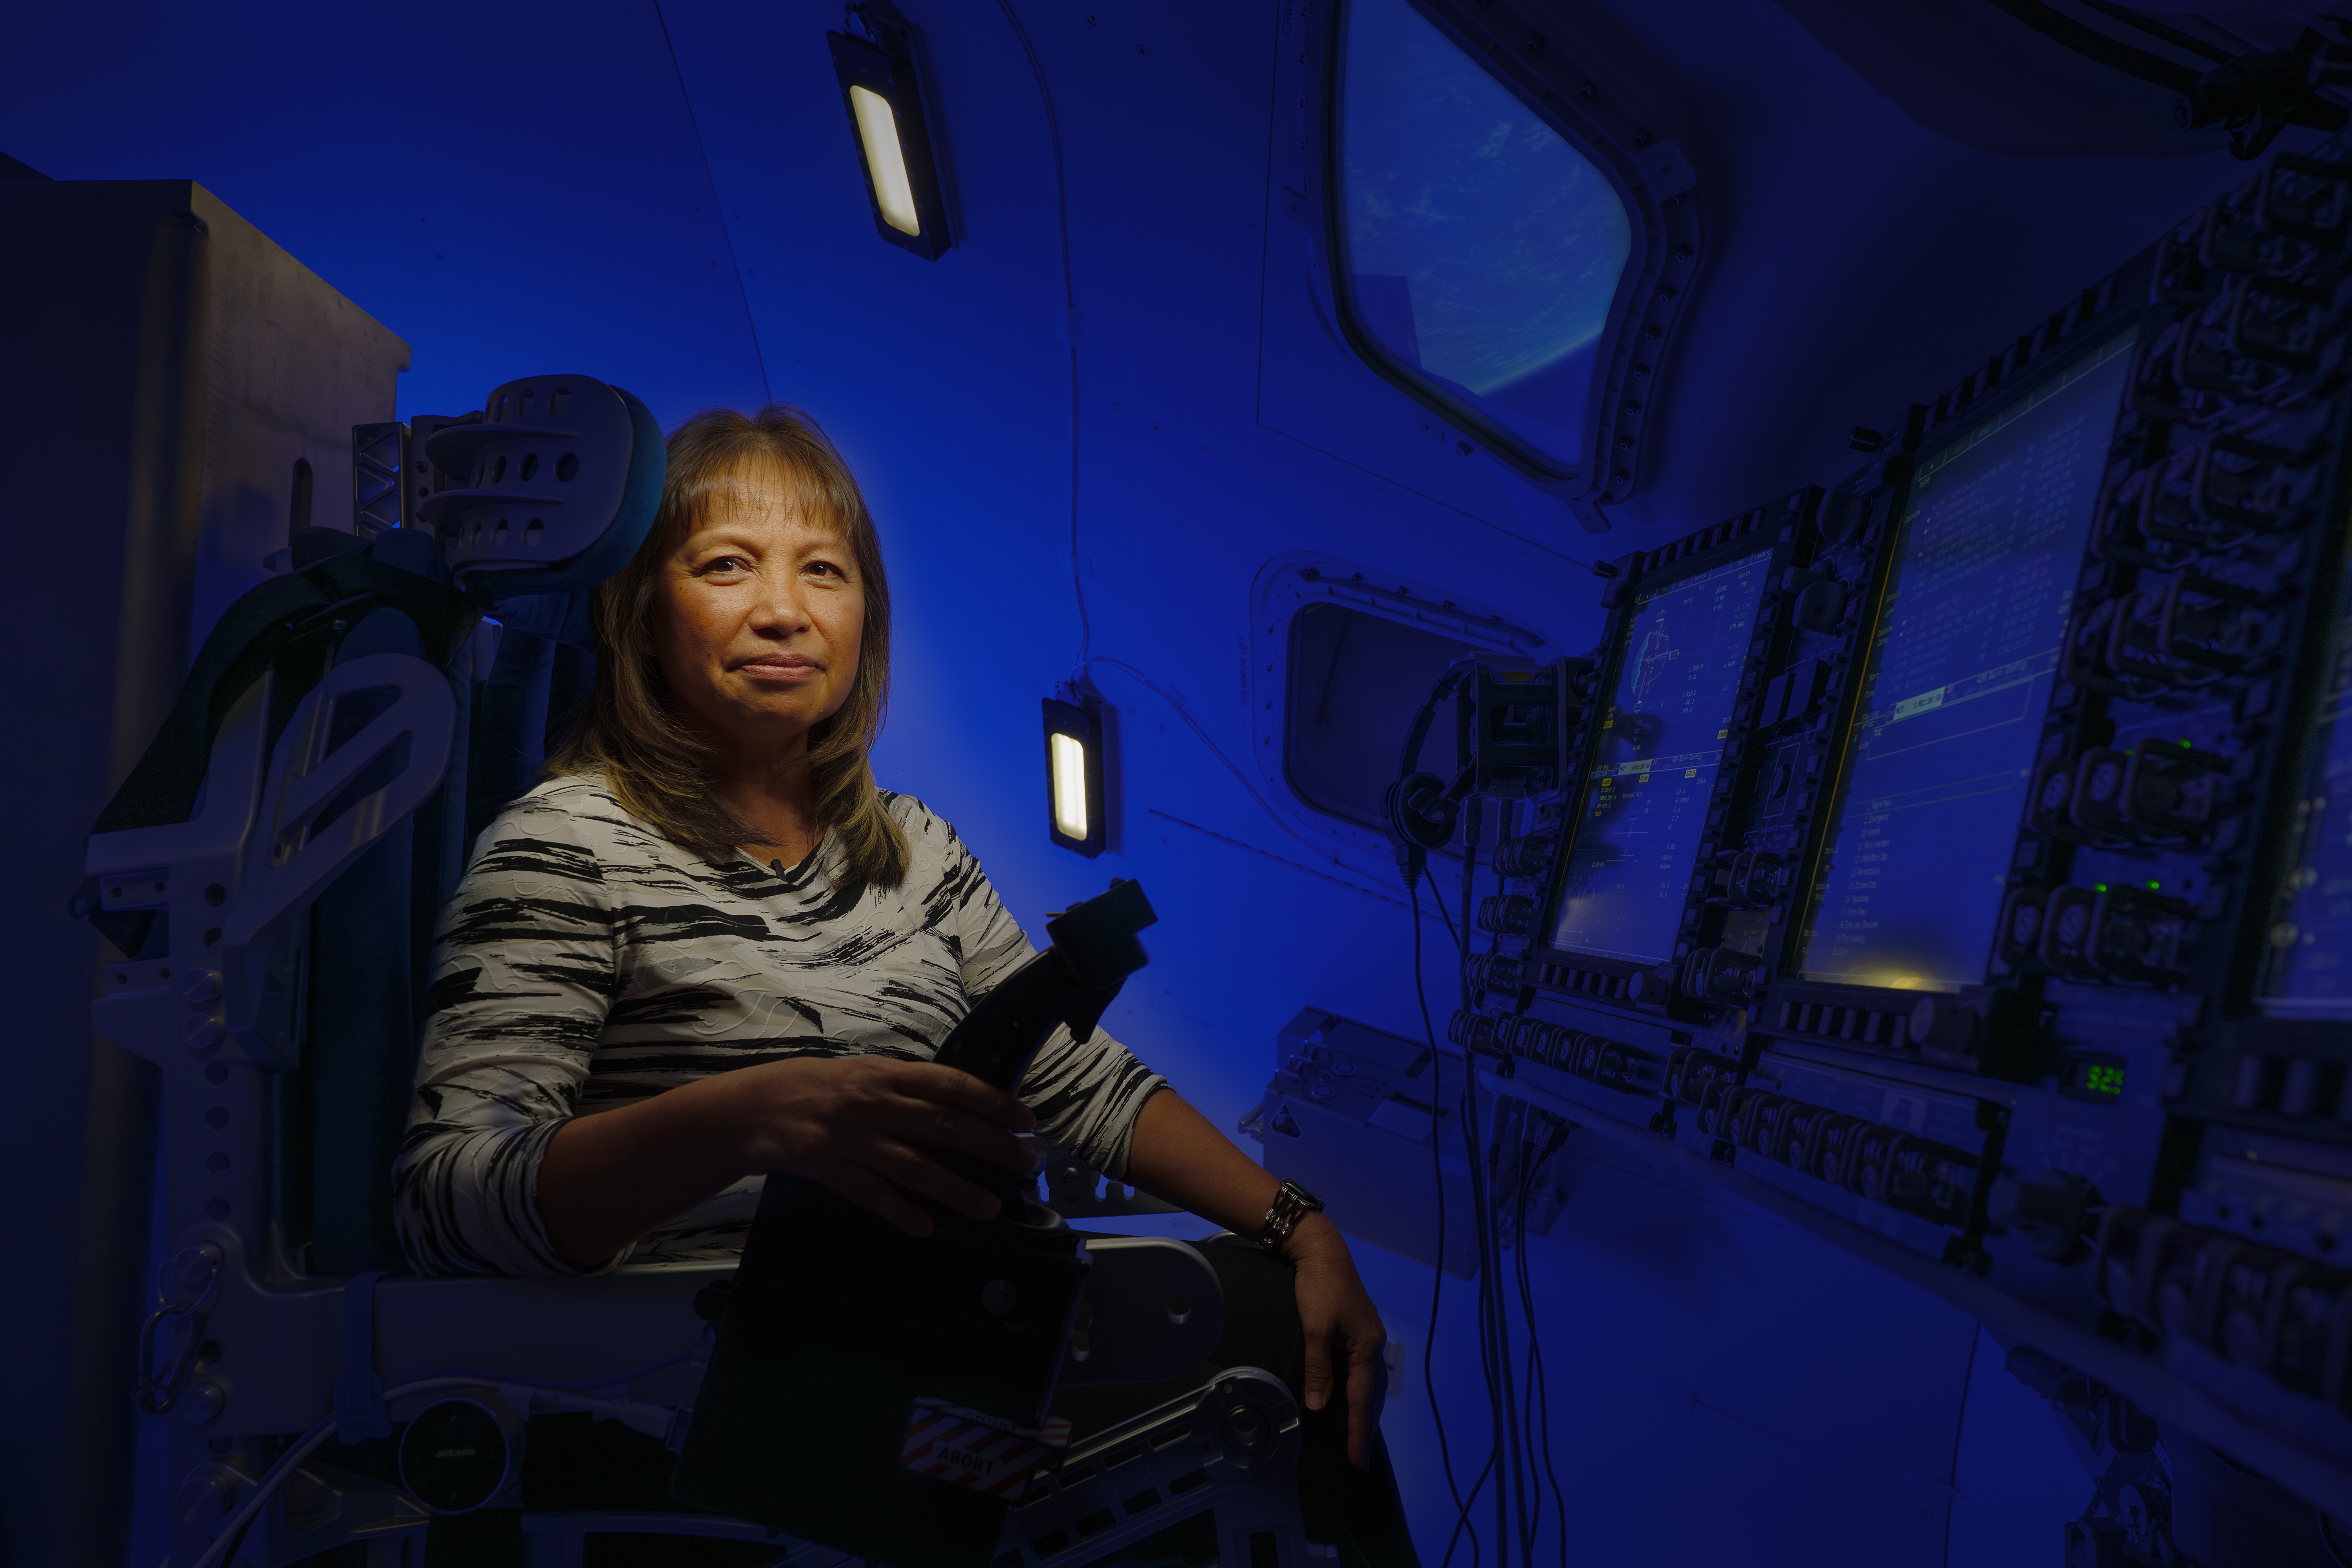
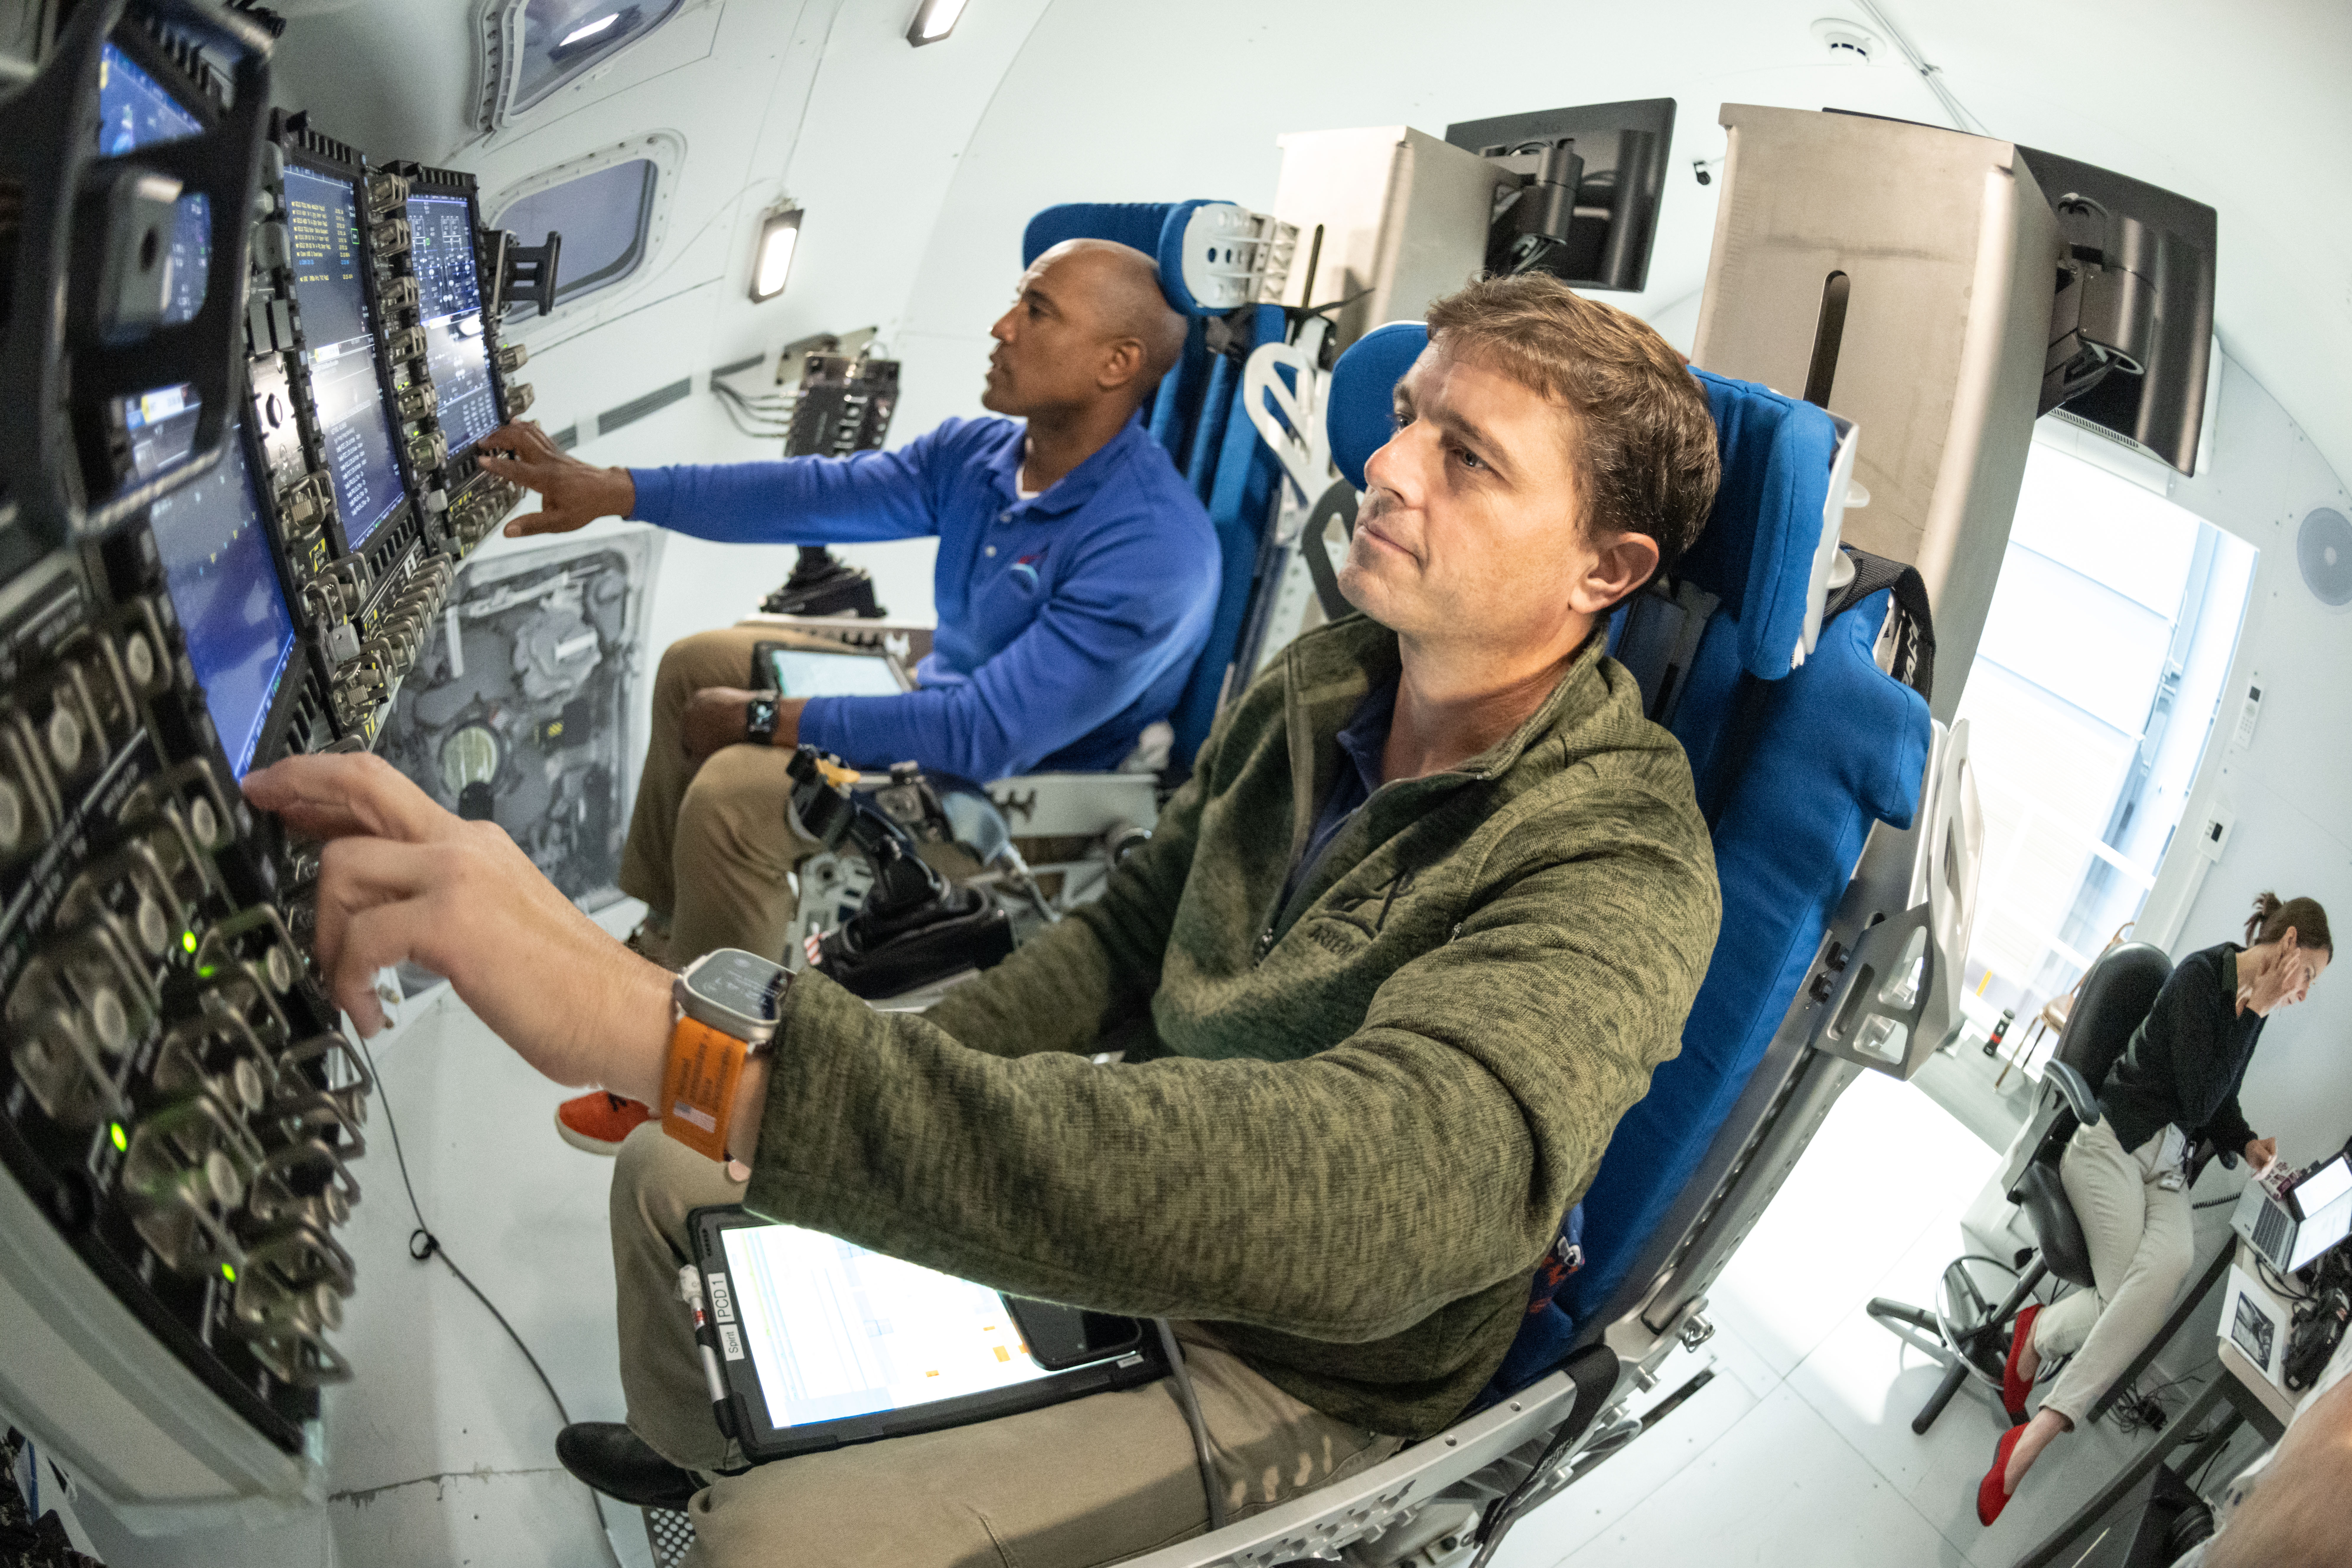
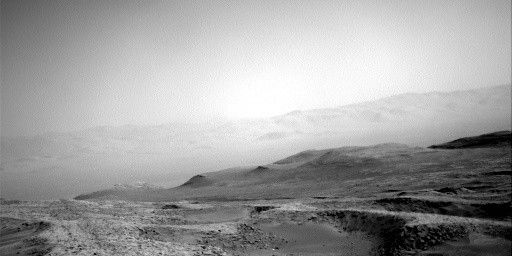
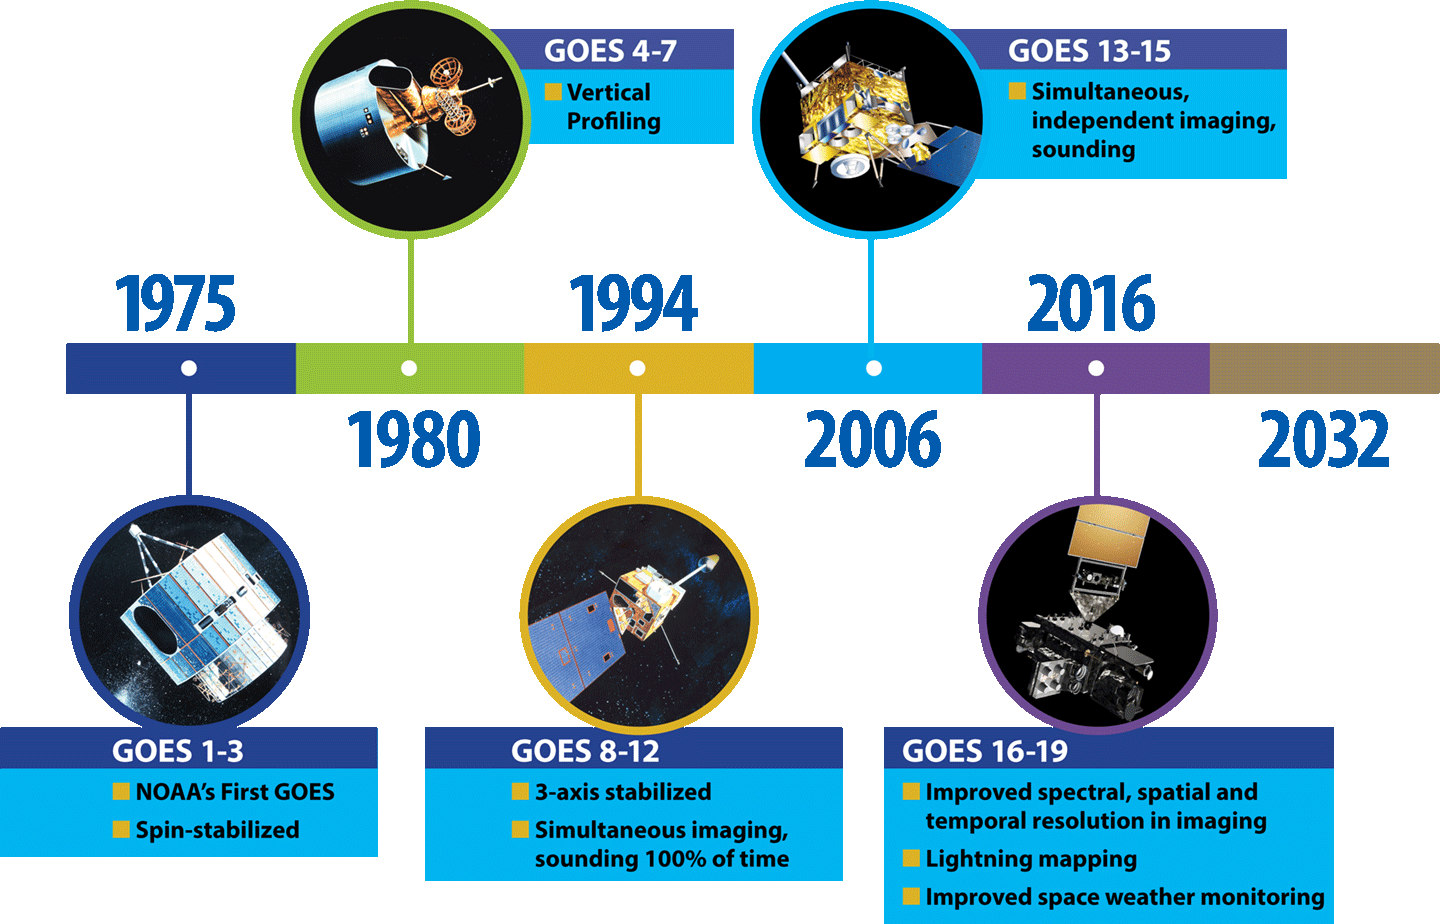
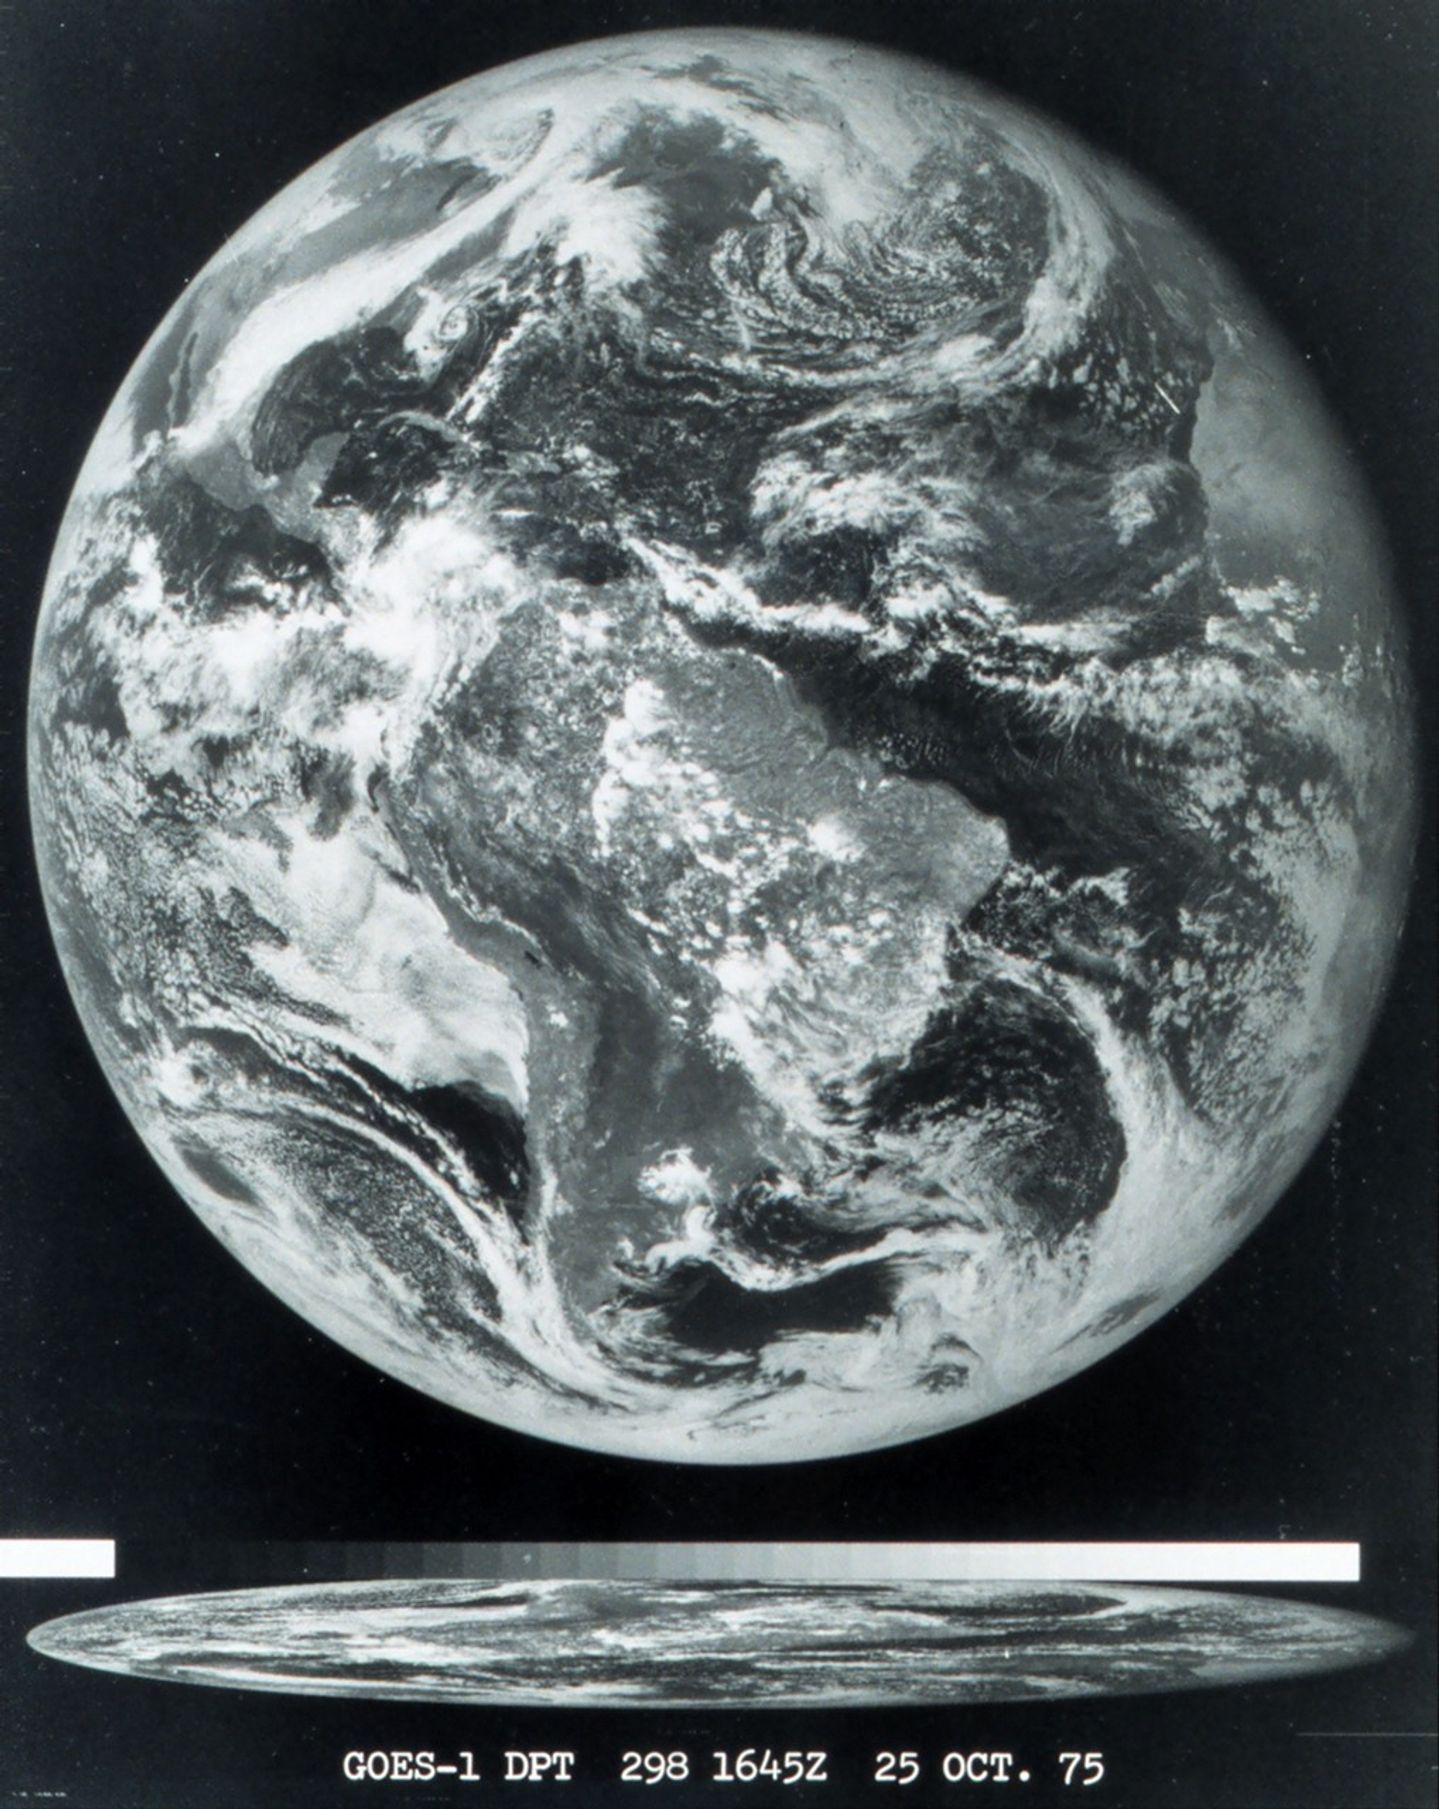
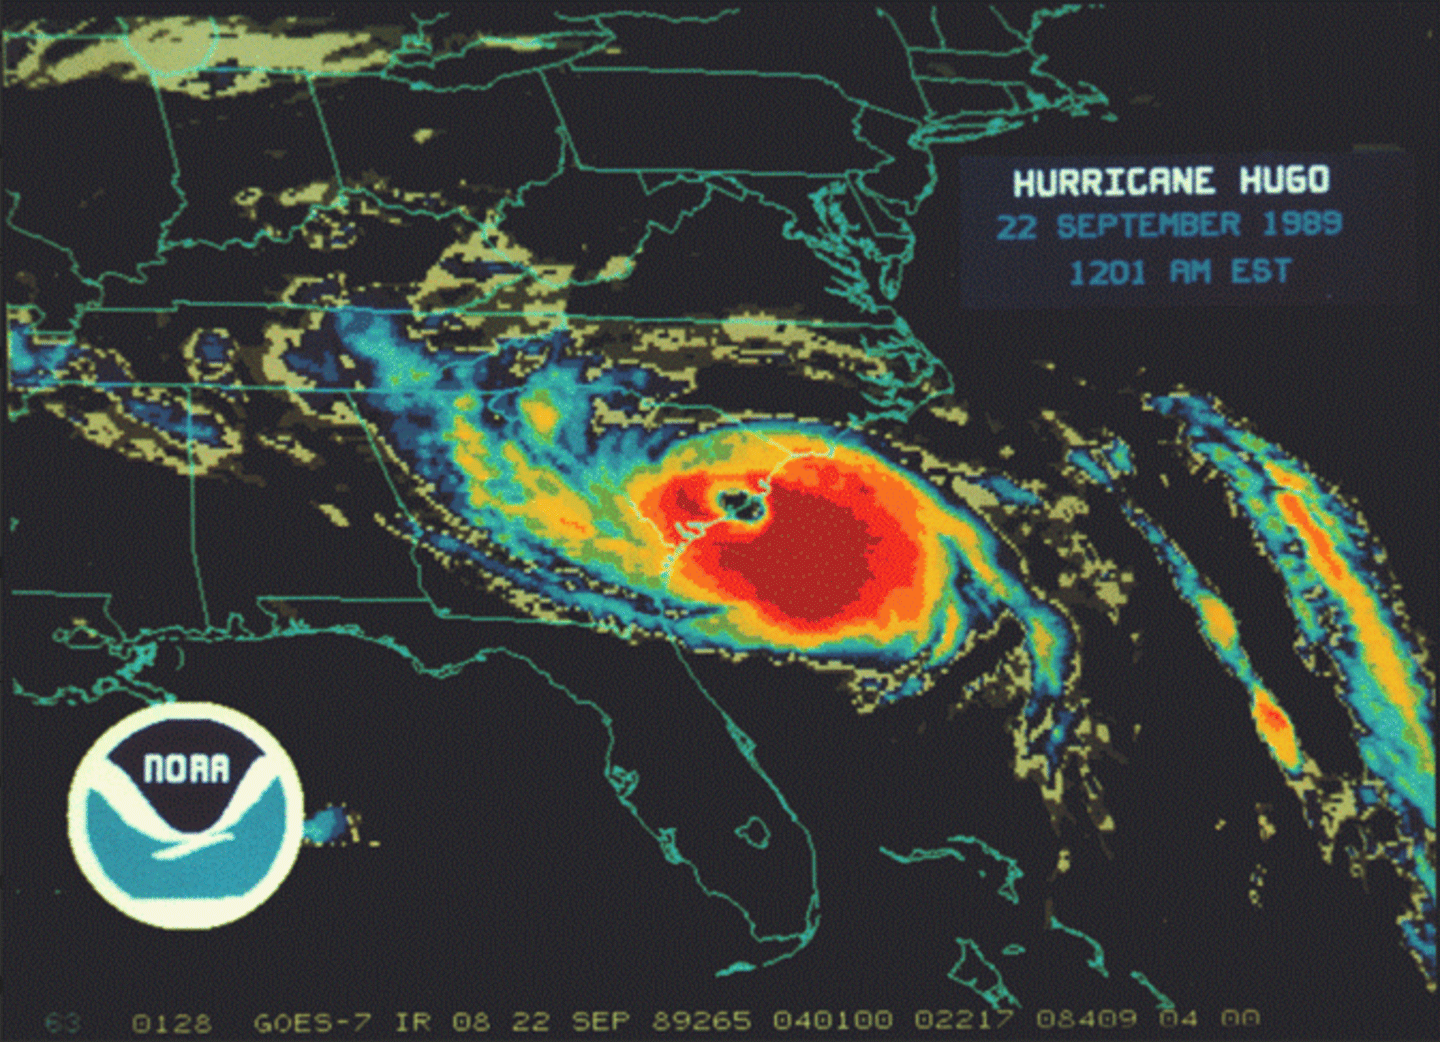
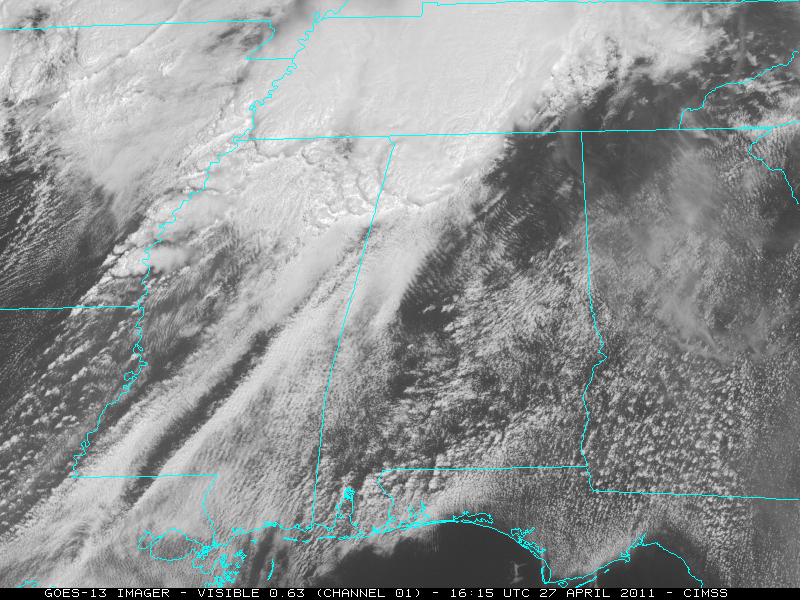
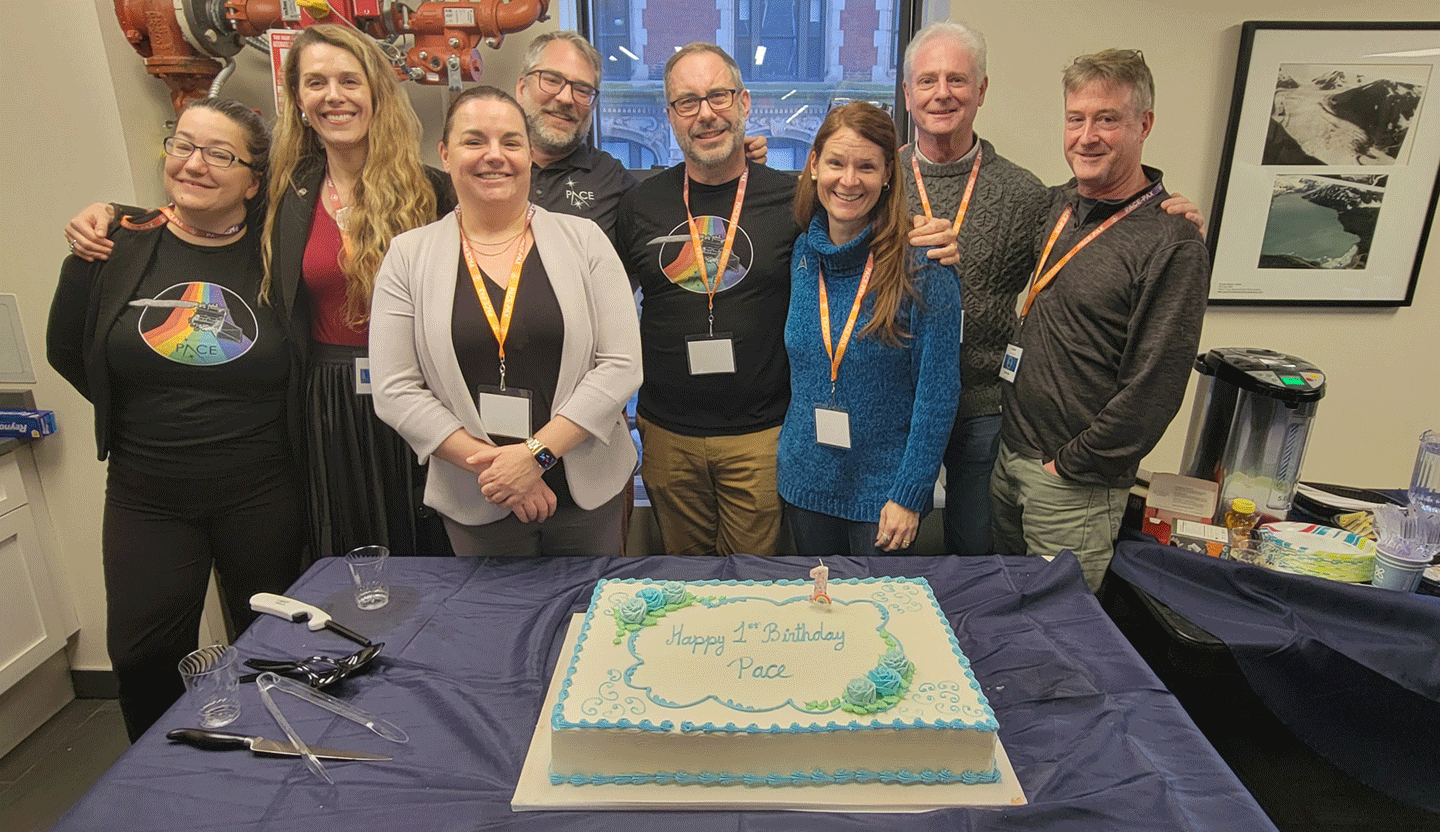
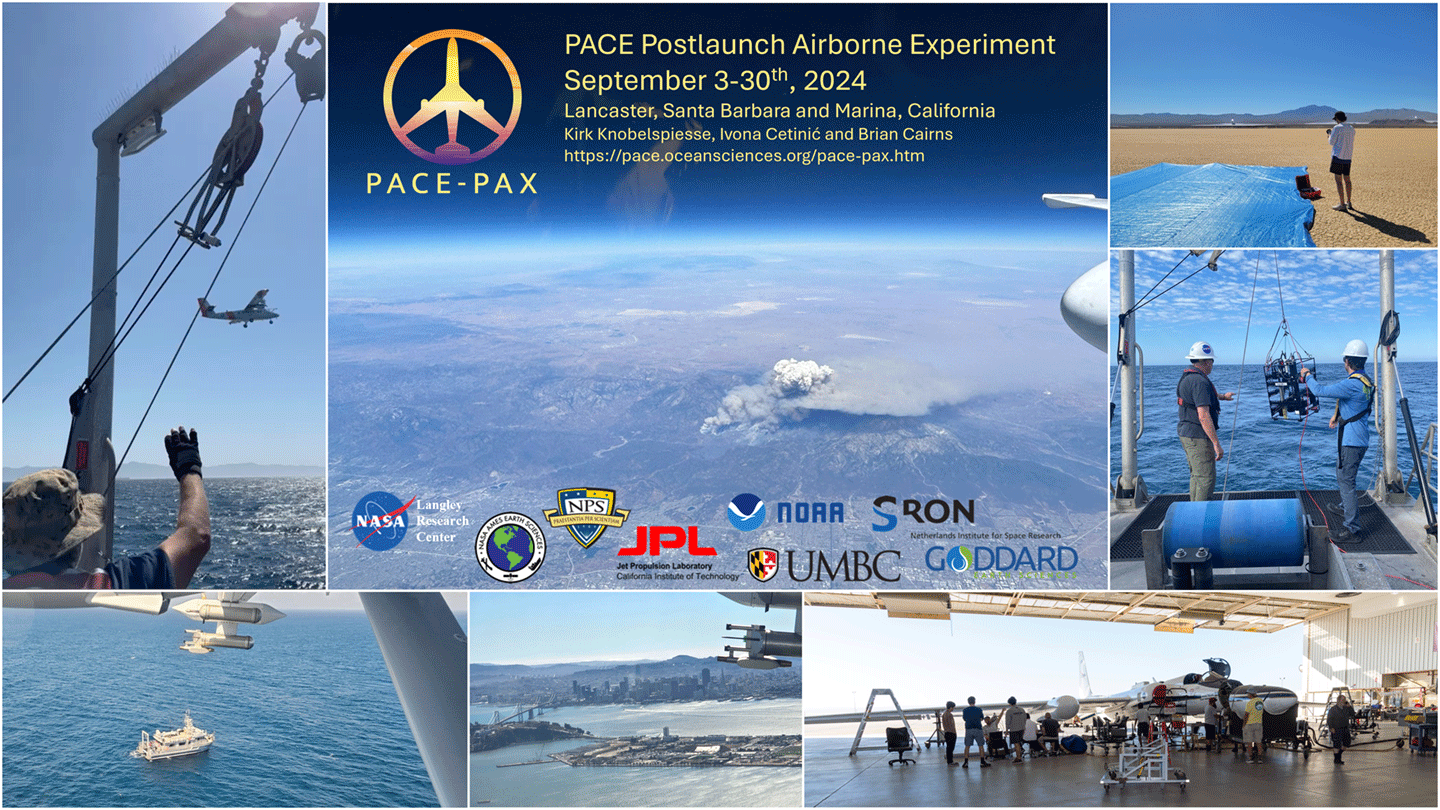
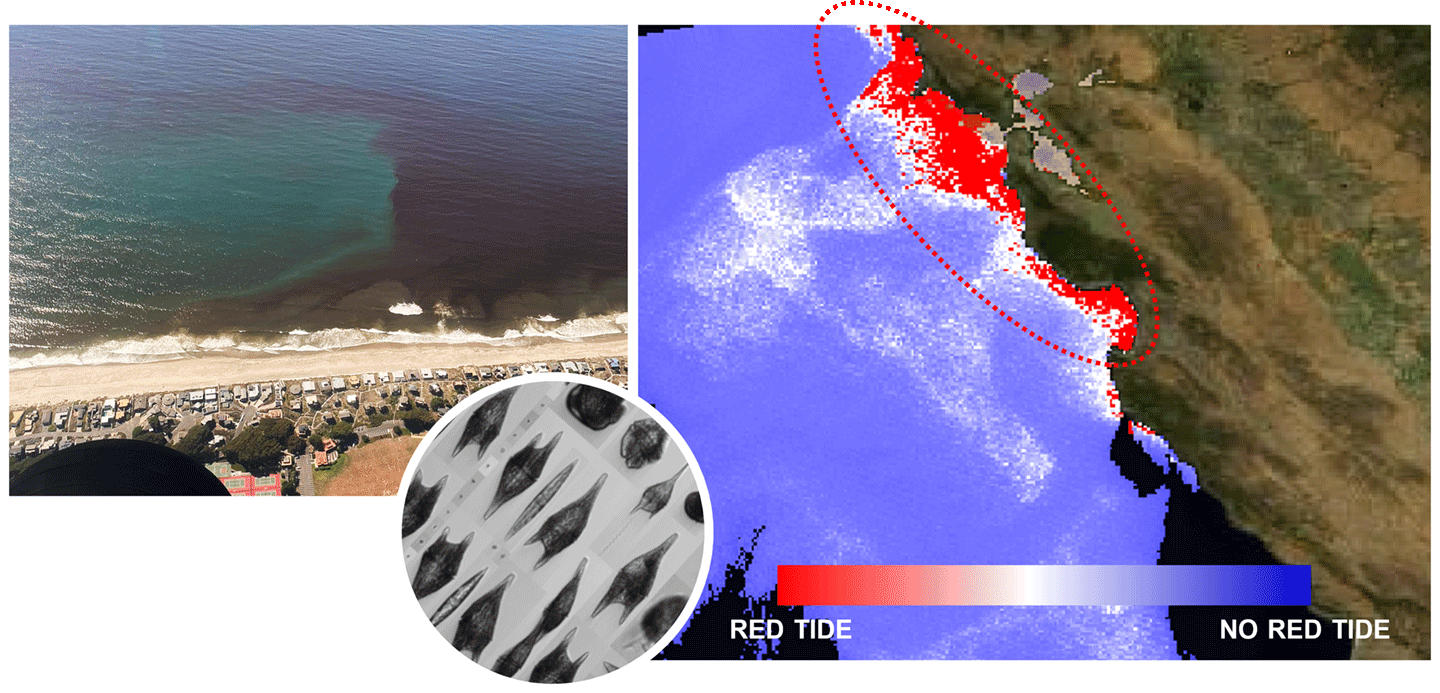
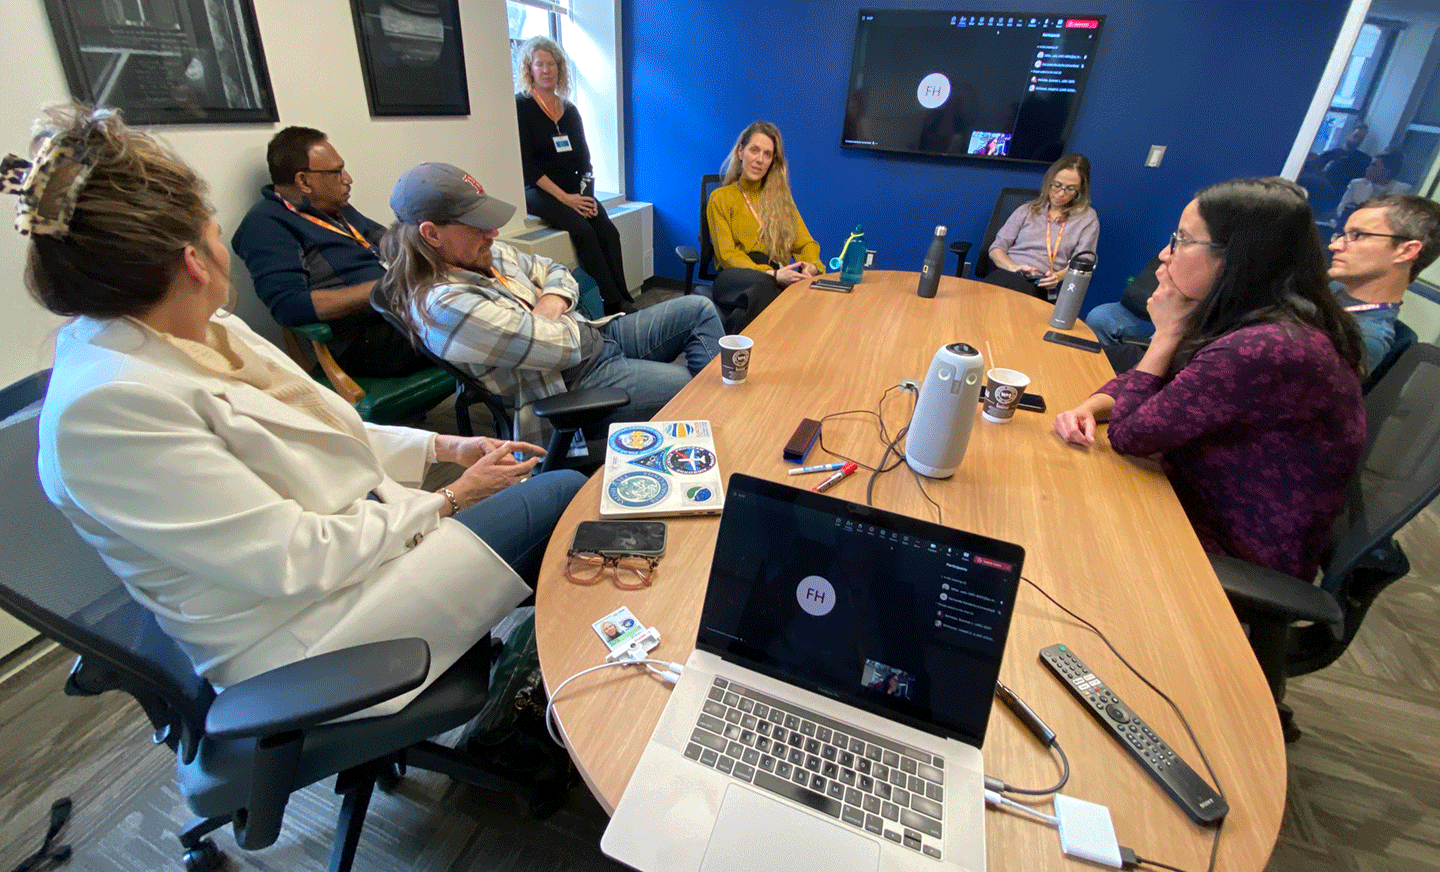
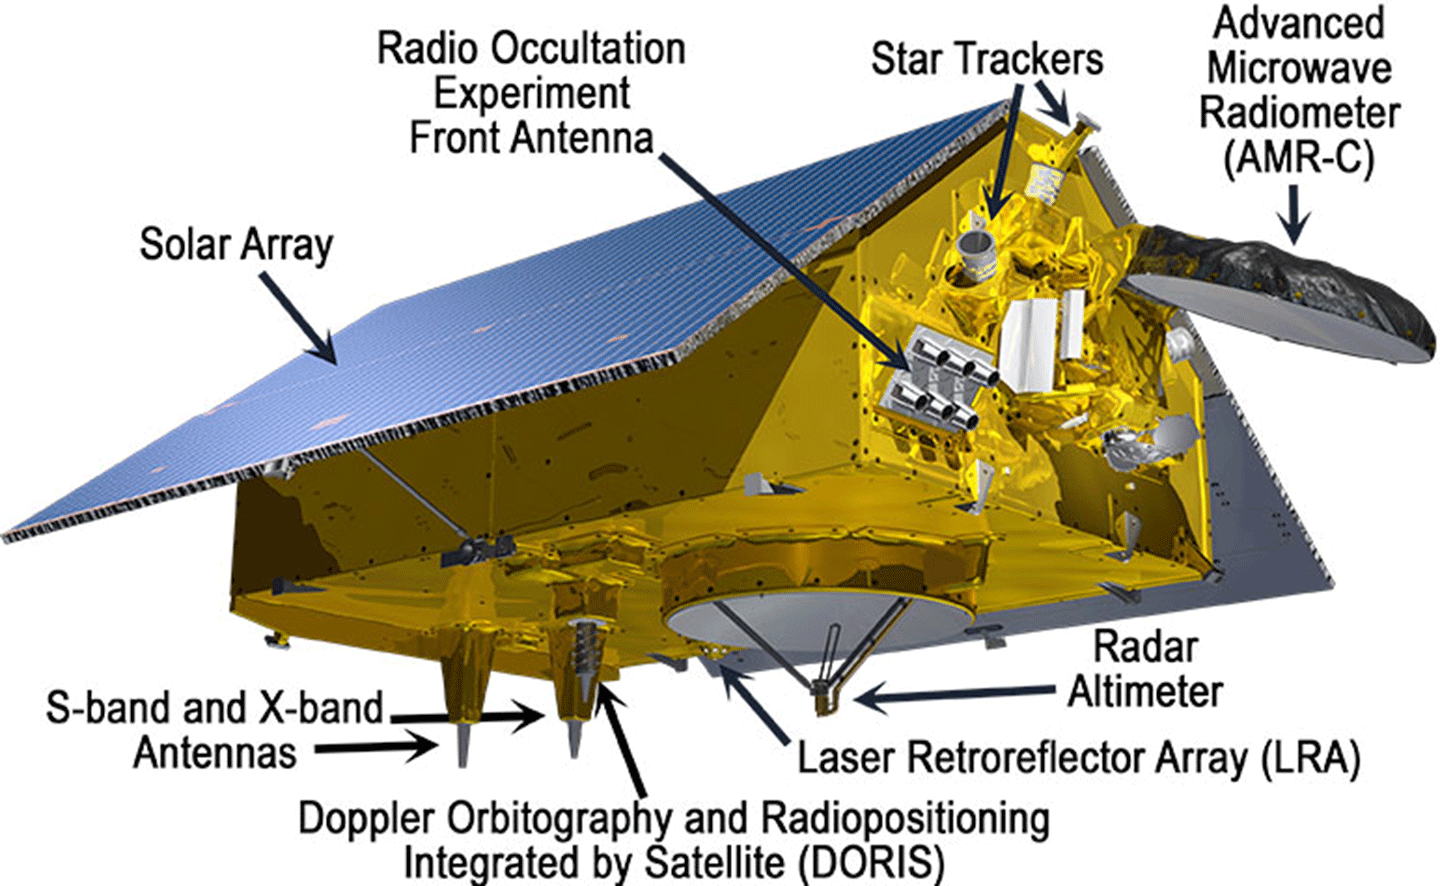
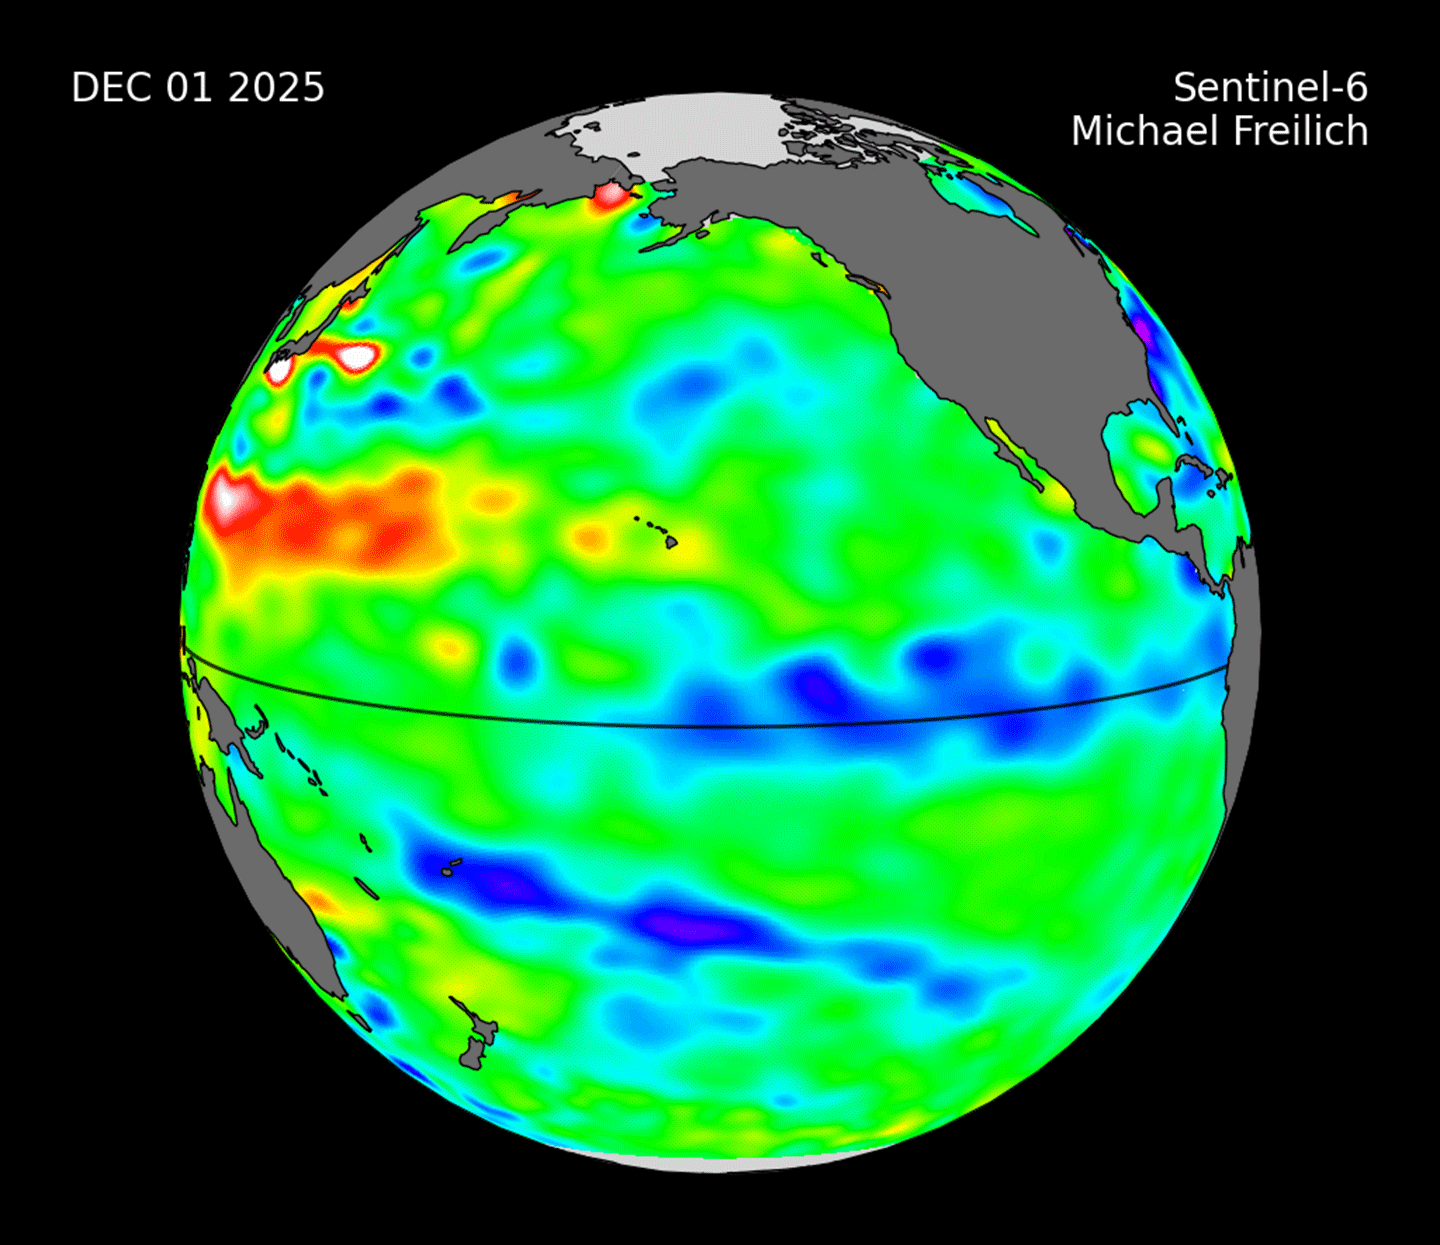
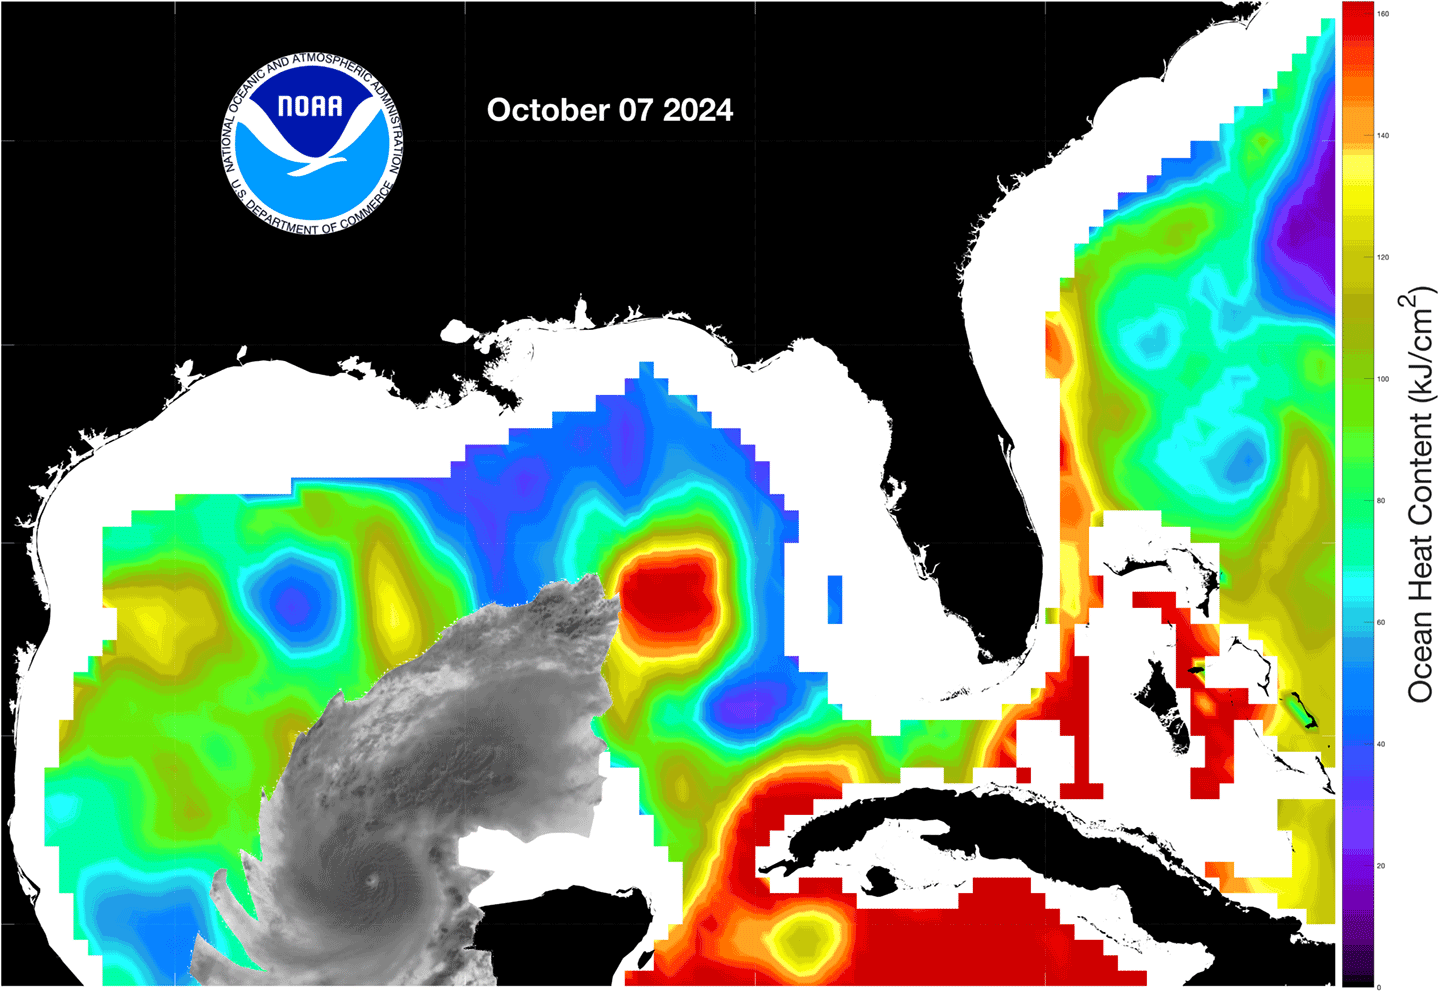
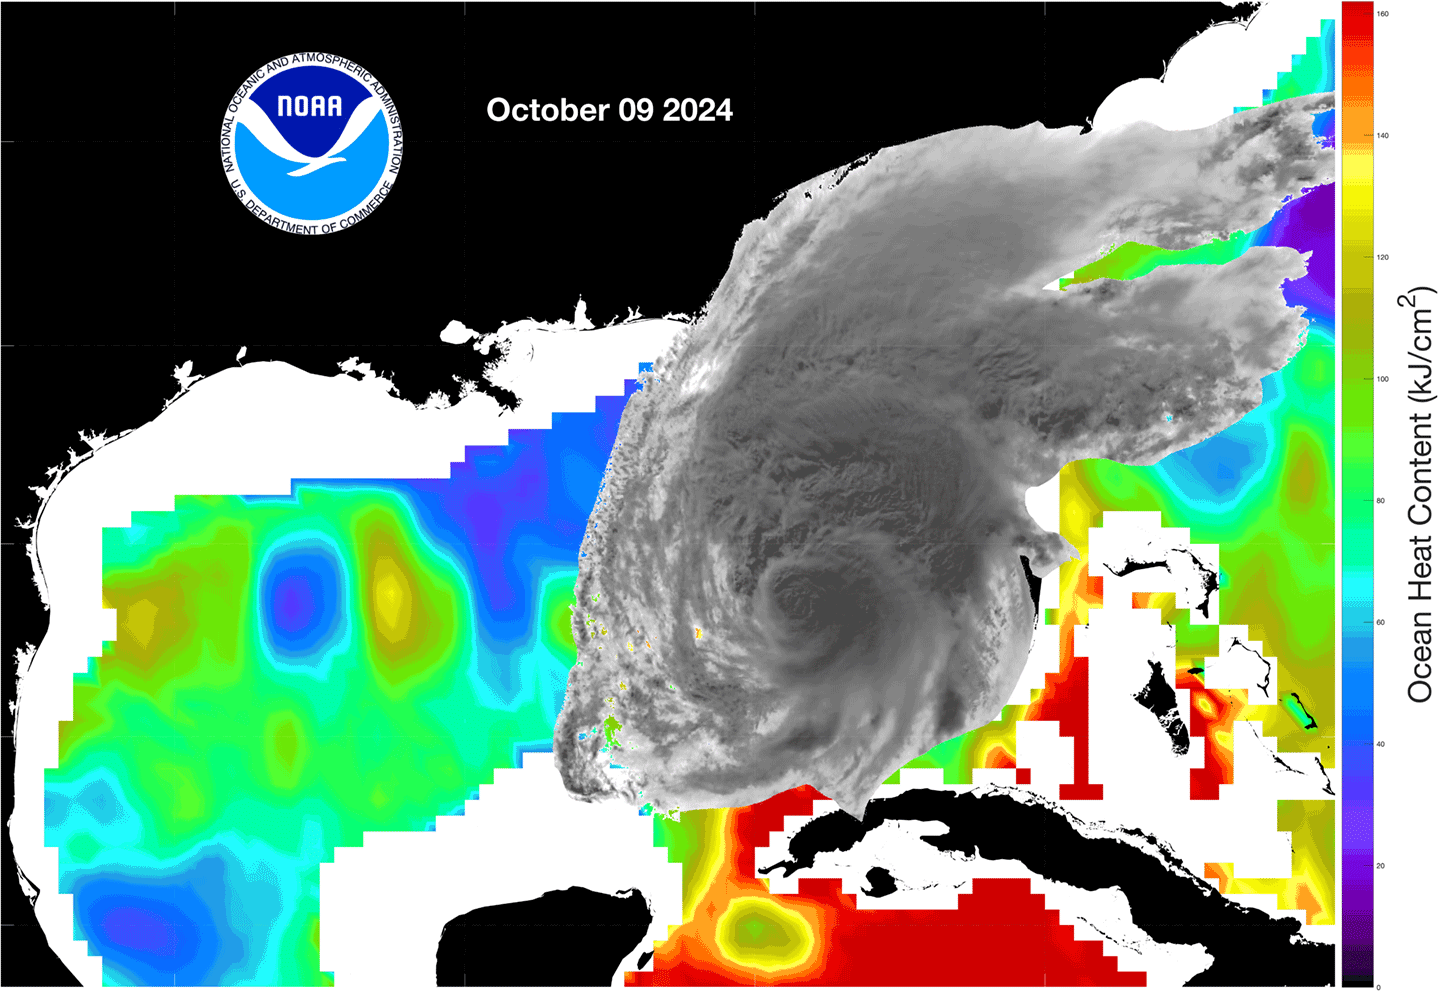
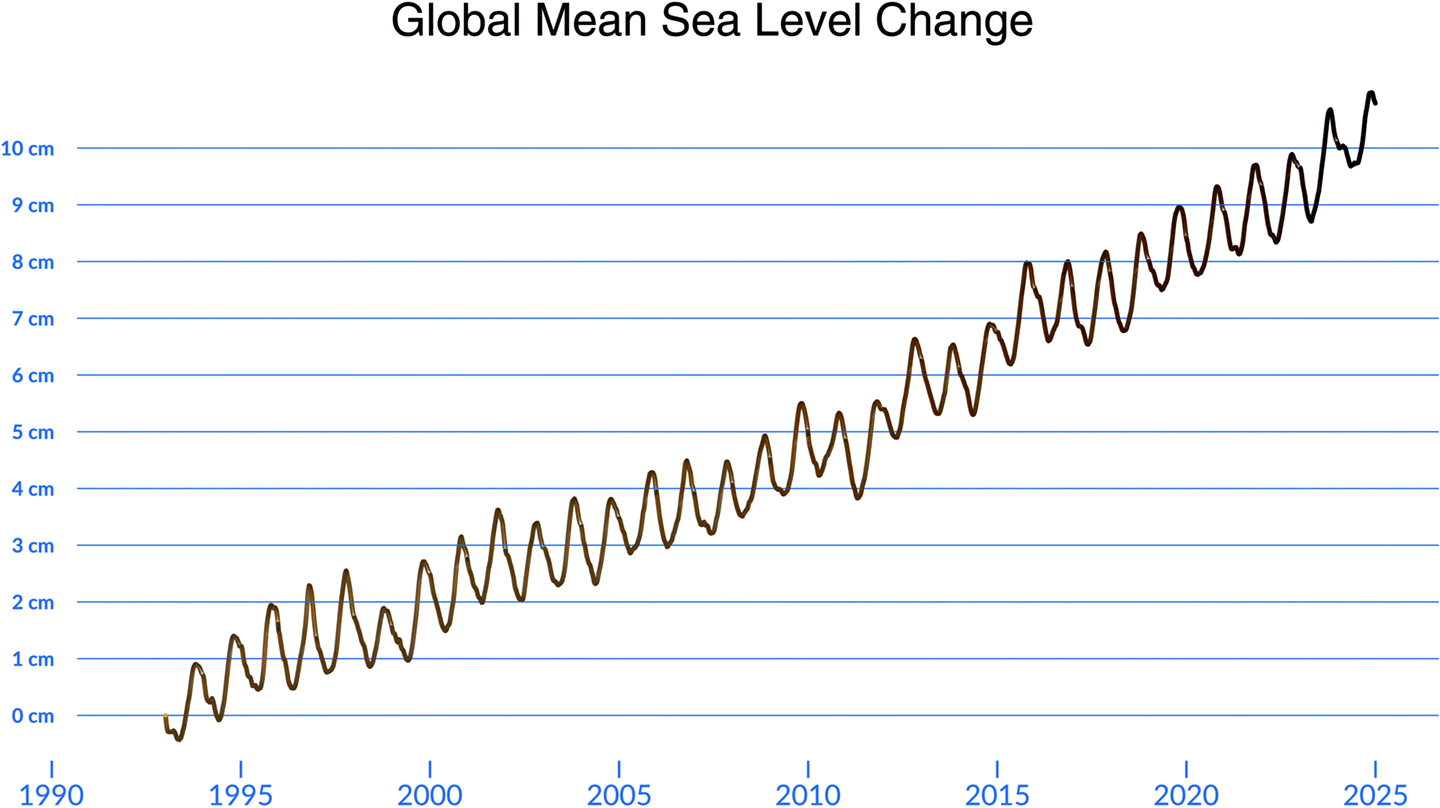
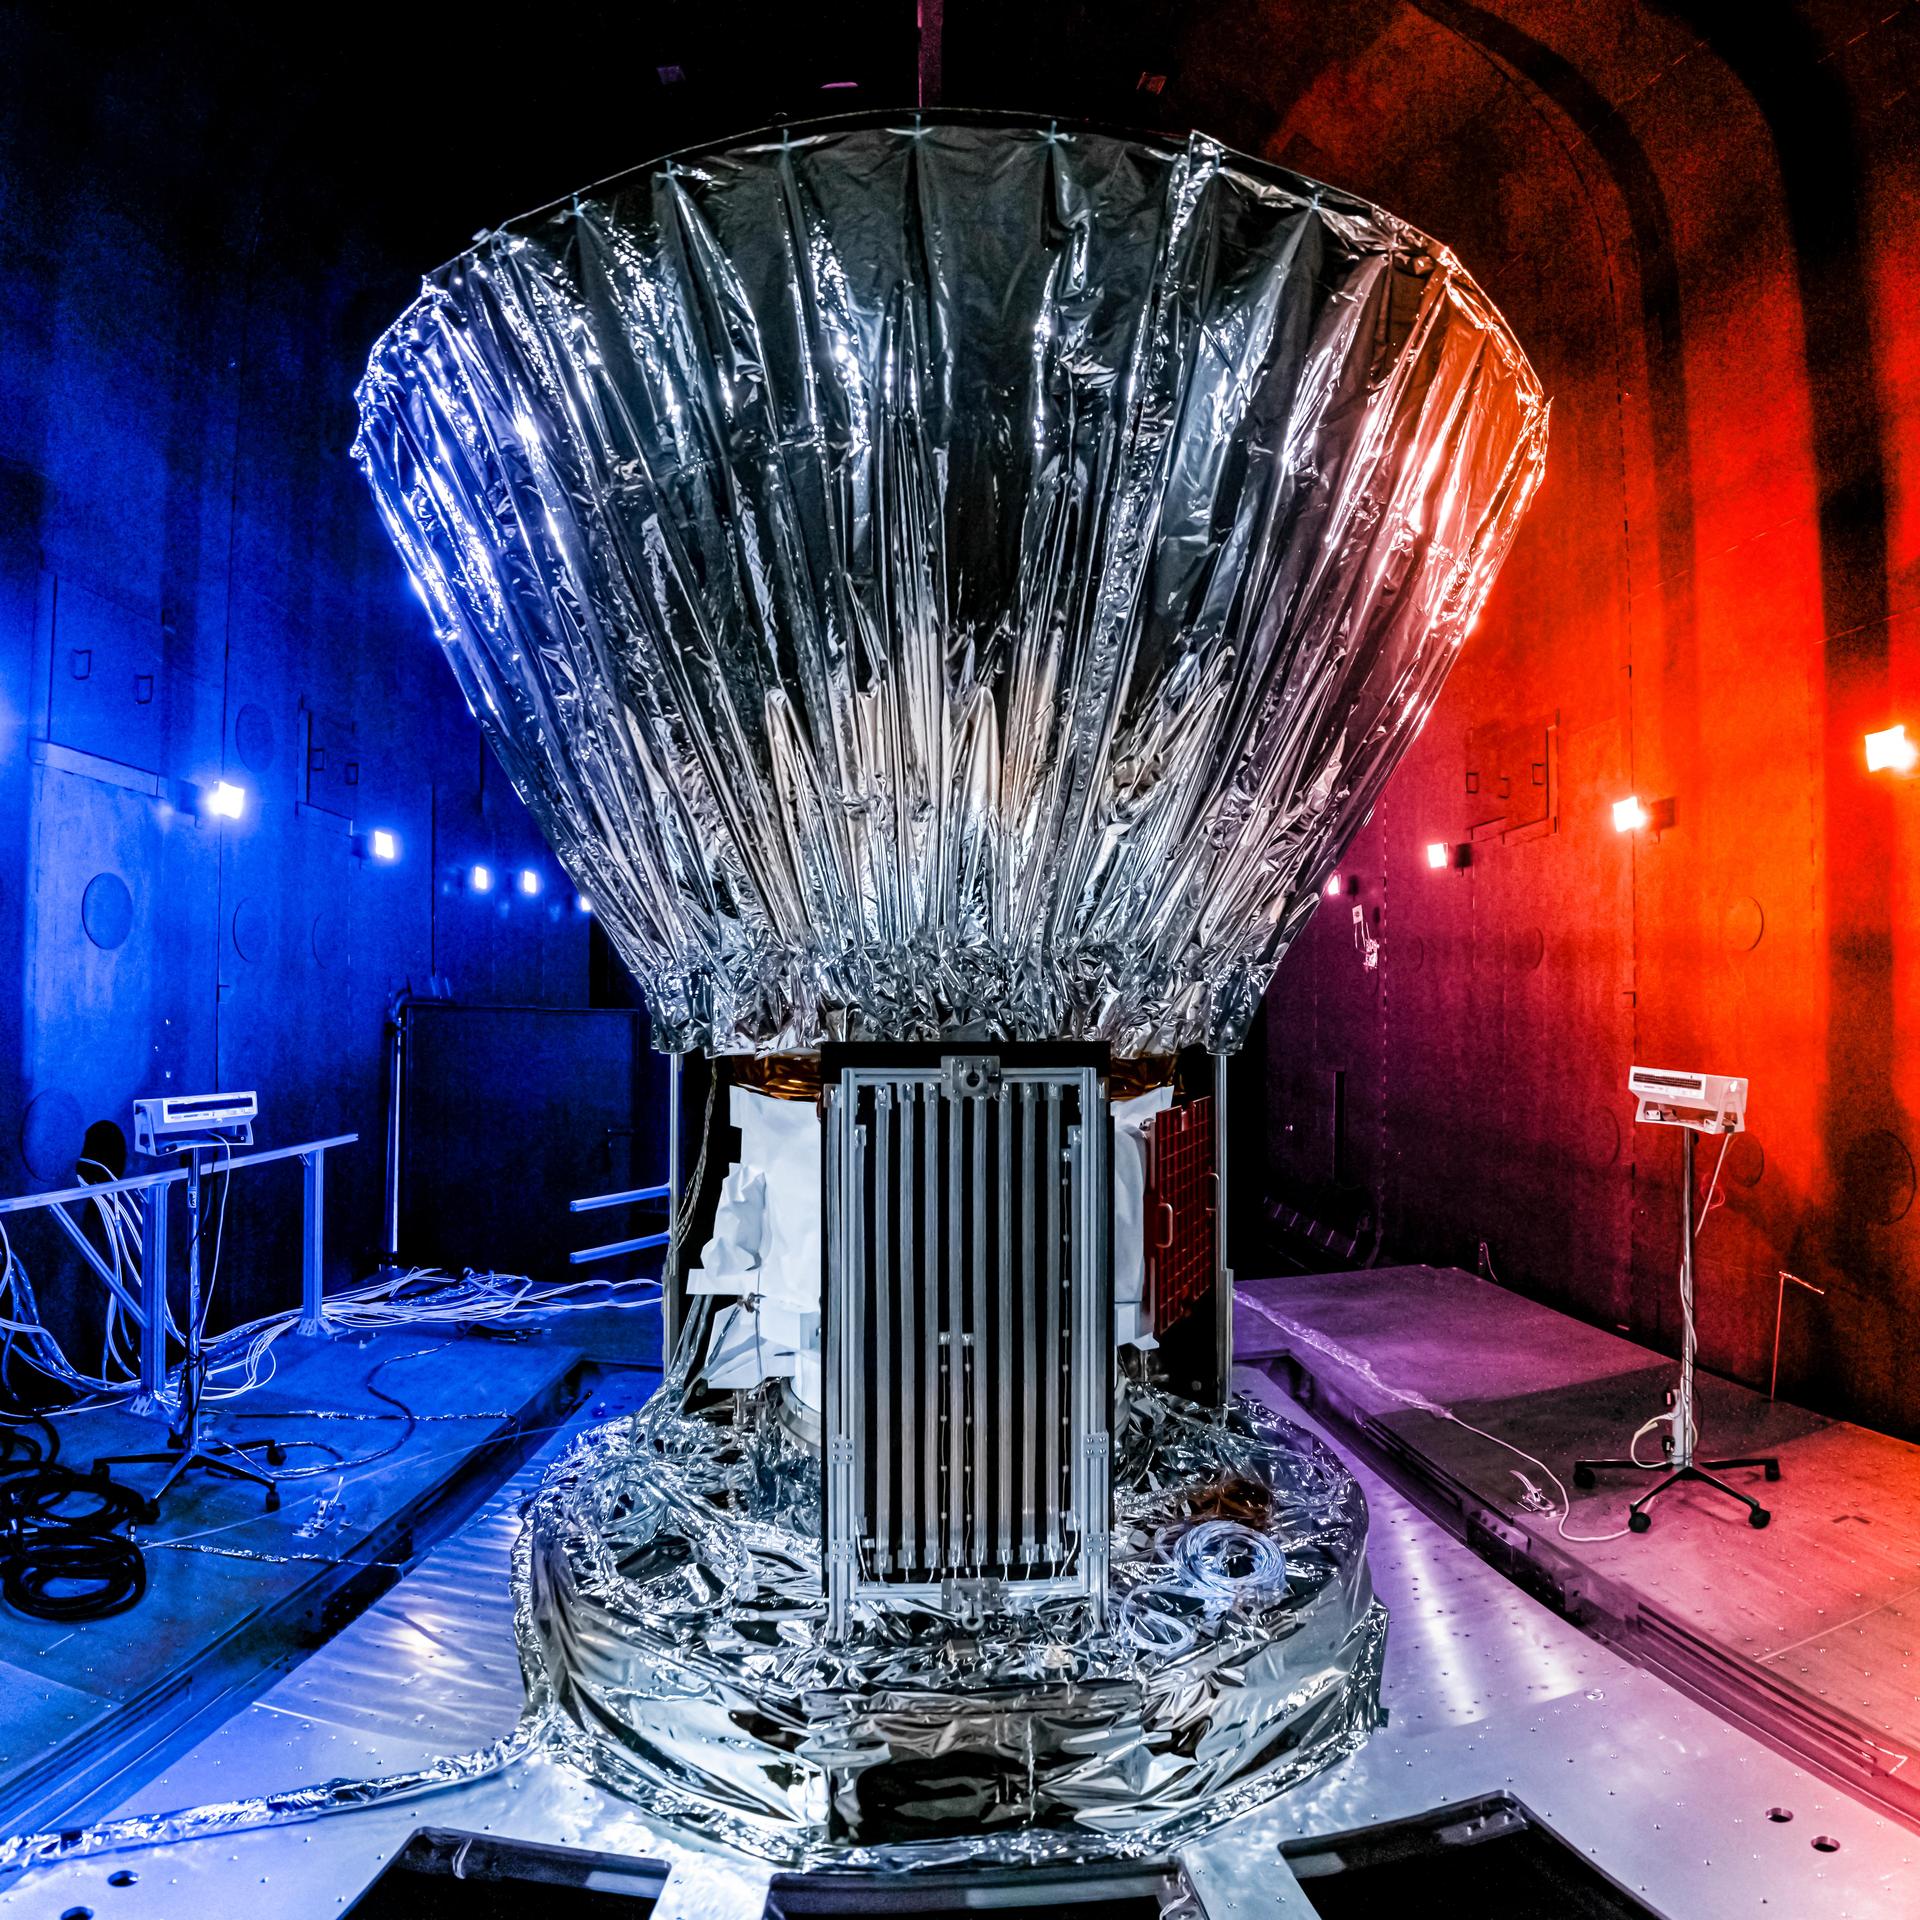
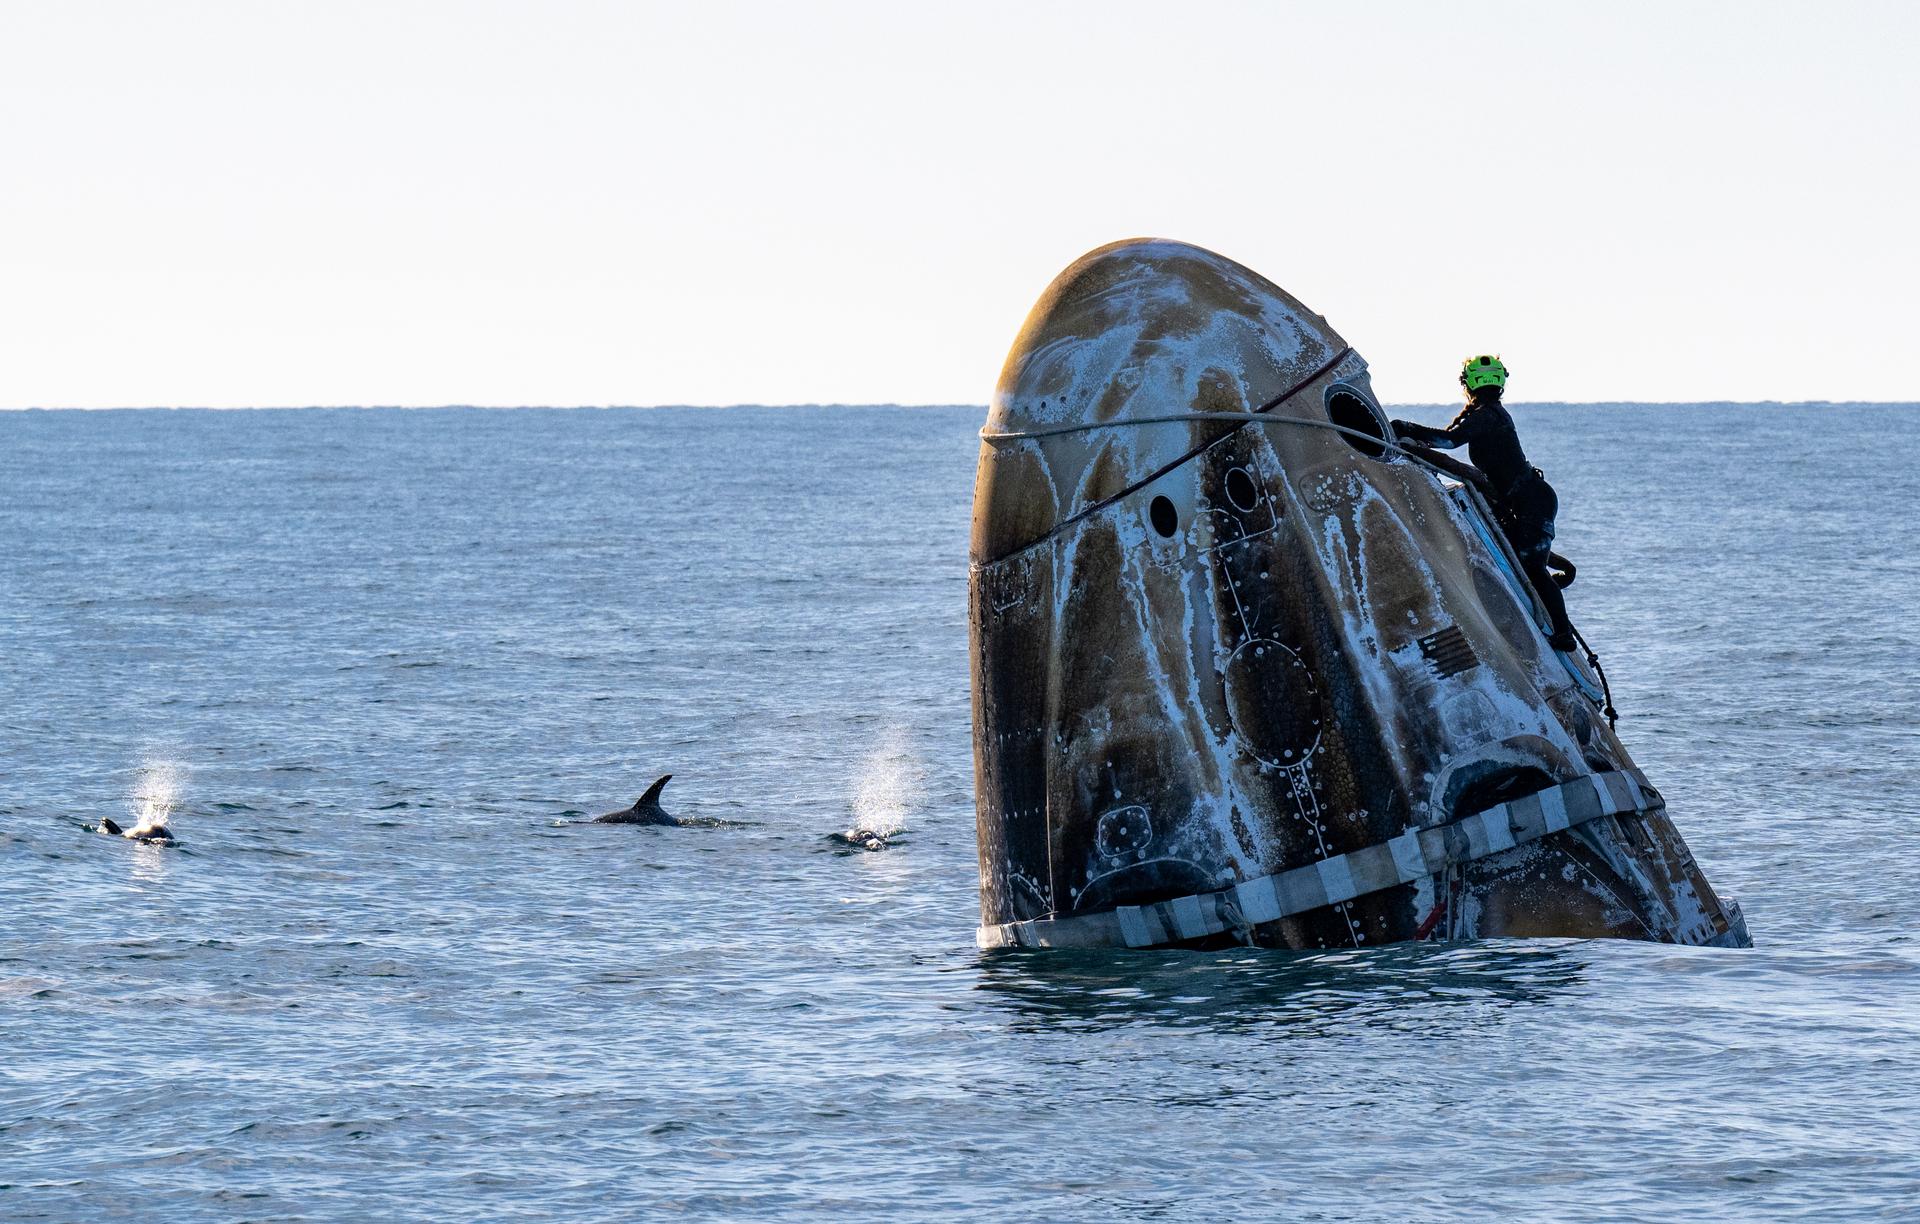
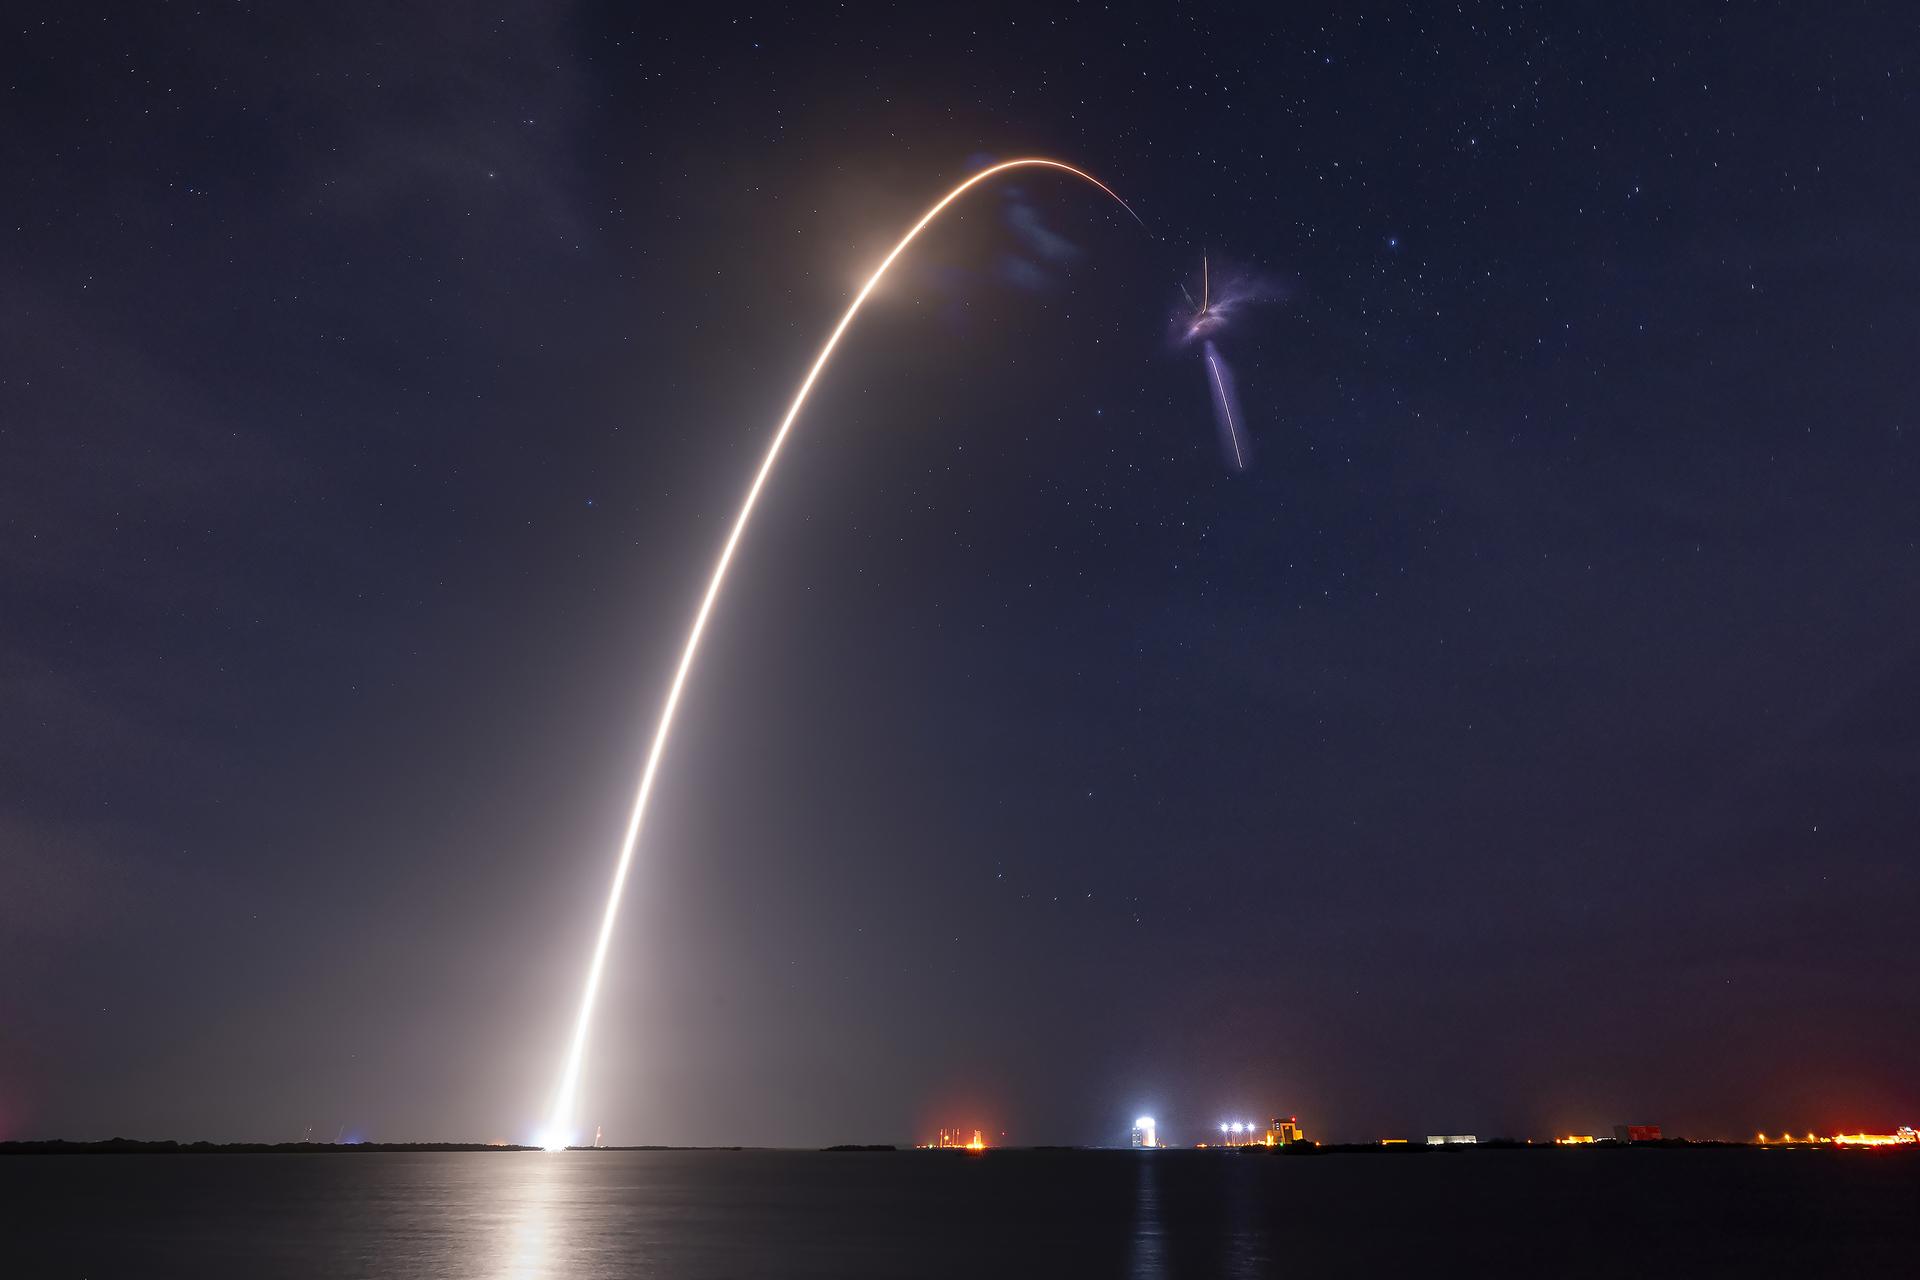
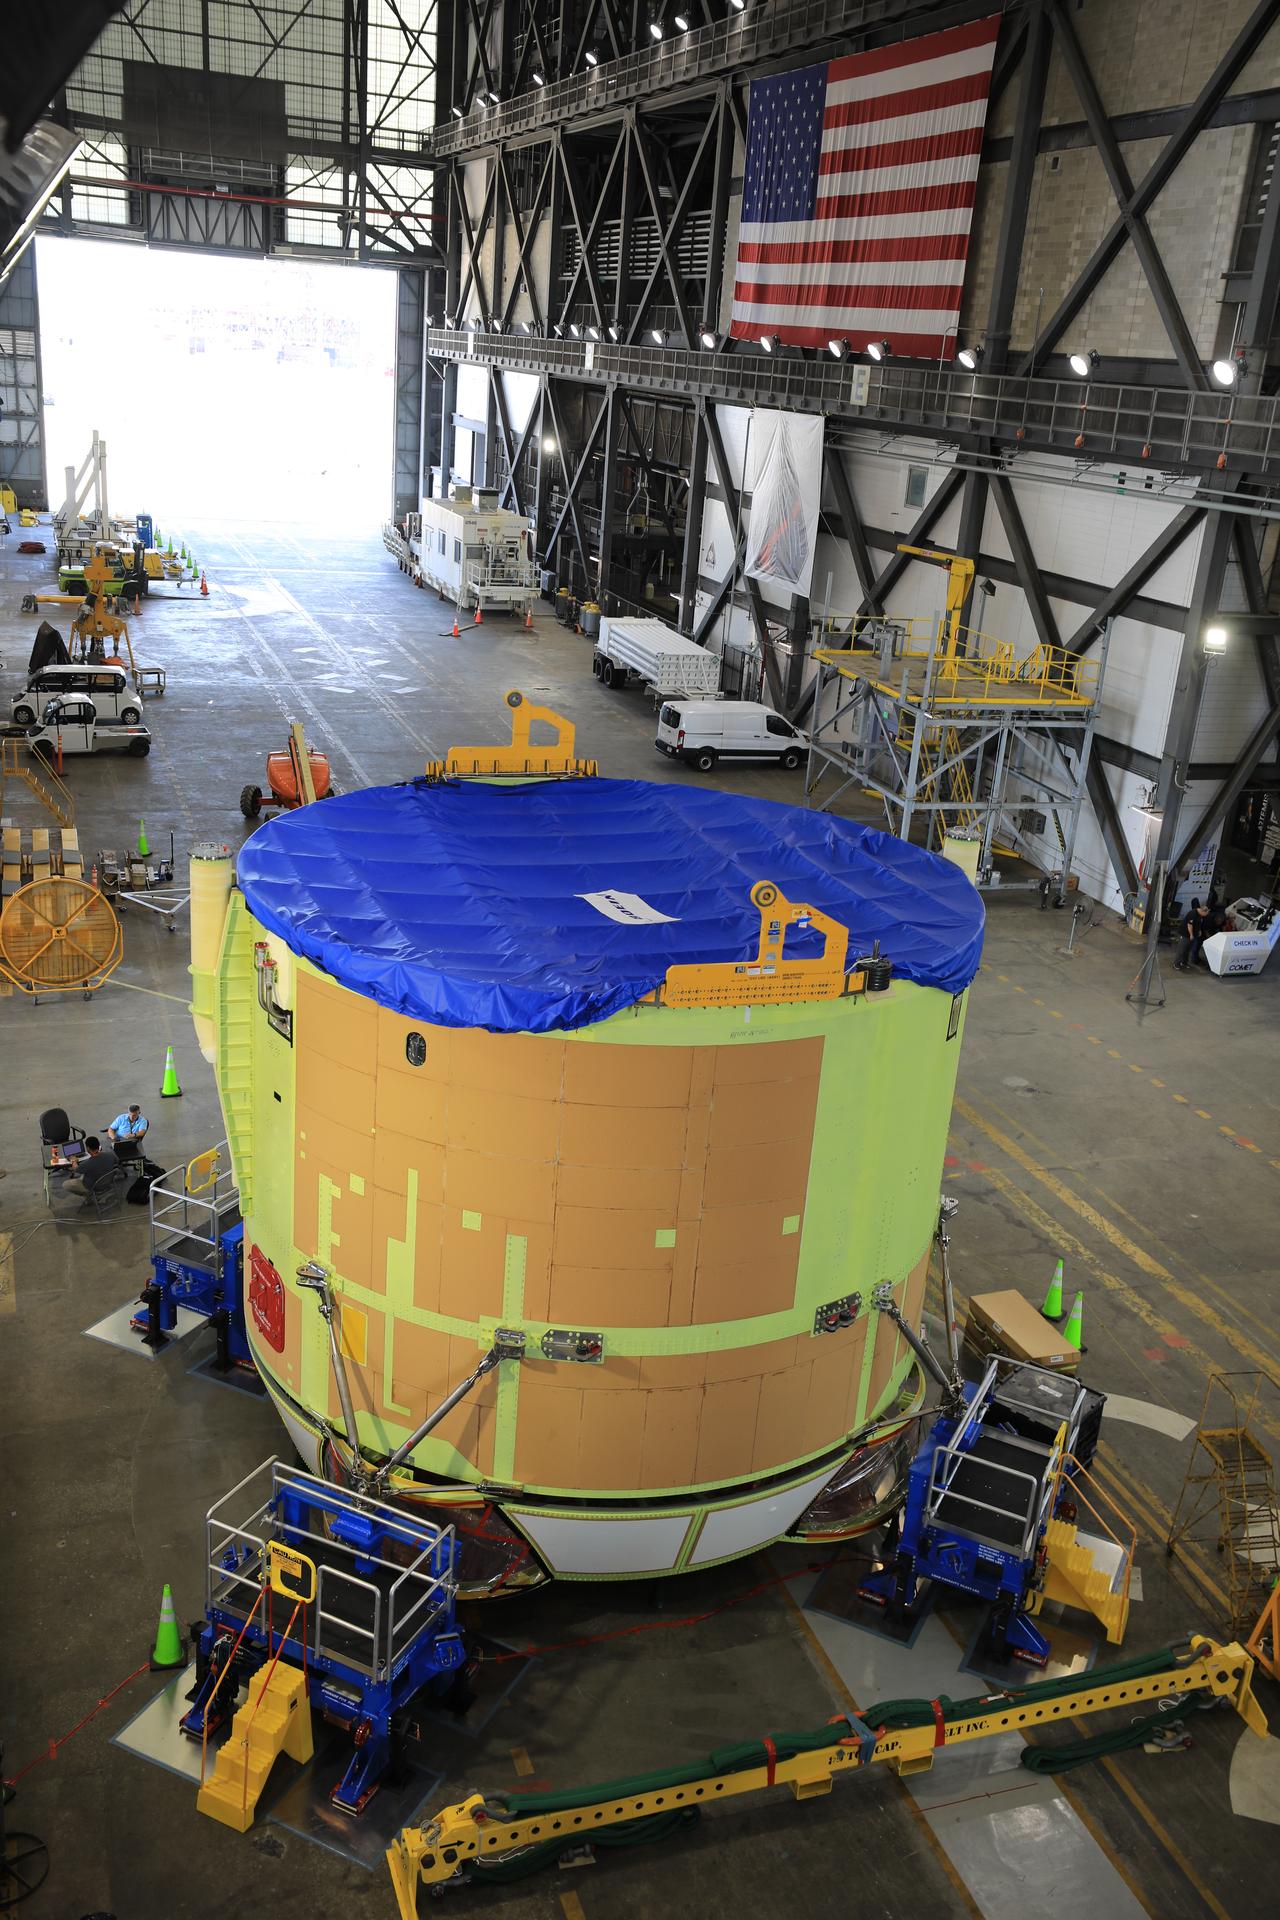
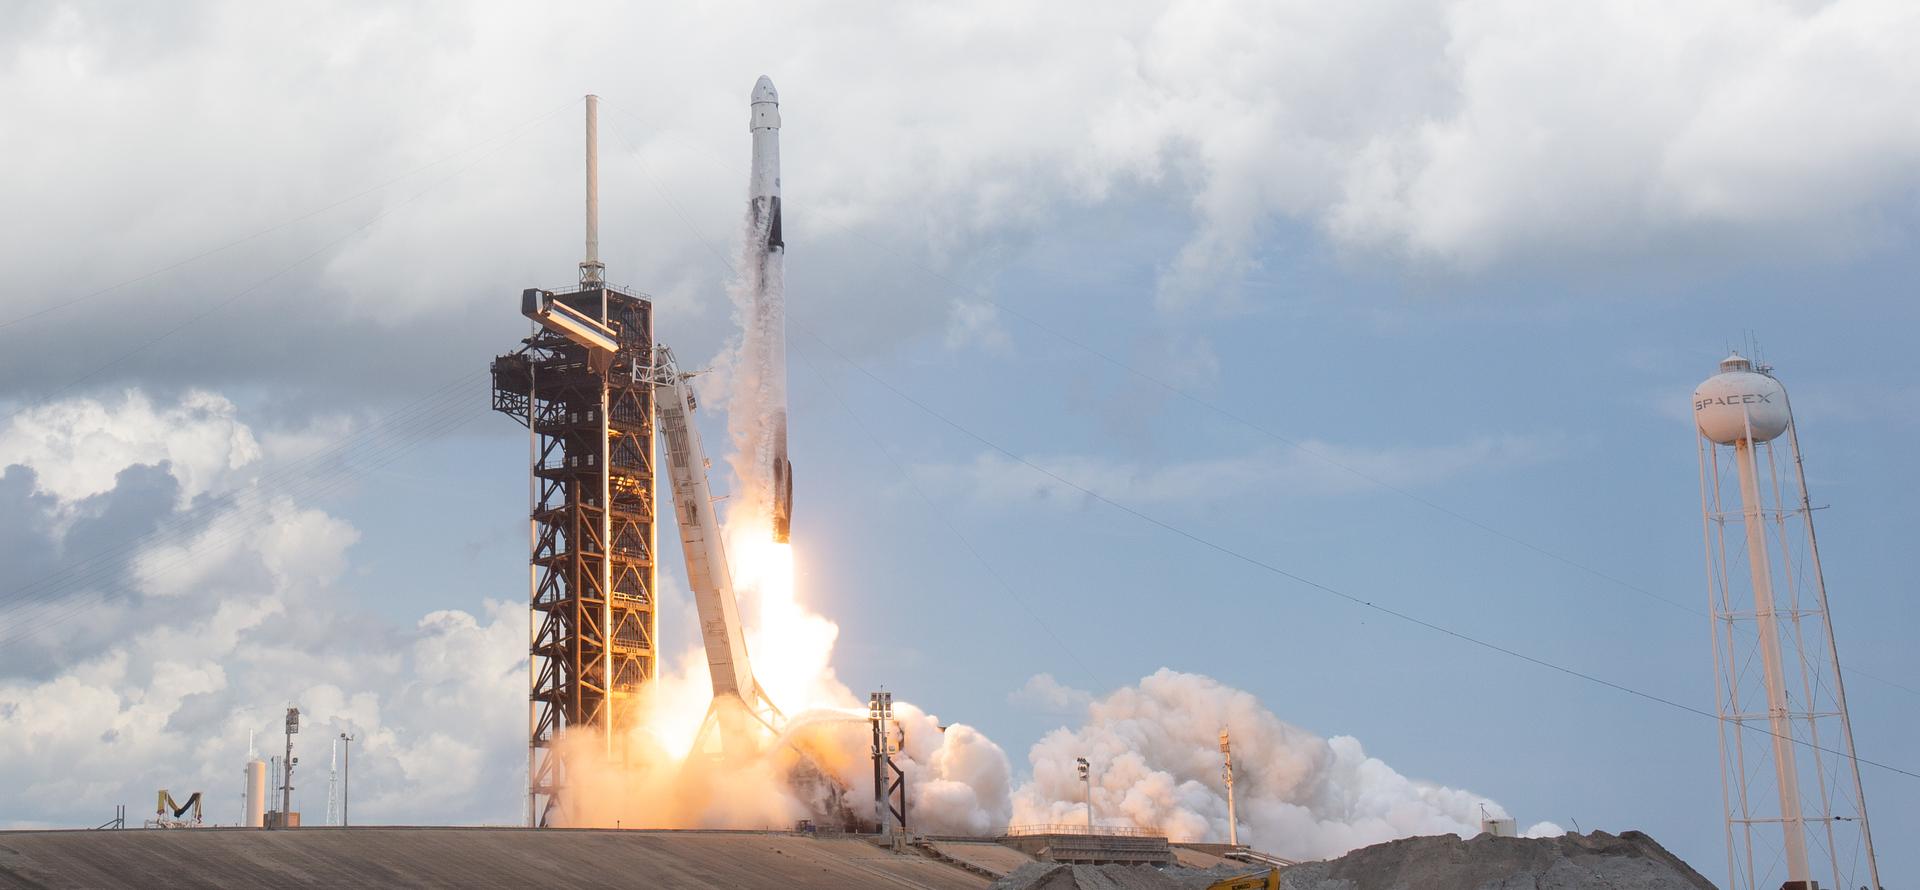
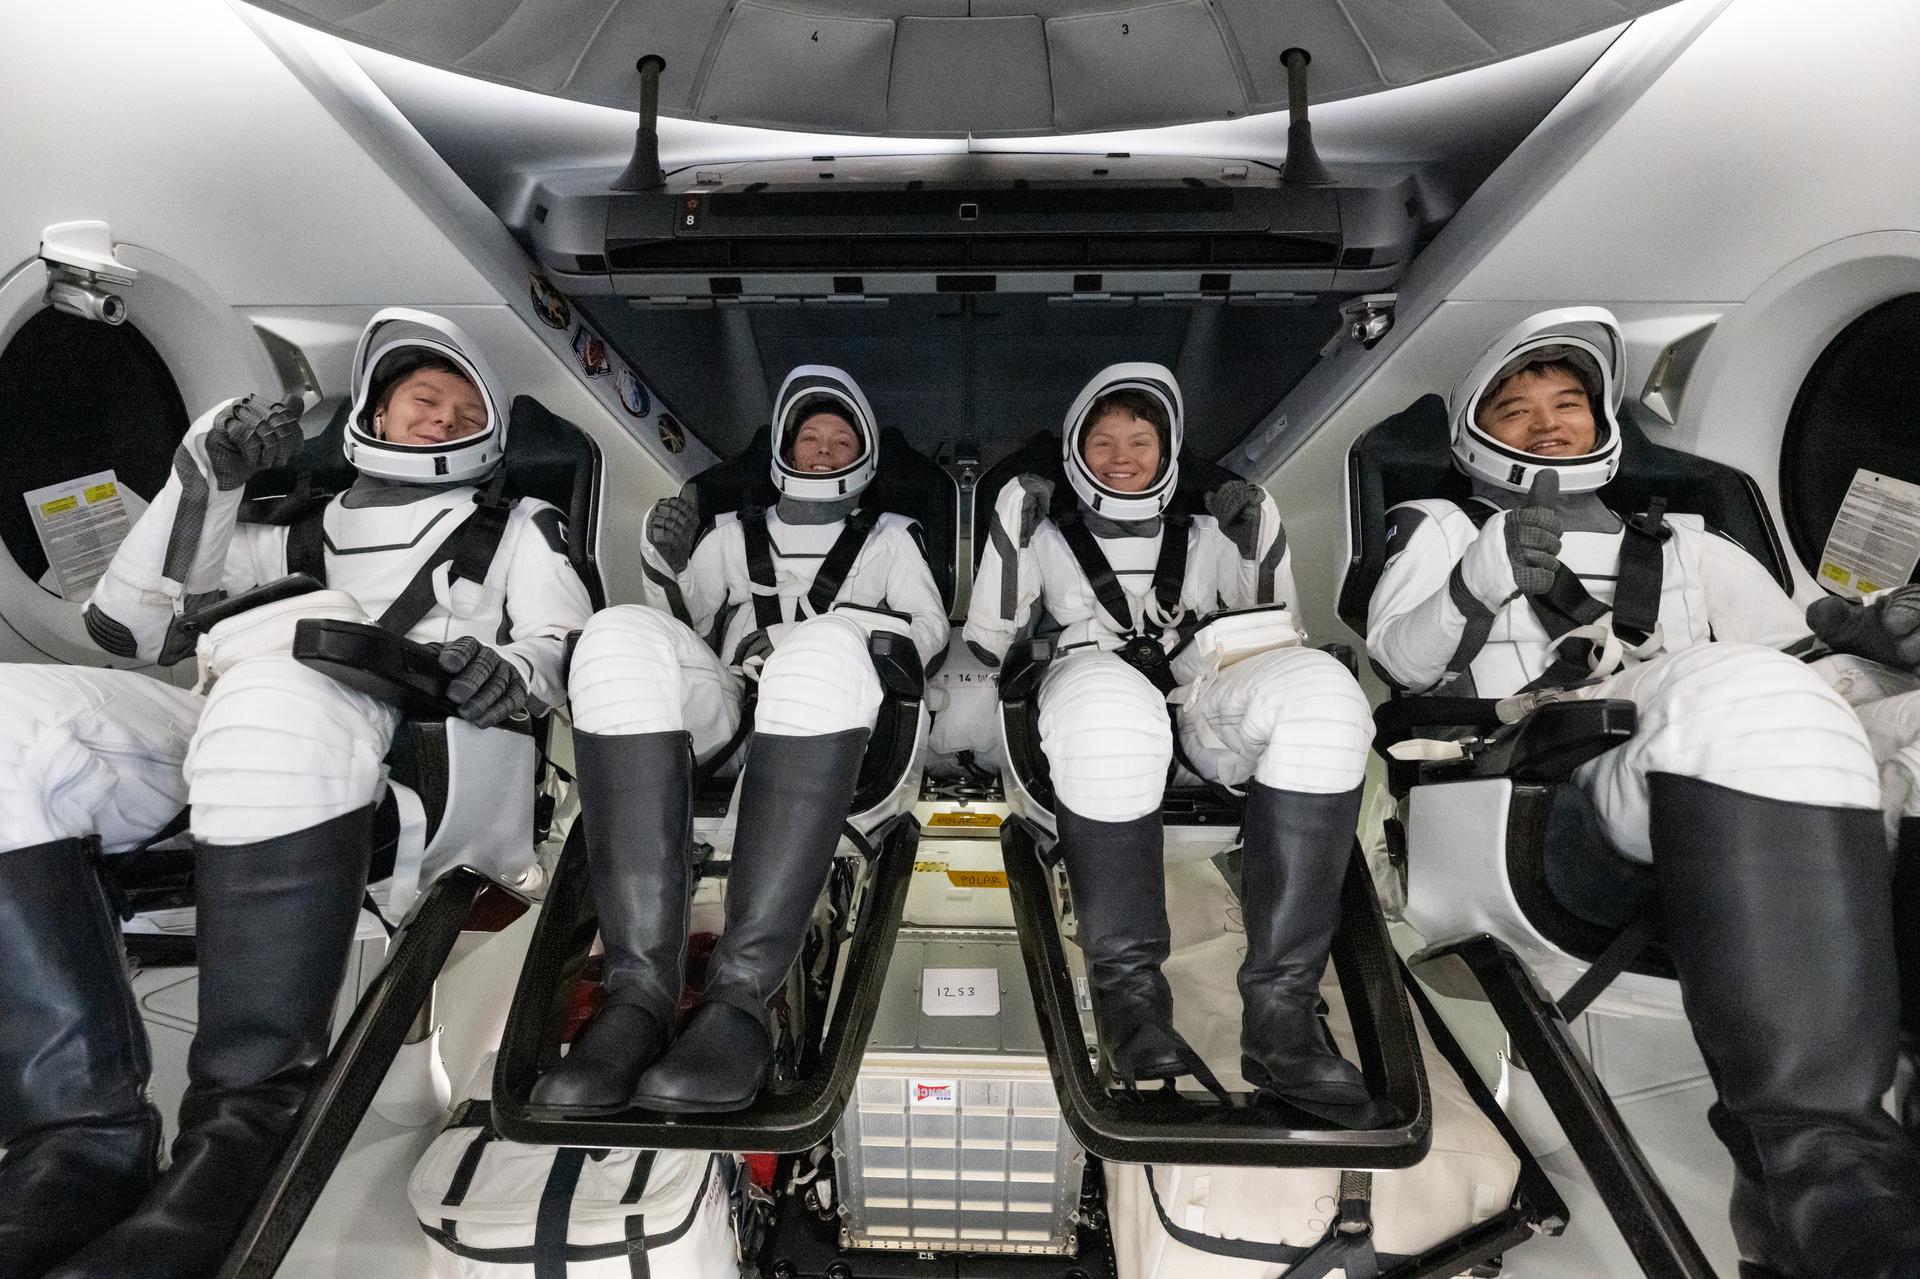
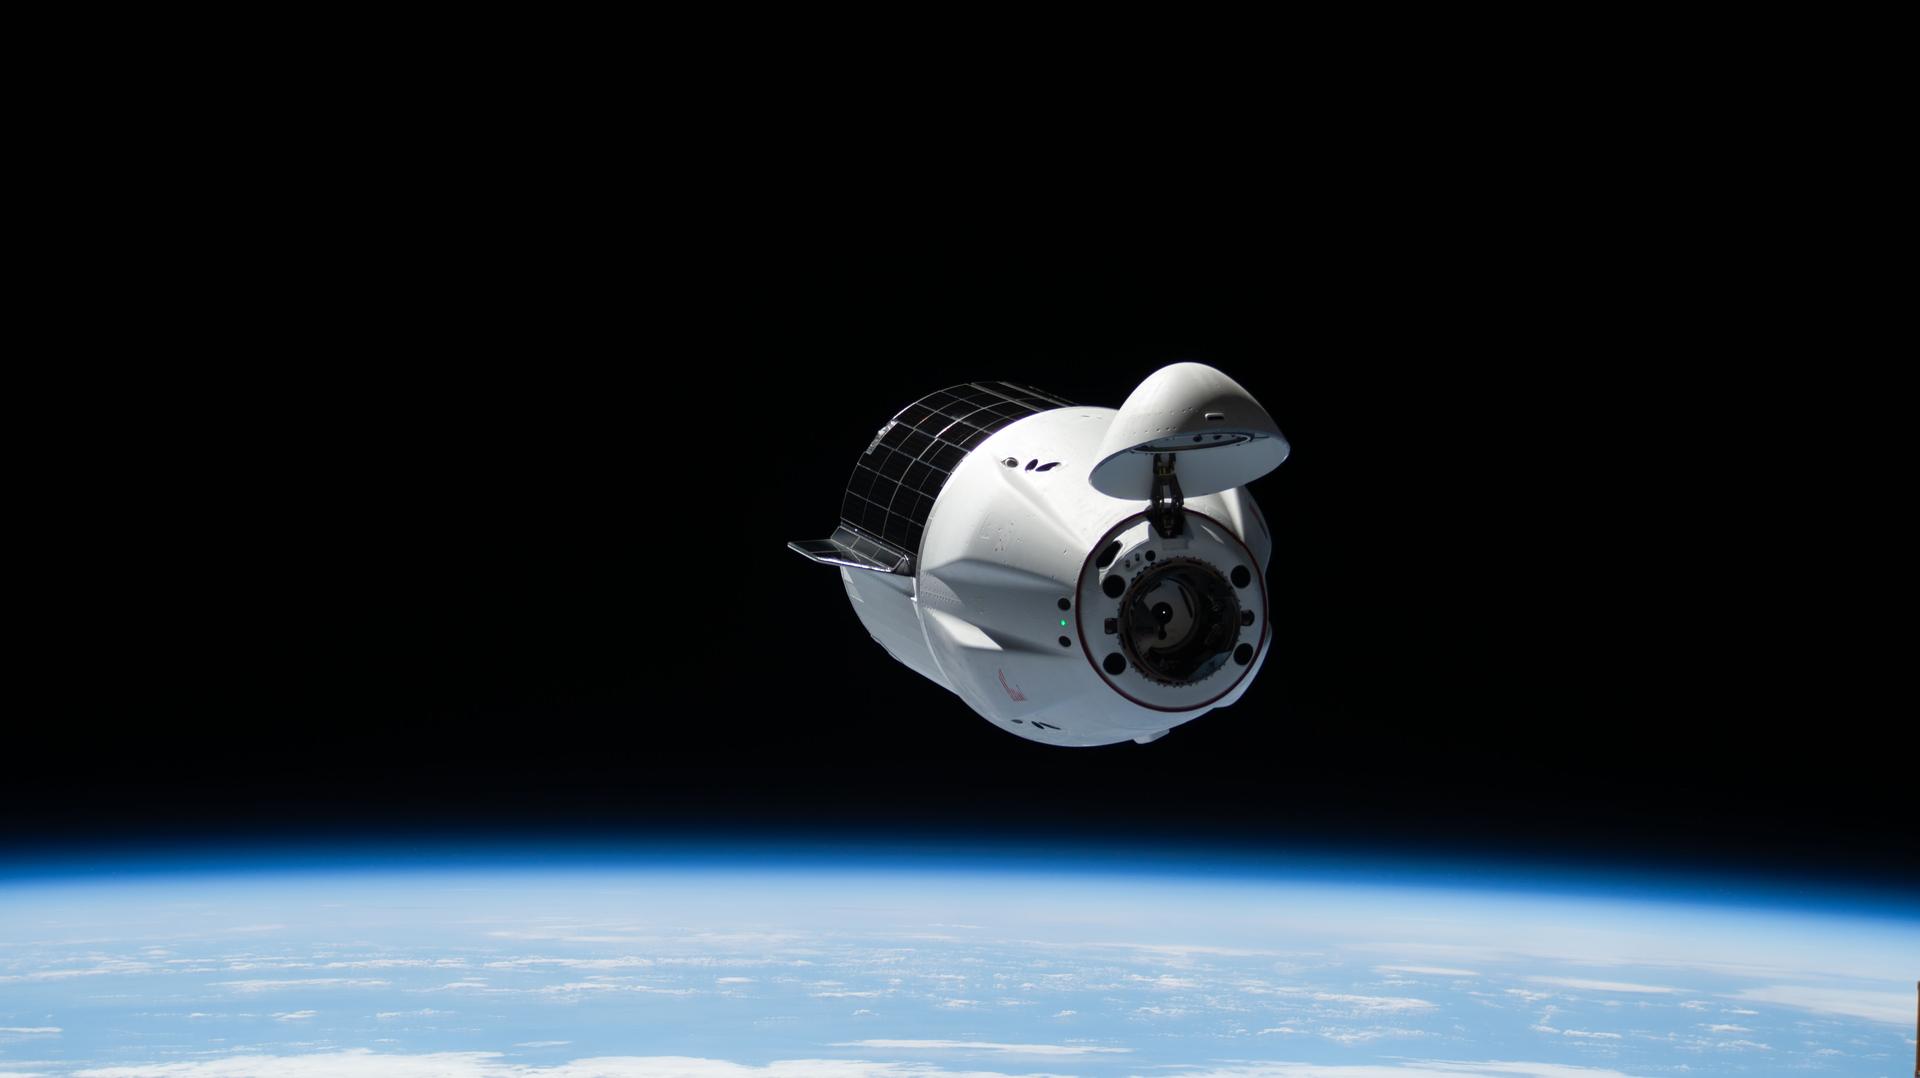
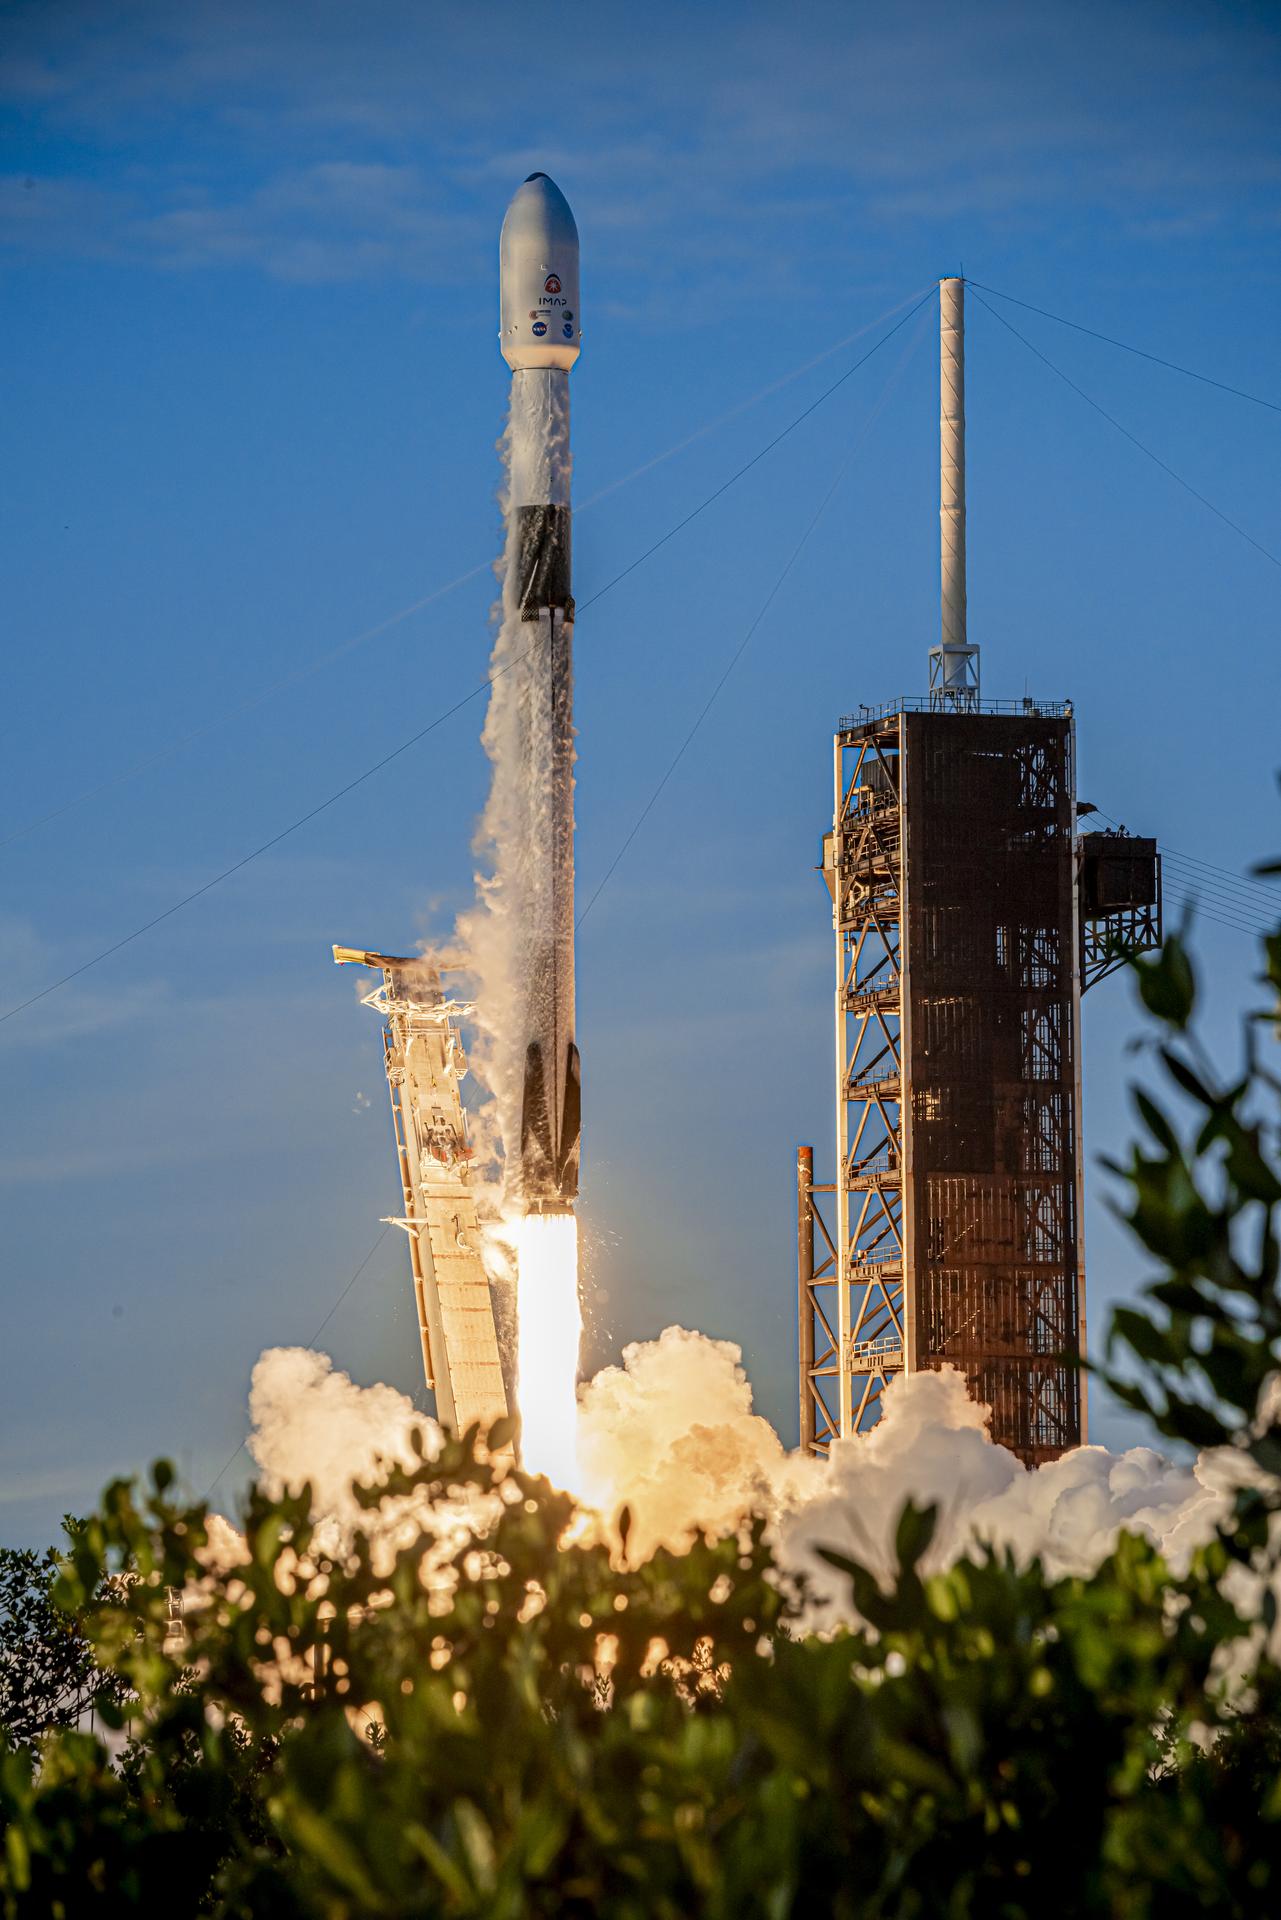
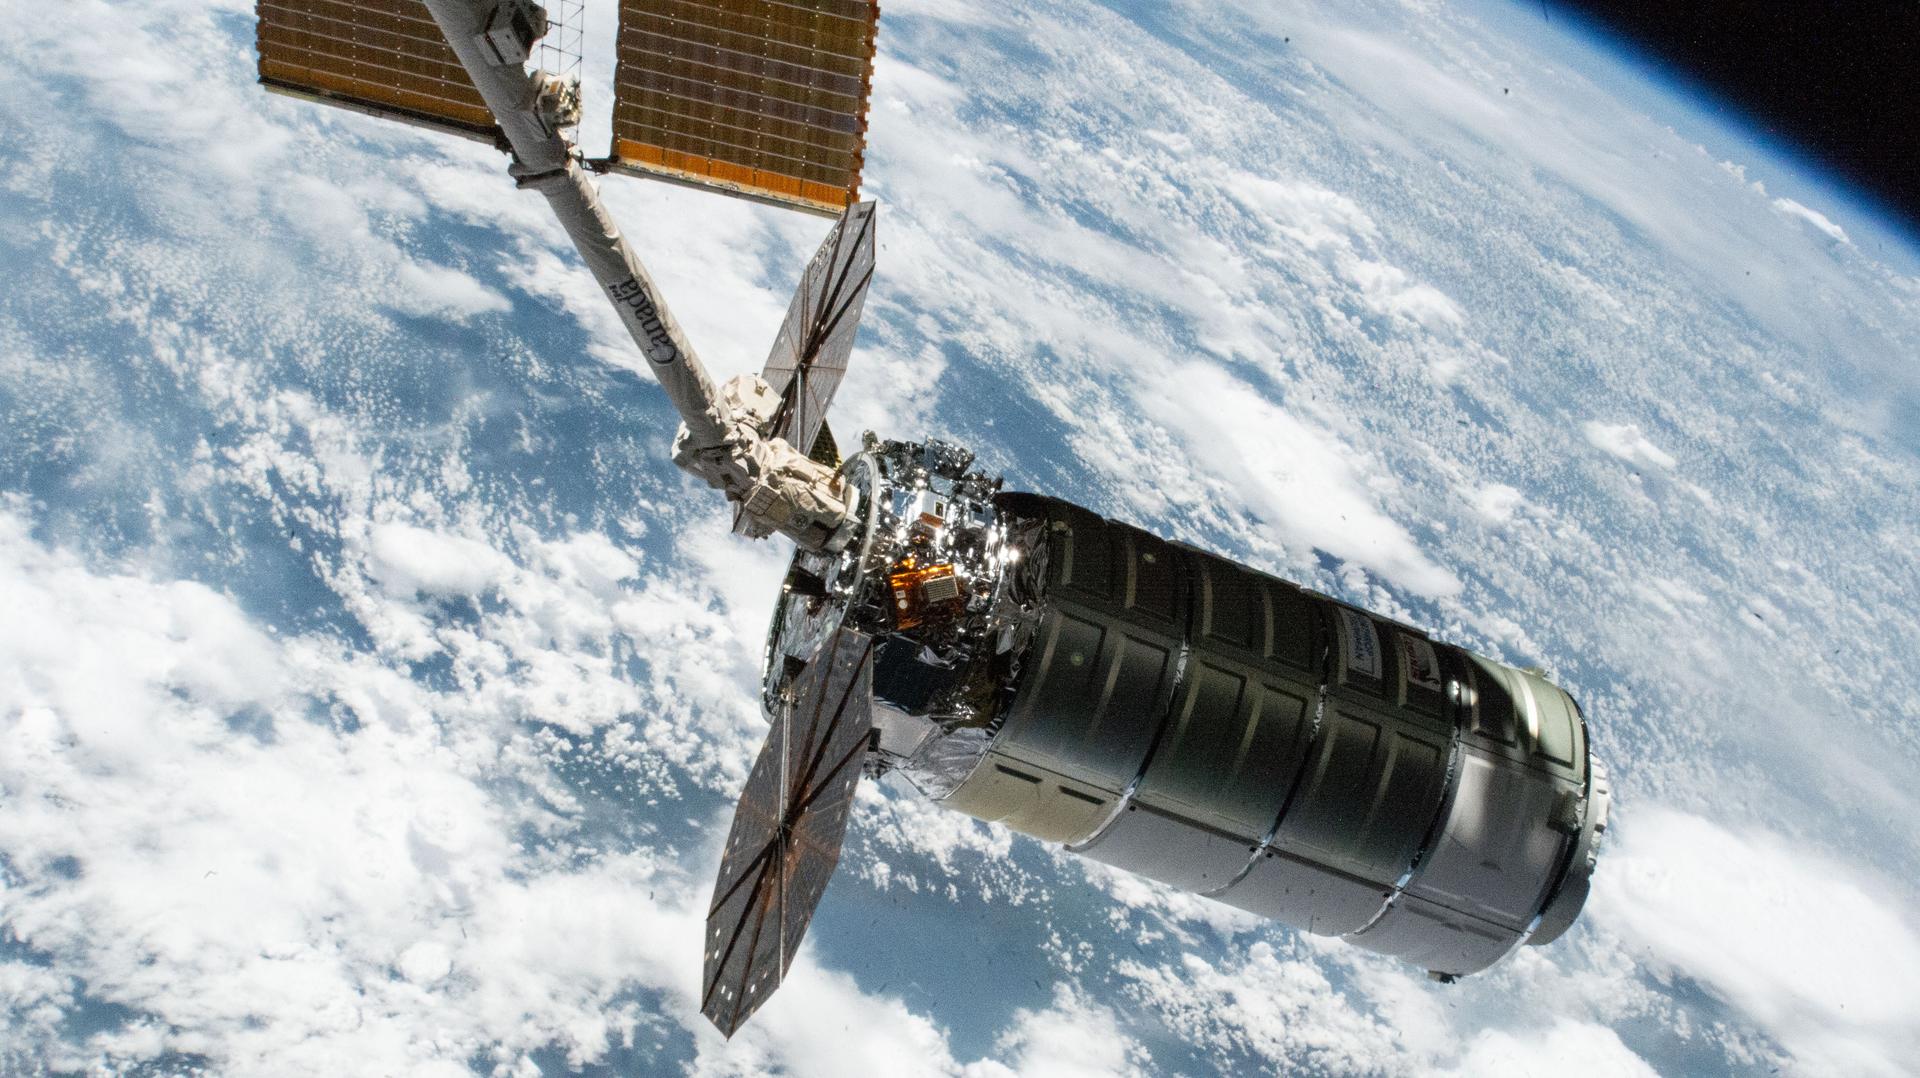
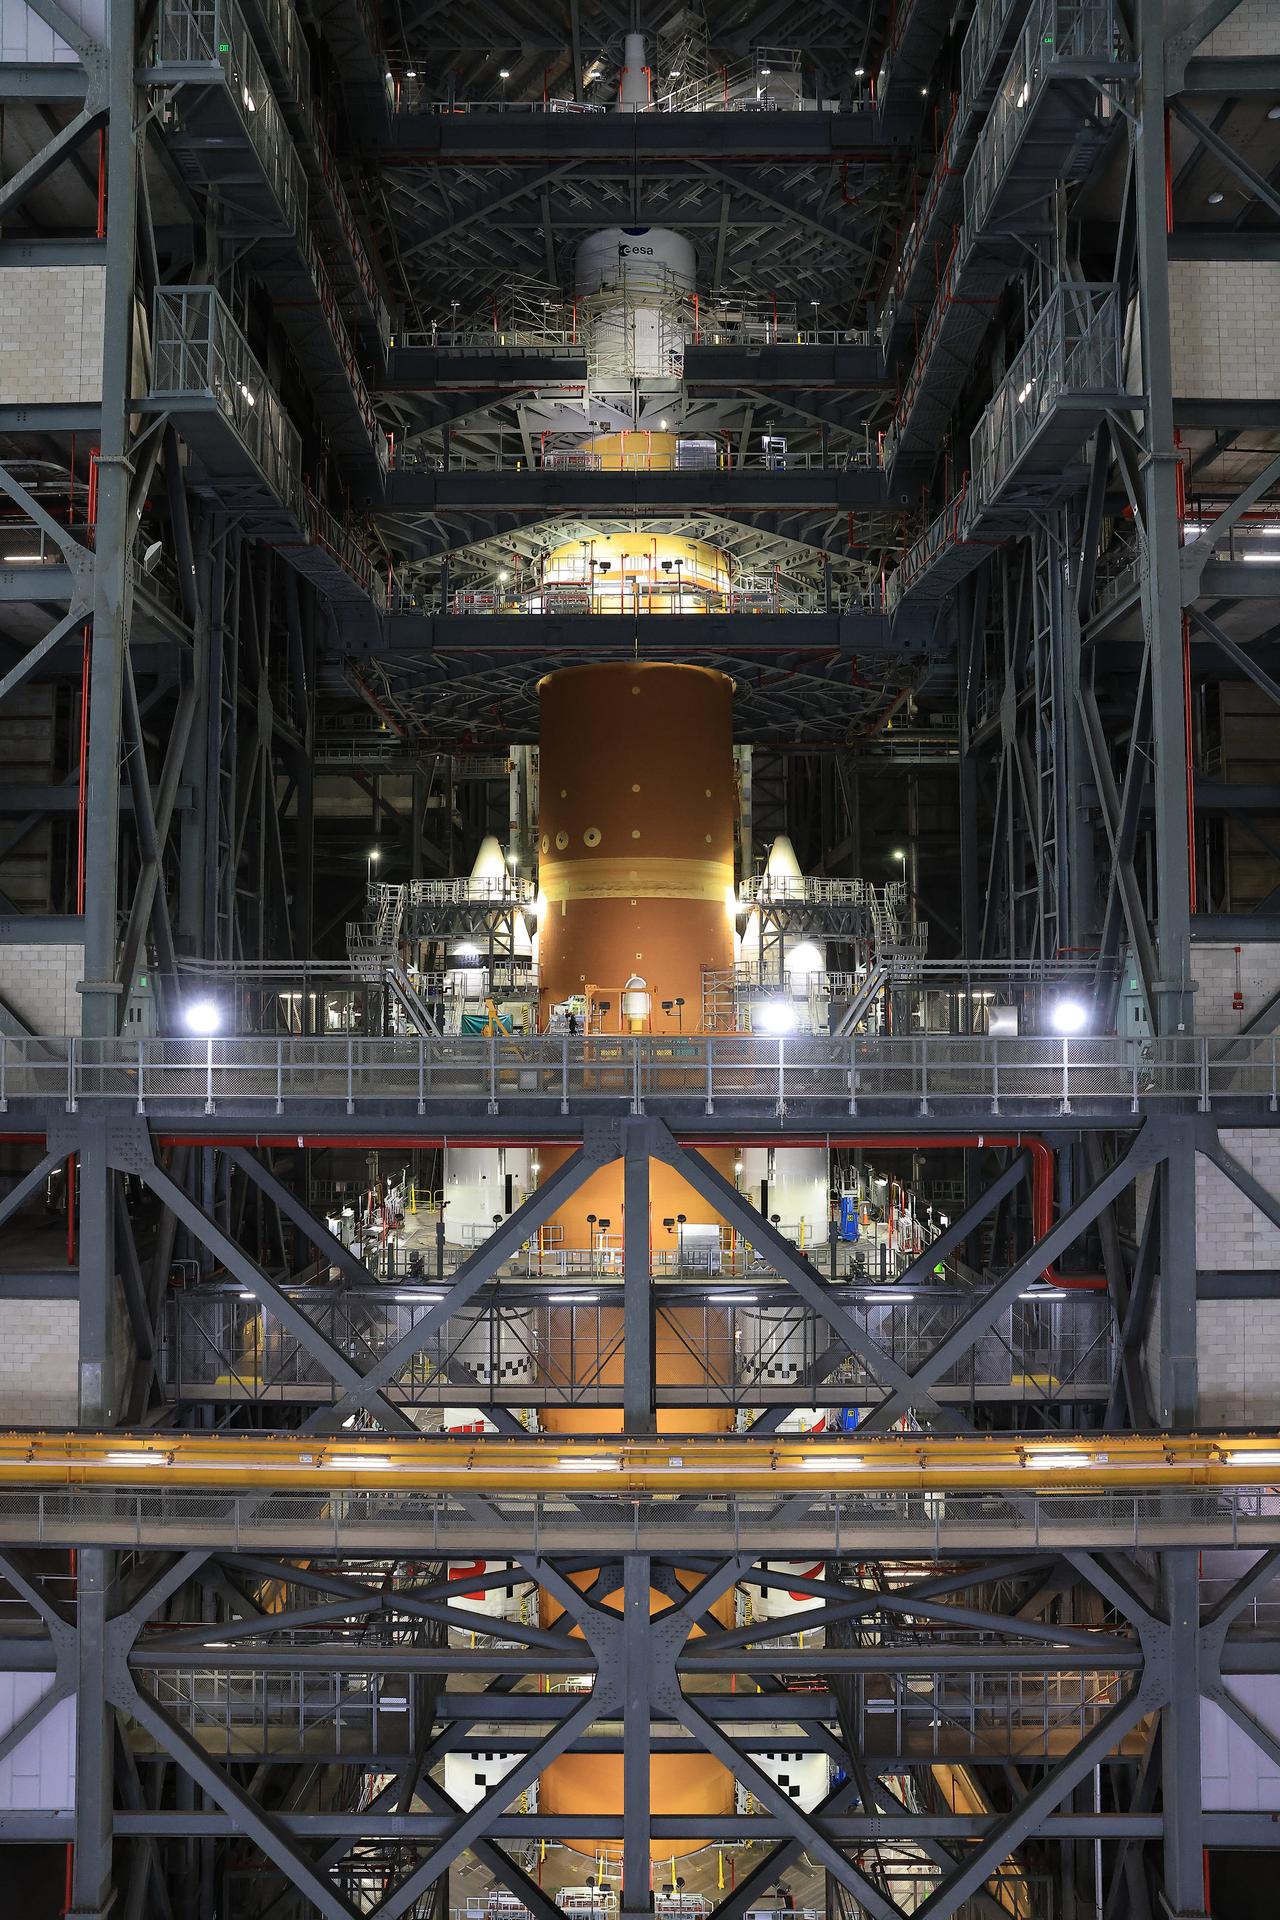
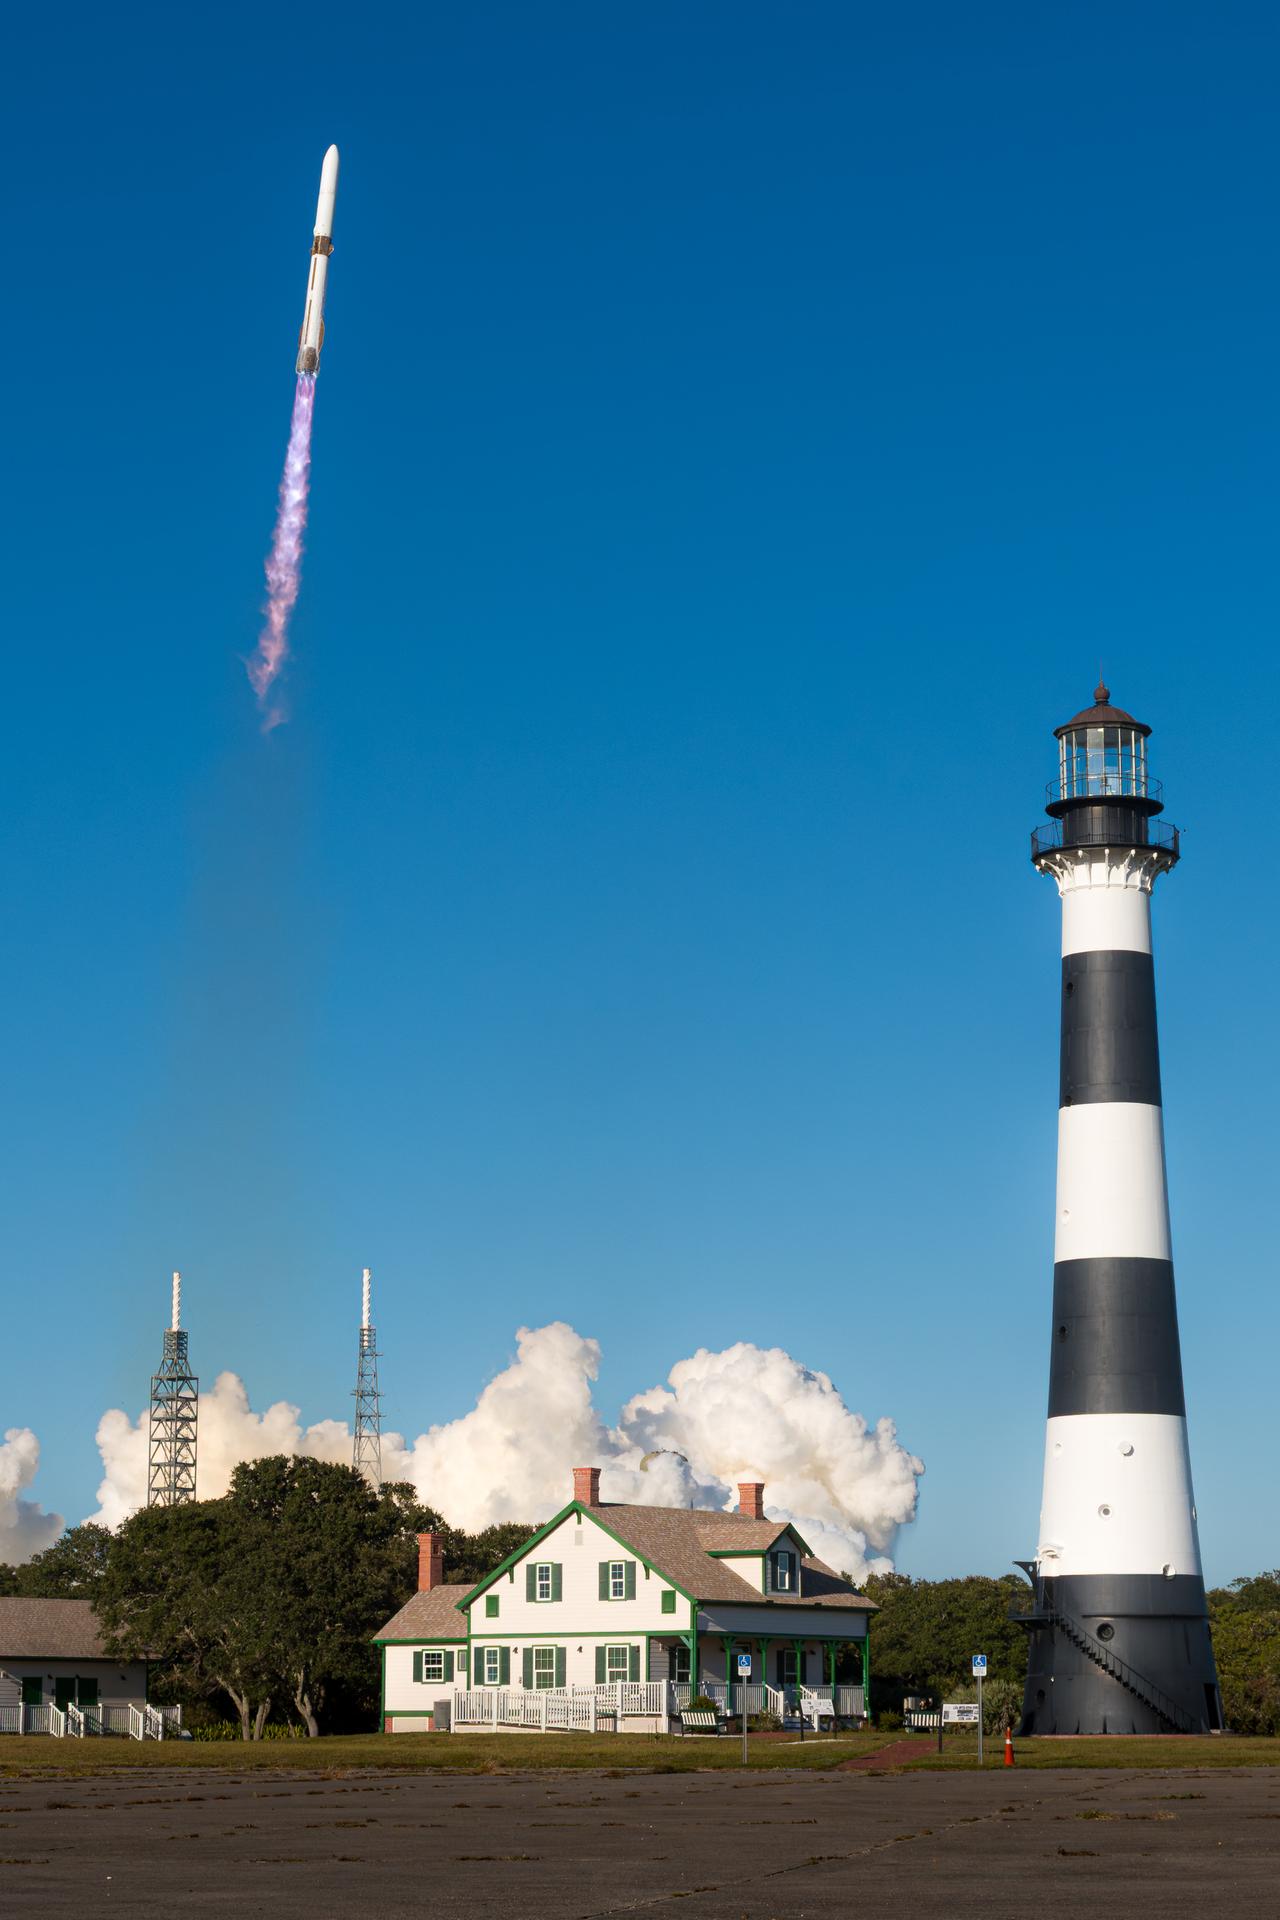
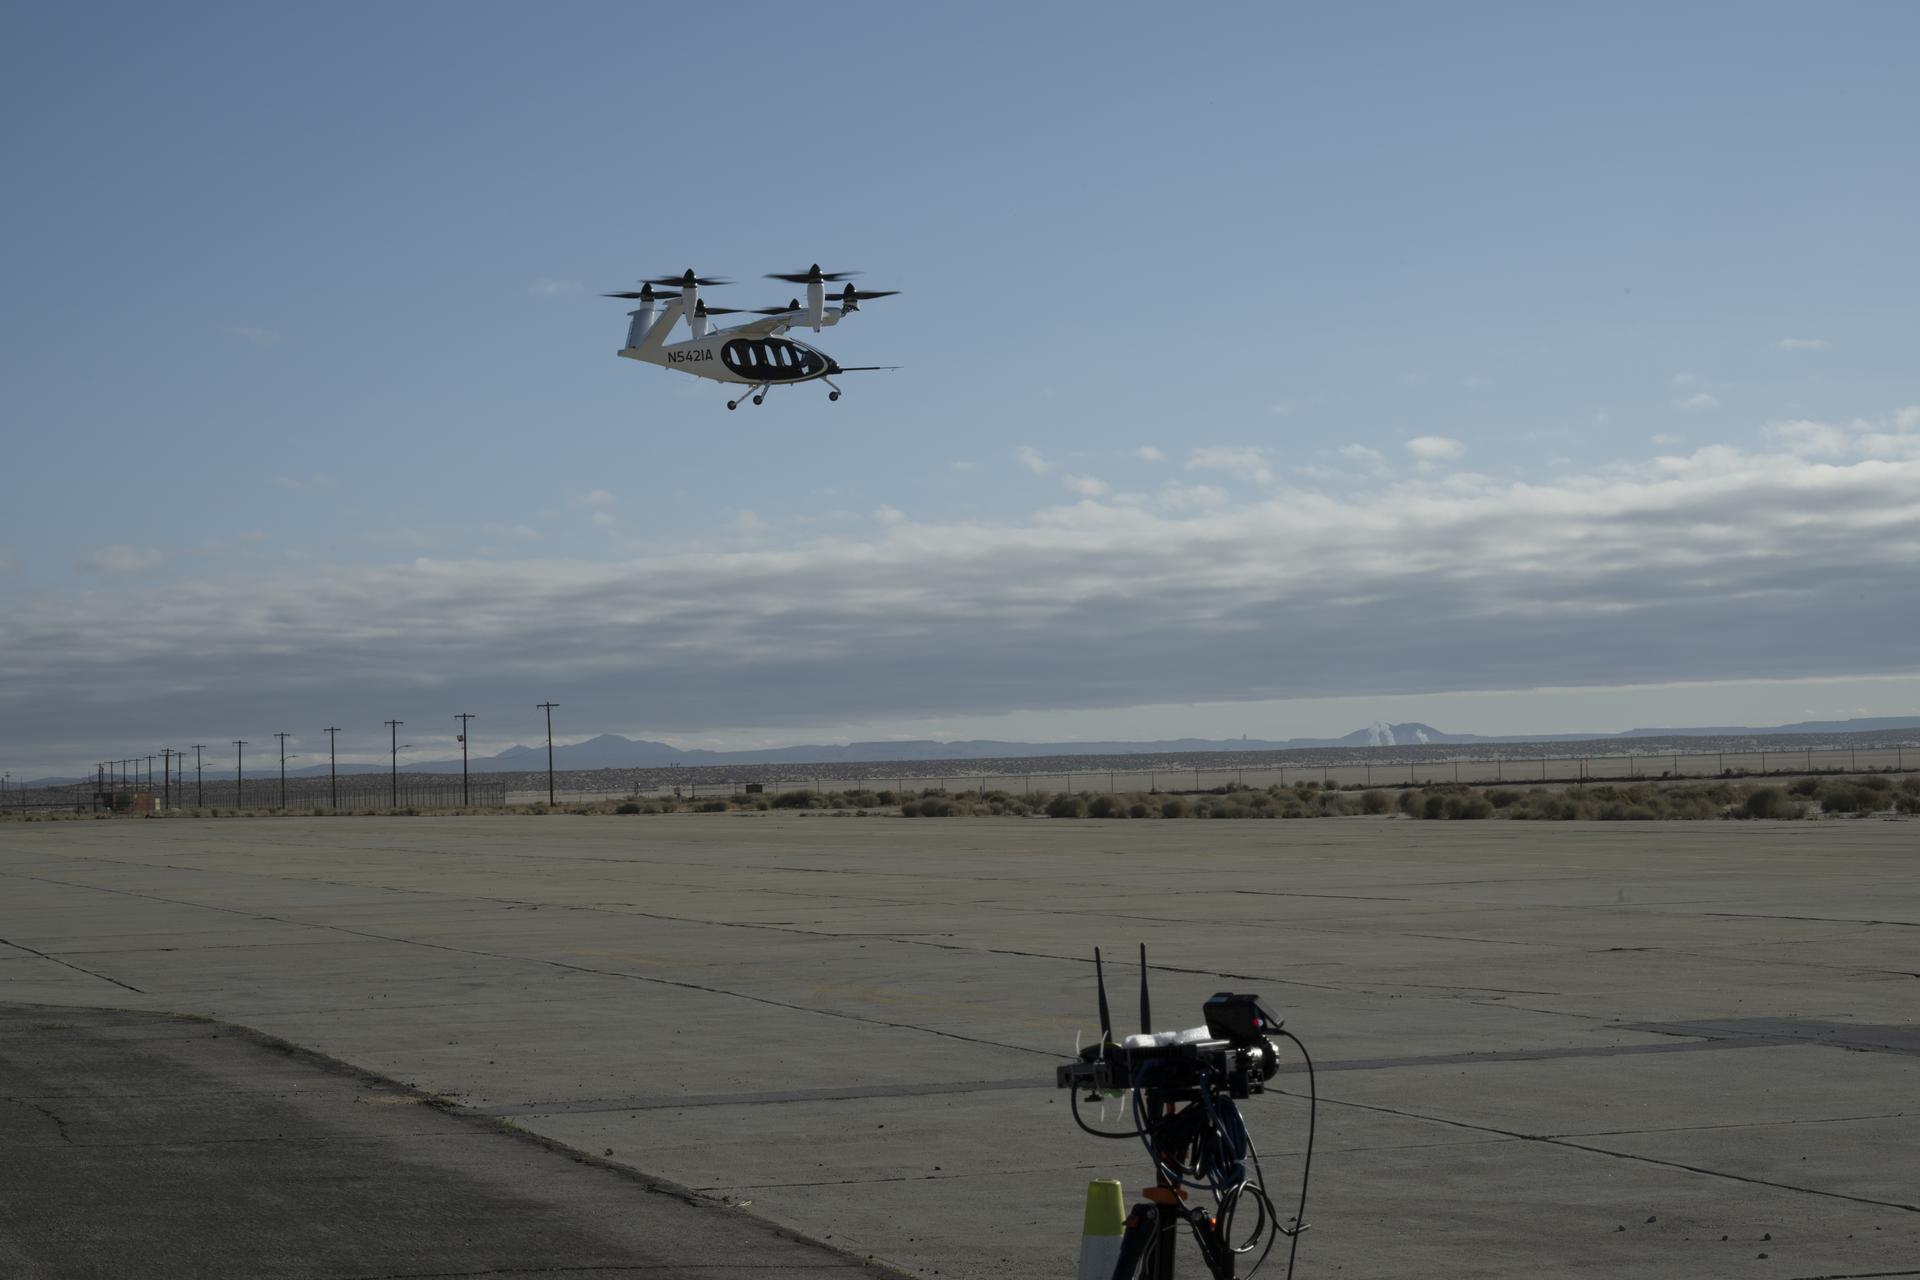
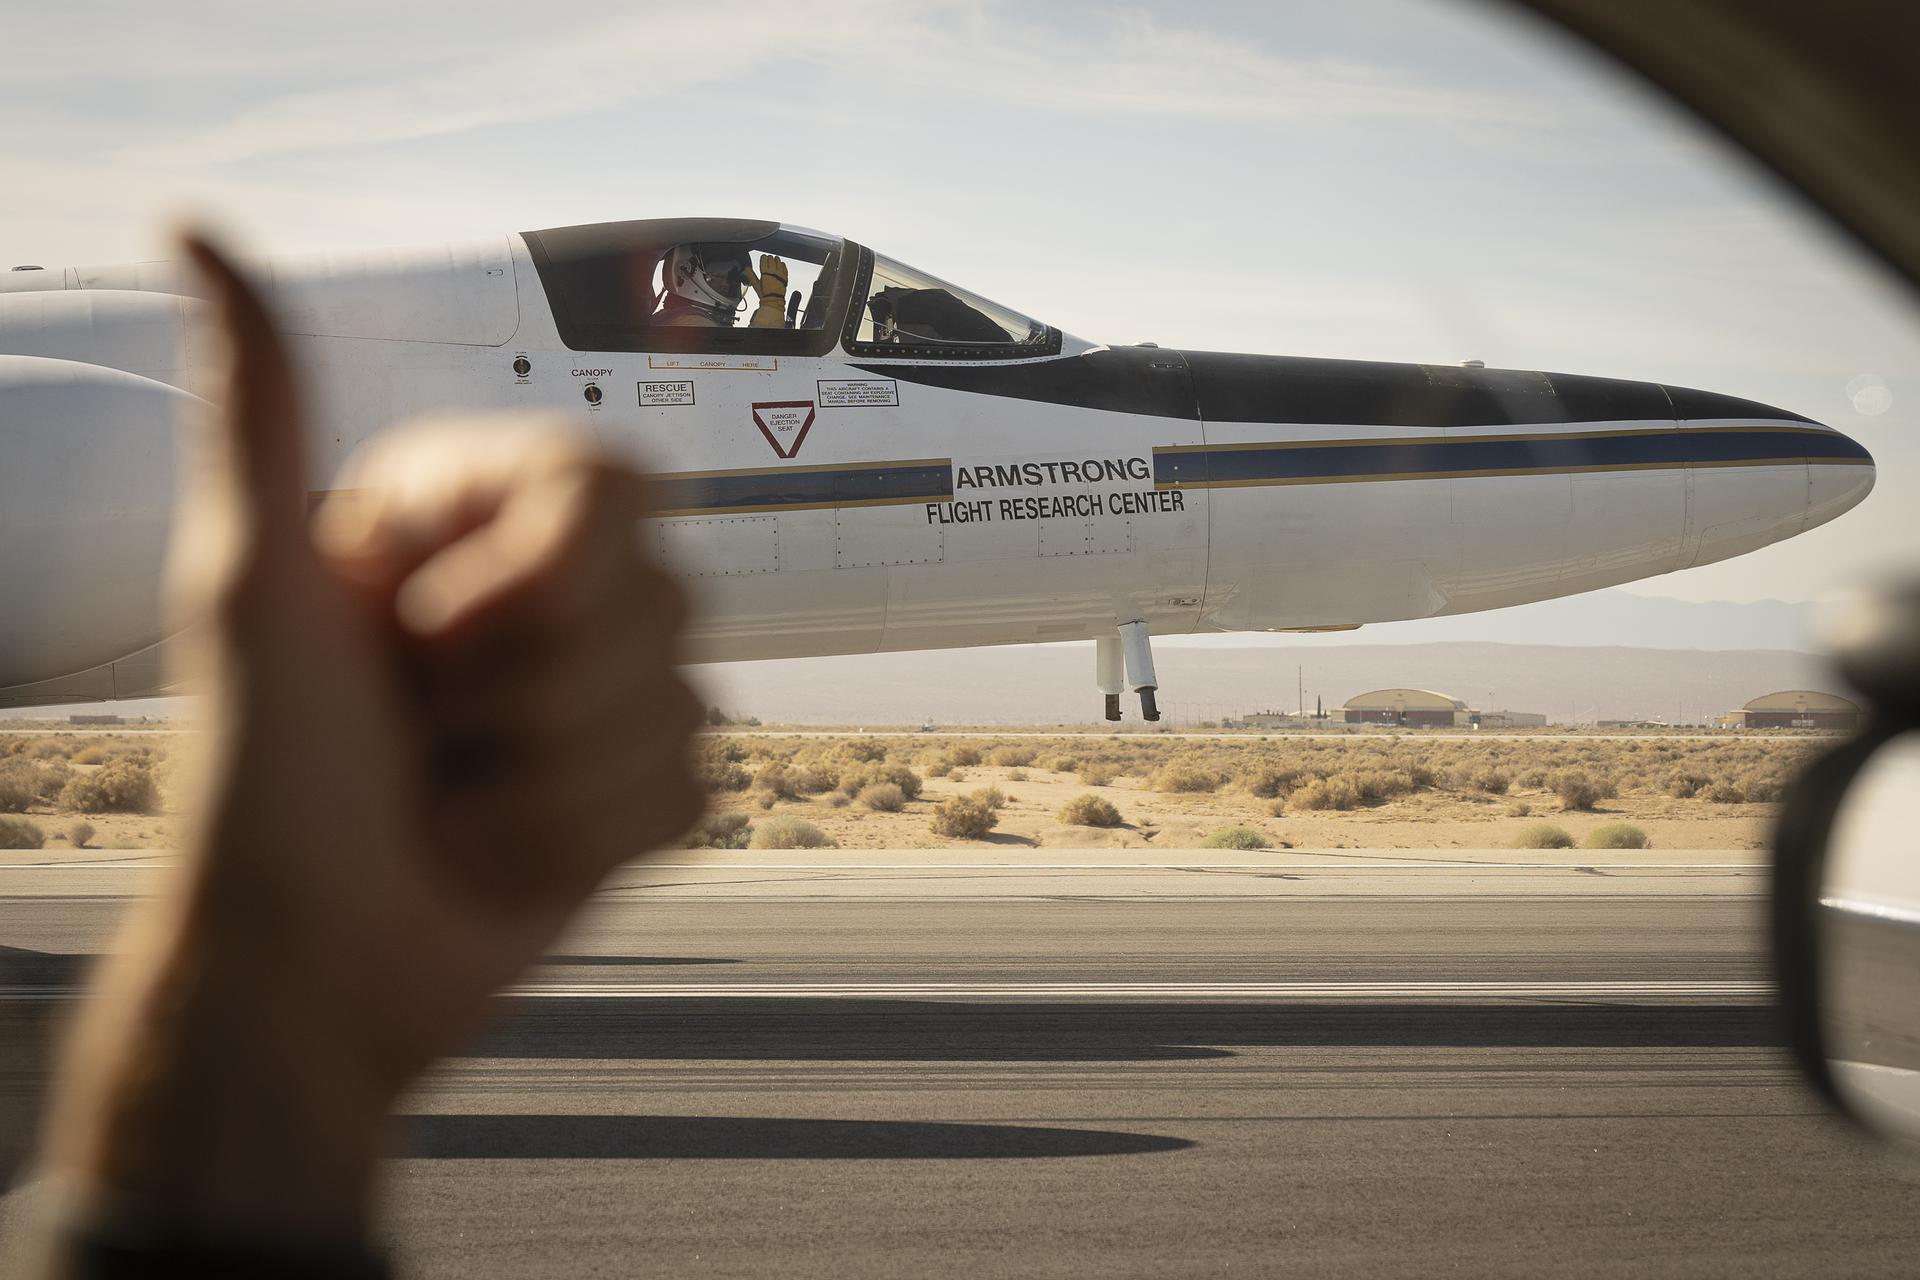
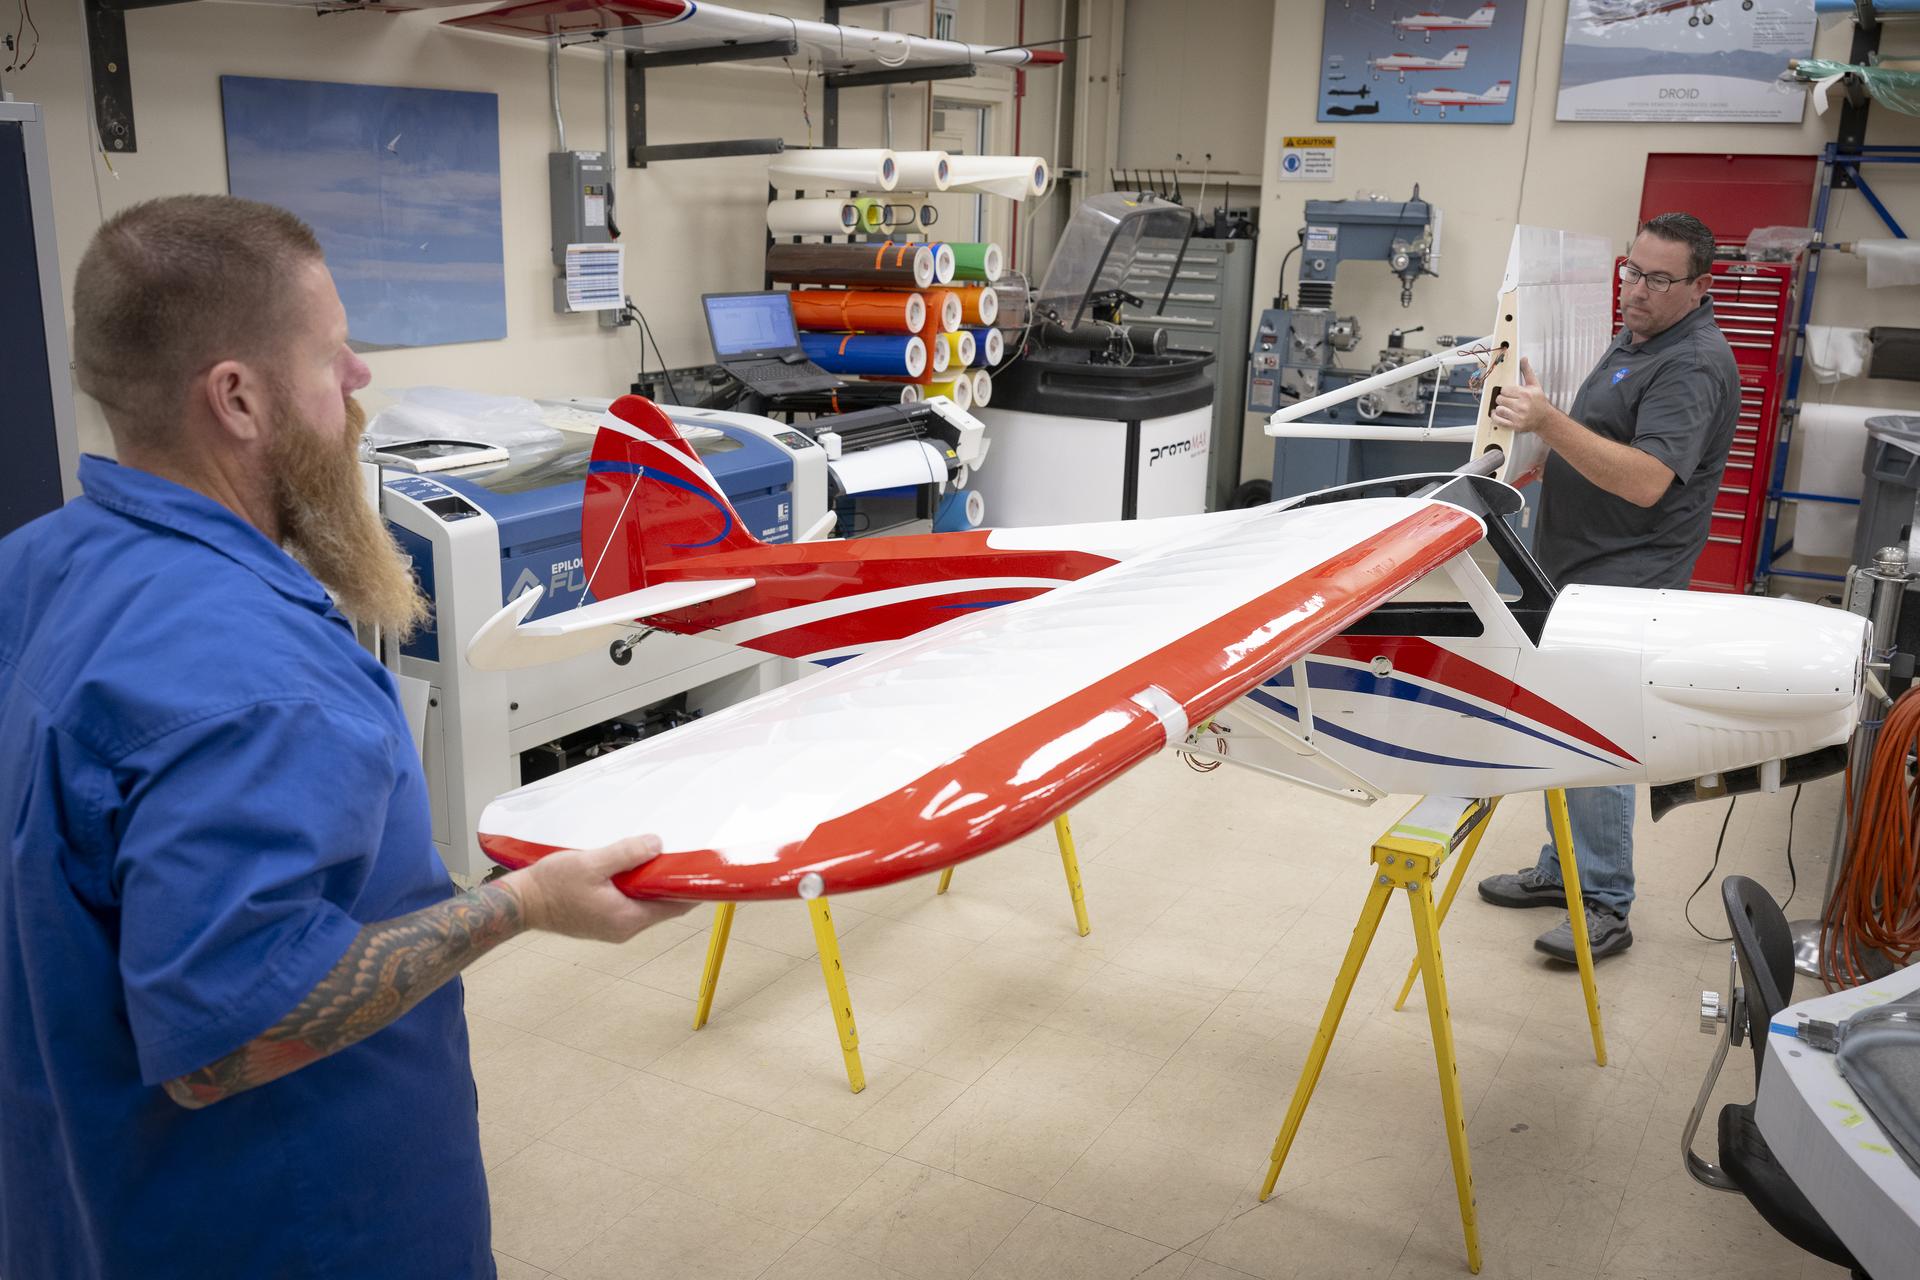
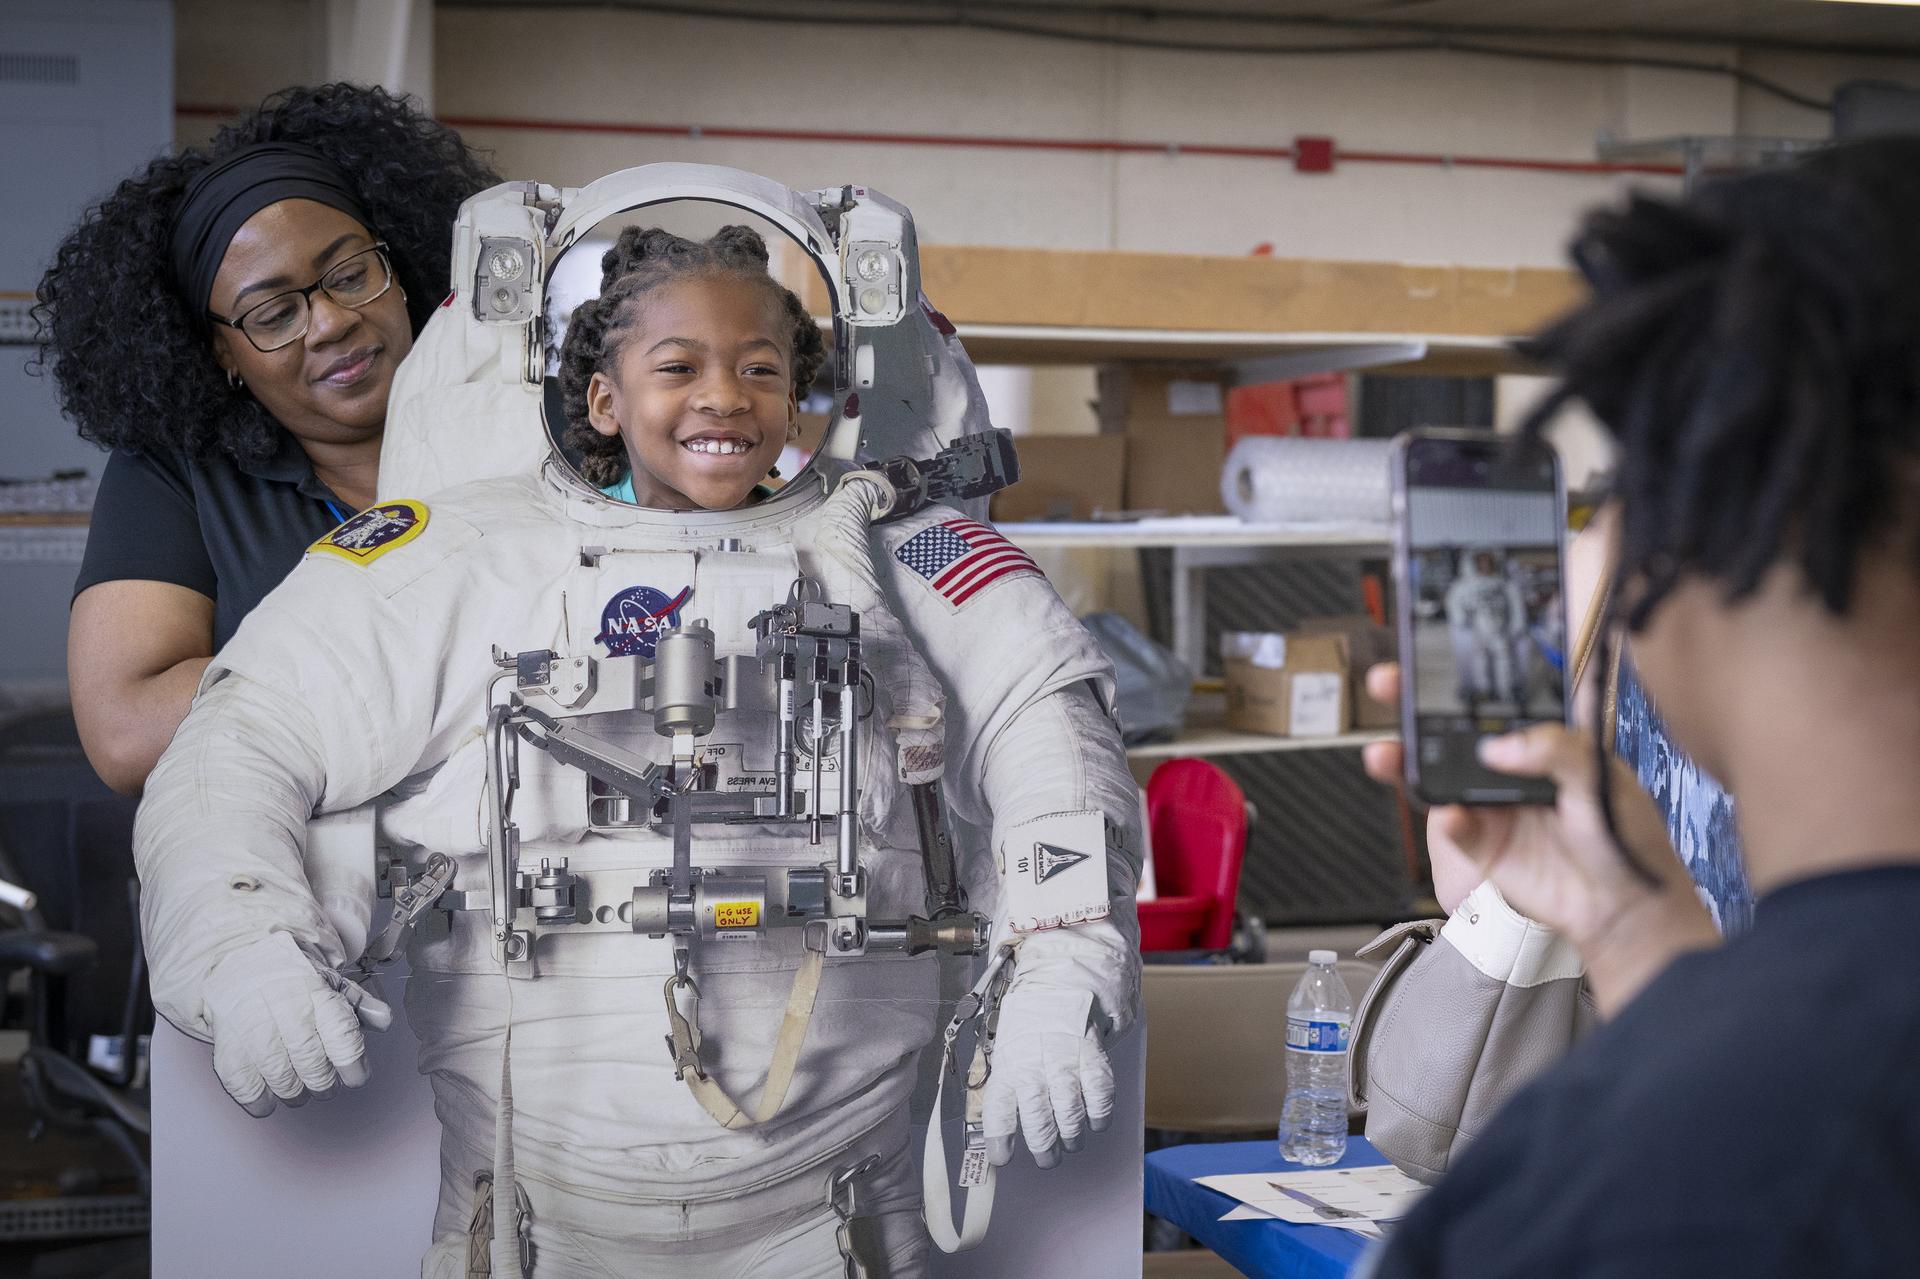
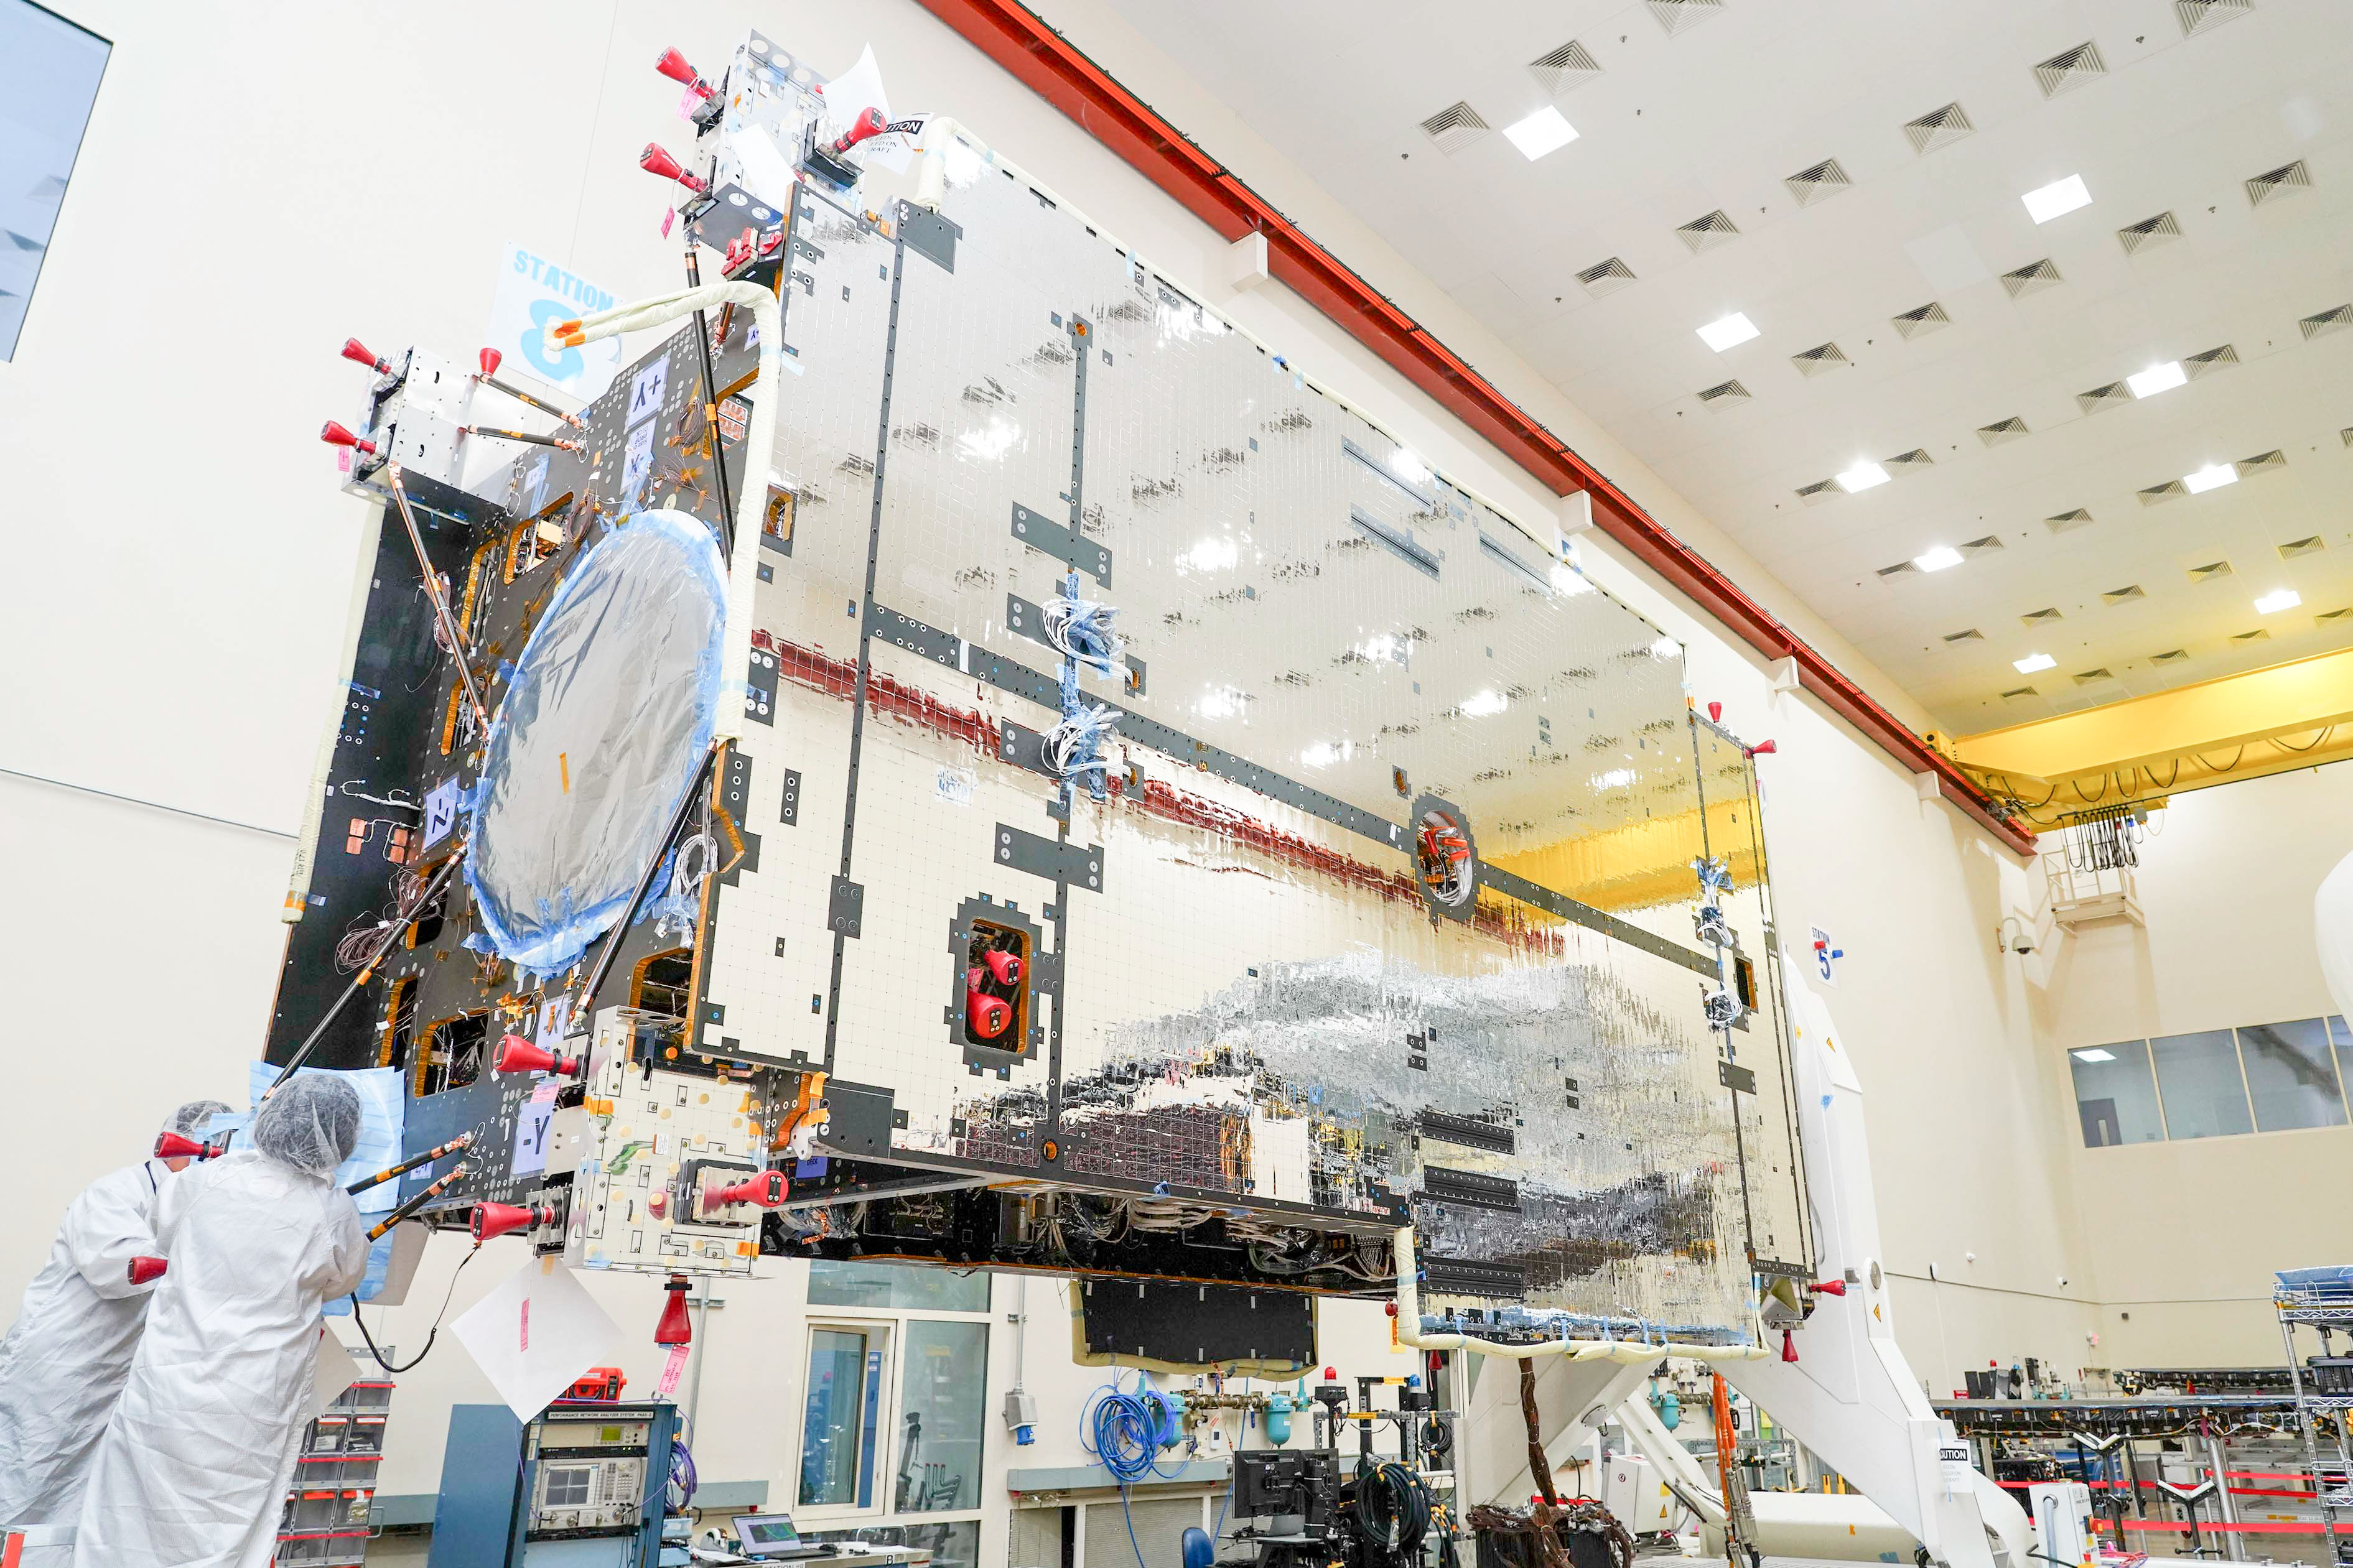
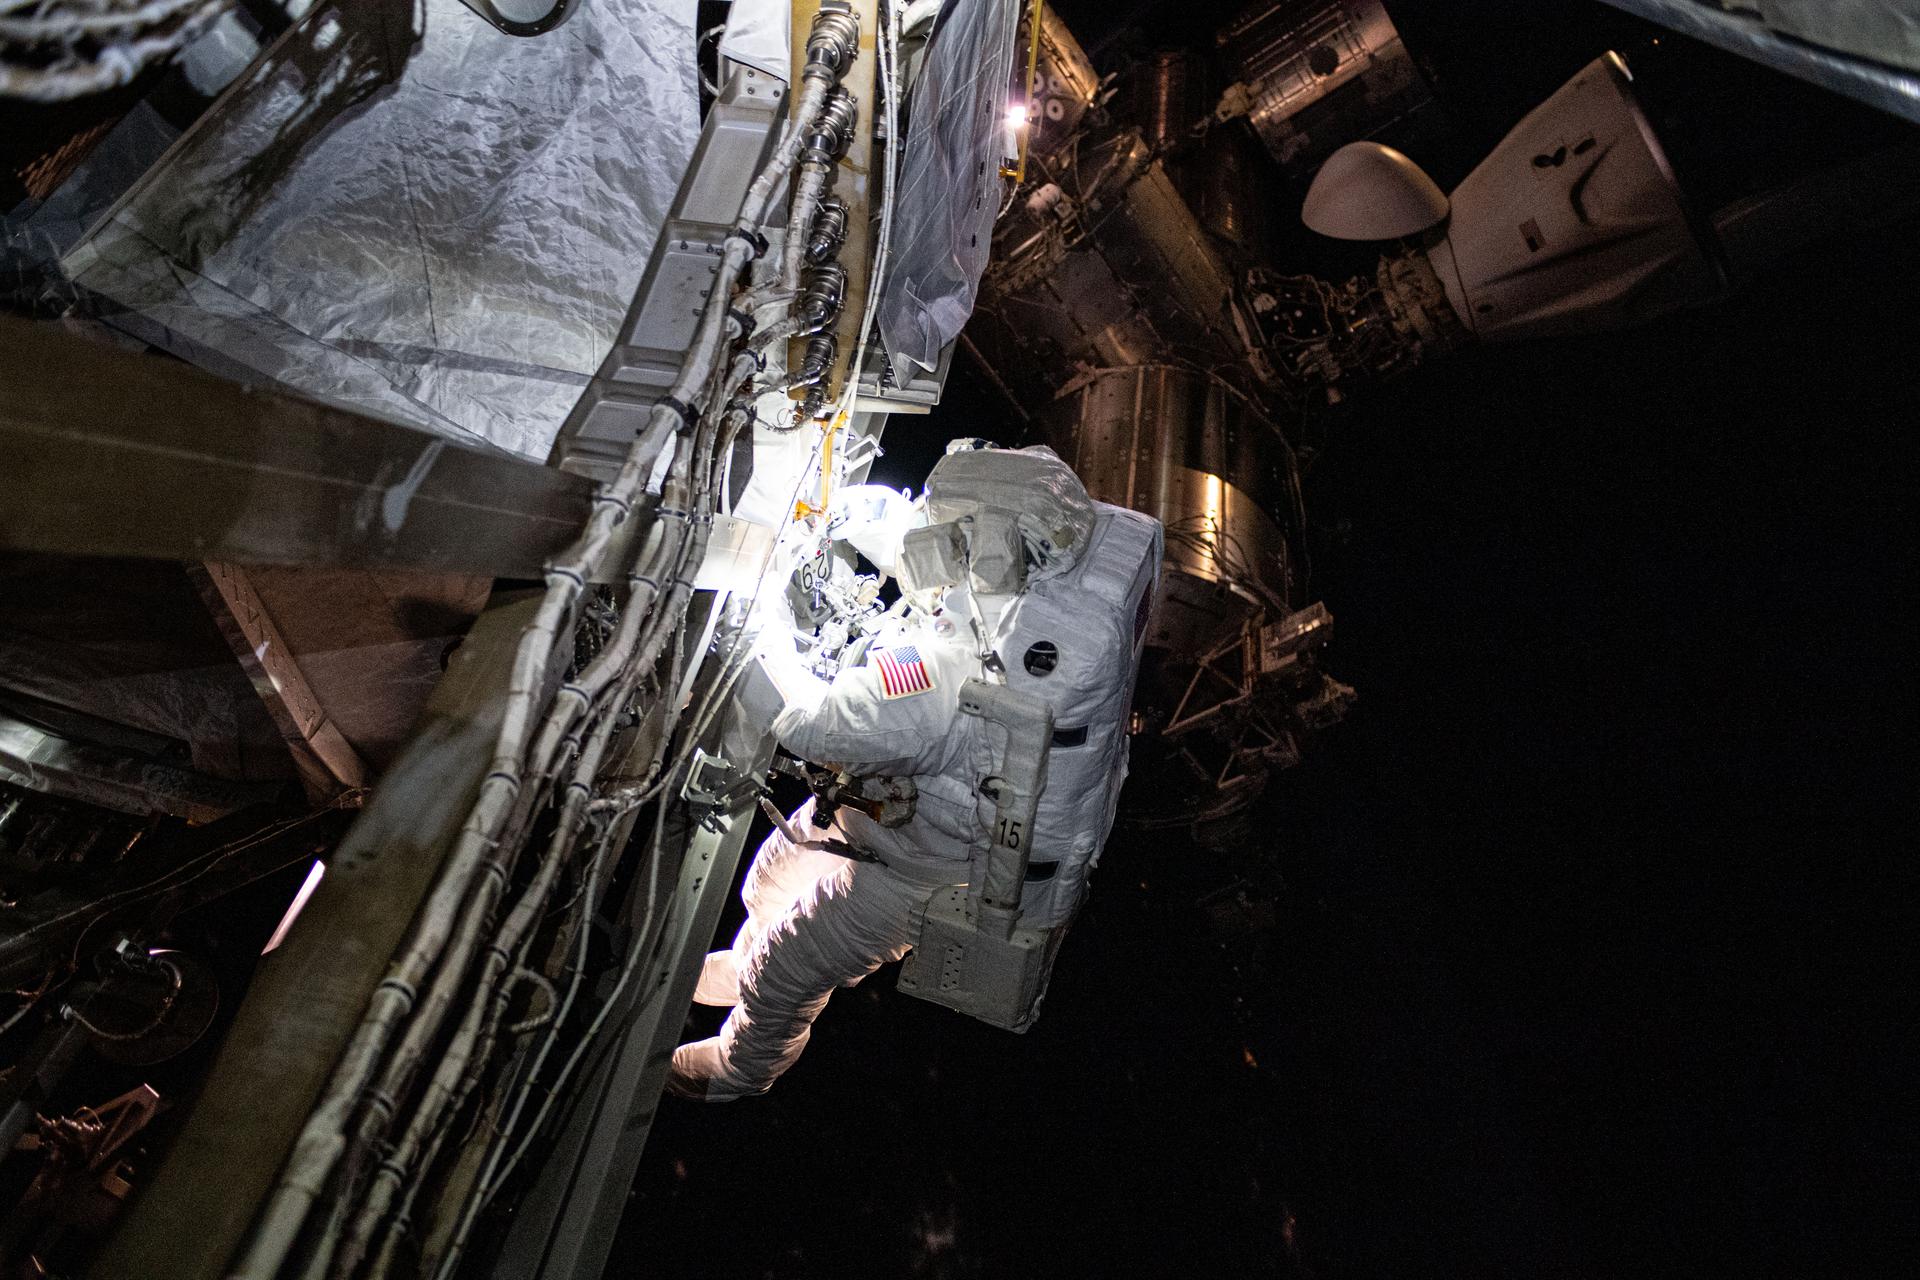
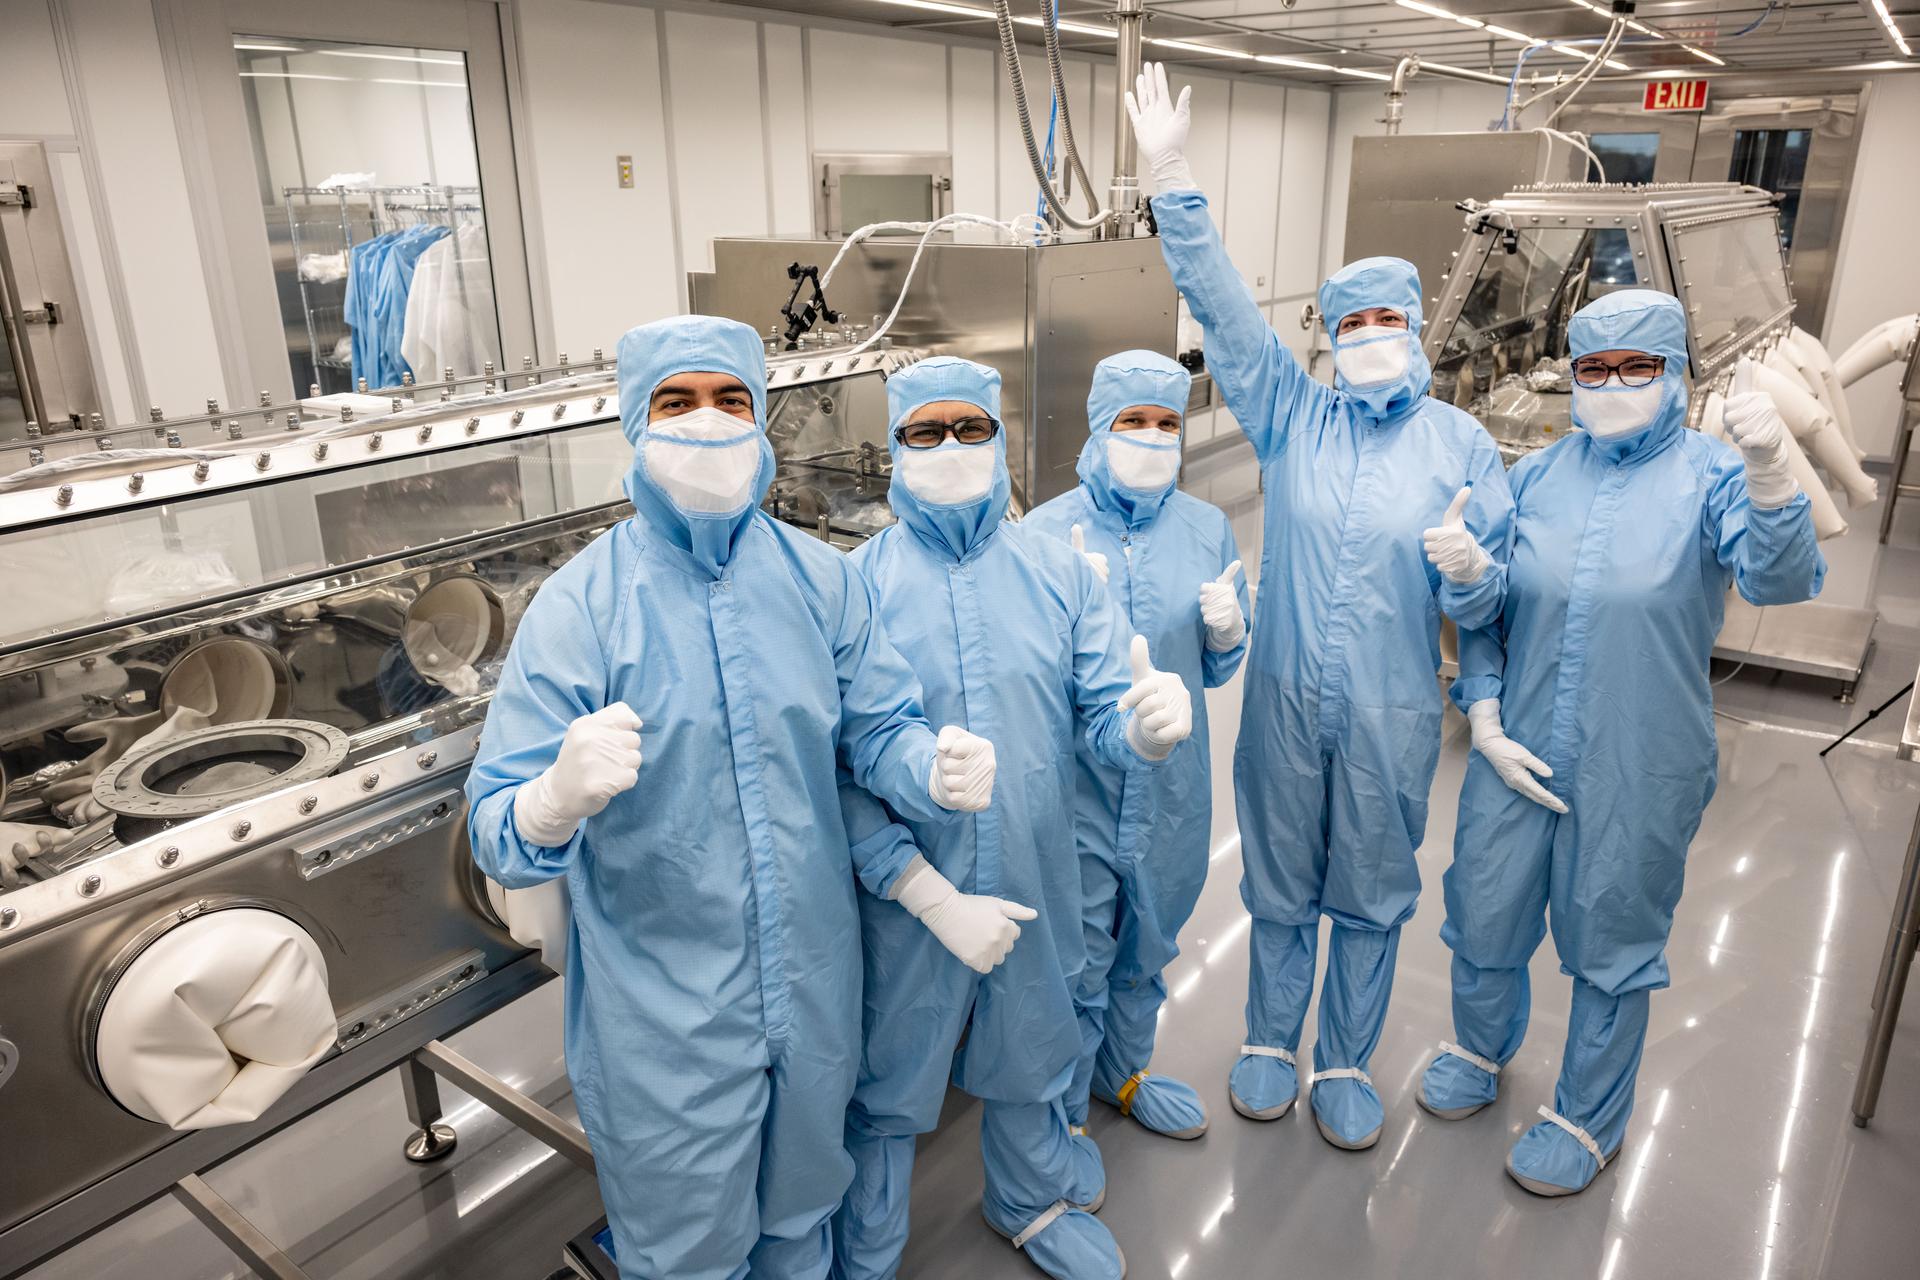
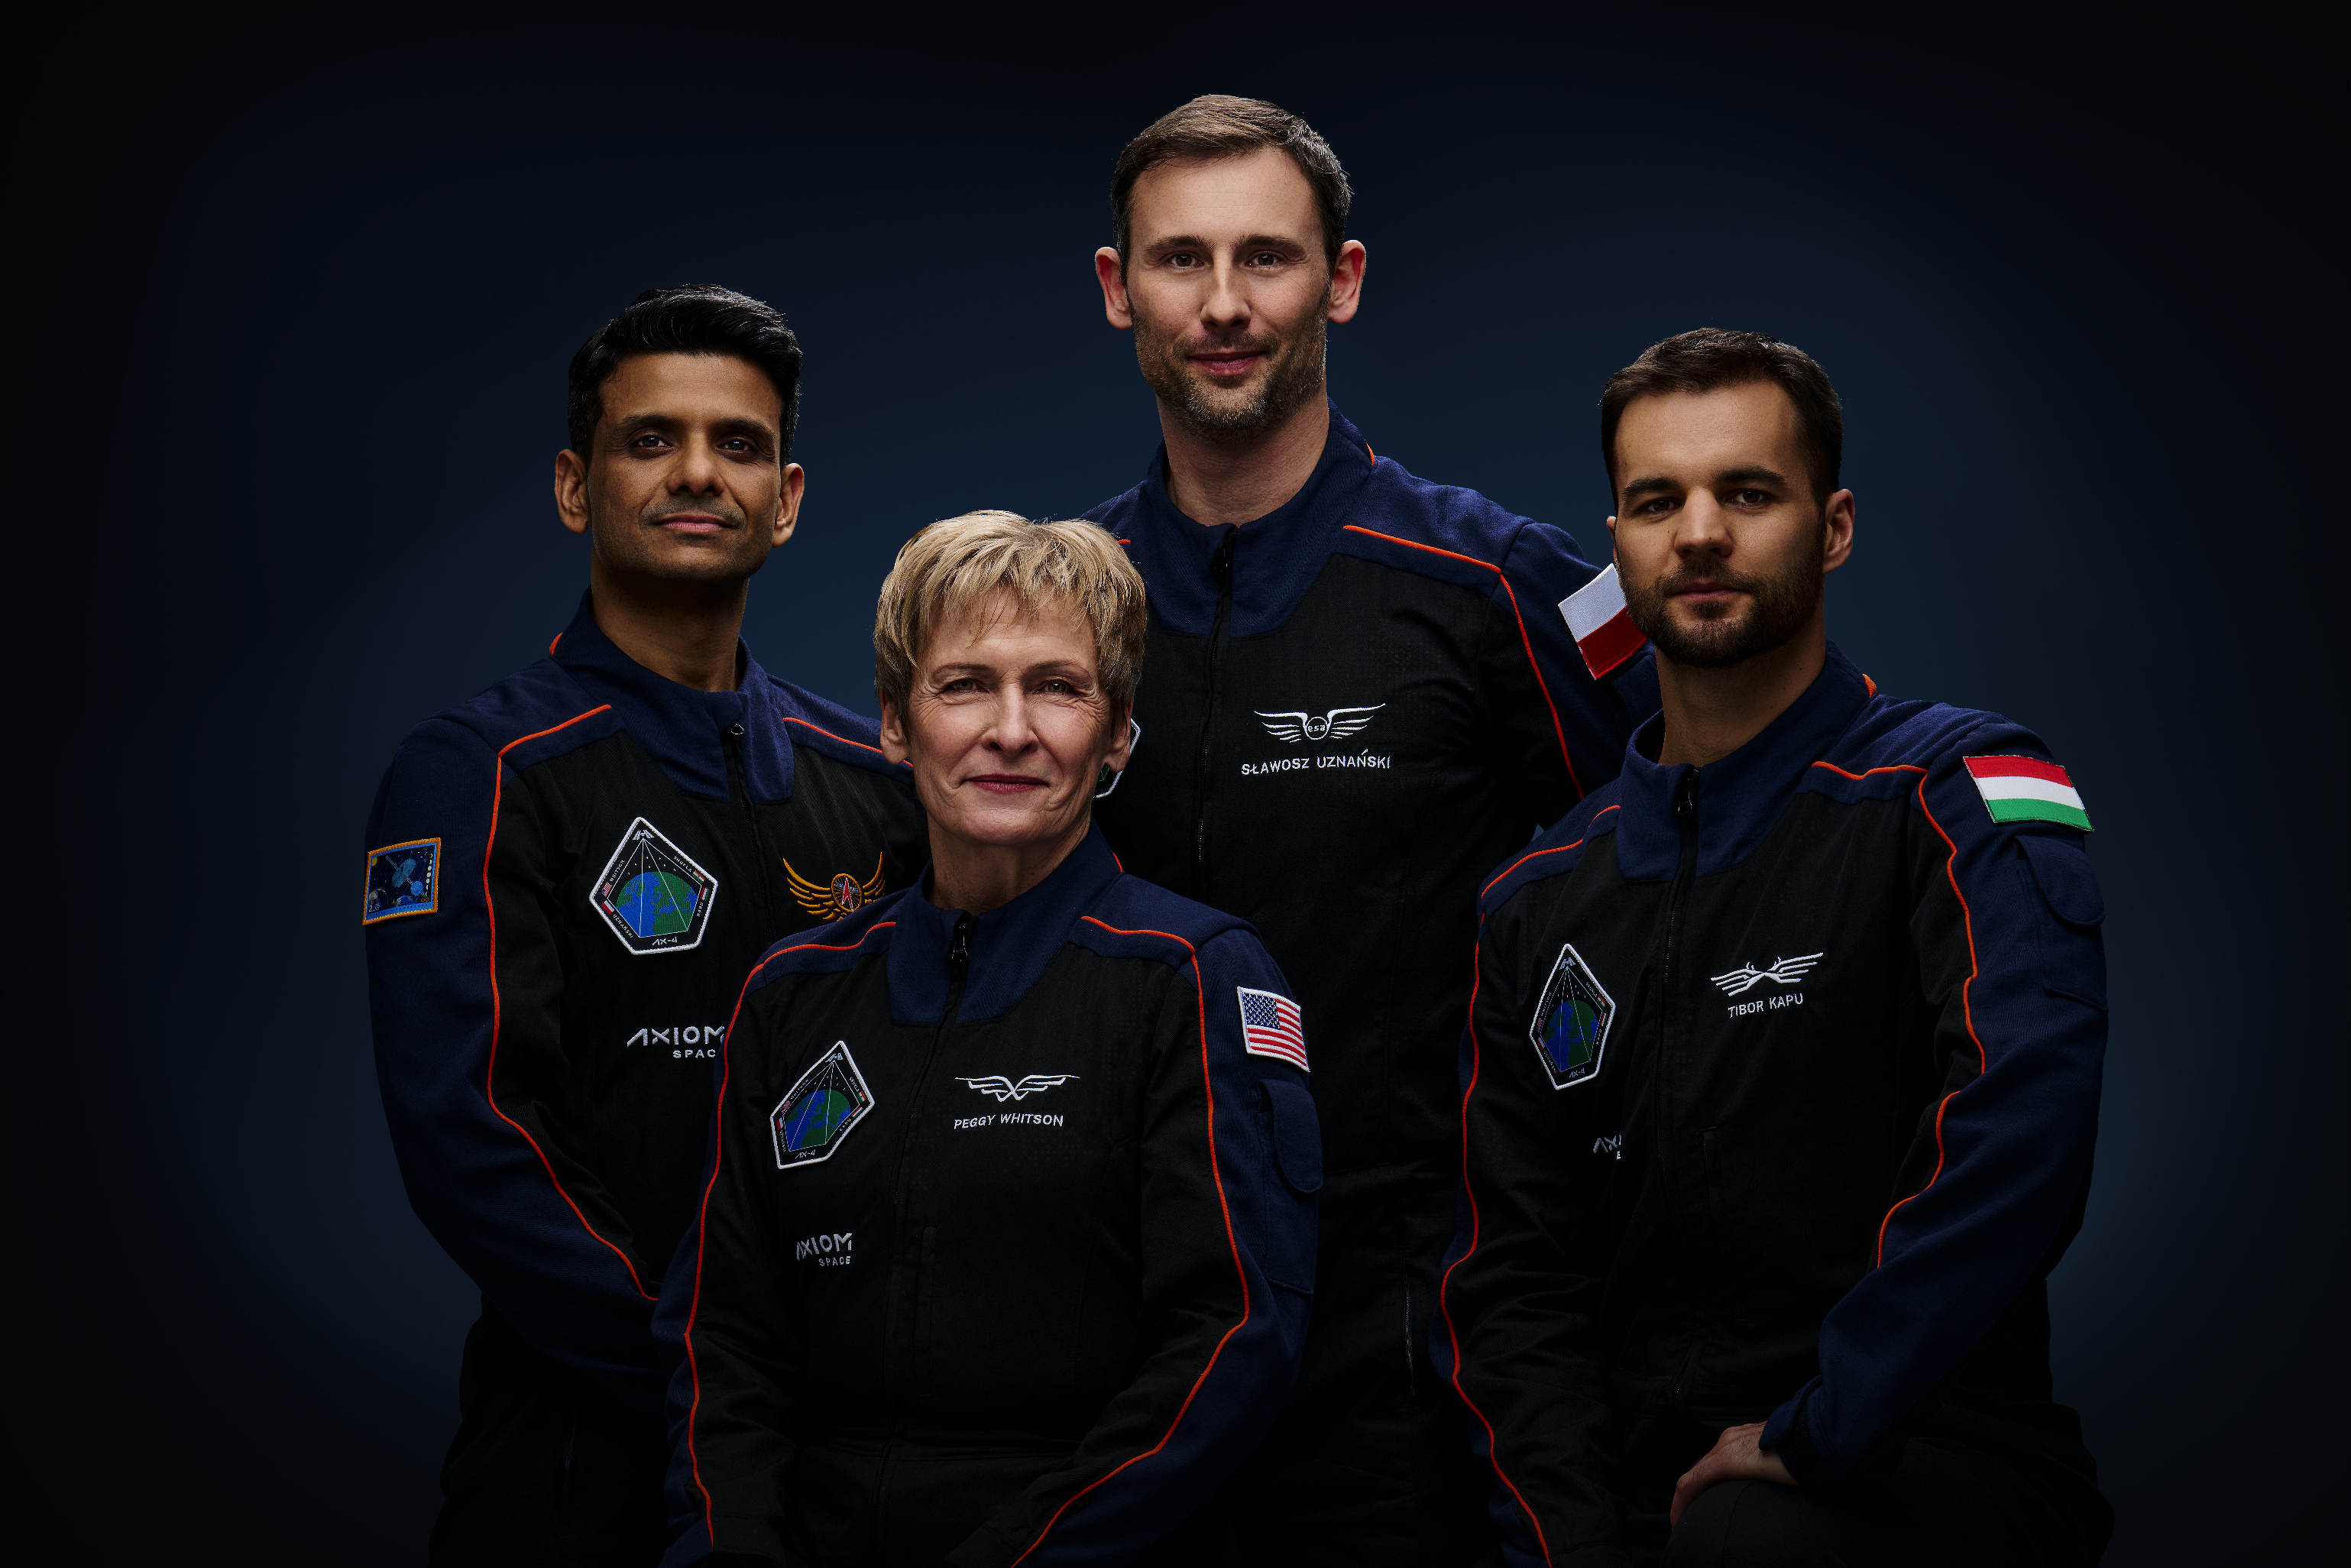
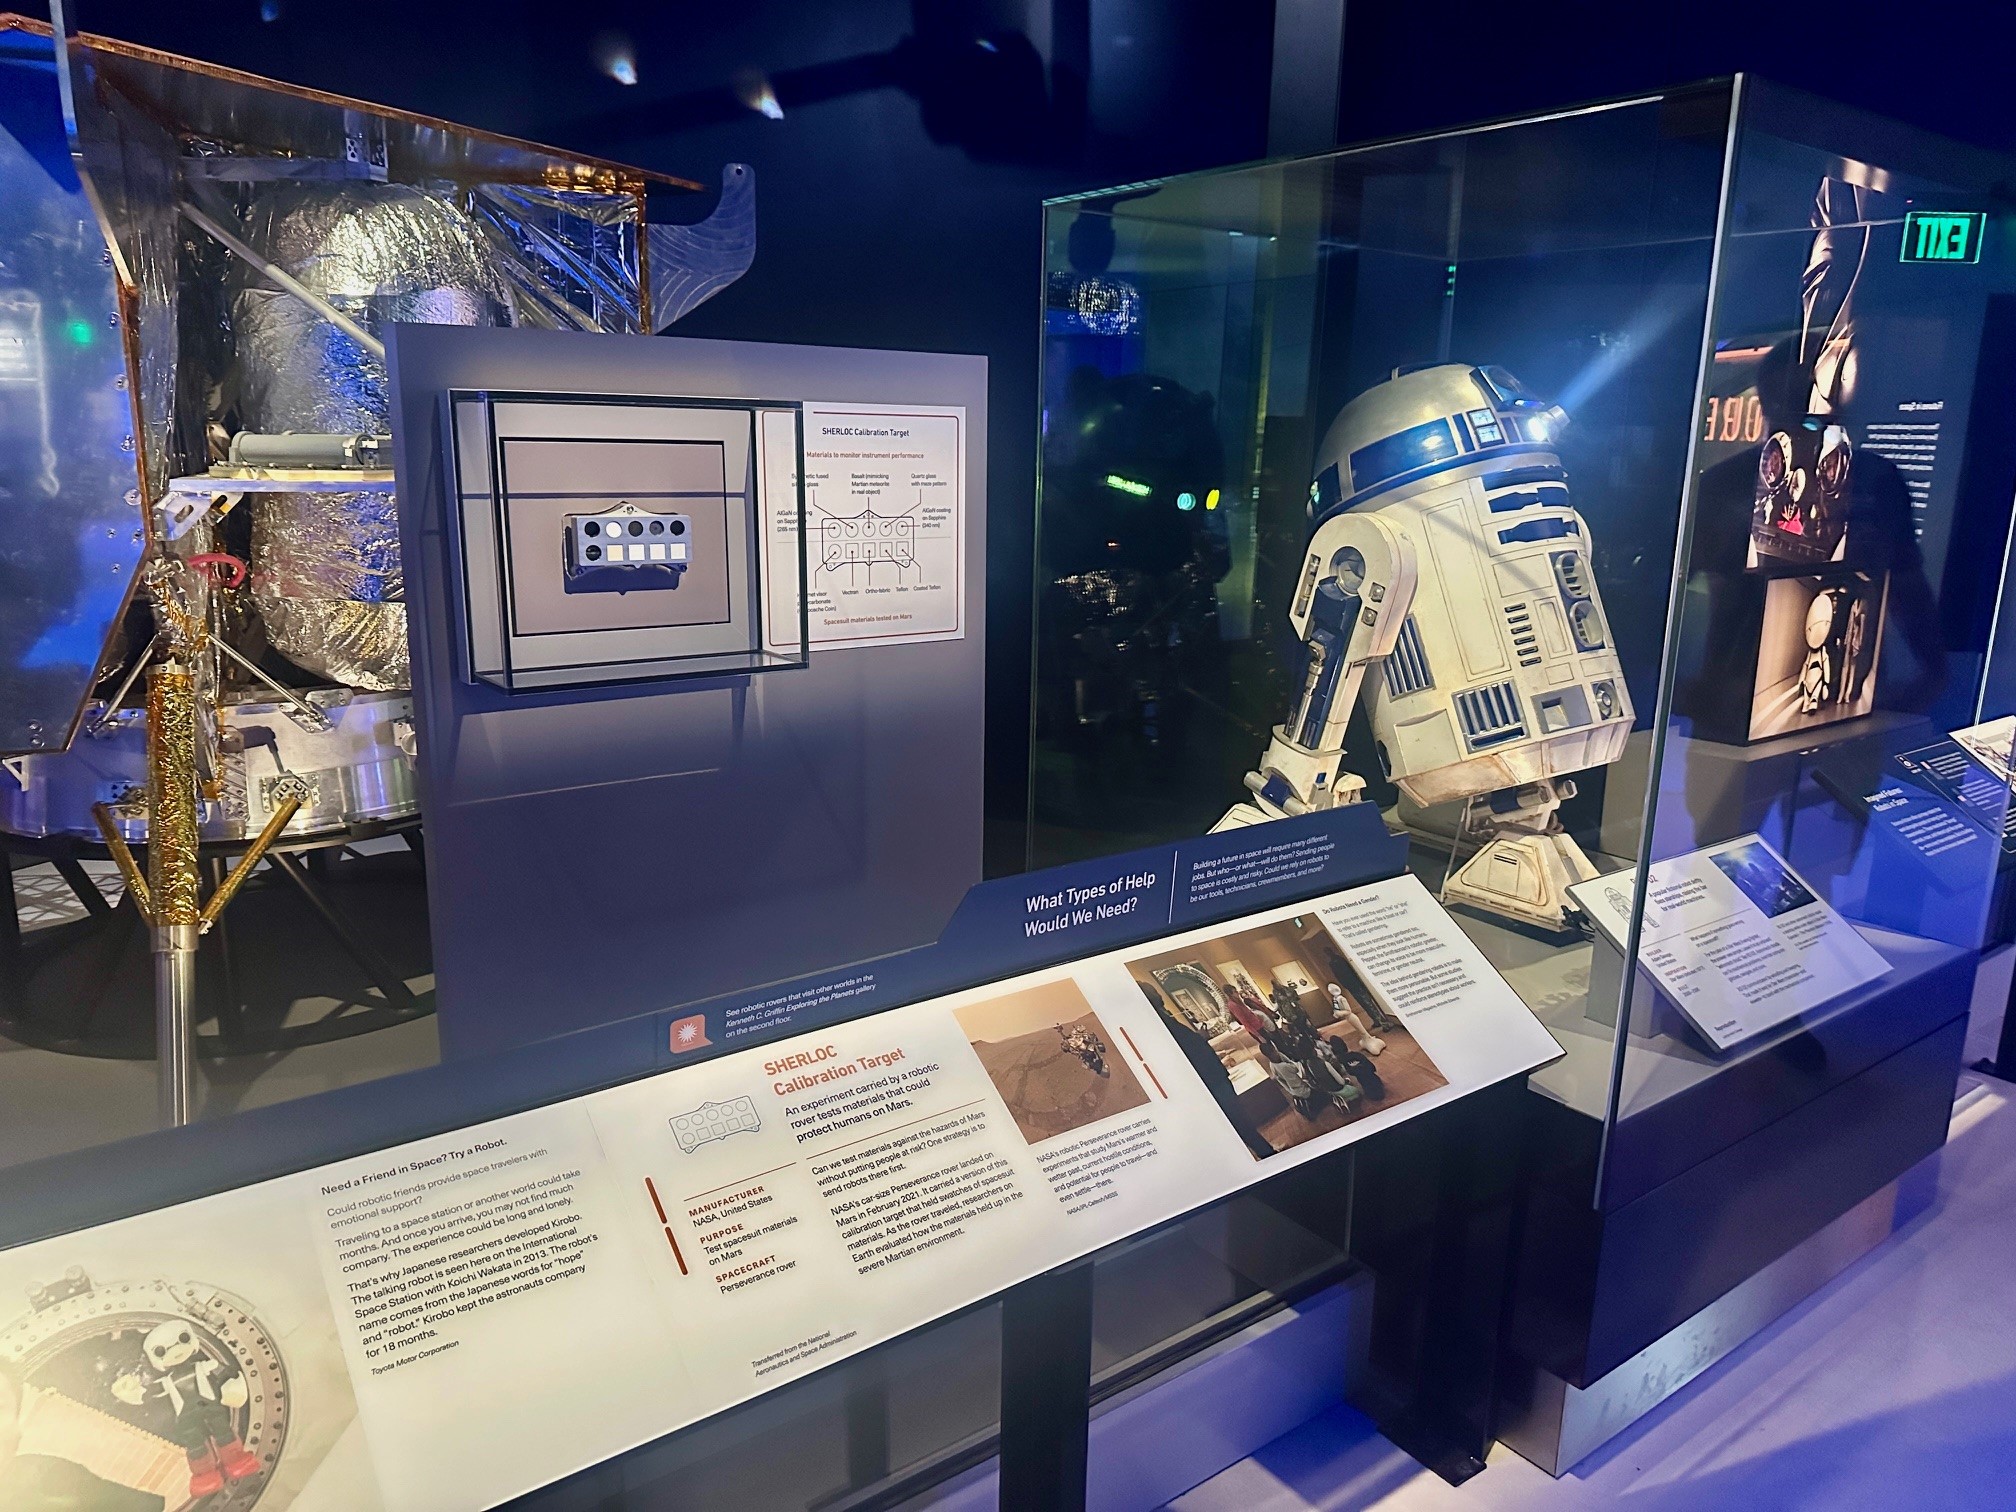
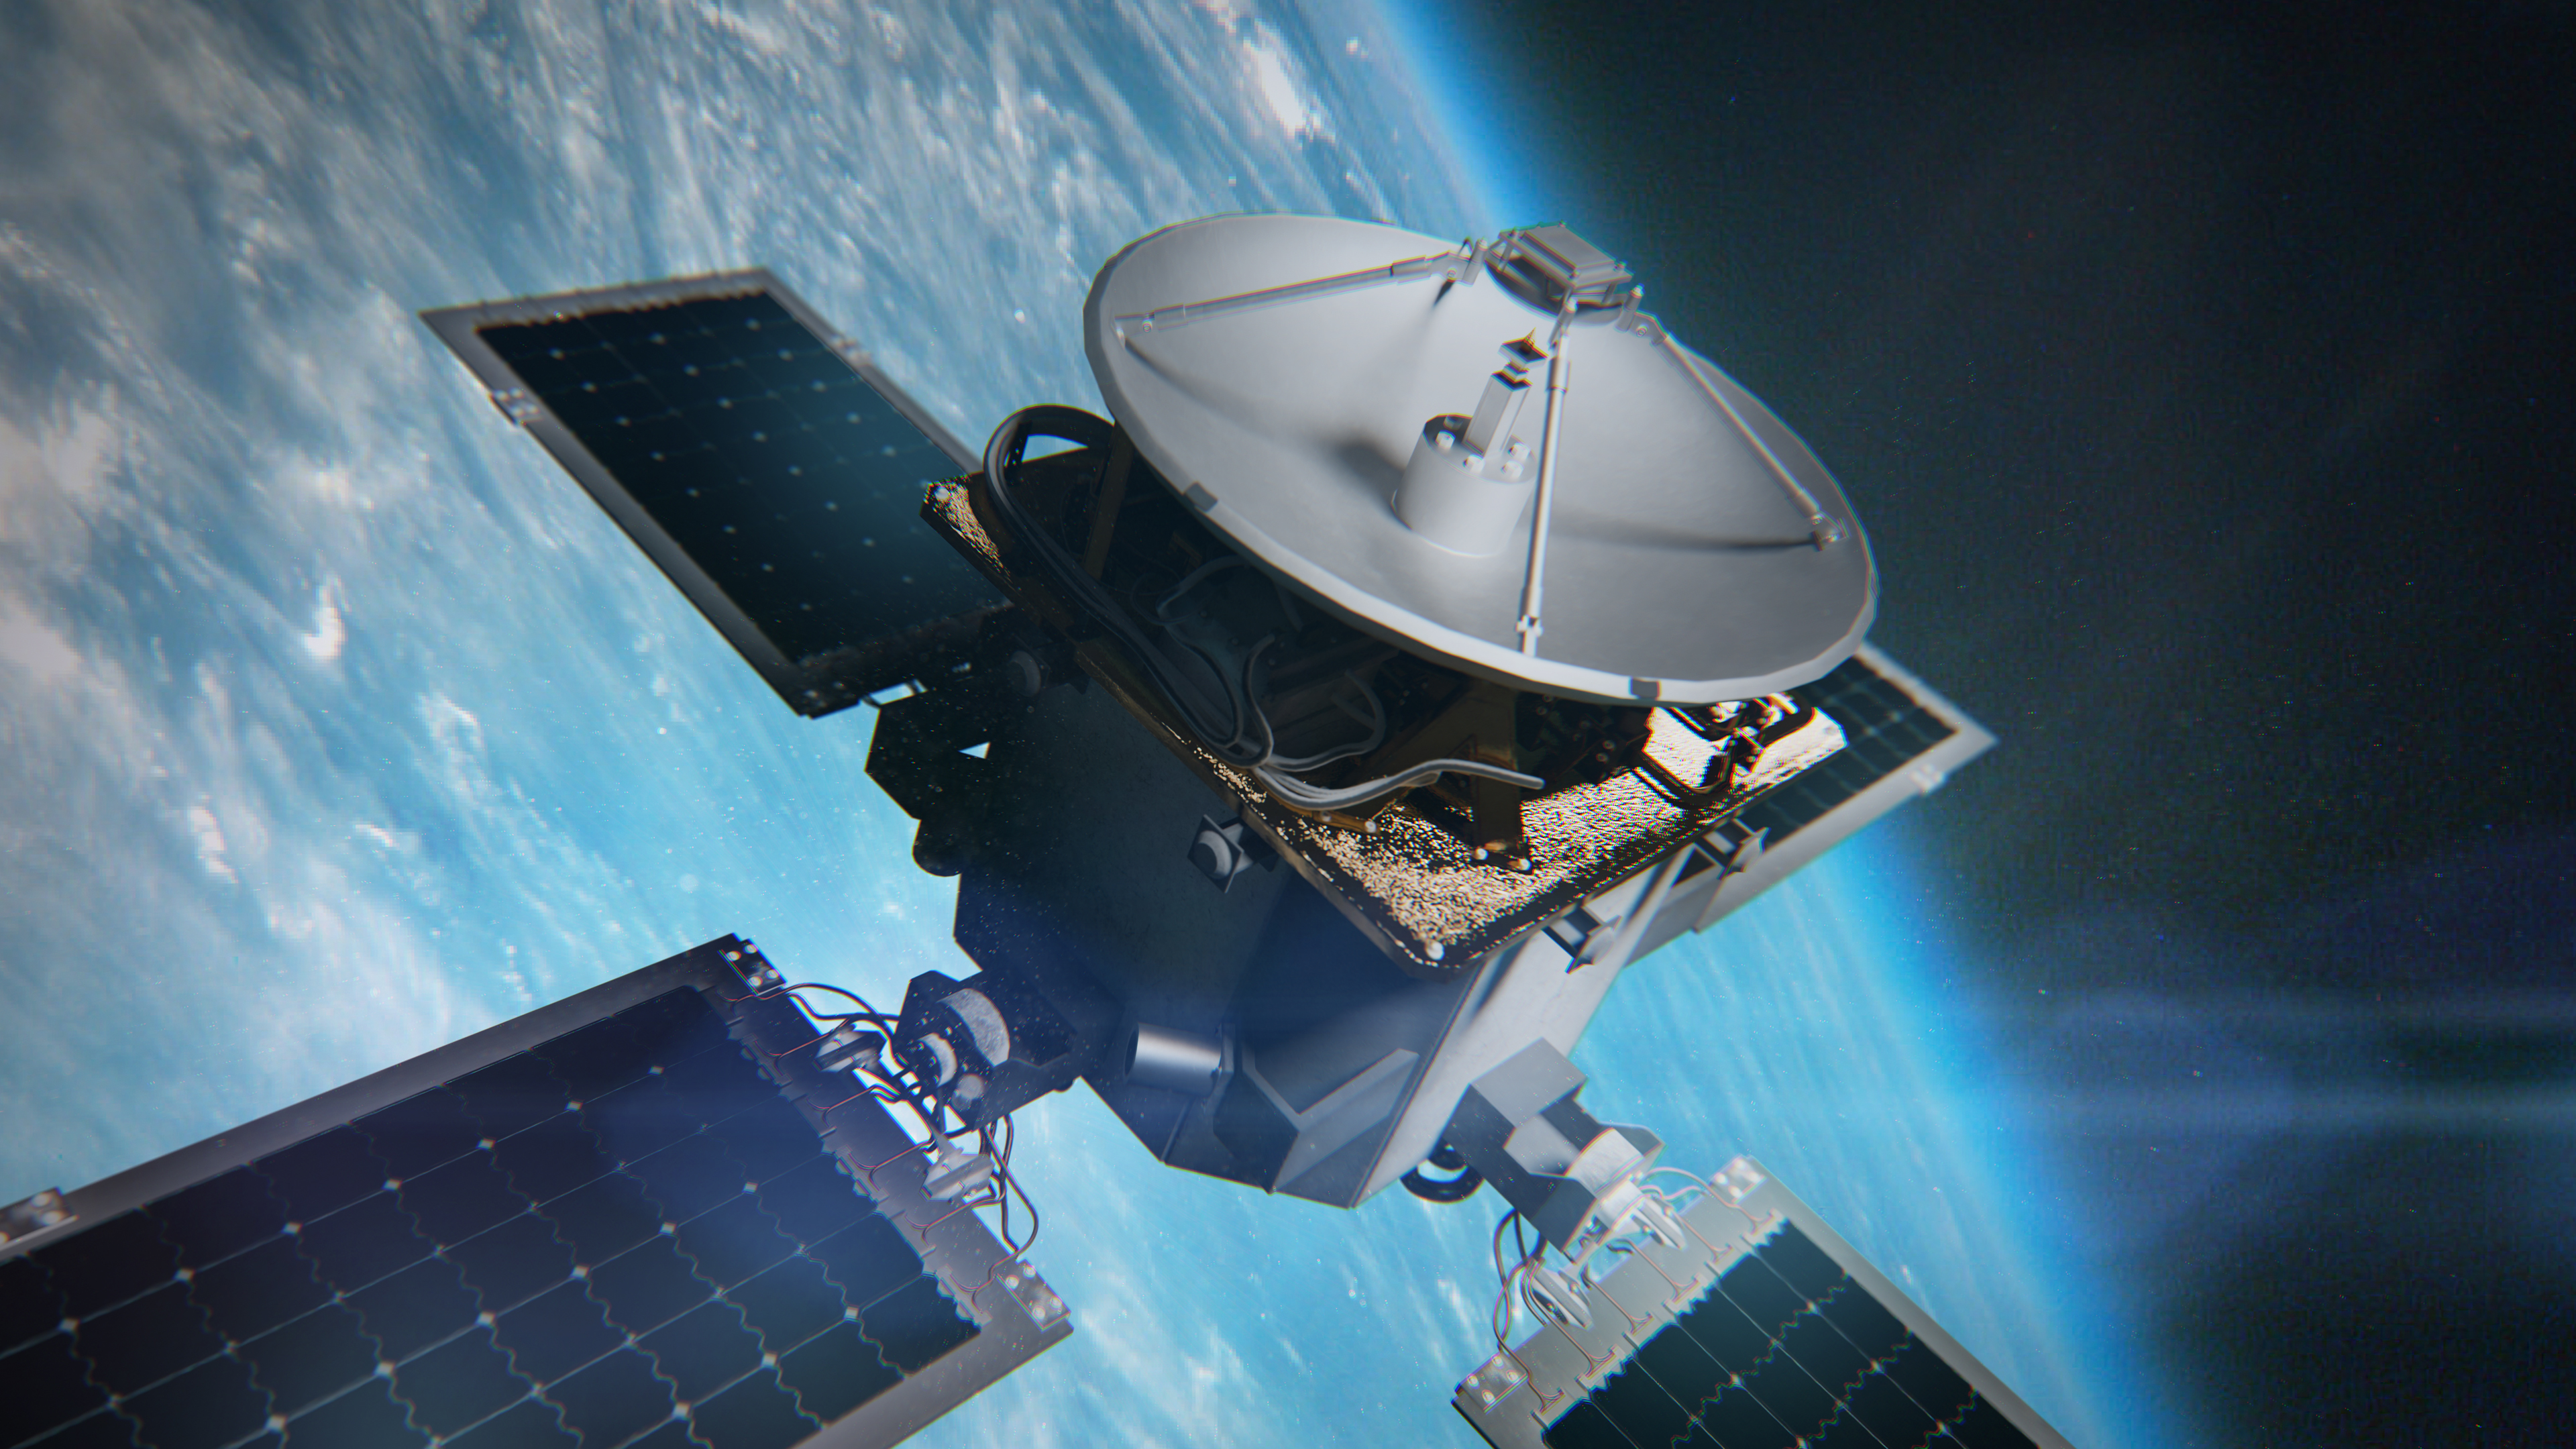
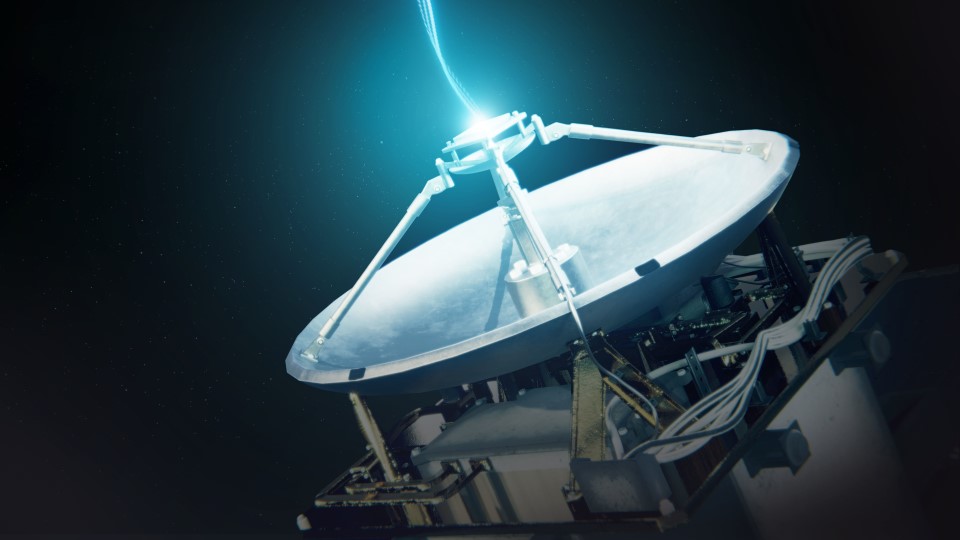