
NASA News
Crew-12 Launches
A SpaceX Falcon 9 rocket carrying the company’s Dragon spacecraft is launched on NASA’s SpaceX Crew-12 mission to the International Space Station with NASA astronauts Jessica Meir, Jack Hathaway, ESA (European Space Agency) astronaut Sophie Adenot, and Roscosmos cosmonaut Andrey Fedyaev onboard, Friday, Feb. 13, 2026, from Cape Canaveral Space Force Station in Florida. NASA’s SpaceX Crew-12 mission is the twelfth crew rotation mission of the SpaceX Dragon spacecraft and Falcon 9 rocket to the International Space Station as part of the agency’s Commercial Crew Program. Meir, Hathaway, Adenot, and Fedyaev launched at 5:15 a.m. EST from Space Launch Complex 40 at the Cape Canaveral Space Force Station to begin a mission aboard the orbital outpost.
After NASA astronauts Jessica Meir and Jack Hathaway, ESA (European Space Agency) astronaut Sophie Adenot, and Roscosmos cosmonaut Andrey Fedyaev arrive at the space station, they will conduct various experiments and technology demonstrations to benefit life on Earth and in orbit, furthering our journey back to the Moon, to Mars, and beyond.
NASA’s SpaceX Crew-12 Launches to International Space Station
Four crew members of NASA’s SpaceX Crew-12 mission launched at 5:15 a.m. EST Friday from Space Launch Complex 40 at Cape Canaveral Space Force Station in Florida for a science expedition aboard the International Space Station.
A SpaceX Falcon 9 rocket propelled a Dragon spacecraft into orbit carrying NASA astronauts Jessica Meir and Jack Hathaway, ESA (European Space Agency) astronaut Sophie Adenot, and Roscosmos cosmonaut Andrey Fedyaev. The spacecraft will dock autonomously to the space-facing port of the station’s Harmony module at approximately 3:15 p.m. Saturday, Feb. 14.
“With Crew-12 safely on orbit, America and our international partners once again demonstrated the professionalism, preparation, and teamwork required for human spaceflight,” said NASA Administrator Jared Isaacman. “The research this crew will conduct aboard the space station advances critical technologies for deep space exploration while delivering real benefits here on Earth. I’m grateful to the NASA and SpaceX teams whose discipline, rigor, and resilience made today’s launch possible. We undertake these missions with a clear understanding of risk, managing it responsibly so we can continue expanding human presence in low Earth orbit while preparing for our next great leap to the Moon and onward to Mars.”
During Dragon’s flight, SpaceX will monitor a series of automatic spacecraft maneuvers from its mission control center in Hawthorne, California. NASA will monitor space station operations throughout the flight from the Mission Control Center at the agency’s Johnson Space Center in Houston.
NASA’s live coverage resumes at 1:15 p.m. Saturday on NASA+, Amazon Prime, and the agency’s YouTube channel with rendezvous, docking, and hatch opening. After docking, the crew will change out of their spacesuits and prepare cargo for offload before opening the hatch between Dragon and the space station’s Harmony module around 5 p.m. NASA also will provide coverage of the welcome ceremony aboard the space station shortly following hatch opening.
Learn how to watch NASA content through a variety of platforms, including social media.
Meir, Hathaway, Adenot, and Fedyaev will join the Expedition 74 crew, including NASA astronaut Chris Williams and Roscosmos cosmonauts Sergey Kud-Sverchkov and Sergei Mikaev already aboard the orbiting laboratory, returning the space station to its standard seven crew members complement following the Jan. 14 departure of NASA’s SpaceX Crew-11 mission.
During its mission, Crew-12 will conduct scientific research to prepare for human exploration beyond low Earth orbit and to benefit humanity on Earth. Participating crew members will study pneumonia-causing bacteria to improve cardiovascular treatments, on-demand intravenous fluid generation for future space missions, and research on how physical characteristics may affect blood flow during spaceflight. Other experiments include automated plant health monitoring and investigations of plant and nitrogen-fixing microbe interactions to enhance food production in space.
Crew-12 is part of NASA’s Commercial Crew Program, which provides reliable access to space, maximizing the use of the station for research and development, and supporting future missions beyond low Earth orbit by partnering with private companies to transport astronauts to and from the International Space Station.
Learn more about the agency’s Commercial Crew Program at:
https://www.nasa.gov/commercialcrew
-end-
Josh Finch
Headquarters, Washington
202-358-1100
joshua.a.finch@nasa.gov
Steven Siceloff
Kennedy Space Center, Florida
321-867-2468
steven.p.siceloff@nasa.gov
Sandra Jones / Joseph Zakrzewski
Johnson Space Center, Houston
281-483-5111
sandra.p.jones@nasa.gov / joseph.a.zakrzewski@nasa.gov
Sunlight Extracts Oxygen From Regolith Using Solar Chemistry
NASA’s Carbothermal Reduction Demonstration (CaRD) project completed an important step toward using local resources to support human exploration on the Moon. The CaRD team performed integrated prototype testing that used concentrated solar energy to extract oxygen from simulated lunar soil, while confirming the production of carbon monoxide through a solar-driven chemical reaction.
If deployed on the Moon, this technology could enable the production of propellant using only lunar materials and sunlight, significantly reducing the cost and complexity of sustaining a long-term human presence on the lunar surface. The same downstream systems used to convert carbon monoxide into oxygen can also be adapted to convert carbon dioxide into oxygen and methane on Mars.
The integrated prototype brought together a carbothermal oxygen production reactor developed by Sierra Space, a solar concentrator designed by NASA’s Glenn Research Center in Cleveland, precision mirrors produced by Composite Mirror Applications, and avionics, software, and gas analysis systems from NASA’s Kennedy Space Center in Florida. NASA’s Johnson Space Center in Houston led project management, systems engineering, testing, and development of key hardware and ground support systems.
Explore More 4 min read NASA Moon Mission Spacesuit Nears Milestone Article 4 days ago 2 min read NASA, University of Texas Expand Research and Workforce Development Article 2 weeks ago 8 min read Station Nation: Erin Edwards, Deputy Branch Chief for Crew Operations and Capsule Communicator Article 2 weeks agoStonebreen’s Beating Heart
- Earth
- Earth Observatory
- Image of the Day
- EO Explorer
- Topics
- More Content
- About
NASA Selects Vast for Sixth Private Mission to Space Station
NASA and Vast have signed an order for the sixth private astronaut mission to the International Space Station, targeted to launch no earlier than summer 2027 from Florida.
This private astronaut mission marks the company’s first selection to the orbiting laboratory, underscoring NASA’s ongoing investment in fostering a commercial space economy and expanding opportunities for private industry in low Earth orbit.
“Private astronaut missions represent more than access to the International Space Station — they create opportunities for new ideas, companies, and capabilities that further enhance American leadership in low Earth orbit and open doors for what’s next,” said NASA Administrator Jared Isaacman. “We’re proud to welcome Vast to this growing community of commercial partners. Each new entrant brings unique strengths that fuel a dynamic, innovative marketplace as we advance research and technology and prepare for missions to the Moon, Mars, and beyond.”
The mission is expected to spend up to 14 days aboard the space station. A specific launch date will depend on overall spacecraft traffic at the orbital outpost and other planning considerations.
“The International Space Station plays an essential role in shaping the future of low Earth orbit,” said Dana Weigel, manager, International Space Station Program at NASA’s Johnson Space Center in Houston. “By hosting private astronaut missions, the station helps accelerate innovation, opens new commercial pathways, and advances research strengthening the foundation of a thriving space economy.”
Vast will submit four proposed crew members to NASA and its international partners for review. Once approved and confirmed, they will train with NASA, international partners, and SpaceX for their flight. The company has contracted with SpaceX as launch provider for transportation to and from the space station.
“Vast is honored to have been selected by NASA for the sixth private astronaut mission to the International Space Station,” said Max Haot, CEO of Vast. “Leveraging the remaining life of the space station with science and research-led commercial crewed missions is a critical part of the transition to commercial space stations and fully unlocking the orbital economy.”
The company will purchase mission services from NASA, including crew consumables, cargo delivery, storage, and other in-orbit resources for daily use. NASA will purchase the capability to return scientific samples that must remain cold during transit back to Earth.
NASA made the selection from proposals received in response to its March 2025 NASA Research Announcement.
Missions aboard the International Space Station, including private astronaut missions, help advance scientific knowledge and demonstrate new technologies in the unique microgravity environment. These commercial efforts in low Earth orbit are helping develop capabilities and technologies that could support NASA’s long-term goals for missions beyond low Earth orbit, including deep space exploration to the Moon and eventually to Mars through the agency’s Artemis campaign.
Learn more about NASA’s commercial space strategy at:
https://www.nasa.gov/commercial-space
-end-
Jimi Russell
Headquarters, Washington
202-358-1600
james.j.russell@nasa.gov
Anna Schneider / Joseph Zakrzewski
Johnson Space Center, Houston
281-483-5111
anna.c.schneider@nasa.gov / joseph.a.zakrzewski@nasa.gov
NASA Moon Mission Spacesuit Nears Milestone
4 min read
Preparations for Next Moonwalk Simulations Underway (and Underwater) A NASA crew member practices using lunar tools to collect geology samples at NASA’s Johnson Space Center during an elevated suit pressure test where teams evaluate how well crew perform tasks in different suit pressure levels while wearing the Artemis III lunar spacesuit developed by Axiom Space called the AxEMU (Axiom Extravehicular Mobility Unit).NASA/Bill StaffordThe next-generation spacesuit for NASA’s Artemis III mission continues to advance by passing a contractor-led technical review, as the agency prepares to send humans to the Moon’s South Pole for the first time. Testing is also underway for the new suits, built by Axiom Space, with NASA astronauts and spacesuit engineers recently simulating surface operations and tasks underwater to demonstrate safety and mobility.
The AxEMU (Axiom Extravehicular Mobility Unit), is designed to give astronauts increased flexibility and improved mobility for moonwalking, including bending down to collect geology samples and perform a variety of scientific tasks. The suit features increased sizing options and adjustability to fit a wider range of crew members. It incorporates advanced life-support systems and enhanced protection to withstand the harsh lunar environment. Axiom Space is also developing specialized tools and equipment for work on the lunar surface, allowing astronauts to more easily gather geology samples.
Now that Axiom Space has completed their technical review of the AxEMU, NASA will evaluate whether the spacesuit is ready for the agency’s Artemis III mission that will return American astronauts to the Moon. A NASA-led critical design sync review, which is an agency-required technical evaluation, will confirm that the design’s hardware and systems are on track for final testing and delivery. In parallel, Axiom Space has begun receiving parts for the first flight unit, which will be assembled later this spring.
This achievement reflects our shared commitment to deliver a safe, capable lunar spacesuit that will enable astronauts to explore the Moon’s surface.Lara Kearney
Manager, Extravehicular Activity and Human Surface Mobility Program
“The completion of their internal review brings Axiom Space one step closer to delivering a next-generation lunar spacesuit,” said Lara Kearney, manager of the Extravehicular Activity and Human Surface Mobility Program at Johnson Space Center in Houston. “This achievement reflects our shared commitment to deliver a safe, capable lunar spacesuit that will enable astronauts to explore the Moon’s surface.”
NASA and Axiom Space have conducted over 850 hours of pressurized testing with a person inside the AxEMU. Leading up to the review, teams conducted underwater and simulated lunar gravity tests of the AxEMU in facilities at NASA Johnson that demonstrate how the spacesuit’s capabilities will offer increased mobility as astronauts explore the Moon’s surface and prepare for missions to Mars. These tests allow astronauts and engineers to become familiar with the spacesuit and practice moving and performing tasks in a simulated lunar gravity environment, which is one-sixth the gravity we experience on Earth. Suit users have provided feedback on design, functionality, and safety.
A NASA crew member practices simulated lunar surface operations at NASA’s Neutral Buoyancy Laboratory where teams evaluate how well crew perform tasks while wearing the Artemis III lunar spacesuit developed by Axiom Space called the AxEMU (Axiom Extravehicular Mobility Unit).NASA A NASA crew member practices simulated lunar surface operations at NASA’s Johnson Space Center during an elevated suit pressure test where teams evaluate how well crew perform tasks in different suit pressure levels while wearing the Artemis III lunar spacesuit developed by Axiom Space called the AxEMU (Axiom Extravehicular Mobility Unit).NASA/James Blair NASA crew members practice emergency rescue drills during simulated lunar surface operations at NASA’s Neutral Buoyancy Laboratory where teams evaluate how well crew perform tasks while wearing the Artemis III lunar spacesuit developed by Axiom Space called the AxEMU (Axiom Extravehicular Mobility Unit).NASA A NASA crew member practices simulated lunar surface operations at NASA’s Johnson Space Center during an elevated suit pressure test where teams evaluate how well crew perform tasks in different suit pressure levels while wearing the Artemis III lunar spacesuit developed by Axiom Space called the AxEMU (Axiom Extravehicular Mobility Unit).NASA/Bill StaffordAgency and Axiom Space teams recently finished the first series of test runs in the Neutral Buoyancy Laboratory at NASA Johnson. While in the 40-foot-deep pool, they weighted the AxEMU to match lunar gravity and assessed functionality and ease of movement.
Now, teams are in the middle of evaluating how well test subjects can perform tasks while wearing the spacesuit in different suit pressure levels in NASA Johnson’s Active Response Gravity Offload System facility. The agency uses an overhead lift system that connects to a spacesuit to create a reduced-gravity environment allowing anyone in the suit to walk around in simulated lunar gravity. Higher suit pressures reduce time to acclimate to the suits, enabling astronauts to spend more time walking on the lunar surface during Artemis missions.
Astronaut safety is NASA’s top priority for the Artemis campaign. Using more than 50 years of spacesuit expertise, NASA defined the technical and safety standards and requirements by which the next generation of lunar spacesuits are being built. At key milestones in the spacesuit’s development, NASA has and will continue to verify the AxEMU and its system deliverables to ensure the risk to the Artemis crew members is understood and minimized.
NASA’s spacesuits contract is managed by the Extravehicular Activity and Human Surface Mobility Program which serves as the agency’s program to develop next-generation spacesuits, human-rated rovers, and spacewalking tools, along with all required spacewalking support systems that will enable astronauts to survive and work outside the confines of a spacecraft to explore on and around the Moon.
As part of a Golden Age of innovation and exploration, NASA’s Artemis astronauts will use these new spacesuits, along with advanced landers and rovers, to explore more of the Moon for scientific discovery, economic benefits, and to prepare for future human exploration of Mars.
Learn more about NASA’s Artemis campaign at:
Share Details Last Updated Feb 12, 2026 Related Terms Explore More 1 min read Sunlight Extracts Oxygen From Regolith Using Solar Chemistry Article 4 days ago 3 min read I Am Artemis: Jesse BerdisJesse Berdis’s dream of becoming a structural engineer began with visions of skyscrapers rising above…
Article 5 days ago 3 min read NASA Marks Milestone in Preparation for Artemis IV Testing Article 6 days ago Keep Exploring Discover More Topics From NASAExtravehicular Activity and Human Surface Mobility
Humans In Space
Human Landing System
Artemis III
Shimmering Light in Egg Nebula
This image from NASA’s Hubble Space Telescope released on Feb. 10, 2026, reveals a dramatic interplay of light and shadow in the Egg Nebula, sculpted by freshly ejected stardust. Located approximately 1,000 light-years away in the constellation Cygnus, the Egg Nebula features a central star obscured by a dense cloud of dust — like a “yolk” nestled within a dark, opaque “egg white.”
It is the first, youngest, and closest pre-planetary nebula ever discovered. (A pre-planetary nebula is a precursor stage of a planetary nebula, which is a structure of gas and dust formed from the ejected layers of a dying, Sun-like star. The term is a misnomer, as planetary nebulae are not related to planets.)
Read more about the Egg Nebula.
Image credit: NASA, ESA, Bruce Balick (UWashington)
Reaching Top Speed in the Dolomites
- Earth
- Earth Observatory
- Image of the Day
- EO Explorer
- Topics
- More Content
- About
NASA Completes First Flight of Laminar Flow Scaled Wing Design
3 min read
Preparations for Next Moonwalk Simulations Underway (and Underwater) NASA’s Crossflow Attenuated Natural Laminar Flow (CATNLF) scale-model wing flies for the first time on a NASA F-15 research jet during a test flight from NASA’s Armstrong Flight Research Center in Edwards, California. The 75-minute flight confirmed the aircraft could maneuver safely with the approximately 3-foot-tall test article mounted beneath it. NASA will continue flight tests to collect data that validates the CATNLF design and its potential to improve laminar flow, reducing drag and lowering fuel costs for future commercial aircraft.NASA/Carla ThomasNASA completed the first flight test of a scale-model wing designed to improve laminar flow, reducing drag and lowering fuel costs for future commercial aircraft.
The flight took place Jan. 29 at NASA’s Armstrong Flight Research Center in Edwards, California, using one of the agency’s F-15B research jets. The NASA-designed, 40-inch Crossflow Attenuated Natural Laminar Flow (CATNLF) wing model was attached to the aircraft’s underside vertically, like a fin.
The flight lasted about 75 minutes, during which the team ensured the aircraft could maneuver safely in flight with the additional wing model.
“It was incredible to see CATNLF fly after all of the hard work the team has put into preparing,” said Michelle Banchy, research principal investigator for CATNLF. “Finally seeing that F-15 take off and get CATNLF into the air made all that hard work worth it.”
NASA’s Crossflow Attenuated Natural Laminar Flow (CATNLF) scale-model wing flies on a NASA F-15 research jet during a test flight from NASA’s Armstrong Flight Research Center in Edwards, California. The CATNLF technology is designed to maintain smooth airflow, known as laminar flow. NASA will continue flight tests to collect data that validates the CATNLF design and its potential to improve laminar flow, reducing drag and lowering fuel costs for future commercial aircraft.NASA/Carla ThomasNASA designed the CATNLF technology to improve the smooth flow of air, known as laminar flow, over swept-back wings, used in everything from airliners to fighter jets, by reducing disruptions that lead to drag. Maintaining laminar flow could help lower fuel burn and costs.
This flight was the first of up to 15 planned for the CATNLF series, which will test the design across a range of speeds, altitudes, and flight conditions.
“First flight was primarily focused on envelope expansion,” Banchy said. “We needed to ensure safe dynamic behavior of the wing model during flight before we can proceed to research maneuvers.”
During the flight, the team performed several maneuvers, such as turns, steady holds, and gentle pitch changes, at altitudes ranging from about 20,000 to nearly 34,000 feet, providing the first look at the aerodynamic characteristics of the wing model and confirming that it is working as expected.
NASA’s Crossflow Attenuated Natural Laminar Flow (CATNLF) scale-model wing flies for the first time on a NASA F-15 research jet during a test flight from NASA’s Armstrong Flight Research Center in Edwards, California. The 75-minute flight confirmed the aircraft could maneuver safely with the approximately 3-foot-tall test article mounted beneath it. NASA will continue flight tests to collect data that validates the CATNLF design and its potential to improve laminar flow, reducing drag and lowering fuel costs for future commercial aircraft.NASA/Carla ThomasThe team measured laminar flow using several tools, including an infrared camera mounted on the aircraft and aimed at the wing model to collect thermal data during flight tests. They will use this data to confirm key aspects of the design and evaluate how effectively the model maintains smooth airflow.
“CATNLF technology opens the door to a practical approach to getting laminar flow on large, swept components, such as a wing or tail, which offer the greatest fuel burn reduction potential,” Banchy said.
Early results showed airflow over the aircraft closely matched predictions made using computer models, she said.
The first flight builds on earlier work accomplished through computer modeling, wind tunnel testing, ground tests, and high-speed taxi tests. NASA plans to continue flight tests to gather research data that will help further validate the CATNLF test article and its potential for future commercial aircraft designs.
The CATNLF testing is a collaboration under NASA’s Flight Demonstrations and Capabilities project and Subsonic Vehicle Technologies and Tools project. The CATNLF concept has been supported through the combined efforts of NASA’s Advanced Air Vehicles Program and Integrated Aviation Systems Program under the agency’s Aeronautics Research Mission Directorate.
Share Details Last Updated Feb 11, 2026 EditorDede DiniusContactTeresa Whitingteresa.whiting@nasa.gov Related Terms Explore More 8 min read ARMD Research Solicitations (Updated Feb. 4) Article 2 weeks ago 5 min read NASA Armstrong Contributions Propel Artemis, Deep Space Innovation Article 2 weeks ago 3 min read NASA Aims to Advance Hypersonic Flight Testing with New Awards Article 2 weeks ago Keep Exploring Discover More Topics From NASAArmstrong Flight Research Center
Aeronautics
Artemis II
NASA Aircraft
I Am Artemis: Jesse Berdis
Listen to this audio excerpt from Jesse Berdis, Artemis II mobile launcher 1 deputy project manager:
0:00 / 0:00
Your browser does not support the audio element.Jesse Berdis’s dream of becoming a structural engineer began with visions of skyscrapers rising above the Dallas and Oklahoma skyline. Today, that dream has soared beyond city limits, reaching towering heights at the agency’s Kennedy Space Center in Florida.
Berdis, the deputy project manager for mobile launcher 1 for the agency’s Artemis II mission, had a path to NASA which was anything but planned. While attending an engineering leadership conference in Orlando, he left a copy of his resume with NASA recruiters. Four weeks later, that simple gesture turned into a life-changing opportunity: a role at Kennedy as a launch infrastructure engineer with the Exploration Ground Systems Program, working on Artemis I, the uncrewed test flight of SLS and Orion.
Anyone I talk to, that’s what’s on my mind, getting ready for the Artemis campaign. It can go from technical issues we’re solving to the passion we have for launching the crew and taking the next step in humanity of going back to the Moon.Jesse Berdis
Artemis II mobile launcher 1 deputy project manager
The mobile launcher serves as a backbone to the SLS (Space Launch System) rocket and Orion spacecraft for the Artemis missions before and during launch. It is designed to support the integration, testing, and checkouts of the rocket and spacecraft, in addition to serving as the structural platform, or as Berdis calls it, “the shoulders, at liftoff.” Standing more than 400 feet tall, the mobile launcher houses the umbilicals that provide power, communications, coolant, fuel, and stabilization prior to launch, as well as access for the Artemis II crew to safely board Orion.
When Berdis first arrived on center, the sight of massive ground systems left an unforgettable impression. To him, these weren’t just structures, they were skyscrapers for space exploration.
Jesse Berdis, Artemis II mobile launcher 1 deputy project manager, poses for a photo near the emergency egress system at Launch Complex 39B at NASA’s Kennedy Space Center in Florida on Friday, Feb. 6, 2026. The emergency egress system is an abort system for personnel to climb into four baskets of the mobile launcher to the base of the pad in the unlikely event of an emergency at the launch pad. Mobile launcher 1 supports the integration, testing, and checkouts of the SLS (Space Launch System) rocket and Orion spacecraft for the Artemis II mission.Photo credit: NASA/Kim ShiflettNASA/Kim Shiflett
After the historic launch of Artemis I, Berdis and his team turned their focus to an even greater challenge: preparing for Artemis II, NASA’s first crewed Moon mission in more than 50 years.
One of the most critical upgrades for Artemis II is the emergency egress system, an abort system for personnel to use in the unlikely event of an emergency at the launch pad. Located on the 274-foot level of the mobile launcher, four baskets will provide a rapid escape route from the mobile launcher to the base of the pad in case of emergency, using electromagnetic braking technology.
“That is a true feat of humanity: someone putting all of their passion into these systems to make it all come together at T-0.Jesse Berdis
Artemis II mobile launcher 1 deputy project manager
Berdis recently set his sights on the Artemis human landing system lander ground operations, to develop and maintain an integrated schedule. Under his leadership, the team ensures accuracy of combined schedules, risks, and insights, ensuring the ground operations and human lander development remain in sync.
About the AuthorLaura SasaninejadStrategic Communications Specialist Share Details Last Updated Feb 11, 2026 Related Terms Explore More 4 min read NASA Moon Mission Spacesuit Nears Milestone Article 4 days ago 4 min read Reaching Top Speed in the DolomitesCortina d’Ampezzo, flanked by steep-sided mountain peaks, is the site of several skiing and sliding…
Article 5 days ago 3 min read NASA Marks Milestone in Preparation for Artemis IV Testing Article 6 days ago Keep Exploring Discover More Topics From NASAMissions
Humans in Space
Climate Change
Solar System
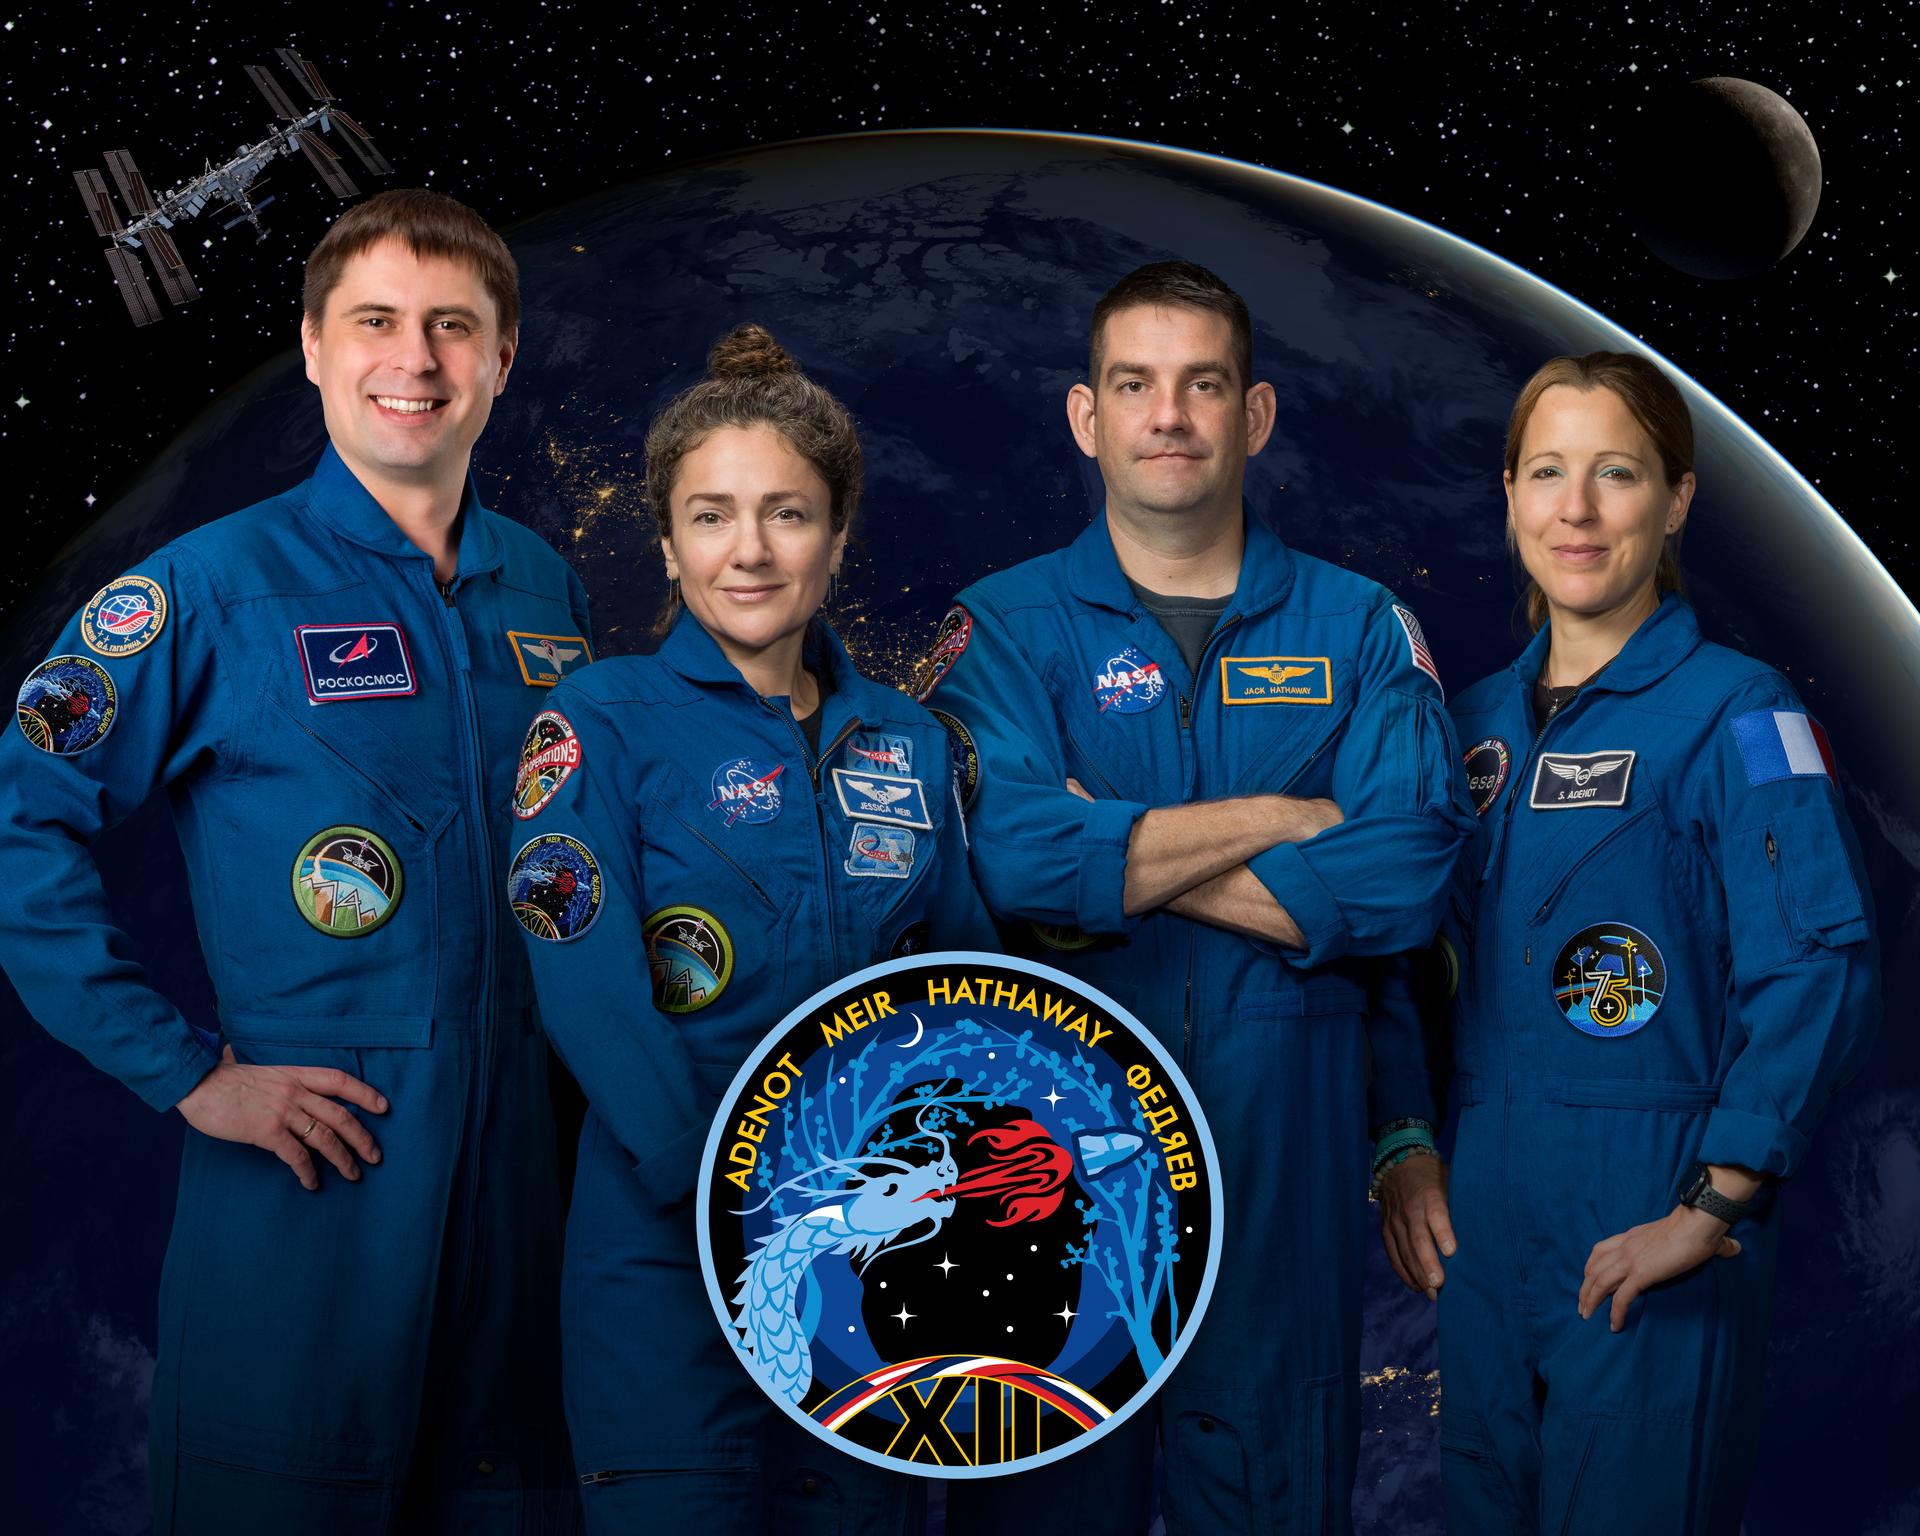
Crew-12 Members and Insignia
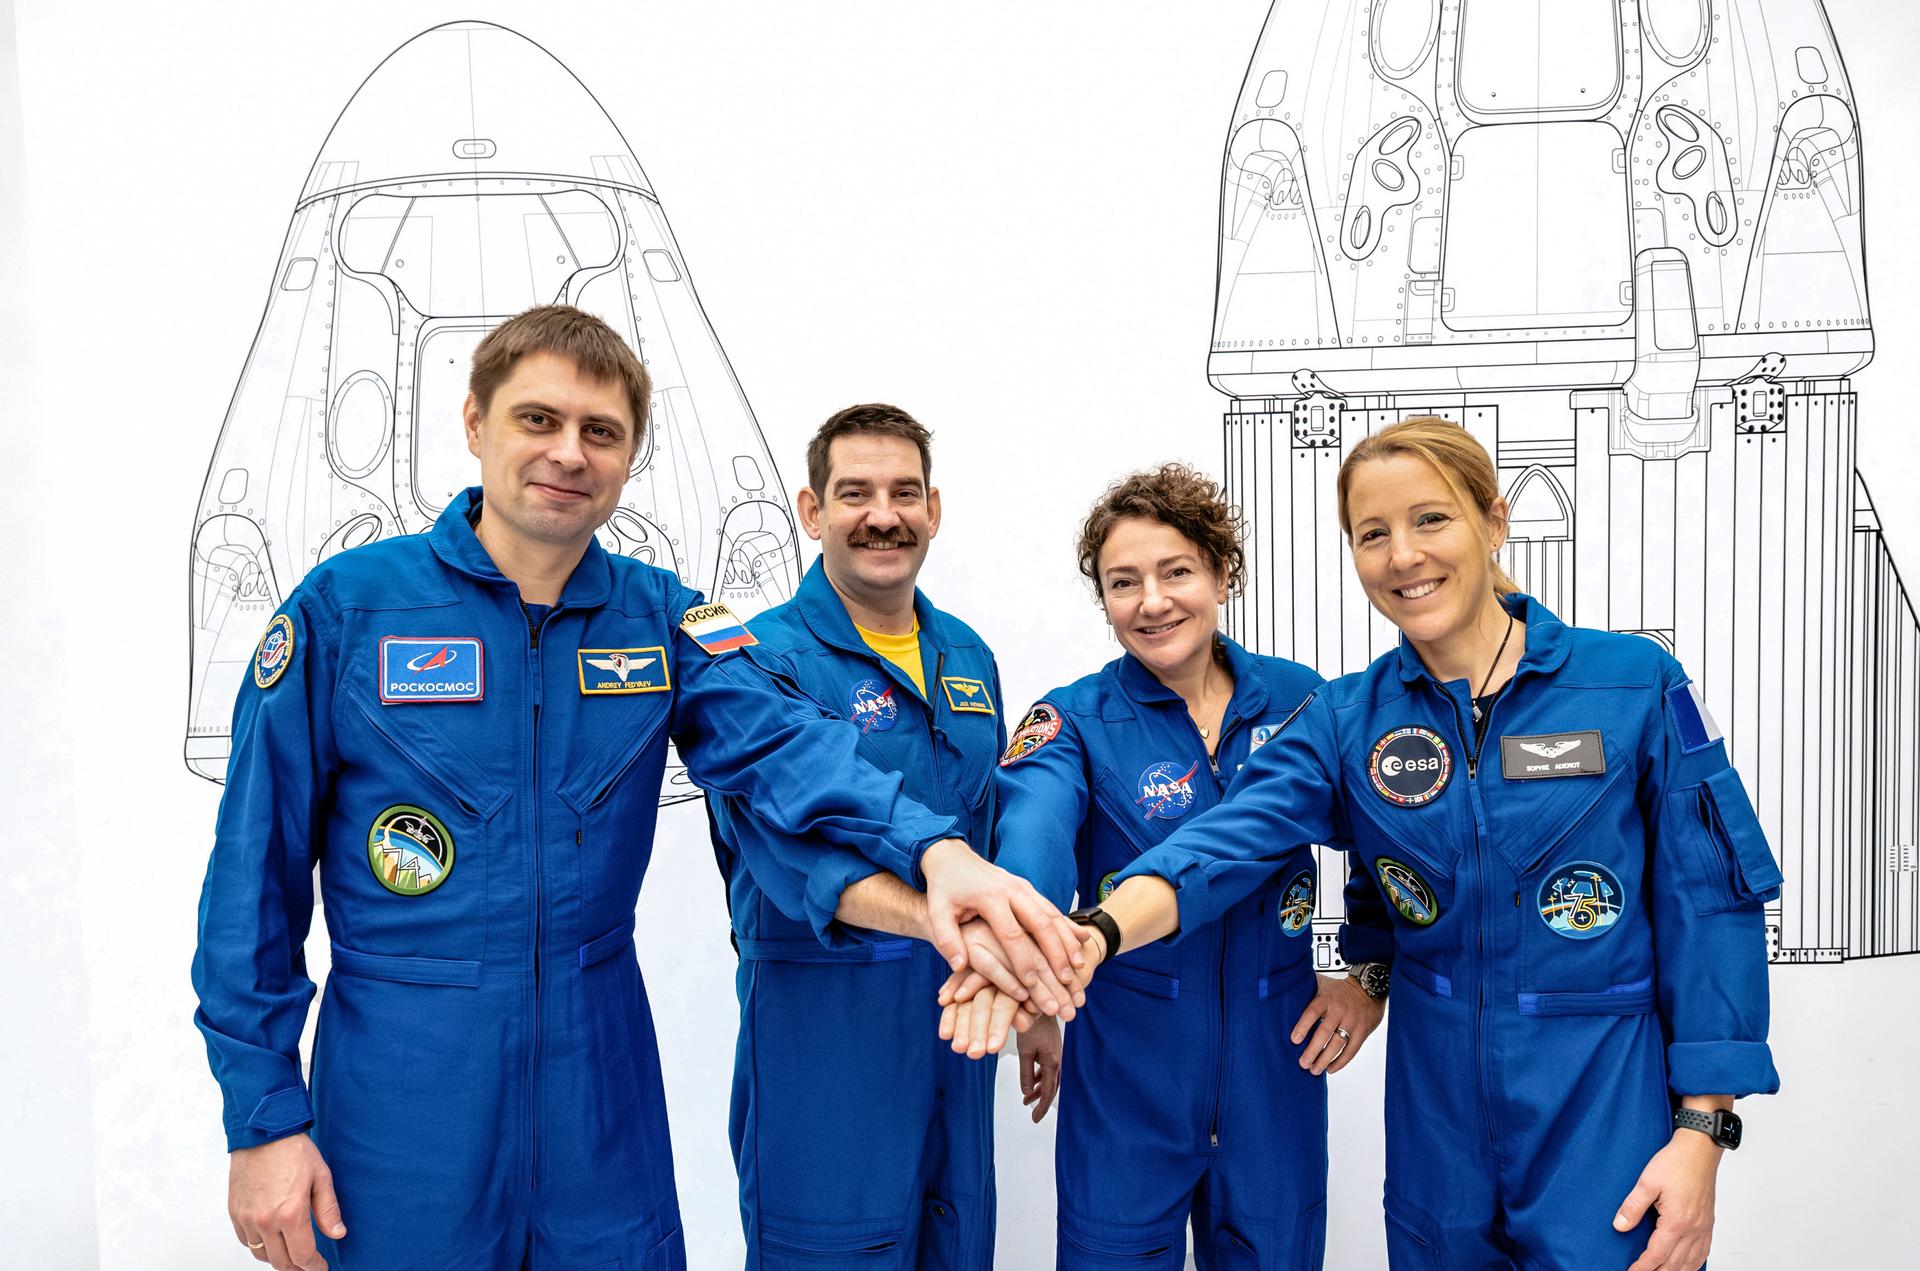
From left, Roscosmos cosmonaut Andrey Fedyaev, NASA astronauts Jack Hathaway and Jessica Meir, and ESA (European Space Agency) astronaut Sophie Adenot pose next to their mission insignia inside the Astronaut Crew Quarters in the Neil A. Armstrong Operations and Checkout Building at NASA’s Kennedy Space Center in Florida on Monday, Feb. 9, 2026. NASA’s SpaceX Crew-12 crew members will launch aboard a SpaceX Dragon spacecraft and Falcon 9 to the International Space Station no earlier than 5:15 a.m. EST on Friday, Feb. 13, from Cape Canaveral Space Force Station’s Space Launch Complex 40.
During their eight-month mission, Crew-12 will conduct a variety of science experiments to advance research and technology for future Moon and Mars missions and benefit humanity back on Earth. This research includes studies of pneumonia-causing bacteria to improve treatments, on-demand intravenous fluid generation for future space missions, automated plant health monitoring, investigations of plant and nitrogen-fixing microbe interactions to enhance food production in space, and research on how physical characteristics may affect blood flow during spaceflight.
Image credit: NASA/Kim Shiflett
NASA Marks Milestone in Preparation for Artemis IV Testing
3 min read
Preparations for Next Moonwalk Simulations Underway (and Underwater) NASA Stennis teams complete a water system activation milestone on Jan. 30 at the Thad Cochran Test Stand (B-2). The milestone tested new cooling systems added to the stand for the future Green Run test series of NASA’s exploration upper stage that is expected to fly on the Artemis IV mission.NASA/Danny NowlinWater flowing out. Data flowing in.
A water system activation at the Thad Cochran Test Stand (B-2) on Jan. 30 at NASA’s Stennis Space Center near Bay St. Louis, Mississippi, helped capture critical data to support testing a new SLS (Space Launch System) stage expected to fly on the Artemis IV mission.
The activation milestone tested new cooling systems that were added for the future Green Run test series of NASA’s exploration upper stage (EUS). The more powerful upper stage is a four-engine liquid hydrogen/liquid oxygen in-space stage for the evolved Block 1B version of SLS.
NASA Stennis teams complete a water system activation milestone on Jan. 30 at the Thad Cochran Test Stand (B-2). The milestone tested new cooling systems added to the stand for the future Green Run test series of NASA’s exploration upper stage that is expected to fly on the Artemis IV mission.NASA/Danny Nowlin NASA Stennis teams complete a water system activation milestone on Jan. 30 at the Thad Cochran Test Stand (B-2). The milestone tested new cooling systems added to the stand for the future Green Run test series of NASA’s exploration upper stage that is expected to fly on the Artemis IV mission.NASA/Danny Nowlin NASA Stennis teams complete a water system activation milestone on Jan. 30 at the Thad Cochran Test Stand (B-2). The milestone tested new cooling systems added to the stand for the future Green Run test series of NASA’s exploration upper stage that is expected to fly on the Artemis IV mission.NASA/Danny NowlinFor Green Run, teams at NASA Stennis will activate and test all systems to ensure the stage is ready to fly. It will culminate with a hot fire of the stage’s four RL10 engines, just as during an actual mission.
As part of the test stand modification, crews have added water-cooled diffusers to act as a heat shield to manage the super-hot exhaust from all four RL10 engines; water-cooled fairings to direct engine exhaust to align with the diffuser walls; and a purge ring that supplies cooling water and gaseous nitrogen to protect a flexible seal that allows the engines to move, or gimbal, during testing.
These three systems all were integrated by the NASA Stennis team with the existing flame deflector and acoustic suppression equipment used during previous core stage testing for NASA’s SLS rocket ahead of the successful Artemis I launch.
To view this video please enable JavaScript, and consider upgrading to a web browser that supports HTML5 video
NASA/StennisThe exercise also pushed the high pressure industrial water system to maximum capacity. While a typical RS-25 engine test at NASA Stennis runs a subset of the 10 diesel pumps and one electric pump, testing the exploration upper stage will require all eleven pumps running simultaneously.
The 14-million gallons of water used during the exercise on Jan. 30 was recycled throughout the test complex. A 66-million-gallon reservoir feeds water to the test stand through an underground 96-inch diameter pipe, with water distributed to various cooling components. The water ultimately flows into the flame deflector, then through a concrete flume to the stand’s catch pond. When the catch pond fills up, the excess water drains back to the canal through a drainage ditch, ready to be recycled for future use.
“We will use the data gathered to set the final timing of when valves are cycled, determine our redline pressures, and select the operating pressure,” said Nick Nugent, NASA Stennis project engineer. “This exercise also put the water system under a full load prior to the final stress test. It is always good to give the system a good shake down run prior.”
NASA Stennis teams complete a water system activation milestone on Jan. 30 at the Thad Cochran Test Stand (B-2). The milestone tested new cooling systems added to the stand for the future Green Run test series of NASA’s exploration upper stage that is expected to fly on the Artemis IV mission.NASA/Danny NowlinThe exploration upper stage is being built by Boeing at NASA’s Michoud Assembly Facility in New Orleans. The four RL10 engines for the upper stage are manufactured by L3Harris Technologies. Before it all arrives at NASA Stennis, crews will perform a final 24-hour check, or stress test, across all test complex facilities to demonstrate readiness for the test series.
Explore More 5 min read A Look Back at NASA Stennis in 2025 Article 2 months ago 2 min read NASA Makes Webby 30s List of Most Iconic, Influential on Internet Article 5 months ago 5 min read Crossroads to the Future – NASA Stennis Grows into a Model Federal City Article 5 months agoSummer Heat Hits Southeastern Australia
- Earth
- Earth Observatory
- Image of the Day
- EO Explorer
- Topics
- More Content
- About
Curiosity Blog, Sols 4798-4803: Back for More Science
- Curiosity Home
- Science
- News and Features
- Multimedia
- Mars Missions
- Mars Home
2 min read
Curiosity Blog, Sols 4798-4803: Back for More Science NASA’s Mars rover Curiosity acquired this image showing the side-by-side drill holes “Nevado Sajama” (right) and “Nevado Sajama2” (left). Curiosity used its Mast Camera (Mastcam) to capture the image on Jan. 31, 2026 — Sol 4795, or Martian day 4,795 of the Mars Science Laboratory mission — at 22:55:27 UTC.NASA/JPL-Caltech/MSSSWritten by Michelle Minitti, MAHLI Deputy Principal Investigator
Earth planning date: Friday, Feb. 6, 2026
The results from our first visit to the “Nevado Sajama” drill location were intriguing enough to motivate our return to do a deeper dive into the minerals and compounds locked in this rock with SAM (the Sample Analysis at Mars instrument suite). As explained in the last blog, that deeper dive involves using the second of two vials of a chemical reagent, tetramethylammonium hydroxide (TMAH), that helps makes molecules detectable to SAM that would otherwise be undetectable. This week was focused on completing the many carefully-coordinated steps to apply the TMAH reagent to the rock powder from a drill hole and then analyze the treated sample. As you can see in the image above, we know the drilling necessary to collect the sample was successful, as was delivery of the sample to SAM. We are awaiting word about the first part of the SAM analysis, and are running the second part in the weekend plan.
As you can imagine, running a mass spectrometer and chemistry experiment remotely on another planet takes a lot of energy, but throughout the week, the team took advantage of whatever spare power there was to include additional science observations. ChemCam planned two attempts at targeting the Nevado Sajama2 drill-hole interior, analyzed “Tiquipaya,” one of the family of rocks broken by the rover wheels that expose bright white material, and measured the chemistry of the atmosphere with a passive sky observation. They also planned an RMI mosaic of layers near the base of the “Mishe Mokwa” butte to our east. MAHLI and APXS paired up to image and analyze the ground-up tailings around the drill hole for the most direct measure of chemistry of what SAM analyzes. As Mastcam acquired a full 360-degree mosaic the first time we were at Nevado Sajama, they did not have many rock observations to plan. Instead, they turned their eyes toward the sky to measure the amount of dust in the atmosphere. Navcam made complementary measurements of atmospheric dust and planned movies and imaging surveys of clouds and dust devils. Ever watchful, RAD and REMS made their regular measurements of the Martian environment while DAN regularly monitored the Martian subsurface.
-
Want to read more posts from the Curiosity team?
-
Want to learn more about Curiosity’s science instruments?
Mars is the fourth planet from the Sun, and the seventh largest. It’s the only planet we know of inhabited…
All Mars ResourcesExplore this collection of Mars images, videos, resources, PDFs, and toolkits. Discover valuable content designed to inform, educate, and inspire,…
Rover BasicsEach robotic explorer sent to the Red Planet has its own unique capabilities driven by science. Many attributes of a…
Mars Exploration: Science GoalsThe key to understanding the past, present or future potential for life on Mars can be found in NASA’s four…
CubeSats’ Missions Begin
NASA astronaut Chris Williams pointed a camera out a window on the cupola as a set of CubeSats were deployed outside the Kibo laboratory module by a small satellite orbital deployer into Earth orbit. Students from Mexico, Italy, Thailand, Malaysia, and Japan designed the shoe-boxed satellites for a series of Earth observations and technology demonstrations.
CubeSats are a class of nanosatellites – small spacecraft weighing 1-10 kilograms – that use a standard size and form factor. The development of CubeSats has advanced into its own industry with government, industry and academia collaborating for ever increasing capabilities. CubeSats now provide a cost-effective platform for science investigations, new technology demonstrations and advanced mission concepts.
Image credit: NASA/Chris Williams
Grants
To submit a request, visit NASA General Information Request Form and complete the form. You will receive an automated email with the most commonly requested grant status information.
Important Instructions:
- Ensure you enter a valid email address, as replies will only be sent via email.
- The confirmation email may take a few minutes to arrive in your inbox.
How to Fill Out the Form:
- Category: Select “Procurement including Grants & Cooperative Agreements.”
- Procurement Area: Choose “Grants/Agreements.”
- Grants/Agreements Activity: Select “Grant Status.”
- Required Information: Provide either a Grant Number, Purchase Requisition Number, or both.
Guidance Regarding OMB Memorandum M-25-14 and Recent Temporary Restraining Orders
Update on Diversity, Equity, Inclusion, and Accessibility (DEIA) Executive Orders – January 29, 2025
On January 23, 2025, NASA’s Office of Procurement (OP) released a memorandum for the NASA contractor and grant community regarding Executive Order “Initial Rescission of Harmful Executive Orders and Actions” and the Office of Personnel Management’s (OPM) memorandum “Initial Guidance Regarding DEIA Executive Orders.”
Per OP’s memo, NASA grant and cooperative agreement recipients shall immediately cease and desist all DEIA activities required for their grant. This work may include but is not limited to: DEIA plan requirements, training, workshops, reporting, considerations for staffing, or any other direct or indirect grant activity related to DEIA. All grant recipients shall notify their cognizant Grant Officer if they identify requirements within their grants that are in violation of this guidance. Your Grant Officer’s contact information can be found on your NF 1687, Notice of Award for Grant and Cooperative Agreement (NOA).
Thank you for your work and partnership with NASA.
In FY2025, NASA separated the Terms and Conditions from the GCAM to create a standalone document. This document outlines both the general and specific terms and conditions and applies to all awards issued under 2 CFR 1800 (NASA’s adoption of 2 CFR 200.)
NASA Grant and Cooperative Agreement Terms and Conditions – January 2026
Administrative Supplement Requests Templates :
No Cost Extension (NCE) Request Form
Other Administrative Supplement Request Form
Principal Investigator (PI) Change Request Form
Period of Performance (POP) Change Form
Submit via email to NSSC-ADMIN-SUPPLEMENT REQUEST
PI Transfer Requests:
Submit via email to NSSC-Grants-PI-Transfer
NASA Insignia GuidelinesGrantees are strongly encouraged to use the NASA Insignia Format identified in the guidelines at NASA Insignia Guidelines for NASA Grantees. These guidelines aim to increase awareness of NASA’s mission activities via Grantee partnerships for a broader and more diverse population.
Payment Management SystemNASA uses a service provider, currently the Department of Health and Human Services (HHS) Payment Management System (PMS), to provide Federal funds to recipients. PMS will provide instructions to the recipients for registering and requesting funds through the system.
NASA is responsible for routine post-award monitoring on all awards, regardless of the award’s risk determination. At a minimum, routine monitoring includes reviewing award recipients’ annual performance reports, semi-annual Federal Financial Report (FFR), and Transactions Testing Review.
All NASA award recipients must submit annual performance reports. Annual reports are due to NASA 60 days prior to the annual anniversary of the award’s POP start date (e.g., if the POP of an award is October 1 – September 30, the report would be due 60 days prior to October 1.)
- Final Performance Reports: Submit via email to NSSC-CloseOut@mail.nasa.gov
- Performance Reports: Submit via email to NSSC-Grant-Report@mail.nasa.gov
Recipients will submit their semi-annual FFRs in PMS:
Period 1 (October 1 – March 31): Due by April 30 each year.
Period 2 (April 1 – September 30): Due by October 30 of each year.
Final FFRs are due 120 days after the end of the POP
Additional information and training are available on the Payment Management System website at https://pms.psc.gov/. The PMS help desk number is 1-877-614-5533.
FormsPost-Award Certifications and Representations
Current and Pending Support (CPS) Form
NASA Pre-Award and Post-Award Disclosure Requirements
- Title 2: Grants and Agreements
- 14 CFR 1274: Cooperative Agreements with Commercial Firms (Rescinded January 2021)
- 14 CFR 1275: Research Misconduct
NASA Grant and Cooperative Agreement Manual (GCAM): NASA’s Grant Manual for Proposers and Recipients
The NASA Grant and Cooperative Agreement Manual (GCAM) provides pre and post award policy guidance to NASA proposers and award-managing personnel and award recipients to implement government-wide and NASA-specific regulations for applying for, awarding and administering grants and cooperative agreements with educational and non-profit organizations; State, local, and Indian tribal governments; and for-profit organizations.
NASA Grant and Cooperative Agreement Terms and ConditionsIn FY2025, NASA separated the Terms and Conditions from the GCAM to create a standalone document. This document outlines both the general and specific terms and conditions and applies to all awards issued under 2 CFR 1800 (NASA’s adoption of 2 CFR 200.)
NASA implemented the Federal-wide research terms and conditions for all research and research-related grant and cooperative agreement awards issued under 2 CFR 1800 (NASA’s adoption of 2 CFR 200). The Research Terms and Conditions implement the requirements of the Uniform Guidance and includes three companion documents:
RTC Appendix A: Prior Approval Matrix, RTC Appendix B: Subaward Requirements, and RTC Appendix C: National Policy Requirements).
The Research Terms and Conditions and companion documents are accessible on the NSF website.
NASA Office of Inspector GeneralTo file a complaint regarding denial of equal opportunity or discrimination based on race, color, national origin, sex, disability, or age; go to
https://oig.nasa.gov/hotline.html
1-800-424-9183
300 E Street, S.W. Suite 8V39
Washington, DC 20546-0001
NASA OIG Hotline
http://missionstem.nasa.gov/filing-a-complaint.html
Grants.gov
NSSC Grants Payment Package
NASA Research Opportunities Online (NSPIRES)
System for Award Management (SAM)
NASA’s Hubble Captures Light Show Around Rapidly Dying Star
- Hubble Home
- Overview
- Impact & Benefits
- Science
- Observatory
- Team
- Multimedia
- News
- More
This stunning image from NASA’s Hubble Space Telescope reveals a dramatic interplay of light and shadow in the Egg Nebula, sculpted by freshly ejected stardust. Located approximately 1,000 light-years away in the constellation Cygnus, the Egg Nebula features a central star obscured by a dense cloud of dust — like a “yolk” nestled within a dark, opaque “egg white.” Only Hubble’s sharpness can unveil the intricate details that hint at the processes shaping this enigmatic structure.
It is the first, youngest, and closest pre-planetary nebula ever discovered. (A pre-planetary nebula is a precursor stage of a planetary nebula, which is a structure of gas and dust formed from the ejected layers of a dying, Sun-like star. The term is a misnomer, as planetary nebulae are not related to planets.)
NASA’s Hubble Space Telescope reveals the clearest view yet of the Egg Nebula. This structure of gas and dust was created by a dying, Sun-like star. These newest observations were taken with Hubble’s Wide Field Camera 3.NASA, ESA, Bruce Balick (UWashington)The Egg Nebula offers a rare opportunity to test theories of late-stage stellar evolution. At this early phase, the nebula shines by reflecting light from its central star, which escapes through a polar “eye” in the surrounding dust. This light emerges from a dusty disk expelled from the star’s surface just a few hundred years ago.
Twin beams from the dying star illuminate fast-moving polar lobes that pierce a slower, older series of concentric arcs. Their shapes and motions suggest gravitational interactions with one or more hidden companion stars, all buried deep within the thick disk of stardust.
Stars like our Sun shed their outer layers as they exhaust their hydrogen and helium fuel. The exposed core becomes so hot that it ionizes surrounding gas, creating the glowing shells seen in planetary nebulae such as the Helix, Stingray, and Butterfly nebulae. However, the compact Egg Nebula is still in a brief transitional phase — known as the pre-planetary stage — that lasts only a few thousand years. This makes it an ideal time to study the ejection process while the forensic evidence remains fresh.
The symmetrical patterns captured by Hubble are too orderly to result from a violent explosion like a supernova. Instead, the arcs, lobes, and central dust cloud likely stem from a coordinated series of poorly understood sputtering events in the carbon-enriched core of the dying star. Aged stars like these forged and released the dust that eventually seeded future star systems, such as our own solar system, which coalesced into Earth and other rocky planets 4.5 billion years ago.
Hubble has turned its gaze towards the Egg Nebula before. A first visible-light image from the telescope’s WFPC2 (Wide Field and Planetary Camera 2) was complemented in 1997 by a near-infrared NICMOS (Near Infrared Camera and Multi-Object Spectrometer) image, giving a closer look at the light given off by the nebula. In 2003, Hubble’s ACS (Advanced Camera for Surveys) yielded a new view of the Egg, showing the full extent of the ripples of dust around it. A further image from WFC3 (Wide Field Camera 3) in 2012 zoomed in on the central dust cloud and dramatic gas outflows. This new image combines the data used to create the 2012 image with additional observations from the same program to deliver the clearest look yet at this intricate cosmic egg.
The Hubble Space Telescope has been operating for over three decades and continues to make ground-breaking discoveries that shape our fundamental understanding of the universe. Hubble is a project of international cooperation between NASA and ESA (European Space Agency). NASA’s Goddard Space Flight Center in Greenbelt, Maryland, manages the telescope and mission operations. Lockheed Martin Space, based in Denver, also supports mission operations at Goddard. The Space Telescope Science Institute in Baltimore, which is operated by the Association of Universities for Research in Astronomy, conducts Hubble science operations for NASA.
Facebook logo @NASAHubble @NASAHubble Instagram logo @NASAHubble Related Images & Videos Egg NebulaNASA’s Hubble Space Telescope reveals the clearest view yet of the Egg Nebula. This structure of gas and dust was created by a dying, Sun-like star. These newest observations were taken with Hubble’s Wide Field Camera 3.
Egg Nebula CompassThis image of the Egg Nebula was captured by the Hubble Space Telescope’s WFC3 (Wide Field Camera 3). The image shows a scale bar, compass arrows, and color key for reference.
Exploring the Structure of the Egg NebulaThis visualization examines the Hubble Space Telescope image of the Egg Nebula and showcases the shape and development of its three-dimensional components. The dying star has repeatedly ejected thin shells of gas and dust over the last 5,000 years. During the last 400 years, bipo…
Explore More Hubble’s NebulaeThese ethereal veils of gas and dust tell the story of star birth and death.
The Death Throes of StarsWhen stars die, they throw off their outer layers, creating the clouds that birth new stars.
Hubble’s Field Guide to Nebulae (YouTube video)This Hubble guide provides an overview of some of the most resplendent objects in the universe.
Share Details Last Updated Feb 10, 2026 EditorAndrea GianopoulosLocationNASA Goddard Space Flight Center Contact MediaClaire Andreoli
NASA’s Goddard Space Flight Center
Greenbelt, Maryland
claire.andreoli@nasa.gov
Ann Jenkins, Christine Pulliam
Space Telescope Science Institute
Baltimore, Maryland
Since its 1990 launch, the Hubble Space Telescope has changed our fundamental understanding of the universe.
Hubble Science Highlights
Hubble Images
Hubble News
Core Survey by NASA’s Roman Mission Will Unveil Universe’s Dark Side
The broadest planned survey by NASA’s upcoming Nancy Grace Roman Space Telescope will reveal hundreds of millions of galaxies scattered across the cosmos. After Roman launches as soon as this fall, scientists will use these sparkly beacons to study the universe’s shadowy underpinnings: dark matter and dark energy.
“We set out to build the ultimate wide-area infrared survey, and I think we accomplished that,” said Ryan Hickox, a professor at Dartmouth College in Hanover, New Hampshire, and co-chair of the committee that shaped the survey’s design. “We’ll use Roman’s enormous, deep 3D images to explore the fundamental nature of the universe, including its dark side.”
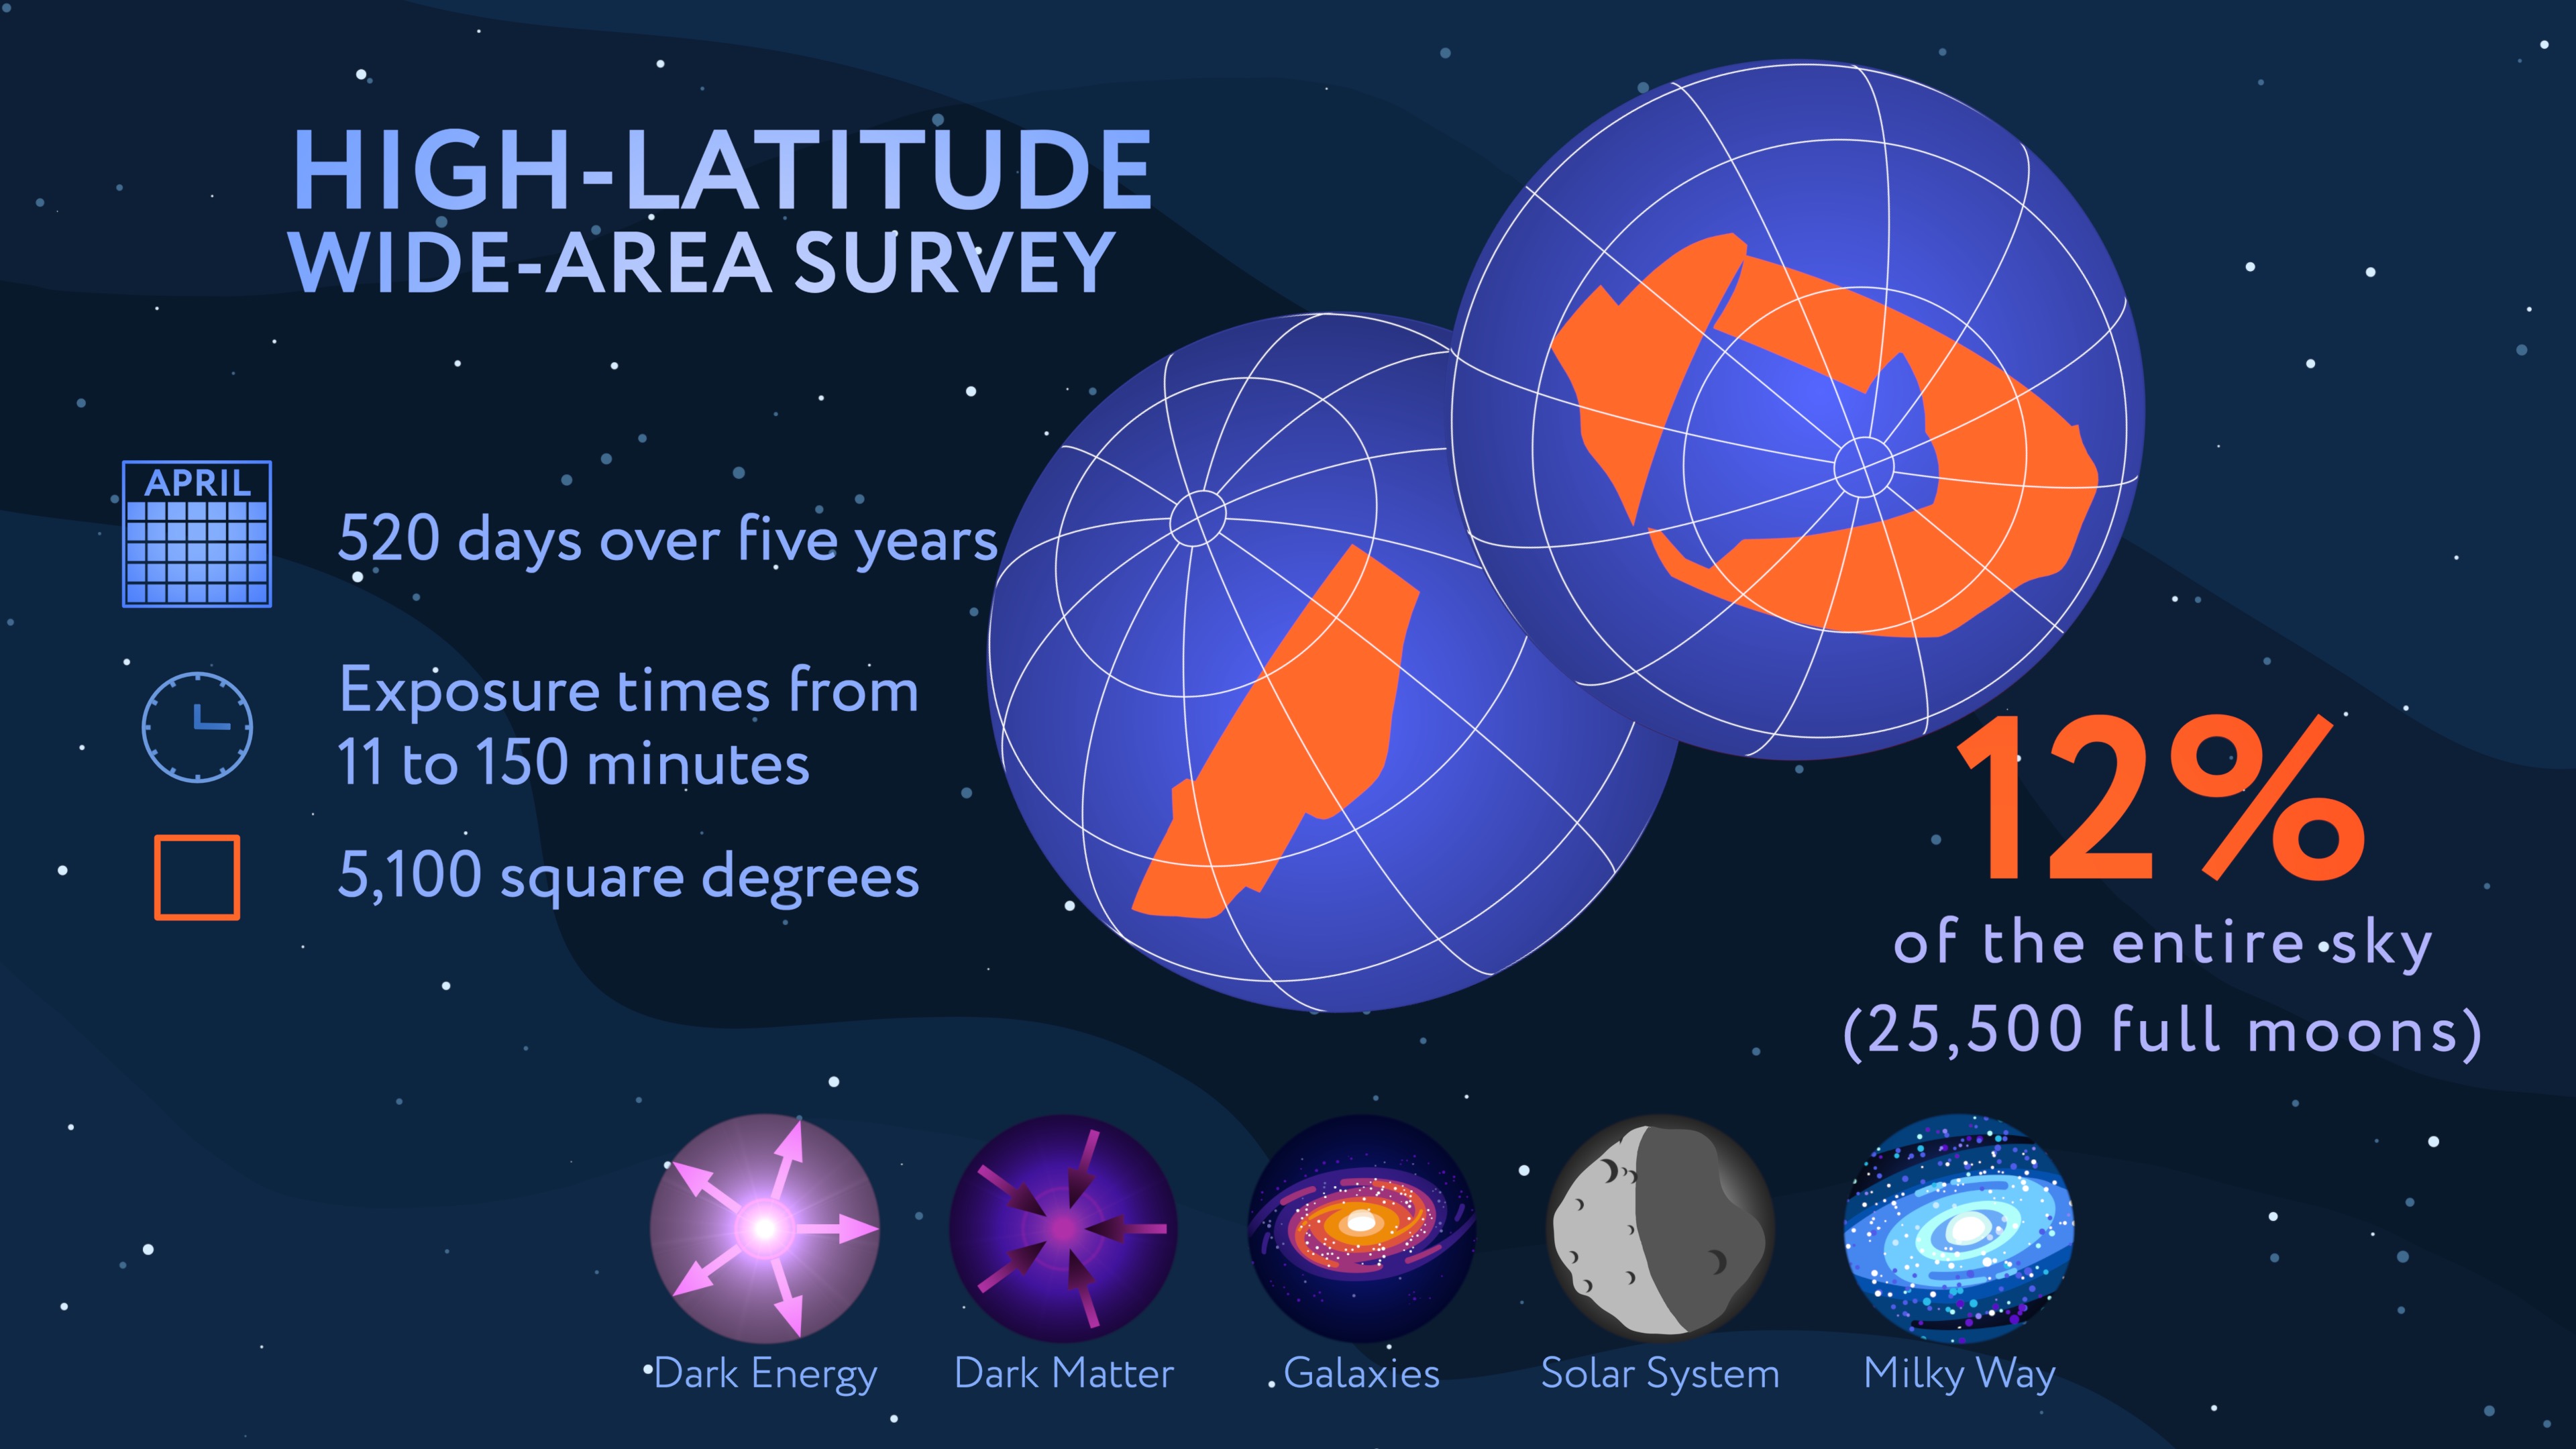
This infographic describes the High-Latitude Wide-Area Survey that will be conducted by NASA’s Nancy Grace Roman Space Telescope. This observation program will cover more than 5,000 square degrees (about 12 percent of the sky) in just under a year and a half. Scientists will use the survey to analyze hundreds of millions of galaxies scattered across the cosmos that reveal clues about the universe’s shadowy underpinnings — dark matter and dark energy — as well as a wealth of other science topics. NASA’s Goddard Space Flight CenterRoman’s High-Latitude Wide-Area Survey is one of the mission’s three core observation programs. It will cover more than 5,000 square degrees (about 12 percent of the sky) in just under a year and a half. Roman will look far from the dusty plane of our Milky Way galaxy (that’s what the “high-latitude” part of the survey name means), looking up and out of the galaxy rather than through it to get the clearest view of the distant cosmos.
“This survey is going to be a spectacular map of the cosmos, the first time we have Hubble-quality imaging over a large area of the sky,” said David Weinberg, an astronomy professor at Ohio State University in Columbus, who played a major role in devising the survey. “Even a single pointing with Roman needs a whole wall of 4K televisions to display at full resolution. Displaying the whole high-latitude survey at once would take half a million 4K TVs, enough to cover 200 football fields or the cliff face of El Capitan.”
The survey will combine the powers of imaging and spectroscopy to unveil a goldmine of galaxies strewn across cosmic time. Astronomers will use the survey’s data to explore invisible dark matter, detectable only via its gravitational effects on other objects, and the nature of dark energy — a pressure that seems to be speeding up the universe’s expansion.
“Cosmic acceleration is the biggest mystery in cosmology and maybe in all of physics,” Weinberg said. “Somehow, when we get to scales of billions of light years, gravity pushes rather than pulls. The Roman wide area survey will provide critical new clues to help us solve this mystery, because it allows us to measure the history of cosmic structure and the early expansion rate much more accurately than we can today.”
Weighing shadows
Anything that has mass warps space-time, the underlying fabric of the universe. Extremely massive things like clusters of galaxies warp space-time so much that they distort the appearance of background objects — a phenomenon called gravitational lensing.
“It’s like looking through a cosmic funhouse mirror,” Hickox said. “It can smear or duplicate distant galaxies, or if the alignment is just right, it can magnify them like a natural telescope.”
This simulation shows the type of science astronomers will be able to do with future observations from NASA’s Nancy Grace Roman Space Telescope. The sequence demonstrates how the gravity of intervening galaxy clusters and dark matter can distort the light from farther objects, warping their appearance. More intervening material creates stronger distortions. By analyzing these features, astronomers can study elusive dark matter, which can only be measured indirectly through its gravitational effects on visible matter. As a bonus, the distortion acts like a telescope, enabling observations of extremely distant galaxies. Simulations like this one help astronomers understand what Roman’s future observations could tell us about the universe, and provide useful data to validate data analysis techniques.Caltech/IPAC/R. HurtRoman’s view will be large and sharp enough to study this lensing effect on a small scale to see how clumps of dark matter warp the appearance of distant galaxies. Astronomers will create a detailed map of the large-scale distribution of matter — both seen and unseen — throughout the universe and fill in more of the gaps in our understanding of dark matter. Studying how structures grow over time will also help astronomers explore dark energy’s strength at various cosmic stages.
“The data analysis standards required to measure weak gravitational lensing are such that the astronomy community as a whole will benefit from very high-quality data over the full survey area, which will undoubtedly lead to unexpected discoveries,” said Olivier Doré, a senior research scientist at NASA’s Jet Propulsion Laboratory in Southern California, who leads a team focused on Roman imaging cosmology with the High-Latitude Wide-Area Survey. “This survey will accomplish much more than just revealing dark energy!”
While NASA’s Hubble and James Webb space telescopes both also study gravitational lensing, the breakthrough with Roman is its large field of view.
“Weak lensing distorts galaxy shapes too subtly to see in any single galaxy — it’s invisible until you do a statistical analysis,” Hickox said. “Roman will see more than a billion galaxies in this survey, and we estimate about 600 million of them will be detailed enough for Roman to study these effects. So Roman will trace the growth of structure in the universe in 3D from shortly after the big bang to today, mapping dark matter more precisely than we’ve ever done before.”
Sounding out dark energy
Roman’s wide-area survey will also gather spectra from around 20 million galaxies. Analyzing spectra helps show how the universe expanded during different cosmic eras because when an object recedes, all of the light waves we receive from it are stretched out and shifted toward redder wavelengths — a phenomenon called redshift.
By determining how quickly galaxies are receding from us, carried by the relentless expansion of space, astronomers can find out how far away they are — the more a galaxy’s spectrum is redshifted, the farther away it is. Astronomers will use this phenomenon to make a 3D map of all the galaxies measured within the survey area out to about 11.5 billion light-years away.
That will reveal frozen echoes of ancient sound waves that once rippled through the primordial cosmic sea. For most of the universe’s first half-million years, the cosmos was a dense, almost uniform sea of plasma (charged particles).
Rare, tiny clumps attracted more matter toward themselves gravitationally. But it was too hot for the material to stick together, so it rebounded. This push and pull created waves of pressure—sound — that propagated through the plasma.
This animation illustrates how small particles (in this case, sand) behave when exposed to different sound frequencies. In the very early universe, a cosmic “hum” created ripples in the primordial soup that filled space. Since the ripples were places where more matter was collected, like the rings of sand shown here, slightly more galaxies formed along them than elsewhere. As the universe expanded over billions of years, so did these structures. By comparing their size during different cosmic epochs, astronomers can trace the universe’s expansion.Nigel Stanford (used with permission)Over time, the universe cooled and the waves ceased, essentially freezing the ripples (called baryon acoustic oscillations) in place. Since the ripples were places where more matter was collected, slightly more galaxies formed along them than elsewhere. As the universe expanded over billions of years, so did these structures.
These rings act like a ruler for the universe. Today, they are about 500 million light-years wide. Roman will precisely measure their size across cosmic time, revealing how dark energy may have evolved.
Recent results from other telescopes hint that dark energy may be shifting in strength over cosmic time. “Roman will be able to make high precision tests that should tell us whether these hints are real deviations from our current standard model or not,” said Risa Wechsler, director of Stanford University’s KIPAC (Kavli Institute for Particle Astrophysics and Cosmology) in California and co-chair of the committee that shaped the survey’s design. “Roman’s imaging survey combined with its redshift survey give us new information about the evolution of the universe — both how it expands and how structures grow with time — that will help us understand what dark energy and gravity are doing at unprecedented precision.”
Altogether, Roman will help us understand the effects of dark energy 10 times more precisely than current measurements, helping discern between the leading theories that attempt to explain why the expansion of the universe is speeding up.
Because of the way Roman will survey the universe, it will reveal everything from small, rocky objects in our outer solar system and individual stars in nearby galaxies to galaxy mergers and black holes at the cosmic frontier over 13 billion years ago.
“Roman is exciting because it covers such a wide area with the image quality only available in space,” Wechsler said. “This enables a broad range of science, from things we can anticipate studying to discoveries that we haven’t thought of yet.”
The Nancy Grace Roman Space Telescope is managed at NASA’s Goddard Space Flight Center in Greenbelt, Maryland, with participation by NASA’s Jet Propulsion Laboratory in Southern California; Caltech/IPAC in Pasadena, California; the Space Telescope Science Institute in Baltimore; and a science team comprising scientists from various research institutions. The primary industrial partners are BAE Systems Inc. in Boulder, Colorado; L3Harris Technologies in Rochester, New York; and Teledyne Scientific & Imaging in Thousand Oaks, California.
By Ashley Balzer
NASA’s Goddard Space Flight Center, Greenbelt, Md.
Media contact:
Claire Andreoli
NASA’s Goddard Space Flight Center, Greenbelt, Md.
301-286-1940
Winter Grips Japan
- Earth
- Earth Observatory
- Image of the Day
- EO Explorer
- Topics
- More Content
- About
What You Need to Know About NASA’s SpaceX Crew-12 Mission
Four crew members are set to launch to the International Space Station as part of NASA’s SpaceX Crew-12 mission, where they will conduct research, technology demonstrations, and maintenance aboard the orbiting laboratory.
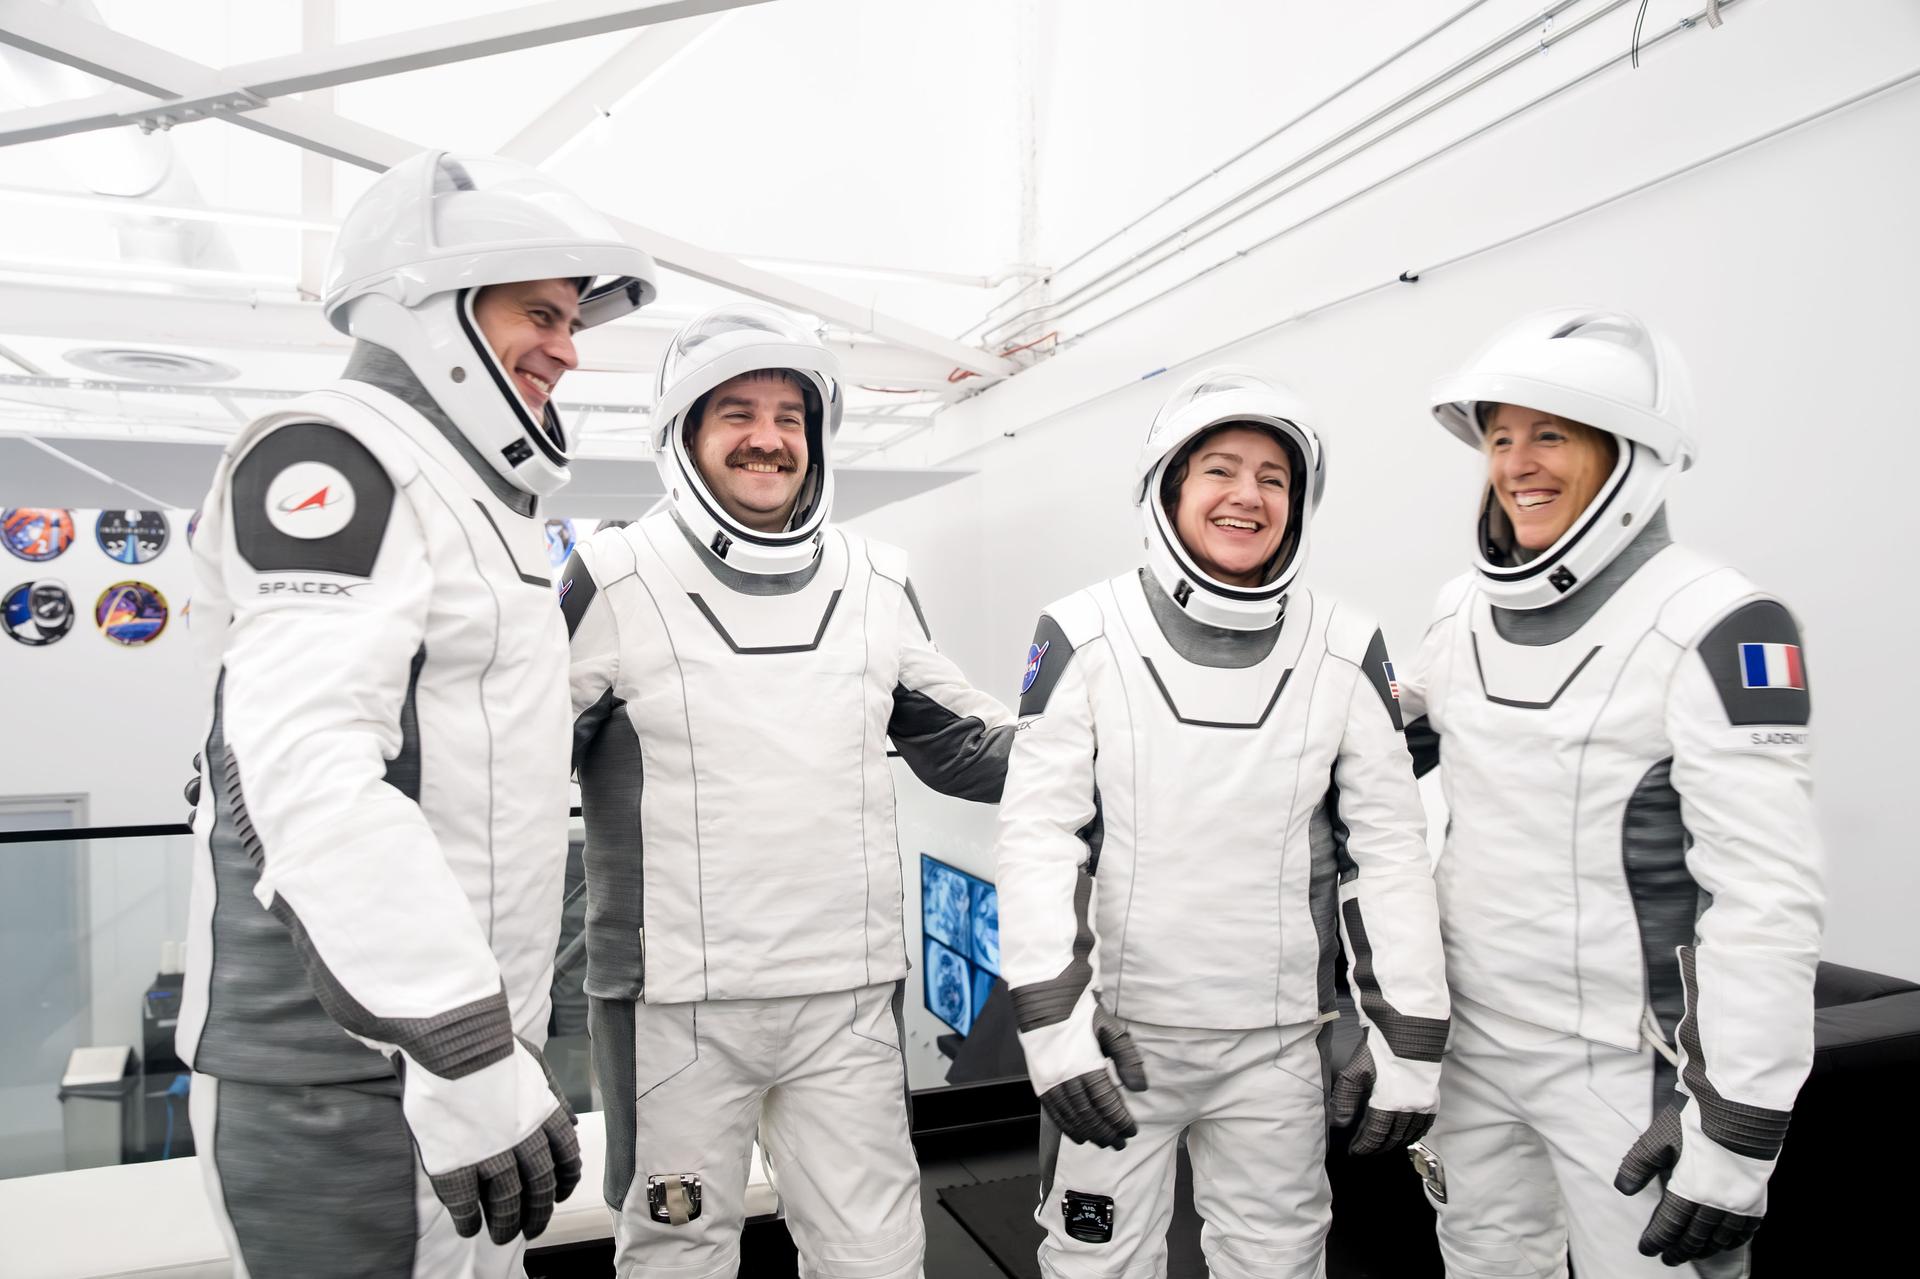
The crew will lift off from Space Launch Complex 40 at Cape Canaveral Space Force Station in Florida aboard a SpaceX Dragon spacecraft named Freedom. The spacecraft previously flew NASA’s SpaceX Crew-4 and Crew-9 missions, as well as private astronaut missions Axiom Mission 2 and 3.
NASA astronauts Jessica Meir and Jack Hathaway will serve as spacecraft commander and pilot, respectively. They will be joined by ESA (European Space Agency) astronaut Sophie Adenot and Roscosmos cosmonaut Andrey Fedyaev, who will serve as mission specialists. Crew-12 will join Expedition 74 crew members already aboard the space station.
During their eight-month mission, Crew-12 will conduct a variety of science experiments to advance research and technology for future Moon and Mars missions and benefit humanity back on Earth. This research includes studies of pneumonia-causing bacteria to improve treatments, on-demand intravenous fluid generation for future space missions, automated plant health monitoring, investigations of plant and nitrogen-fixing microbe interactions to enhance food production in space, and research on how physical characteristics may affect blood flow during spaceflight.
Meanwhile, support teams are progressing through Dragon preflight milestones for Crew-12, they also are preparing a SpaceX Falcon 9 rocket booster for its second flight. After system checkouts are complete and all components are certified, teams will mate Dragon to Falcon 9 in SpaceX’s hangar at the launch site. The integrated spacecraft and rocket then will roll to the pad for a dry dress rehearsal with the crew and an integrated static fire test before launch.
This flight is the 12th crew rotation mission with SpaceX to the space station as part of NASA’s Commercial Crew Program.
Meet Crew-12 jsc2026e004033 (Jan. 21, 2026) — The four members of NASA’s SpaceX Crew-12 mission to the International Space Station pose together for a crew portrait in their pressure suits at SpaceX headquarters in Hawthorne, California. From left are, Roscosmos cosmonaut and Mission Specialist Andrey Fedyaev, NASA astronauts Jack Hathaway and Jessica Meir, Pilot and Commander respectively, and ESA (European Space Agency) astronaut and Mission Specialist Sophie Adenot.SpaceXThis will be the second flight to the space station for Meir, who was selected as a NASA astronaut in 2013. The Caribou, Maine, native earned a bachelor’s degree in biology from Brown University, a master’s degree in space studies from the International Space University, and a doctorate in marine biology from Scripps Institution of Oceanography in San Diego. On her first spaceflight, Meir spent 205 days as a flight engineer during Expedition 61/62, and she completed the first three all-woman spacewalks with fellow NASA astronaut Christina Koch, totaling 21 hours and 44 minutes outside of the station. Since then, she has served in various roles, including assistant to the chief astronaut for commercial crew (SpaceX), deputy for the Flight Integration Division, and assistant to the chief astronaut for the human landing system. Follow @Astro_Jessica on X and Instagram.
A commander in the United States Navy, Hathaway was selected as part of the 2021 astronaut candidate class. This will be Hathaway’s first spaceflight. The South Windsor, Connecticut, native holds a bachelor’s degree in physics and history from the U.S. Naval Academy and master’s degrees in flight dynamics from Cranfield University and national security and strategic studies from the U.S. Naval War College. Hathaway also is a graduate of the Empire Test Pilot’s School, Fixed Wing Class 70 in 2011. At the time of his selection, Hathaway was deployed aboard the USS Truman, serving as Strike Fighter Squadron 81’s prospective executive officer. He has accumulated more than 2,500 flight hours in 30 different aircraft, including more than 500 carrier arrested landings and 39 combat missions. Follow @astro_hathaway on X and Instagram.
The Crew-12 mission will be Adenot’s first spaceflight. Before her selection as an ESA astronaut in 2022, Adenot earned a degree in engineering from ISAE-SUPAERO in Toulouse, France, specializing in spacecraft and aircraft flight dynamics. She also earned a master’s degree in human factors engineering at Massachusetts Institute of Technology in Cambridge. After earning her master’s degree, she became a helicopter cockpit design engineer at Airbus Helicopters and later served as a search and rescue pilot at Cazaux Air Base from 2008 to 2012. She then joined the High Authority Transport Squadron in Villacoublay, France, and served as a formation flight leader and mission captain from 2012 to 2017. Between 2019 and 2022, Adenot worked as a helicopter experimental test pilot in Cazaux Flight Test Center with DGA (Direction Générale de l’Armement – the French Defence Procurement Agency). She has logged more than 3,000 hours flying 22 different helicopters. Follow @Soph_astro on X and Instagram.
This will be Fedyaev’s second long-duration stay aboard the orbiting laboratory. He graduated from the Krasnodar Military Aviation Institute in 2004, specializing in aircraft operations and air traffic organization, and earned qualifications as a pilot engineer. Prior to his selection as a cosmonaut, he served as deputy commander of an Ilyushin-38 aircraft unit in the Kamchatka Region, logging more than 600 flight hours and achieving the rank of second-class military pilot. Fedyaev was selected for the Gagarin Research and Test Cosmonaut Training Center Cosmonaut Corps in 2012 and has served as a test cosmonaut since 2014. In 2023, he flew to the space station as a mission specialist during NASA’s SpaceX Crew-6 mission, spending 186 days in orbit as an Expedition 69 flight engineer. For his achievements, Fedyaev was awarded the title Hero of the Russian Federation and received the Yuri Gagarin Medal.
Following liftoff, Falcon 9 will accelerate Dragon to approximately 17,500 mph. Once in orbit, the crew, along with NASA and SpaceX mission control, will monitor a series of maneuvers to guide Dragon to the space-facing port of the station’s Harmony module. The spacecraft is designed to dock autonomously, but the crew can pilot it manually if necessary.
After docking, Crew-12 will be welcomed aboard the station by the three-member Expedition 74 crew, including NASA astronaut Chris Williams and Roscosmos cosmonauts Sergey Kud-Sverchkov and Sergei Mikaev.
While aboard the space station, Crew-12 will welcome a Soyuz spacecraft in July carrying three new crew members: NASA astronaut Anil Menon and Roscosmos cosmonauts Pyotr Dubrov and Anna Kikina. They also will bid farewell to the Soyuz carrying Williams, Kud-Sverchkov, and Mikaev. The crew also is expected to see the arrival of Dragon, Roscosmos Progress, and Northrop Grumman’s Cygnus XL spacecraft for station resupply.
For more than 25 years, people have lived and worked continuously aboard the International Space Station, advancing scientific knowledge and making research breakthroughs that are not possible on Earth. The station is a critical testbed for NASA to understand and overcome the challenges of long-duration spaceflight and to expand commercial opportunities in low Earth orbit. As commercial companies concentrate on providing human space transportation services and destinations as part of a robust low Earth orbit economy, NASA is focusing its resources on deep space missions to the Moon as part of the Artemis campaign in preparation for future human missions to Mars.
Learn more about the space station, its research, and crew, at: